Figure S6: GP loadings recover protein-gated populations across GPs
Ziang Zhang
Last updated: 2026-07-02
Checks: 5 1
Knit directory:
immgenT-GP-analysis/analysis/
This reproducible R Markdown analysis was created with workflowr (version 1.7.2). The Checks tab describes the reproducibility checks that were applied when the results were created. The Past versions tab lists the development history.
Great job! The global environment was empty. Objects defined in the global environment can affect the analysis in your R Markdown file in unknown ways. For reproduciblity it’s best to always run the code in an empty environment.
The command set.seed(1) was run prior to running the
code in the R Markdown file. Setting a seed ensures that any results
that rely on randomness, e.g. subsampling or permutations, are
reproducible.
Great job! Recording the operating system, R version, and package versions is critical for reproducibility.
Nice! There were no cached chunks for this analysis, so you can be confident that you successfully produced the results during this run.
Great job! Using relative paths to the files within your workflowr project makes it easier to run your code on other machines.
Tracking code development and connecting the code version to the
results is critical for reproducibility. To start using Git, open the
Terminal and type git init in your project directory.
This project is not being versioned with Git. To obtain the full
reproducibility benefits of using workflowr, please see
?wflow_start.
Both pages are produced by script-refactor/FigureS6.R,
which shares its CITE-seq setup and gating logic with Figure 6c-f via
code-refactor/R/citeseq_shared_setup.R and
code-refactor/R/gated_protein_helpers.R. The code below is
shown for reference (not re-executed on this page, since this script
takes roughly a minute and a half to render ~25 GPs x 2 embeddings
each); the images are its pre-rendered output.
Setup
# Figure S6. GP loadings recover protein-gated populations across GPs.
#
# Extension of Figure 6c-f to all well-aligned GPs (see
# figures/final-selected/bits/Figure S6/FigureS6_caption.md), shown as two
# gallery pages (s6-1 and s6-2). For each GP, cells are shown twice on the
# same MDE embedding: left, cells passing the GP's curated protein gate;
# right, an equally sized set of cells with the highest GP loading.
#
# Source: ported from script/gated_protein_loading_plot.R's live gallery
# section (the ~450 preceding lines of commented-out single-GP exploratory
# calls are dropped -- they never produced a saved output).

library(ggplot2)
library(dplyr)
library(patchwork)
library(Matrix)

data_path <- "data/"
figure_path <- "figure-refactor/Figure S6/"
source("code-refactor/R/gated_protein_helpers.R")
source("code-refactor/R/citeseq_shared_setup.R")
Gallery pages
# GPs shown in main Figure 6 (panels 6c-6f) are excluded from this gallery.
GPs_fig6 <- c("GP171", "GP23", "GP12", "GP80")
other_GPs <- setdiff(well_aligned_gps, GPs_fig6)

# A few GPs get slightly larger highlighted points for visibility even at
# high cell counts.
enlarge_gps <- c("GP8", "GP30", "GP170", "GP107")

plots_all <- lapply(other_GPs, function(gp) {
  k_name <- paste0("K", sub("^GP", "", gp))
  plot_gated_gp_vs_protein(
    gp_name = k_name,
    df_markers = df_markers2,
    protein_mat = protein_mat_normalized_lognorm,
    loading_mat = L_pm_for_gating,
    mde_emb = mde_result,
    missing_threshold_action = "skip",
    threshold_df = threshold_results_subset_manual,
    exclude_cells = c(thymocyte_cells, proliferating_cells, miniverse_cells),
    selected_proteins = select_proteins,
    loading_q = NULL,
    min_pointsize = if (gp %in% enlarge_gps) 3L else 0L
  )
})

v_bar <- ggplot() + theme_void() + theme(plot.background = element_rect(fill = "grey60", color = NA))

# Sorted gallery: GPs in numerical order, one PDF per page (2 pages here),
# 2 GP-units per row x 6 rows = 12 GPs per page; panels labeled a, b, c...
sort_idx <- order(as.integer(sub("^GP", "", other_GPs)))
plots_sorted <- plots_all[sort_idx]

n_pages_sorted <- ceiling(length(plots_sorted) / 12)
for (page_idx in seq_len(n_pages_sorted)) {
  idx_start <- (page_idx - 1) * 12 + 1
  idx_end <- min(page_idx * 12, length(plots_sorted))
  page_plots <- plots_sorted[idx_start:idx_end]
  n_on_page <- length(page_plots)

  labeled_page_plots <- lapply(seq_len(n_on_page), function(i) {
    unit <- page_plots[[i]]
    p1_labeled <- unit[[1]] + labs(tag = letters[i]) + theme(plot.tag = element_text(size = 14, face = "bold"))
    p1_labeled + unit[[2]] + plot_layout(ncol = 2)
  })

  rows_list <- lapply(1:6, function(r) {
    i_left <- (r - 1) * 2 + 1
    i_right <- (r - 1) * 2 + 2
    gp_left <- if (i_left <= n_on_page) labeled_page_plots[[i_left]] else plot_spacer()
    gp_right <- if (i_right <= n_on_page) labeled_page_plots[[i_right]] else plot_spacer()
    (gp_left | v_bar | gp_right) + plot_layout(widths = c(1, 0.03, 1))
  })
  combined <- wrap_plots(rows_list, ncol = 1)

  # cairo_pdf() does not reliably truncate/overwrite an existing file of a
  # different size in place -- remove any stale output first.
  out_page <- paste0(figure_path, sprintf("s6-%d.pdf", page_idx))
  if (file.exists(out_page)) unlink(out_page)

  graphics.off()
  cairo_pdf(out_page, width = 13, height = 18)
  showtext::showtext_begin()
  print(combined)
  showtext::showtext_end()
  dev.off()
}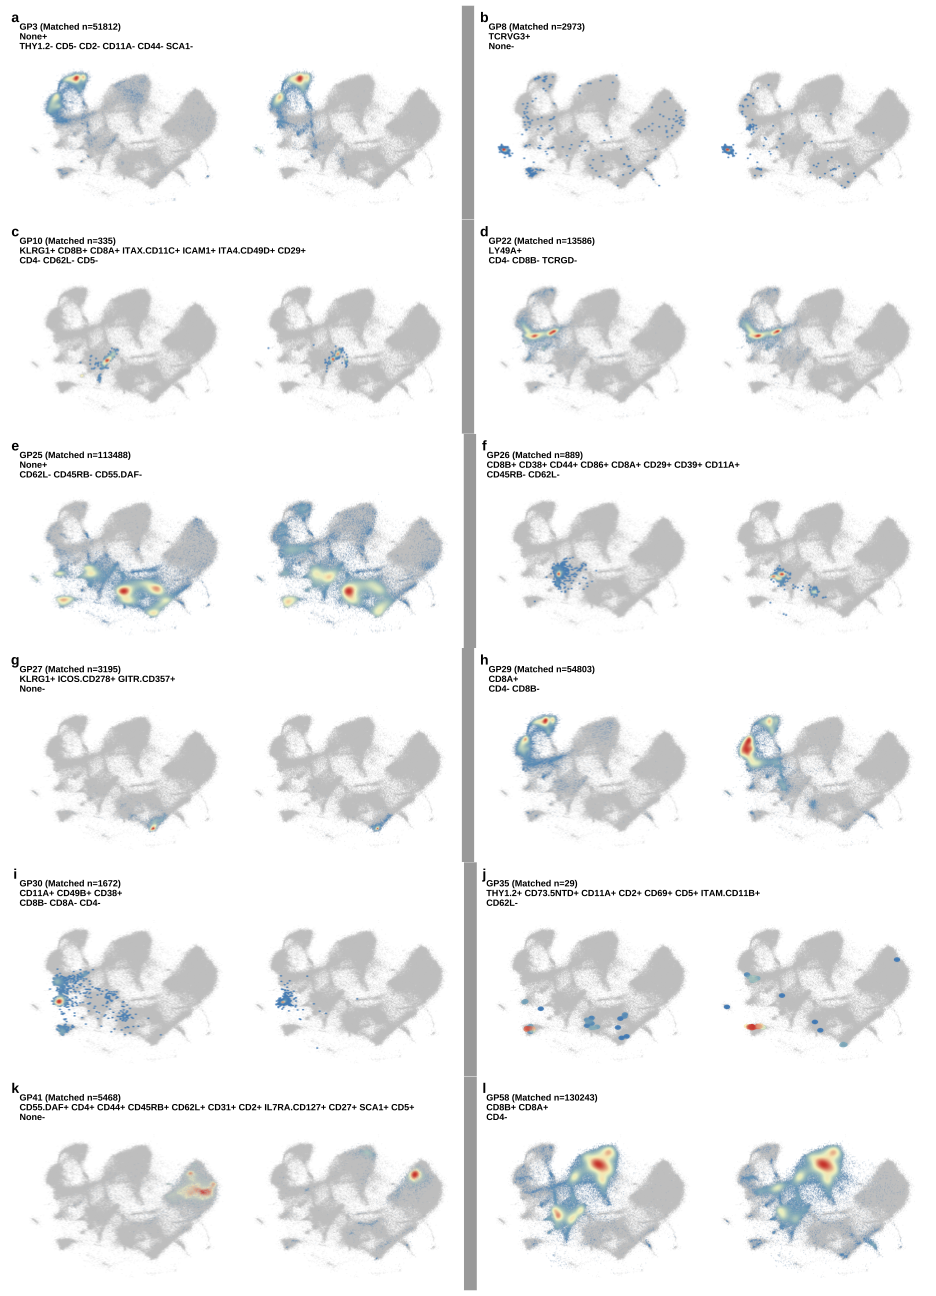
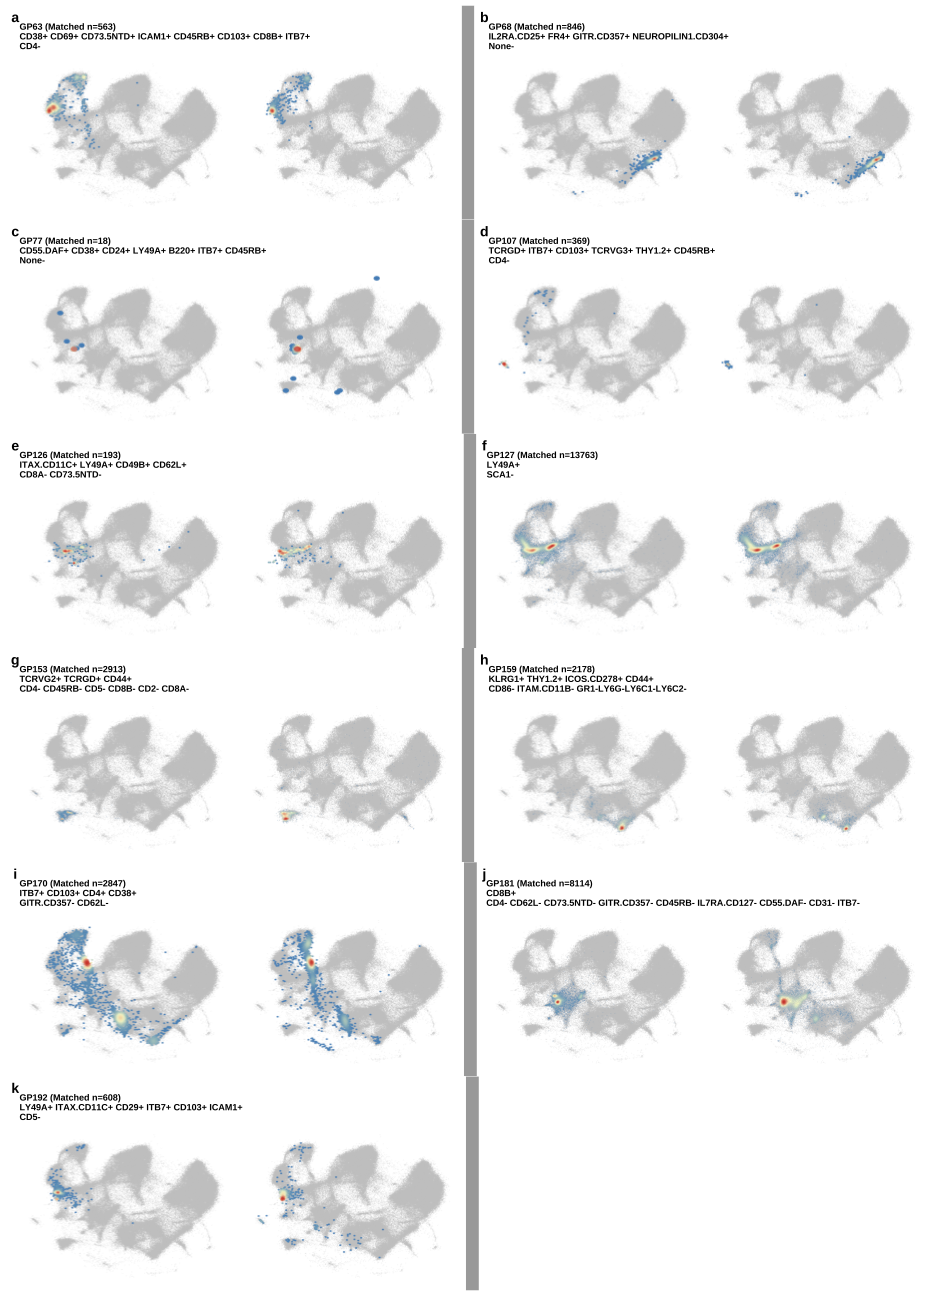
Fig. S6. Extension of Figure 6c-f to all well-aligned GPs, shown as two gallery pages (s6-1 and s6-2). For each GP, cells are shown twice on the same MDE embedding: left, cells passing a protein gate built from the GP’s curated marker signature (positive markers above, negative below), with the gate size reported as “Matched n”; right, an equally sized set of cells with the highest GP loading. Highlighted cells are colored by two-dimensional density and all other cells are grey; thymocytes, proliferating, and “miniverse” cells are excluded. Each panel is labeled with its GP and protein signature.
sessionInfo()R version 4.5.1 (2025-06-13)
Platform: aarch64-apple-darwin20
Running under: macOS Sequoia 15.6.1
Matrix products: default
BLAS: /System/Library/Frameworks/Accelerate.framework/Versions/A/Frameworks/vecLib.framework/Versions/A/libBLAS.dylib
LAPACK: /Library/Frameworks/R.framework/Versions/4.5-arm64/Resources/lib/libRlapack.dylib; LAPACK version 3.12.1
locale:
[1] en_CA/en_CA/en_CA/C/en_CA/en_CA
time zone: Asia/Tokyo
tzcode source: internal
attached base packages:
[1] stats graphics grDevices utils datasets methods base
loaded via a namespace (and not attached):
[1] vctrs_0.7.3 cli_3.6.6 knitr_1.50 rlang_1.2.0
[5] xfun_0.55 stringi_1.8.7 otel_0.2.0 promises_1.5.0
[9] jsonlite_2.0.0 workflowr_1.7.2 glue_1.8.1 rprojroot_2.1.1
[13] git2r_0.36.2 htmltools_0.5.9 httpuv_1.6.16 sass_0.4.10
[17] rmarkdown_2.30 evaluate_1.0.5 jquerylib_0.1.4 tibble_3.3.0
[21] fastmap_1.2.0 yaml_2.3.12 lifecycle_1.0.5 stringr_1.6.0
[25] compiler_4.5.1 fs_1.6.6 Rcpp_1.1.1-1.1 pkgconfig_2.0.3
[29] later_1.4.4 digest_0.6.39 R6_2.6.1 pillar_1.11.1
[33] magrittr_2.0.5 bslib_0.9.0 tools_4.5.1 cachem_1.1.0