Figure 6: Surface proteins associated with GP activity
Ziang Zhang
Last updated: 2026-07-28
Checks: 7 0
Knit directory:
immgenT-GP-analysis/analysis/
This reproducible R Markdown analysis was created with workflowr (version 1.7.2). The Checks tab describes the reproducibility checks that were applied when the results were created. The Past versions tab lists the development history.
Great! Since the R Markdown file has been committed to the Git repository, you know the exact version of the code that produced these results.
Great job! The global environment was empty. Objects defined in the global environment can affect the analysis in your R Markdown file in unknown ways. For reproduciblity it’s best to always run the code in an empty environment.
The command set.seed(1) was run prior to running the
code in the R Markdown file. Setting a seed ensures that any results
that rely on randomness, e.g. subsampling or permutations, are
reproducible.
Great job! Recording the operating system, R version, and package versions is critical for reproducibility.
Nice! There were no cached chunks for this analysis, so you can be confident that you successfully produced the results during this run.
Great job! Using relative paths to the files within your workflowr project makes it easier to run your code on other machines.
Great! You are using Git for version control. Tracking code development and connecting the code version to the results is critical for reproducibility.
The results in this page were generated with repository version d538aa2. See the Past versions tab to see a history of the changes made to the R Markdown and HTML files.
Note that you need to be careful to ensure that all relevant files for
the analysis have been committed to Git prior to generating the results
(you can use wflow_publish or
wflow_git_commit). workflowr only checks the R Markdown
file, but you know if there are other scripts or data files that it
depends on. Below is the status of the Git repository when the results
were generated:
Ignored files:
    Ignored:    .DS_Store
    Ignored:    .claude/
    Ignored:    analysis/.DS_Store
    Ignored:    analysis/.Rhistory
    Ignored:    analysis/assets/.DS_Store
    Ignored:    captions/
    Ignored:    code/.DS_Store
    Ignored:    code/other/topic_flashier_20250212.R
    Ignored:    code/other/topic_wrapper_20250215_alldata_backfit.sh
    Ignored:    data
    Ignored:    experiments/
    Ignored:    figures/.DS_Store
    Ignored:    figures/Previous/.DS_Store
    Ignored:    figures/Previous/bits/.DS_Store
    Ignored:    figures/Previous/bits/Figure 1/.DS_Store
    Ignored:    figures/Previous/bits/Figure 2/.DS_Store
    Ignored:    figures/Previous/bits/Figure 3/.DS_Store
    Ignored:    figures/Previous/bits/Figure 4/.DS_Store
    Ignored:    figures/Previous/bits/Figure 6/.DS_Store
    Ignored:    figures/Previous/bits/Figure 7/.DS_Store
    Ignored:    figures/Previous/bits/Figure S1/.DS_Store
    Ignored:    figures/Previous/bits/Figure S2/.DS_Store
    Ignored:    figures/Previous/bits/Figure S3/.DS_Store
    Ignored:    figures/Previous/bits/Figure S6/.DS_Store
    Ignored:    figures/Previous/bits/Figure S7/.DS_Store
    Ignored:    figures/final-selected/.DS_Store
    Ignored:    figures/final-selected/Figure 1/.DS_Store
    Ignored:    figures/final-selected/Figure 2/.DS_Store
    Ignored:    figures/final-selected/Figure S4/.DS_Store
    Ignored:    log/
    Ignored:    output/Figure2/
    Ignored:    output/Figure7b/7b_cell_metadata.csv.gz
    Ignored:    plan/
    Ignored:    reorder/
    Ignored:    tables/
    Ignored:    tmp/
Note that any generated files, e.g. HTML, png, CSS, etc., are not included in this status report because it is ok for generated content to have uncommitted changes.
These are the previous versions of the repository in which changes were
made to the R Markdown (analysis/Figure6.Rmd) and HTML
(docs/Figure6.html) files. If you’ve configured a remote
Git repository (see ?wflow_git_remote), click on the
hyperlinks in the table below to view the files as they were in that
past version.
| File | Version | Author | Date | Message |
|---|---|---|---|---|
| html | d538aa2 | Ziang Zhang | 2026-07-28 | Build site: reordered Figures 6 / S6 / S3 and the new Figure 7b page |
| Rmd | 4c07670 | Ziang Zhang | 2026-07-28 | Reorder Figures 6, S6 and S3; make the ex-S5 figure Figure 7b |
| html | 029b0ae | Ziang Zhang | 2026-07-28 | Build site. |
| Rmd | 0f5b5da | Ziang Zhang | 2026-07-28 | Align all figure captions with captions_20260728_final.docx |
| html | 58eab27 | Ziang Zhang | 2026-07-28 | Build site: Fig. 6i-k caption on the curated CD69 GP subset |
| Rmd | 589a0ed | Ziang Zhang | 2026-07-28 | Fig. 6i-k: say the 10 CD69 GPs are curated, not the top 10 |
| html | 3fc3789 | Ziang Zhang | 2026-07-27 | Republish all 24 pages |
| html | 1390a03 | Ziang Zhang | 2026-07-27 | Republish all 24 pages |
| html | adaef21 | Ziang Zhang | 2026-07-27 | Build site: panel fixes and PDF-derived assets |
| html | 5b19858 | Ziang Zhang | 2026-07-27 | Build site. |
| Rmd | ffe285c | Ziang Zhang | 2026-07-27 | Reorganize figures/ and untrack local-only exploration notes |
| Rmd | 91ee059 | Ziang Zhang | 2026-07-26 | Select each panel’s code block by name, not by line number |
| html | 91ee059 | Ziang Zhang | 2026-07-26 | Select each panel’s code block by name, not by line number |
| Rmd | 06552b8 | Ziang Zhang | 2026-07-14 | Update Figure 6b heatmap layout |
| html | 06552b8 | Ziang Zhang | 2026-07-14 | Update Figure 6b heatmap layout |
| html | 92021bf | Ziang Zhang | 2026-07-02 | Build site. |
| Rmd | db7a5cd | Ziang Zhang | 2026-07-02 | Recover 3 data-provenance gaps into pipeline scripts |
| html | 827c89b | Ziang Zhang | 2026-07-02 | Build site. |
| Rmd | 8ac7f9f | Ziang Zhang | 2026-07-02 | Add data provenance notes to each script; remove conversational |
| Rmd | f9db962 | Ziang Zhang | 2026-07-02 | Simplify layout: drop old code/script folders, rename |
| html | c6e5086 | Ziang Zhang | 2026-07-02 | Build site. |
| html | 5a79883 | Ziang Zhang | 2026-07-02 | Build site. |
| Rmd | 2b0e445 | Ziang Zhang | 2026-07-02 | Fix GitHub source links to point at the new |
| html | cf1d0ac | Ziang Zhang | 2026-07-02 | Build site. |
| Rmd | 06b2461 | Ziang Zhang | 2026-07-02 | Initial commit: immgenT-GP-analysis |
| html | 06b2461 | Ziang Zhang | 2026-07-02 | Initial commit: immgenT-GP-analysis |
All panels except (a) are produced by script/Figure6.R,
which shares its CITE-seq setup with Figure
S6 via code/R/citeseq_shared_setup.R. The code below is
shown for reference (not re-executed on this page, since this script
takes about a minute to run); the images are its pre-rendered
output.
Panel order changed on 2026-07-28. The figure was
reordered and two panels moved out to Figure
S6, so the letters here no longer match the published figure: the
KLRG1 and CD69 panels moved to the front (published g, h, i are now b,
c, d), the four gating panels moved back (published c-f are now e-h),
and two new gating panels were added, (i) GP77 and (j) GP8. The
published protein-program heatmap 6b is now Fig. S6a, and the published 6j/6k are
now Fig. S6b, c.
script/Figure6.R carries the full old-to-new table in its
header.
Setup
library(ggplot2)
library(ggrepel)
library(dplyr)
library(patchwork)
library(tidyr)
library(Matrix) # protein matrices are dgCMatrix; must be attached for `[` to dispatch

data_path <- "data/"
figure_path <- "figures/final-selected/Figure 6/"
source("code/R/gated_protein_helpers.R")

# 6a: hand-drawn schematic -- not code-generated, no output here.
Panels (b) onward additionally load the shared CITE-seq cell/protein setup:
# ============================================================
# Load data (shared with FigureS6.R)
# ============================================================
source("code/R/citeseq_shared_setup.R")
(a) Protein-signature schematic
This panel is a hand-drawn schematic, not generated from R – there is
no code or pre-rendered image to show here. See
figures/Previous/bits/Figure 6/6a.pdf for the published
panel.
Fig. 6a. Schematic illustrating how protein signatures were defined for each GP. Holding the cell-loading matrix L fixed from the GP model, a protein factor matrix was estimated by EBMF from the paired CITE-seq protein measurements, Y ≈ LUᵀ (cells × proteins matrix), yielding a protein signature U (proteins × GPs matrix) for each GP. See Methods: fitting CITE-seq protein programs with fixed scRNA loadings.
(b, c) KLRG1 modulation across lineages
# ============================================================
# 6b/6c: KLRG1 modulation (CD8 vs CD4, CD8 vs Treg)
# ============================================================
FlashierDGE_corrected <- function(F1, L1, group1, group2, title_plot = "") {
  loadings_group1 <- colMeans(L1[group1, ])
  loadings_group2 <- colMeans(L1[group2, ])
  mean_change_loadings <- loadings_group1 - loadings_group2
  vplot <- data.frame(SYMBOL = names(mean_change_loadings), mean_change_loadings = mean_change_loadings, AveExpr = colMeans(L1[c(group1, group2), ]))
  list(diff_factors = vplot)
}
get_klrg1_split <- function(cell_type_label, meta, protein_data, threshold) {
  cells <- meta$cellID[meta$annotation_level1 == cell_type_label]
  cells <- intersect(cells, rownames(protein_data))
  list(pos = cells[protein_data[cells, "KLRG1"] >= threshold], neg = cells[protein_data[cells, "KLRG1"] < threshold])
}
run_checked_dge <- function(group_list, F_mat, L_mat, label) {
  if (length(group_list$pos) < 3 || length(group_list$neg) < 3) stop(paste("Insufficient data:", label))
  df <- FlashierDGE_corrected(F1 = F_mat, L1 = L_mat, group1 = group_list$pos, group2 = group_list$neg)$diff_factors
  if (!"SYMBOL" %in% colnames(df)) df$SYMBOL <- rownames(df)
  df
}
plot_target_gps <- function(df, x_var, y_var, label_var, target_gps, highlight_color = "darkorange", background_color = "black",
                             x_limits = c(-0.5, 0.5), y_limits = c(-0.5, 0.5), background_alpha = 0.5,
                             xlab = "Difference in Mean Loading", ylab = "Difference in Mean Loading", title = "Comparison of Specific GP Loadings") {
  highlight_df <- df %>% filter({{ label_var }} %in% target_gps) %>% mutate(.label_display = as.character({{ label_var }}))
  ggplot(df, aes(x = {{ x_var }}, y = {{ y_var }})) +
    geom_point(color = background_color, alpha = background_alpha) +
    geom_abline(slope = 1, intercept = 0, linetype = "dashed", color = "red") +
    geom_hline(yintercept = 0, linetype = "dashed", color = "blue") +
    geom_vline(xintercept = 0, linetype = "dashed", color = "blue") +
    geom_point(data = highlight_df, aes(color = {{ label_var }}), size = 2) +
    ggrepel::geom_text_repel(seed = 42, data = highlight_df, aes(label = .label_display, color = {{ label_var }}), max.overlaps = Inf, size = 3.5, box.padding = 0.35, point.padding = 0.5, segment.color = "grey50", show.legend = FALSE) +
    scale_color_manual(values = highlight_color, guide = "none") +
    coord_cartesian(xlim = x_limits, ylim = y_limits) +
    labs(x = xlab, y = ylab, title = title) +
    theme_minimal()
}

klrg1_threshold <- threshold_results_subset_manual$Threshold[threshold_results_subset_manual$Protein == "KLRG1"]
cd8_split <- get_klrg1_split("CD8", seurat_meta_filtered, protein_mat_normalized_lognorm, klrg1_threshold)
CD4_split <- get_klrg1_split("CD4", seurat_meta_filtered, protein_mat_normalized_lognorm, klrg1_threshold)
treg_split <- get_klrg1_split("Treg", seurat_meta_filtered, protein_mat_normalized_lognorm, klrg1_threshold)

diff_CD8 <- run_checked_dge(cd8_split, F_pm_filtered, L_pm_filtered, "CD8") %>% rename(mean_change_CD8 = mean_change_loadings, AveExpr_CD8 = AveExpr)
diff_CD4 <- run_checked_dge(CD4_split, F_pm_filtered, L_pm_filtered, "CD4") %>% rename(mean_change_CD4 = mean_change_loadings, AveExpr_CD4 = AveExpr)
diff_Treg <- run_checked_dge(treg_split, F_pm_filtered, L_pm_filtered, "Treg") %>% rename(mean_change_Treg = mean_change_loadings, AveExpr_Treg = AveExpr)

# 6b: CD8 vs CD4
merged_cd4 <- inner_join(diff_CD4, diff_CD8, by = "SYMBOL")
p_6b <- plot_target_gps(
  df = merged_cd4, x_var = mean_change_CD8, y_var = mean_change_CD4, label_var = SYMBOL,
  target_gps = c("GP10", "GP58", "GP25", "GP26", "GP43"), background_alpha = 0.8, x_limits = c(-0.2, 0.4), y_limits = c(-0.2, 0.4),
  highlight_color = c("GP10" = "darkorange2", "GP25" = "blue", "GP43" = "blue", "GP26" = "blue", "GP58" = "darkorange2"),
  title = "KLRG1 Modulation: CD8 vs CD4", xlab = "Effect Size in CD8 (KLRG1+ - KLRG1-)", ylab = "Effect Size in CD4 (KLRG1+ - KLRG1-)"
) + theme_bw()
ggsave(paste0(figure_path, "6b.pdf"), p_6b, width = 7, height = 6)

# 6c: CD8 vs Treg
merged_treg <- inner_join(diff_Treg, diff_CD8, by = "SYMBOL")
p_6c <- plot_target_gps(
  df = merged_treg, x_var = mean_change_CD8, y_var = mean_change_Treg, label_var = SYMBOL,
  target_gps = c("GP6", "GP10", "GP12", "GP27", "GP68", "GP58"), background_alpha = 0.8, x_limits = c(-0.2, 0.4), y_limits = c(-0.2, 0.4),
  highlight_color = c("GP10" = "darkorange2", "GP27" = "deeppink", "GP6" = "deeppink", "GP68" = "deeppink", "GP12" = "deeppink", "GP58" = "darkorange2"),
  title = "KLRG1 Modulation: CD8 vs Treg", xlab = "Effect Size in CD8 (KLRG1+ - KLRG1-)", ylab = "Effect Size in Treg (KLRG1+ - KLRG1-)"
) + theme_bw()
ggsave(paste0(figure_path, "6c.pdf"), p_6c, width = 7, height = 6)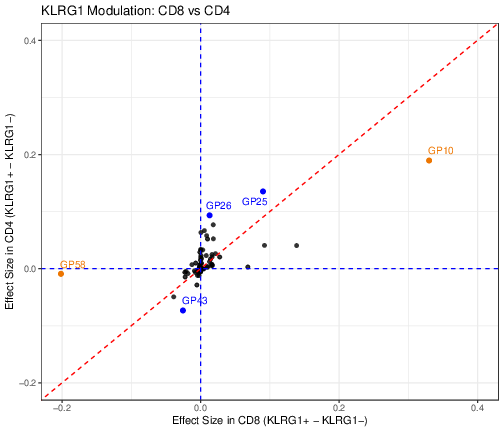
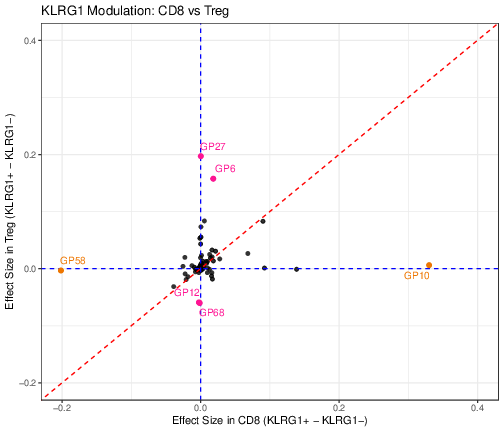
Fig. 6b, c. GPs associated with KLRG1 protein expression in CD4, Tregs and CD8. Within each lineage, cells are split KLRG1+ versus KLRG1- based on the threshold on the KLRG1 protein, and for every GP the effect size is the difference in its mean activity between KLRG1+ and KLRG1- cells. These effect-size versus effect-size plots compare CD8+ T cells (x-axis) with CD4+ T cells (b) or Treg cells (c) (y-axis); each point is a GP, the dashed red line marks equal effect (y = x), and the dashed blue lines mark zero. Selected GPs are labeled – orange for large, concordant effects in both lineages, and blue/pink for lineage-biased GPs.
(d) Genes up- and down-regulated across the CD69-associated GPs
The ten GPs, and the correlation-based order they are drawn in, are
defined once in code/R/citeseq_shared_setup.R, because Fig. S6b, c show the same GPs in the
same order from a different script:
# The CD69-associated GP subset, shared by Figure 6d (the up/down gene heatmap)
# and Figure S6b/S6c (the same GPs' mean activity per tissue and per lineage).
# Those three panels are in two different figures and so in two different
# scripts, but they must show the same GPs on the same axis order -- hence one
# definition here rather than a copy in each script.
#
# Curated list -- NOT a top-10 computed from the correlations below. These 10
# are drawn from among the most strongly CD69-correlated GPs, but are not the
# top 10 under any single ranking: 8 are positively correlated (ranks 1, 3, 4,
# 5, 6, 10, 12, 14 of 200) and GP58/GP171 are the two most *negatively*
# correlated GPs of all 200. By |rho| they sit at ranks 1, 2, 4, 5, 6, 8, 12,
# 14, 17, 18, skipping GP1/GP47/GP100/GP25. Treat as a hand-picked input like
# Thresholds_Selected_Proteins.csv and well_aligned_gps -- don't "fix" it into
# a computed ranking, and keep the captions' "from among the most associated"
# wording in sync (analysis/Figure6.Rmd Fig. 6d, analysis/FigureS6.Rmd
# Fig. S6b, c). script/verify_cd69_gp_ranking.R enforces all of this.
cd69_top_gps_subset <- c("GP35", "GP6", "GP170", "GP26", "GP58", "GP171", "GP63", "GP62", "GP3", "GP29")
shared_cells_cd69 <- intersect(rownames(L_pm_filtered), rownames(protein_mat_normalized_lognorm))
cd69_expr_vec <- protein_mat_normalized_lognorm[shared_cells_cd69, "CD69"]
cd69_corr <- sapply(cd69_top_gps_subset, function(gp) cor(L_pm_filtered[shared_cells_cd69, gp], cd69_expr_vec, method = "spearman"))
# most-correlated GP ends up at the top of the y-axis in all three panels
cd69_top_gps_sorted <- names(sort(cd69_corr, decreasing = FALSE))
# ============================================================
# 6d: up/down genes across the 10 curated CD69-associated GPs
# (cd69_top_gps_subset / cd69_corr / cd69_top_gps_sorted come from
# citeseq_shared_setup.R, which Figure S6's s6b/s6c panels share)
# ============================================================
D_scale6 <- diag(1 / apply(F_pm_filtered, 2, function(x) max(abs(x), na.rm = TRUE)))
F_pm_filtered_scaled <- F_pm_filtered %*% D_scale6
colnames(F_pm_filtered_scaled) <- paste0("GP", 1:ncol(F_pm_filtered_scaled))
plot_factor_heatmap <- function(F_matrix, gp_vector, n_top = 5, min_abs_loading = 0.5, transpose = FALSE,
title = "Factor loadings – top genes per GP", low_color = "steelblue", mid_color = "white", high_color = "firebrick", font_size = 9) {
F_sub <- F_matrix[, gp_vector, drop = FALSE]
selected_genes <- lapply(gp_vector, function(gp) {
vals <- F_sub[, gp]
top_pos <- names(sort(vals, decreasing = TRUE))[seq_len(min(n_top, sum(vals > 0)))]
top_neg <- names(sort(vals, decreasing = FALSE))[seq_len(min(n_top, sum(vals < 0)))]
c(top_pos, top_neg)
})
selected_genes <- unique(unlist(selected_genes))
if (min_abs_loading > 0) {
max_abs <- apply(F_sub[selected_genes, , drop = FALSE], 1, function(x) max(abs(x), na.rm = TRUE))
selected_genes <- names(max_abs[max_abs >= min_abs_loading])
}
hc_genes <- hclust(dist(F_sub[selected_genes, , drop = FALSE]))
gene_order <- rownames(F_sub[selected_genes, , drop = FALSE])[hc_genes$order]
plot_df <- F_sub[selected_genes, , drop = FALSE] %>%
as.data.frame() %>%
tibble::rownames_to_column("Gene") %>%
tidyr::pivot_longer(cols = -Gene, names_to = "GP", values_to = "Loading") %>%
mutate(GP = factor(GP, levels = gp_vector), Gene = factor(Gene, levels = gene_order))
limit <- max(abs(plot_df$Loading), na.rm = TRUE)
x_aes <- if (transpose) "Gene" else "GP"
y_aes <- if (transpose) "GP" else "Gene"
ggplot(plot_df, aes(x = .data[[x_aes]], y = .data[[y_aes]], fill = Loading)) +
geom_tile() +
scale_fill_gradient2(low = low_color, mid = mid_color, high = high_color, midpoint = 0, limits = c(-limit, limit), name = "Loading") +
# Axis titles are the faceting variables themselves ("Gene" / "GP"), as in
# the published 6i -- an earlier version dropped them along with the title's
# "- top genes per GP" suffix.
labs(title = title, x = x_aes, y = y_aes) +
theme_minimal(base_size = font_size) +
theme(axis.text.x = element_text(angle = if (transpose) 90 else 45, hjust = 1, size = font_size), axis.text.y = element_text(size = font_size), panel.grid = element_blank(), plot.title = element_text(face = "bold"))
}
p_heatmap <- plot_factor_heatmap(F_matrix = F_pm_filtered_scaled, gp_vector = cd69_top_gps_sorted, n_top = 5, font_size = 9, transpose = TRUE, low_color = "#4DAF4A", mid_color = "white", high_color = "#984EA3")
corr_strip_df <- data.frame(GP = factor(cd69_top_gps_sorted, levels = cd69_top_gps_sorted), Correlation = cd69_corr[cd69_top_gps_sorted], x = "Corr")
corr_limit <- max(abs(corr_strip_df$Correlation))
p_corr_strip <- ggplot(corr_strip_df, aes(x = x, y = GP, fill = Correlation)) +
geom_tile() +
scale_fill_gradient2(low = "royalblue", mid = "white", high = "tomato", midpoint = 0, limits = c(-corr_limit, corr_limit), name = "Corr\n(CD69)") +
labs(x = NULL, y = NULL) +
theme_minimal(base_size = 9) +
theme(axis.text.x = element_text(size = 9, angle = 45, hjust = 1), axis.text.y = element_blank(), axis.ticks.y = element_blank(), panel.grid = element_blank())
p_6d <- p_corr_strip + p_heatmap + patchwork::plot_layout(widths = c(0.06, 1), guides = "collect")
ggsave(paste0(figure_path, "6d.pdf"), p_6d, width = 11, height = 5)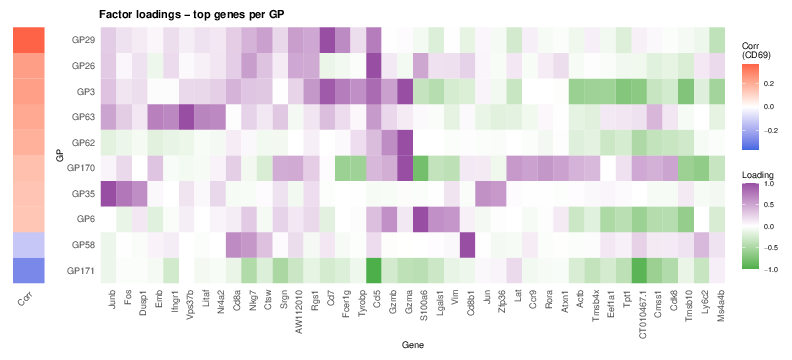
Fig. 6d. Genes up- and down-regulated across the GPs associated with CD69 protein expression. Ten representative GPs associated with CD69, selected from among those most strongly correlated – positively or negatively – with CD69 protein expression, ordered by the Spearman correlation between GP activity and CD69 expression. Heatmap of the genes most strongly up- and down-regulated across these GPs: per GP, the top five positively and top five negatively scoring genes, then restricted to genes reaching |score| >= 0.5 in at least one of the ten (green-white-purple), with the left strip indicating each GP’s Spearman correlation with CD69 (blue-white-red). The same ten GPs’ mean activity across tissues and across lineages is shown in Fig. S6b, c.
The ten GPs are a hand-picked set, not a computed
top-10: eight are positively correlated with CD69 (ranks 1, 3, 4, 5, 6,
10, 12 and 14 of 200) and GP58/GP171 are the two most
negatively correlated GPs of all 200.
script/verify_cd69_gp_ranking.R recomputes the correlation
over all 200 GPs and fails if this wording and the code drift apart.
(e-j) Protein-gated vs. GP-loading populations
# ============================================================
# 6e-6j: protein-gate vs. GP-loading comparison for the 6 curated main-figure
# GPs (df_markers2, thymocyte/proliferating/miniverse_cells, L_pm_for_gating,
# select_proteins, threshold_results_subset_manual, enlarge_gps all come from
# citeseq_shared_setup.R above)
# ============================================================
# Panel lettering is carried by this named vector and the loop iterates over its
# names, so a GP can never be drawn under another GP's letter. (An earlier
# version kept the GP list and the letters in two separate vectors and assigned
# the letters positionally, which silently permuted three of the panels.)
fig6_gating <- c("GP171" = "6e", "GP12" = "6f", "GP80" = "6g", "GP23" = "6h", "GP77" = "6i", "GP8" = "6j")
for (gp in names(fig6_gating)) {
  k_name <- paste0("K", sub("^GP", "", gp))
  plot_gated_gp_vs_protein(
    gp_name = k_name,
    df_markers = df_markers2,
    protein_mat = protein_mat_normalized_lognorm,
    loading_mat = L_pm_for_gating,
    mde_emb = mde_result,
    missing_threshold_action = "skip",
    threshold_df = threshold_results_subset_manual,
    exclude_cells = c(thymocyte_cells, proliferating_cells, miniverse_cells),
    selected_proteins = select_proteins,
    loading_q = NULL,
    min_pointsize = if (gp %in% enlarge_gps) 3L else 0L,
    save_path = paste0(figure_path, fig6_gating[gp], ".pdf")
  )
}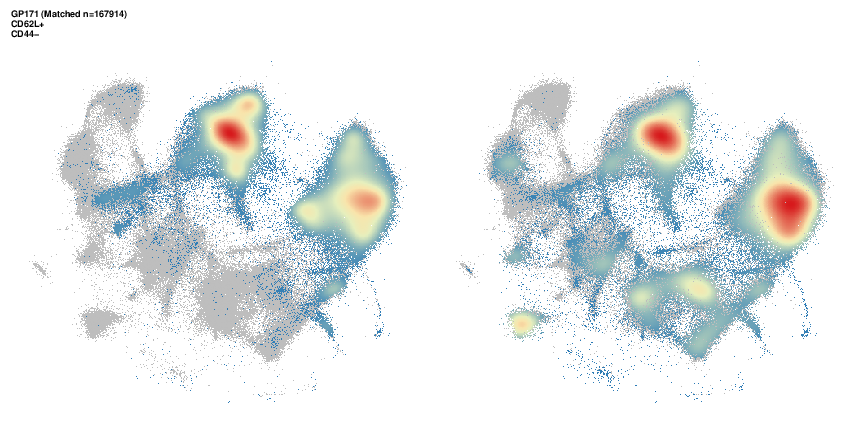
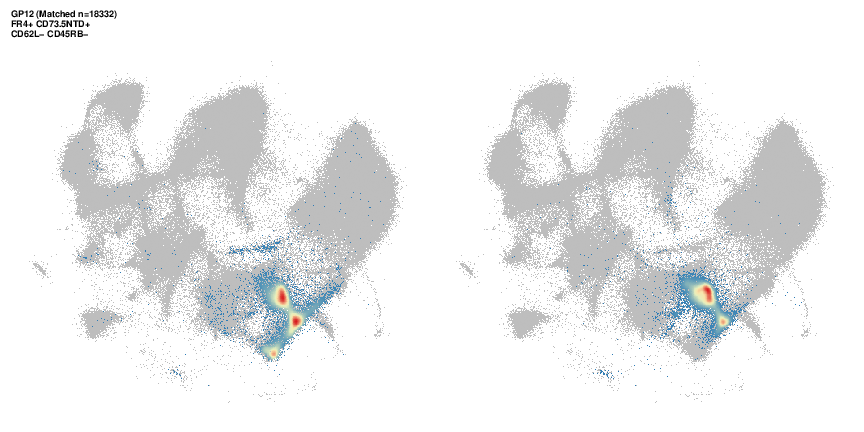
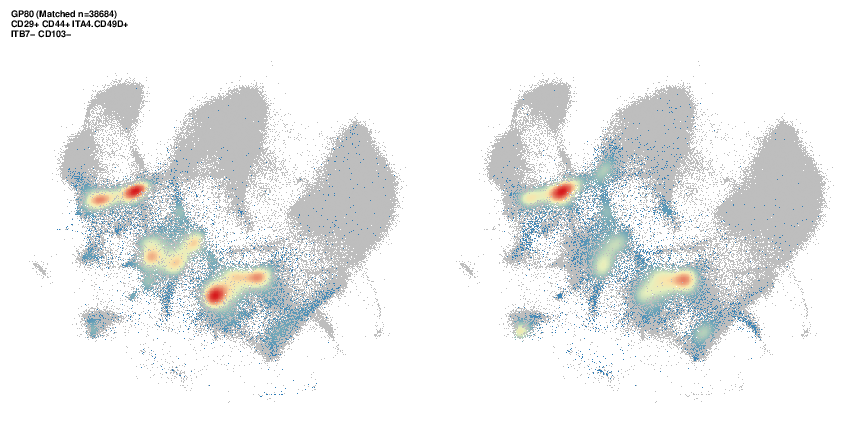
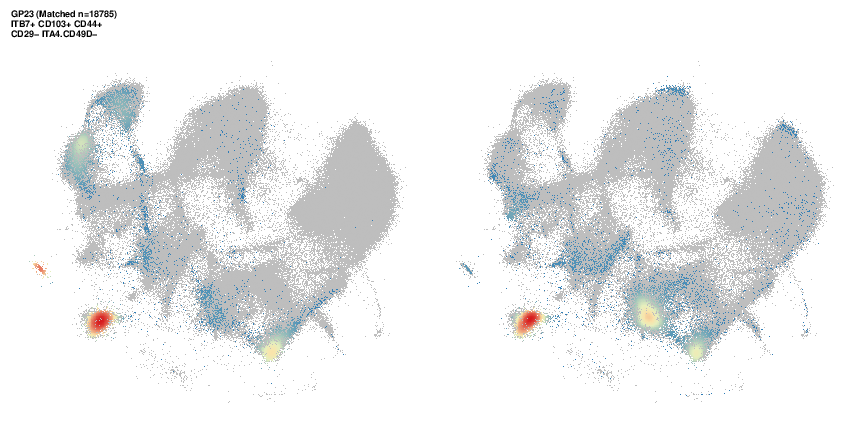
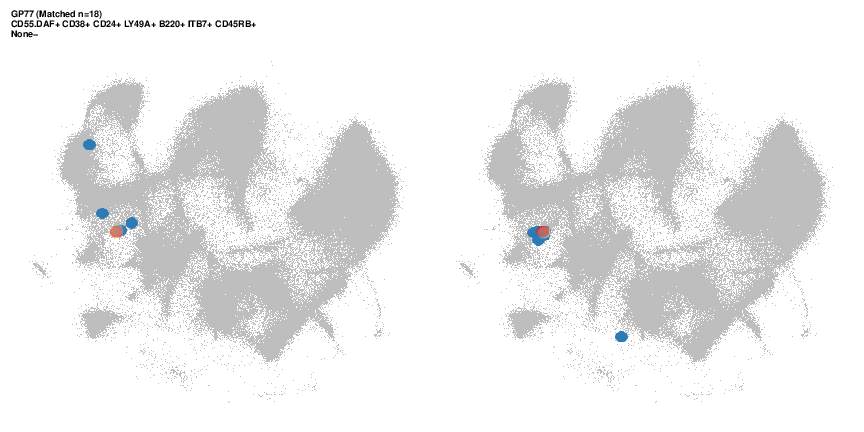
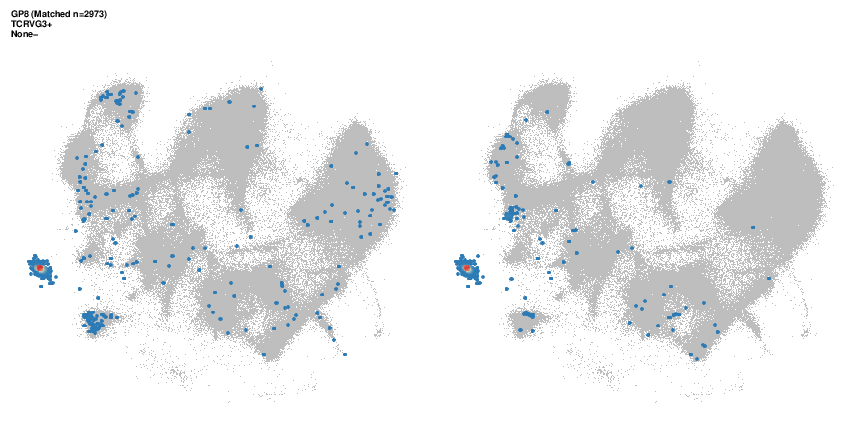
Fig. 6e-j. Examples of gating strategies used to identify GP-active cells, for (e) GP171, (f) GP12, (g) GP80, (h) GP23, (i) GP77 and (j) GP8. For each GP, cells are shown twice on the same MDE embedding. Left, cells selected by the proposed protein gate, built from the GP’s curated marker signature (positive markers above, and negative markers below), with the gate size reported in the panel title as “Matched n”; right, exactly that many cells, taken as the ones with the highest GP activity. Color indicates cell density (two-dimensional); all other cells are grey. Thymocytes, proliferating, and “miniverse” cells are excluded. Four further GPs are gated the same way in Fig. S6d-g.
sessionInfo()R version 4.5.1 (2025-06-13)
Platform: aarch64-apple-darwin20
Running under: macOS Sequoia 15.6.1
Matrix products: default
BLAS: /System/Library/Frameworks/Accelerate.framework/Versions/A/Frameworks/vecLib.framework/Versions/A/libBLAS.dylib
LAPACK: /Library/Frameworks/R.framework/Versions/4.5-arm64/Resources/lib/libRlapack.dylib; LAPACK version 3.12.1
locale:
[1] en_CA/en_CA/en_CA/C/en_CA/en_CA
time zone: America/Chicago
tzcode source: internal
attached base packages:
[1] stats graphics grDevices utils datasets methods base
loaded via a namespace (and not attached):
[1] vctrs_0.7.3 cli_3.6.6 knitr_1.50 rlang_1.2.0
[5] xfun_0.55 stringi_1.8.7 otel_0.2.0 promises_1.5.0
[9] jsonlite_2.0.0 workflowr_1.7.2 glue_1.8.1 rprojroot_2.1.1
[13] git2r_0.36.2 htmltools_0.5.9 httpuv_1.6.16 sass_0.4.10
[17] rmarkdown_2.30 evaluate_1.0.5 jquerylib_0.1.4 tibble_3.3.0
[21] fastmap_1.2.0 yaml_2.3.12 lifecycle_1.0.5 whisker_0.4.1
[25] stringr_1.6.0 compiler_4.5.1 fs_1.6.6 Rcpp_1.1.1-1.1
[29] pkgconfig_2.0.3 later_1.4.4 digest_0.6.39 R6_2.6.1
[33] pillar_1.11.1 magrittr_2.0.5 bslib_0.9.0 tools_4.5.1
[37] cachem_1.1.0