Figure S4: Healthy non-thymocyte GP mean-loading heatmaps
Ziang Zhang
Last updated: 2026-07-13
Checks: 6 1
Knit directory:
immgenT-GP-analysis/analysis/
This reproducible R Markdown analysis was created with workflowr (version 1.7.2). The Checks tab describes the reproducibility checks that were applied when the results were created. The Past versions tab lists the development history.
The R Markdown is untracked by Git. To know which version of the R
Markdown file created these results, you’ll want to first commit it to
the Git repo. If you’re still working on the analysis, you can ignore
this warning. When you’re finished, you can run
wflow_publish to commit the R Markdown file and build the
HTML.
Great job! The global environment was empty. Objects defined in the global environment can affect the analysis in your R Markdown file in unknown ways. For reproduciblity it’s best to always run the code in an empty environment.
The command set.seed(1) was run prior to running the
code in the R Markdown file. Setting a seed ensures that any results
that rely on randomness, e.g. subsampling or permutations, are
reproducible.
Great job! Recording the operating system, R version, and package versions is critical for reproducibility.
Nice! There were no cached chunks for this analysis, so you can be confident that you successfully produced the results during this run.
Great job! Using relative paths to the files within your workflowr project makes it easier to run your code on other machines.
Great! You are using Git for version control. Tracking code development and connecting the code version to the results is critical for reproducibility.
The results in this page were generated with repository version c2b3360. See the Past versions tab to see a history of the changes made to the R Markdown and HTML files.
Note that you need to be careful to ensure that all relevant files for
the analysis have been committed to Git prior to generating the results
(you can use wflow_publish or
wflow_git_commit). workflowr only checks the R Markdown
file, but you know if there are other scripts or data files that it
depends on. Below is the status of the Git repository when the results
were generated:
Ignored files:
    Ignored:    .DS_Store
    Ignored:    .claude/
    Ignored:    analysis/.DS_Store
    Ignored:    analysis/.Rhistory
    Ignored:    analysis/assets/.DS_Store
    Ignored:    code/.DS_Store
    Ignored:    data
    Ignored:    figures/.DS_Store
    Ignored:    figures/final-selected/.DS_Store
    Ignored:    figures/final-selected/bits/.DS_Store
    Ignored:    figures/final-selected/bits/Figure 1/.DS_Store
    Ignored:    figures/final-selected/bits/Figure 2/.DS_Store
    Ignored:    figures/final-selected/bits/Figure 3/.DS_Store
    Ignored:    figures/final-selected/bits/Figure 4/.DS_Store
    Ignored:    figures/final-selected/bits/Figure 6/.DS_Store
    Ignored:    figures/final-selected/bits/Figure 7/.DS_Store
    Ignored:    figures/final-selected/bits/Figure S1/.DS_Store
    Ignored:    figures/final-selected/bits/Figure S2/.DS_Store
    Ignored:    figures/final-selected/bits/Figure S3/.DS_Store
    Ignored:    figures/final-selected/bits/Figure S6/.DS_Store
    Ignored:    figures/final-selected/bits/Figure S7/.DS_Store
    Ignored:    figures/generated/.DS_Store
    Ignored:    figures/generated/Figure 5/
    Ignored:    figures/generated/Figure 7/
    Ignored:    figures/generated/Figure 8/
    Ignored:    figures/generated/Figure 9/
    Ignored:    tmp/

Untracked files:
    Untracked:  analysis/FigureS4.Rmd
    Untracked:  analysis/assets/FigureS4/
    Untracked:  code/other/
    Untracked:  experiments/
    Untracked:  figures/generated/Figure S4/
    Untracked:  log/
    Untracked:  plan/
    Untracked:  script/FigureS4.R
    Untracked:  tables/

Unstaged changes:
    Modified:   analysis/Figure6.Rmd
    Modified:   analysis/Methods_FlashierFit.Rmd
    Modified:   analysis/assets/Figure6/6b.png
    Modified:   analysis/index.Rmd
    Modified:   figures/generated/Figure 6/6b.pdf
    Modified:   script/Figure3.R
    Modified:   script/Figure6.R
Note that any generated files, e.g. HTML, png, CSS, etc., are not included in this status report because it is ok for generated content to have uncommitted changes.
There are no past versions. Publish this analysis with
wflow_publish() to start tracking its development.
Figure S4 is produced by script/FigureS4.R.
The page provides raw and within-GP-normalized alternatives as clickable
tabs for each panel; no display choice has been finalized. The code is
shown for reference and is not re-executed on this page. All panels use
healthy non-thymocyte cells (condition_broad == "healthy"
and annotation_level1 != "thymocyte").
Setup, filtering, and ordering
# Figure S4. Healthy non-thymocyte GP mean-loading heatmaps.
#
# Panel S4a: tissue (organ_simplified).
# Panel S4b: cluster (annotation_level2).
#
# Each panel has raw and within-GP normalized alternatives. Both alternatives
# use the same raw-mean-filtered GP/group set and dominant-group order so they
# can be compared directly. The normalized matrix is calculated before
# filtering, and every retained GP has a raw mean maximum >= 0.1.

suppressPackageStartupMessages({
  library(ComplexHeatmap)
  library(circlize)
  library(grid)
  library(ZemmourLib)
})

if (!file.exists("code/R/setup_data.R")) {
  stop("Run this script from the immgenT-GP-analysis repository root.")
}

source("code/R/setup_data.R")

figure_path <- "figures/generated/Figure S4"
dir.create(figure_path, recursive = TRUE, showWarnings = FALSE)

mean_loading_by_group <- function(L_mat, labels) {
  if (length(labels) != nrow(L_mat) || anyNA(labels) || any(labels == "")) {
    stop("Group labels must be present for every retained cell.")
  }

  labels <- droplevels(factor(as.character(labels)))
  group_sums <- rowsum(L_mat, group = labels, reorder = TRUE)
  group_counts <- as.integer(table(labels)[rownames(group_sums)])

  list(
    matrix = t(sweep(group_sums, 1L, group_counts, "/")),
    counts = data.frame(group = rownames(group_sums), n_cells = group_counts)
  )
}

normalize_by_gp_max <- function(mean_matrix) {
  row_max <- apply(mean_matrix, 1L, max)
  if (any(!is.finite(row_max)) || any(row_max <= 0)) {
    stop("Every GP must have a finite positive maximum mean loading.")
  }
  sweep(mean_matrix, 1L, row_max, "/")
}

filter_raw_mean_matrix <- function(raw_matrix, raw_mean_cutoff) {
  keep_gp <- rowSums(raw_matrix >= raw_mean_cutoff) > 0L
  filtered_raw <- raw_matrix[keep_gp, , drop = FALSE]
  keep_group <- colSums(filtered_raw >= raw_mean_cutoff) > 0L
  filtered_raw <- filtered_raw[, keep_group, drop = FALSE]

  if (nrow(filtered_raw) == 0L || ncol(filtered_raw) < 2L) {
    stop("The raw-mean filter must retain at least one GP and two groups.")
  }
  filtered_raw
}

dominant_group_order <- function(raw_mean_matrix) {
  gp_number <- suppressWarnings(as.integer(sub("^GP", "", rownames(raw_mean_matrix))))
  if (ncol(raw_mean_matrix) < 2L || anyNA(gp_number)) {
    stop("Dominant-group ordering requires at least two groups and GP<number> row names.")
  }

  dominant_index <- max.col(raw_mean_matrix, ties.method = "first")
  dominant_mean <- raw_mean_matrix[cbind(seq_len(nrow(raw_mean_matrix)), dominant_index)]
  second_mean <- apply(raw_mean_matrix, 1L, function(values) sort(values, decreasing = TRUE)[2L])
  dominance_gap <- dominant_mean - second_mean
  dominant_gp_count <- tabulate(dominant_index, nbins = ncol(raw_mean_matrix))
  column_order <- order(-dominant_gp_count, -colMeans(raw_mean_matrix), colnames(raw_mean_matrix))
  dominant_group_position <- match(dominant_index, column_order)
  row_order <- order(dominant_group_position, -dominance_gap, -dominant_mean, gp_number)

  if (any(diff(dominant_group_position[row_order]) < 0L)) {
    stop("Dominant-group blocks are not monotone after ordering.")
  }

  list(row_order = row_order, column_order = column_order)
}

palette_for_groups <- function(groups, palette, label) {
  missing <- setdiff(groups, names(palette))
  if (length(missing) > 0L) {
    stop("The canonical ", label, " palette lacks: ", paste(missing, collapse = ", "))
  }
  palette[groups]
}

render_heatmap <- function(
    matrix,
    group_palette,
    group_label,
    scale_label,
    filename,
    raw_limit,
    row_order,
    column_order,
    raw_mean_cutoff
) {
  if (
    length(row_order) != nrow(matrix) || length(column_order) != ncol(matrix) ||
    !identical(sort(row_order), seq_len(nrow(matrix))) ||
    !identical(sort(column_order), seq_len(ncol(matrix)))
  ) {
    stop("Fixed row and column orders must be complete permutations.")
  }

  if (identical(scale_label, "Raw mean loading")) {
    color_fun <- circlize::colorRamp2(
      c(0, raw_limit * 0.15, raw_limit),
      c("#FFFFFF", "#FCAE91", "#99000D")
    )
    legend_at <- c(0, raw_limit / 2, raw_limit)
  } else {
    color_fun <- circlize::colorRamp2(
      c(0, 0.5, 1),
      c("#FFFFFF", "#FCAE91", "#99000D")
    )
    legend_at <- c(0, 0.5, 1)
  }

  heatmap_width_mm <- max(180, ncol(matrix) * 4.2)
  heatmap_height_mm <- max(480, nrow(matrix) * 3.0)
  pdf_width_in <- (heatmap_width_mm + 130) / 25.4
  pdf_height_in <- (heatmap_height_mm + 120) / 25.4
  order_description <- paste0(
    "dominant-group blocks (within block: dominance gap); focus: raw mean >= ",
    raw_mean_cutoff, " filter"
  )

  column_annotation <- ComplexHeatmap::HeatmapAnnotation(
    group = factor(colnames(matrix), levels = colnames(matrix)),
    col = list(group = group_palette),
    show_legend = FALSE,
    annotation_name_side = "left",
    annotation_height = grid::unit(4, "mm")
  )

  short_scale_label <- if (identical(scale_label, "Raw mean loading")) {
    "Raw GP mean loading"
  } else {
    "Normalized GP mean loading"
  }

  heatmap <- ComplexHeatmap::Heatmap(
    matrix,
    name = scale_label,
    col = color_fun,
    cluster_rows = FALSE,
    cluster_columns = FALSE,
    row_order = row_order,
    column_order = column_order,
    top_annotation = column_annotation,
    column_title = paste0(short_scale_label, ": ", group_label, "\n", order_description),
    column_title_gp = grid::gpar(fontsize = 13, fontface = "bold"),
    row_title = "GP",
    row_title_gp = grid::gpar(fontsize = 10),
    row_names_gp = grid::gpar(fontsize = 6),
    column_names_gp = grid::gpar(fontsize = 5),
    column_names_rot = 45,
    heatmap_legend_param = list(
      title = scale_label,
      at = legend_at,
      labels = format(legend_at, trim = TRUE, scientific = FALSE)
    ),
    width = grid::unit(heatmap_width_mm, "mm"),
    height = grid::unit(heatmap_height_mm, "mm"),
    use_raster = TRUE,
    raster_quality = 2
  )

  grDevices::pdf(filename, width = pdf_width_in, height = pdf_height_in)
  ComplexHeatmap::draw(
    heatmap,
    heatmap_legend_side = "right",
    padding = grid::unit(c(8, 8, 8, 8), "mm")
  )
  grDevices::dev.off()
}

gp_data <- load_gp_data()
meta <- gp_data$seurat_meta_filtered
healthy_nonthymus <- meta$condition_broad == "healthy" & meta$annotation_level1 != "thymocyte"

if (anyNA(healthy_nonthymus)) {
  stop("Healthy non-thymocyte selection contains missing values.")
}

L_reference <- gp_data$L_pm_filtered[healthy_nonthymus, , drop = FALSE]
meta_reference <- meta[healthy_nonthymus, , drop = FALSE]
if (ncol(L_reference) != 200L || nrow(L_reference) != nrow(meta_reference) || anyNA(L_reference)) {
  stop("The healthy non-thymocyte loading matrix has unexpected dimensions or missing values.")
}

raw_mean_cutoff <- 0.1
organ_result <- mean_loading_by_group(L_reference, meta_reference$organ_simplified)
level2_result <- mean_loading_by_group(L_reference, meta_reference$annotation_level2)
organ_raw <- organ_result$matrix
level2_raw <- level2_result$matrix
organ_normalized <- normalize_by_gp_max(organ_raw)
level2_normalized <- normalize_by_gp_max(level2_raw)
raw_limit <- max(c(organ_raw, level2_raw))

organ_raw_filtered <- filter_raw_mean_matrix(organ_raw, raw_mean_cutoff)
level2_raw_filtered <- filter_raw_mean_matrix(level2_raw, raw_mean_cutoff)
organ_normalized_filtered <- organ_normalized[
  rownames(organ_raw_filtered),
  colnames(organ_raw_filtered),
  drop = FALSE
]
level2_normalized_filtered <- level2_normalized[
  rownames(level2_raw_filtered),
  colnames(level2_raw_filtered),
  drop = FALSE
]
organ_order <- dominant_group_order(organ_raw_filtered)
level2_order <- dominant_group_order(level2_raw_filtered)

stopifnot(
  identical(dimnames(organ_raw_filtered), dimnames(organ_normalized_filtered)),
  identical(dimnames(level2_raw_filtered), dimnames(level2_normalized_filtered)),
  all(apply(organ_raw_filtered, 1L, max) >= raw_mean_cutoff),
  all(apply(level2_raw_filtered, 1L, max) >= raw_mean_cutoff)
)

organ_palette <- palette_for_groups(
  colnames(organ_raw_filtered),
  ZemmourLib::immgent_colors$organ_simplified,
  "organ_simplified"
)
level2_palette <- palette_for_groups(
  colnames(level2_raw_filtered),
  ZemmourLib::immgent_colors$level2,
  "annotation_level2"
)
(a) Tissue mean loading
Both alternatives retain the same 31 GPs and 18
organ_simplified tissues. GPs are retained only when a
tissue has raw mean loading >= 0.1; the dominant-group order is
calculated on that filtered raw matrix. The normalized values are
calculated before filtering, so each displayed GP has a raw mean maximum
of at least 0.1.
Raw mean loading
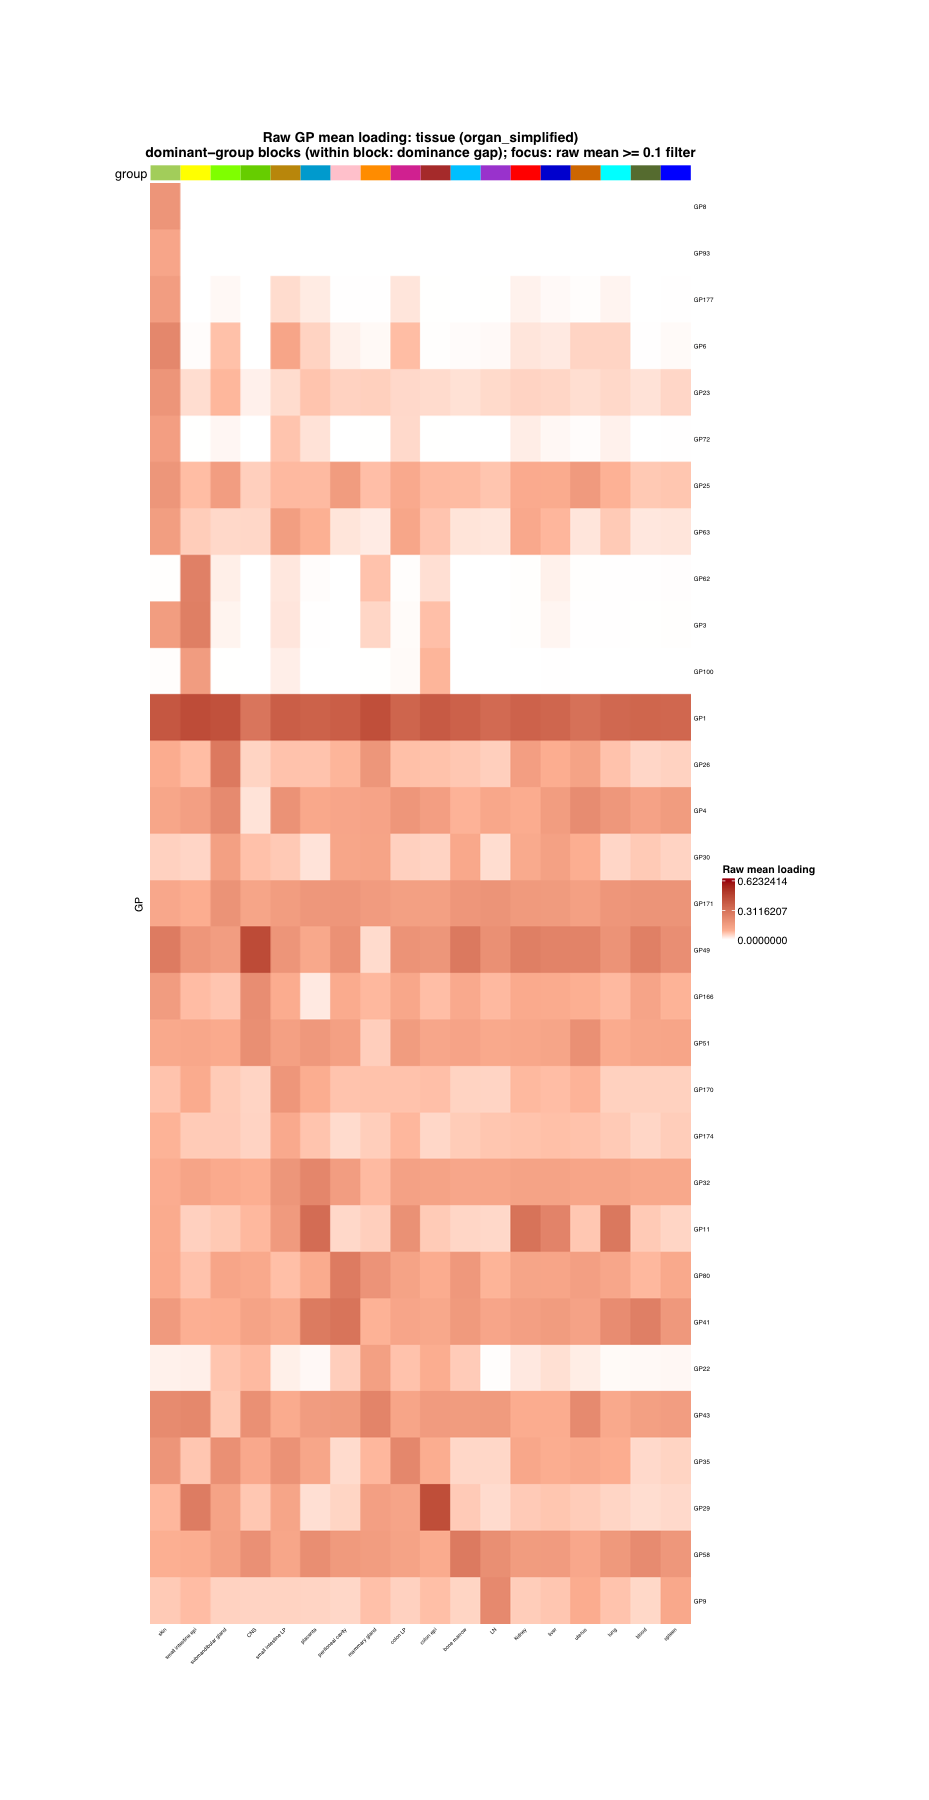
Fig. S4a, raw alternative. Mean GP loading across healthy non-thymocyte tissues. Rows and columns follow dominant-group blocks: each GP is assigned to the tissue with its largest raw mean loading; tissues are ordered by their number of dominant GPs, and GPs within a block by dominance gap.
Within-GP normalized mean loading
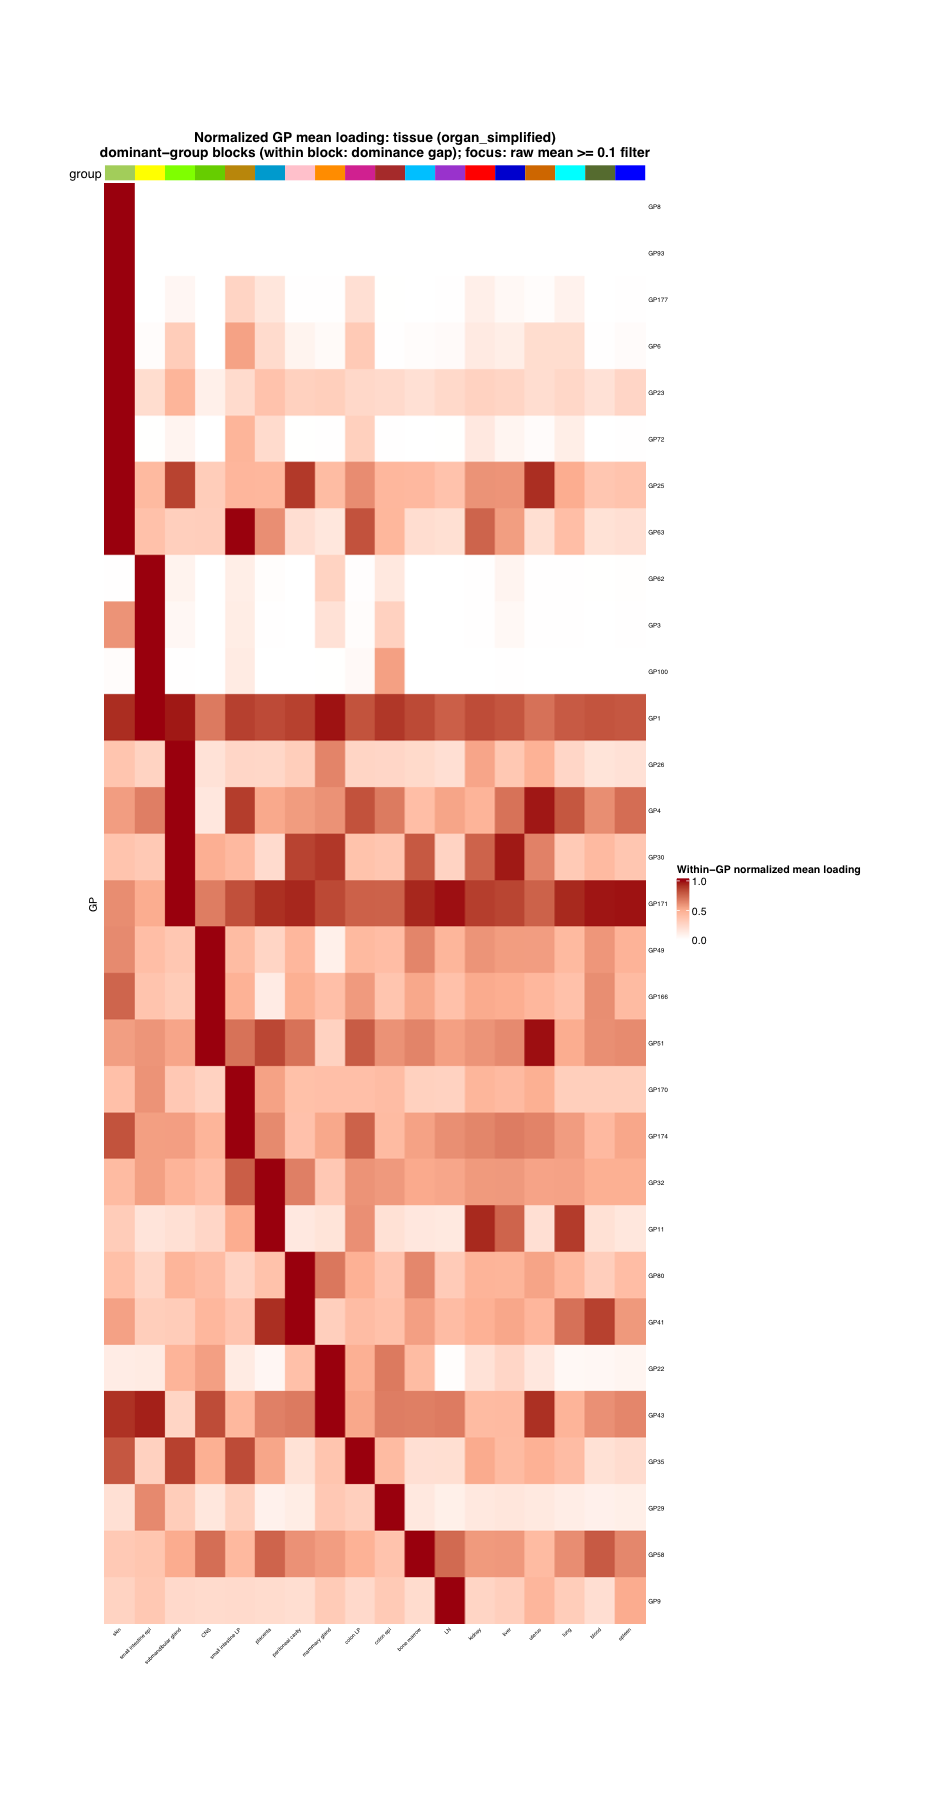
Fig. S4a, normalized alternative. The same retained GPs, tissues, and dominant-group order as the raw view, with each GP divided by its largest raw tissue mean before filtering. This view emphasizes relative tissue preference.
(b) Level2 mean loading
Both alternatives retain the same 64 GPs and 107
annotation_level2 clusters. The same raw-mean cutoff and
dominant-group ordering rule are used as in panel (a). Every displayed
GP has a raw mean maximum of at least 0.1.
Raw mean loading
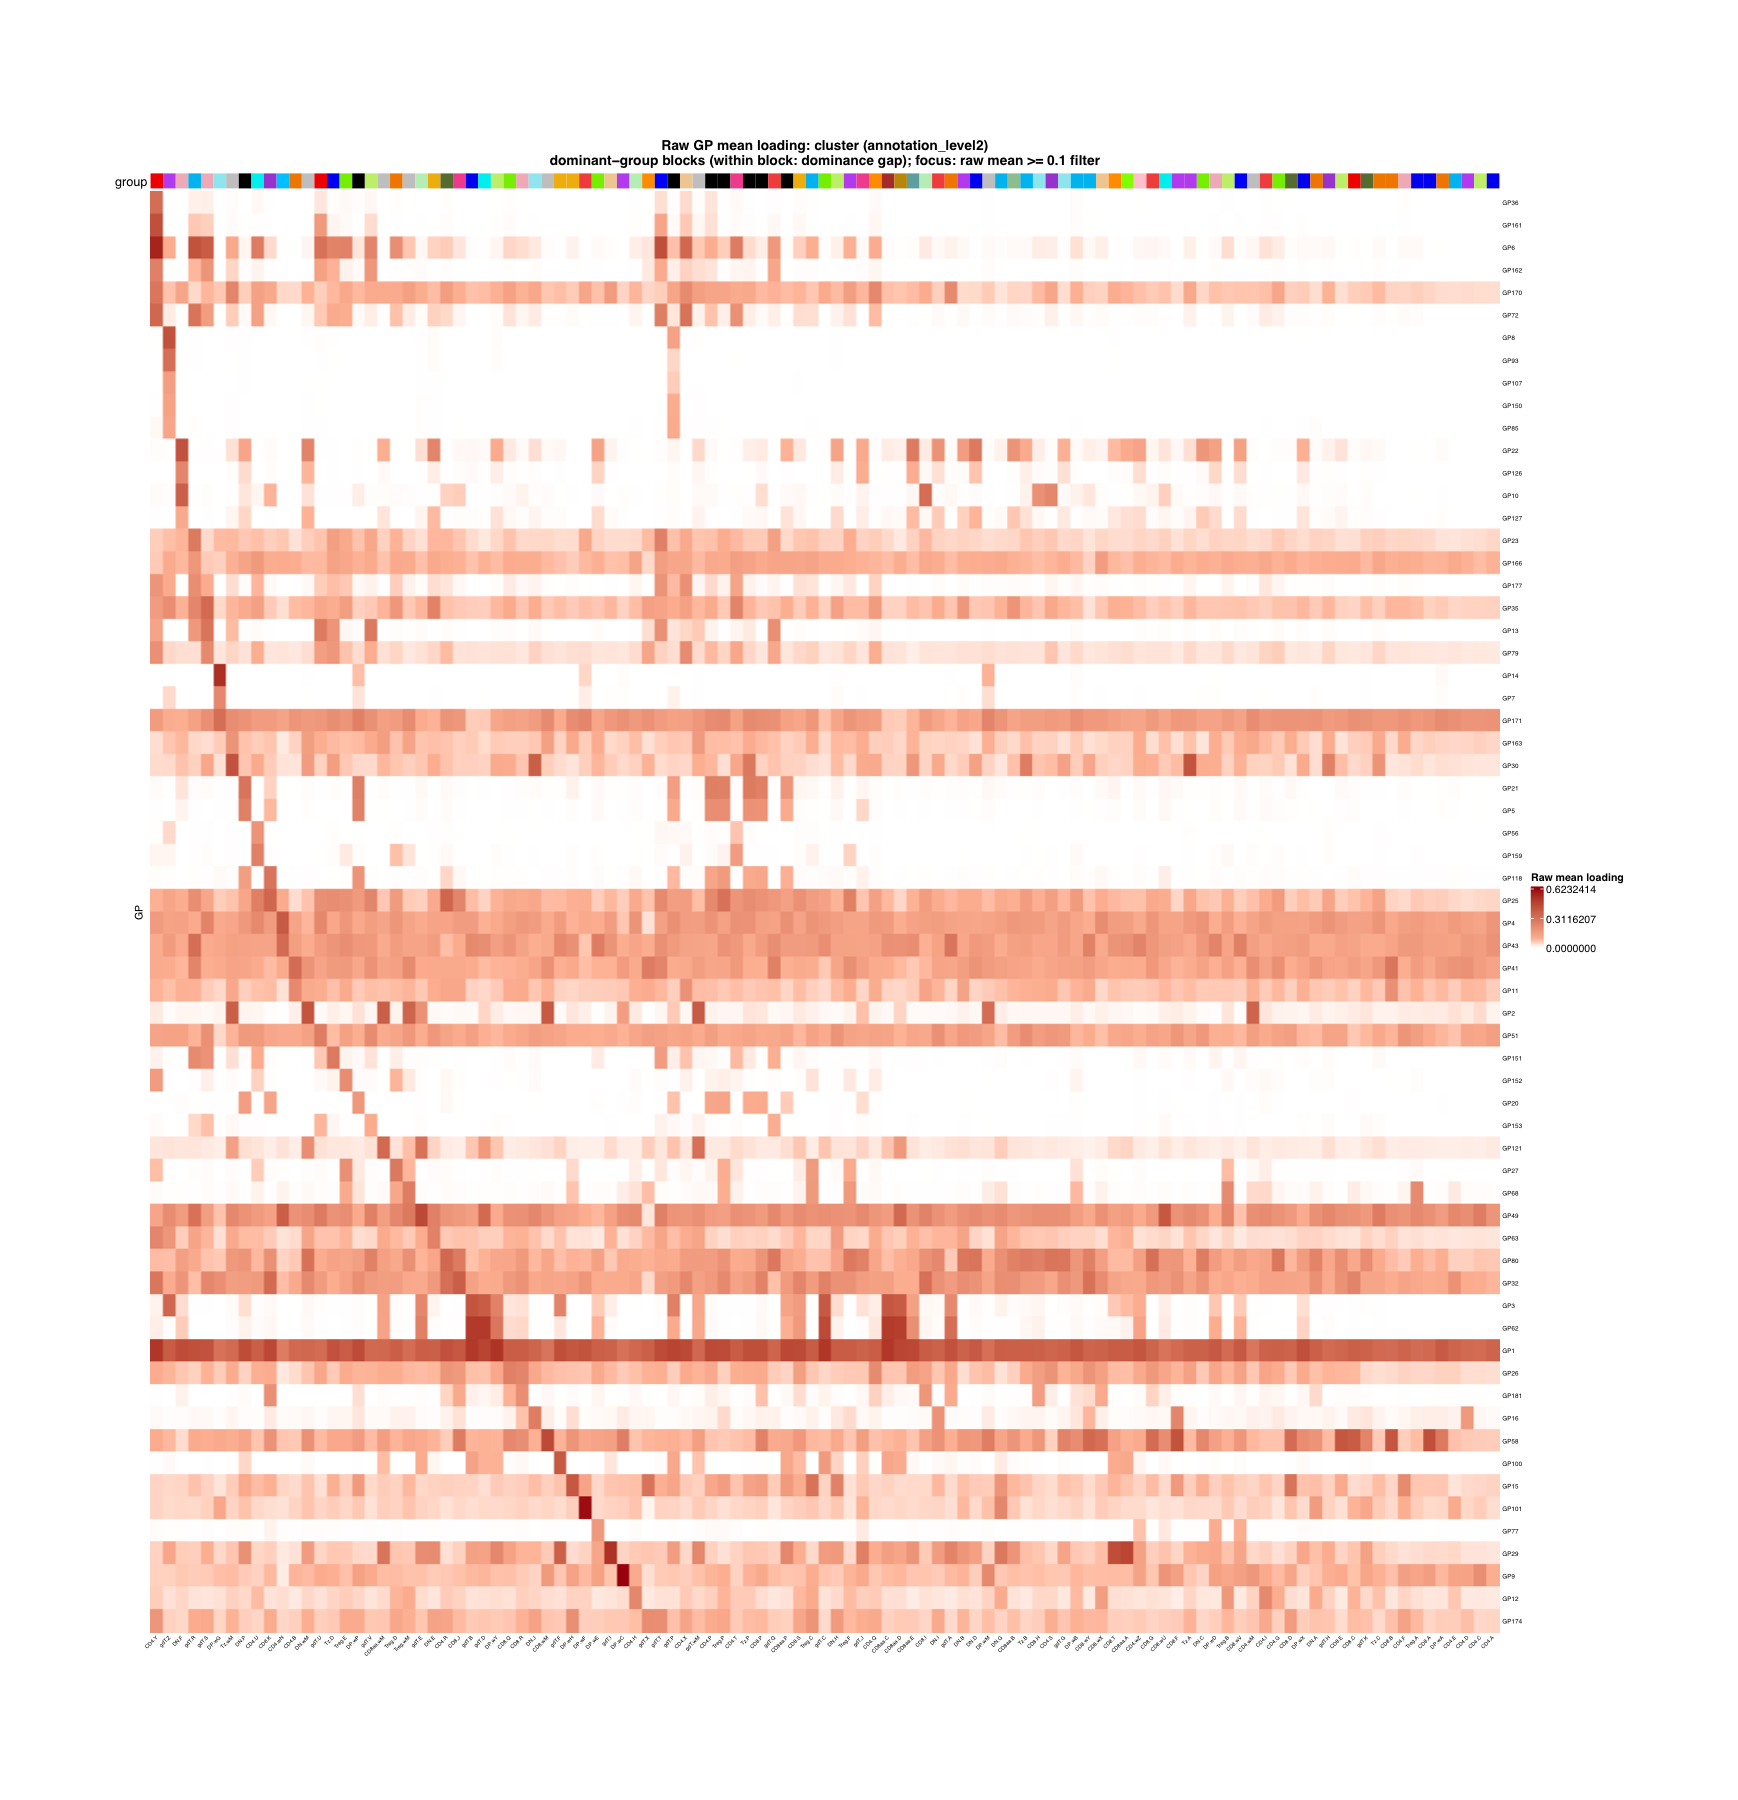
Fig. S4b, raw alternative. Mean GP loading across healthy non-thymocyte level2 clusters. Clusters and GPs use the filtered dominant-group order.
Within-GP normalized mean loading
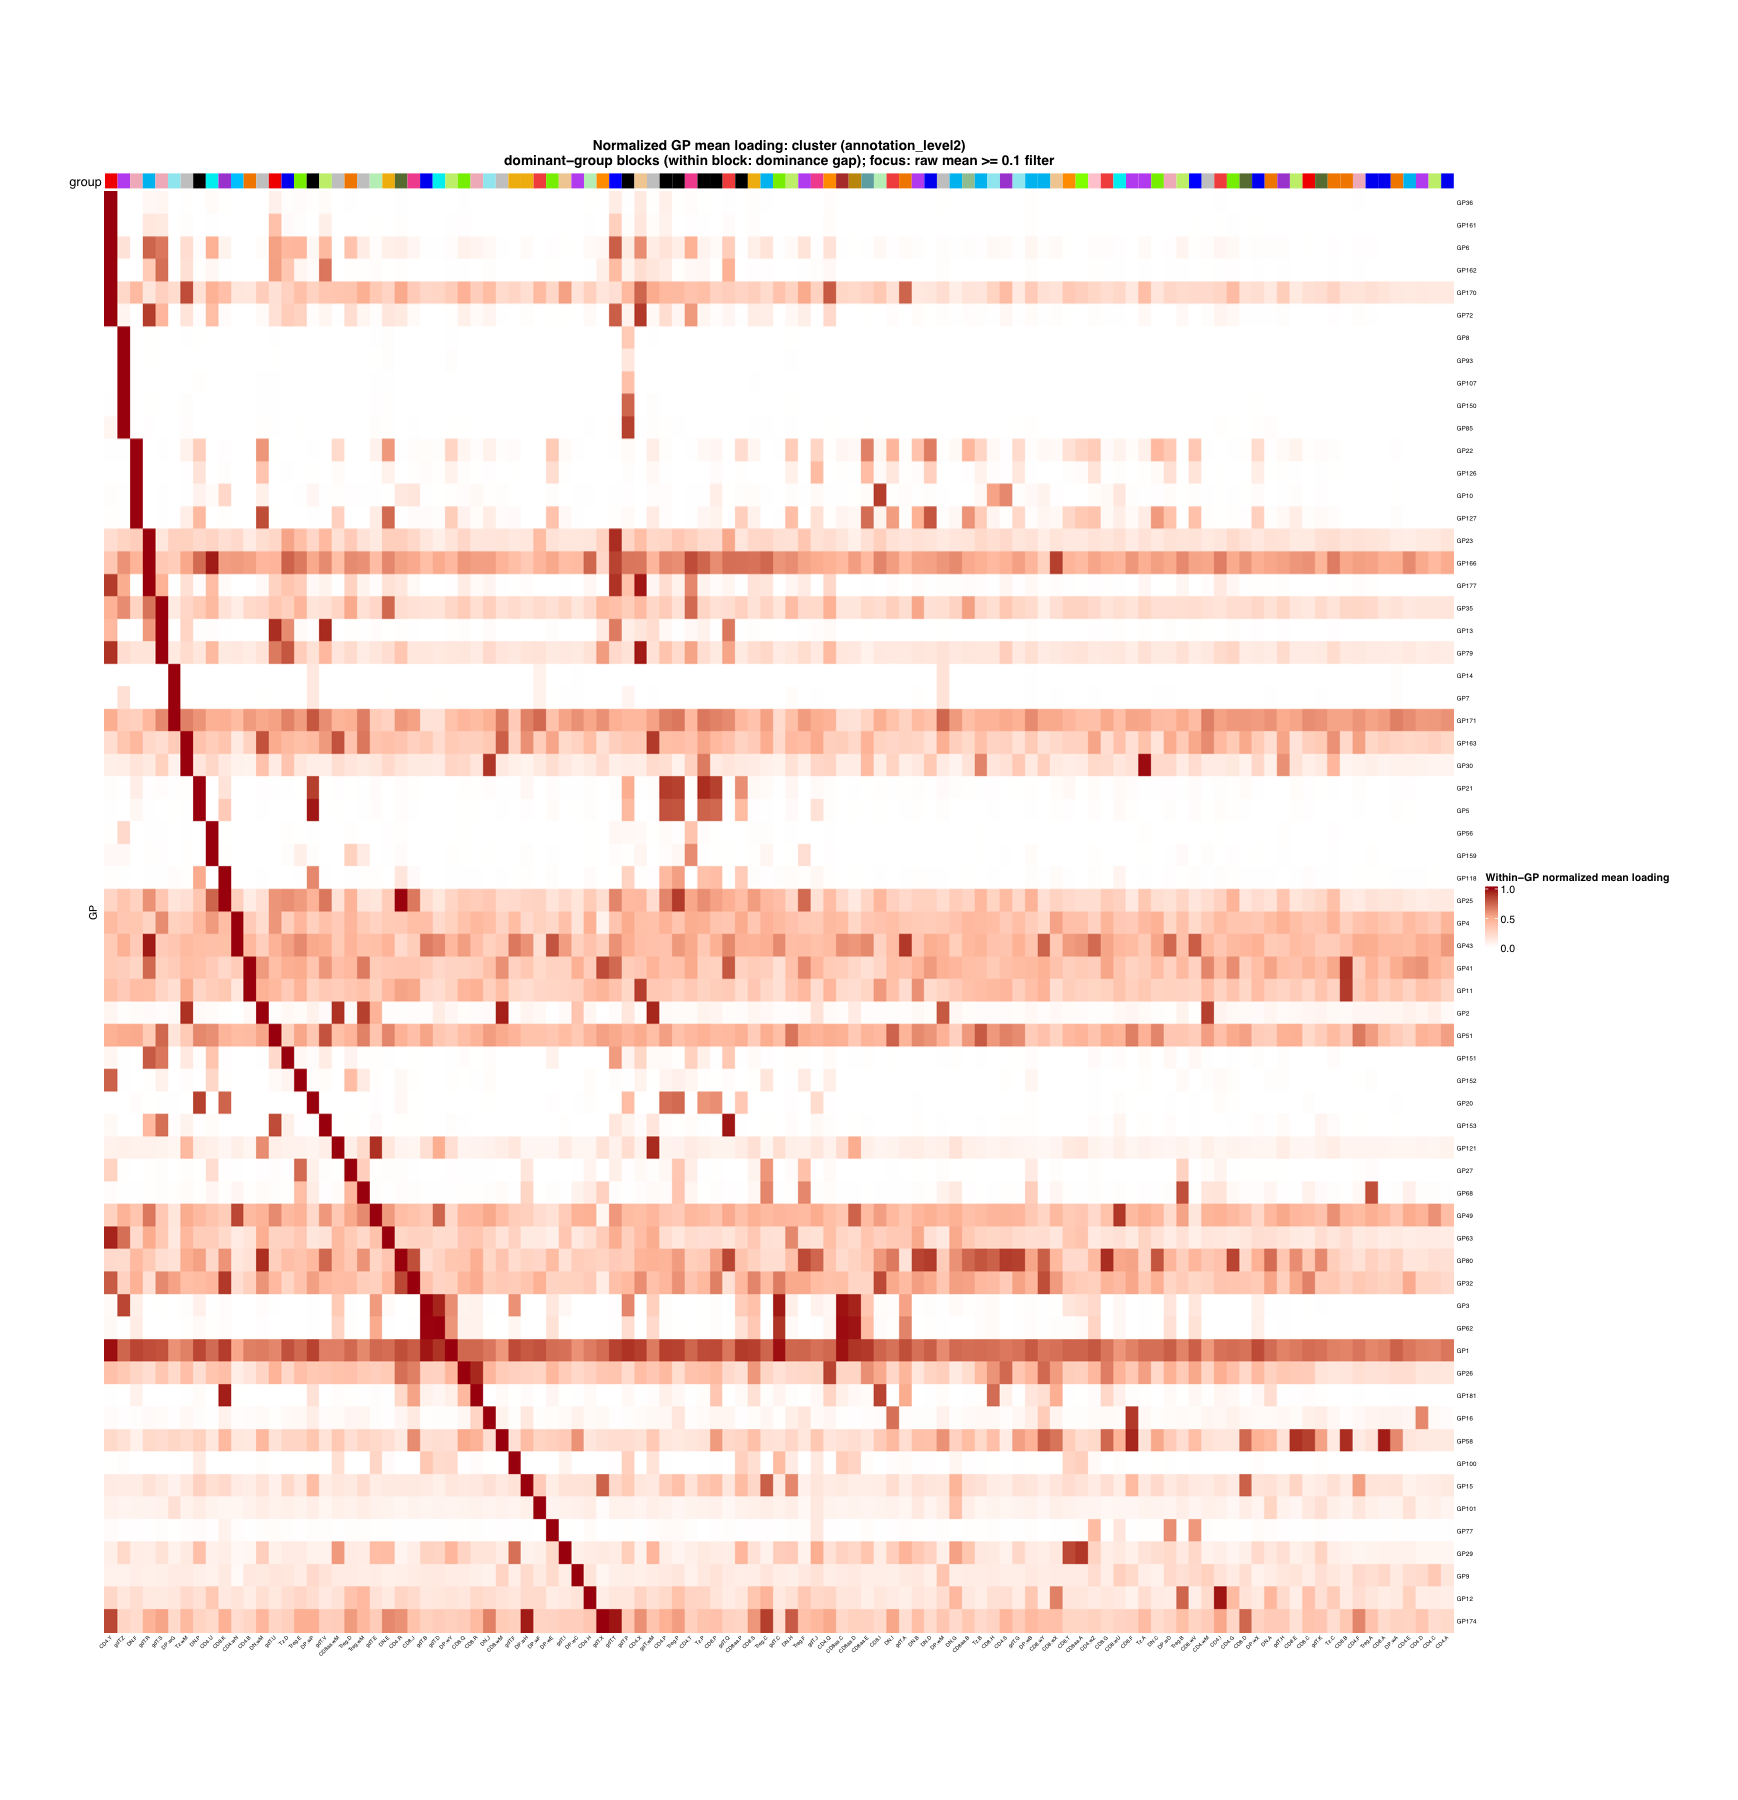
Fig. S4b, normalized alternative. The same retained GPs, level2 clusters, and dominant-group order as the raw view, with within-GP normalization applied before filtering.
Panel rendering
render_heatmap(
  organ_raw_filtered,
  organ_palette,
  "tissue (organ_simplified)",
  "Raw mean loading",
  file.path(figure_path, "S4a_raw_mean_loading.pdf"),
  raw_limit,
  organ_order$row_order,
  organ_order$column_order,
  raw_mean_cutoff
)
render_heatmap(
  organ_normalized_filtered,
  organ_palette,
  "tissue (organ_simplified)",
  "Within-GP normalized mean loading",
  file.path(figure_path, "S4a_normalized_mean_loading.pdf"),
  raw_limit,
  organ_order$row_order,
  organ_order$column_order,
  raw_mean_cutoff
)
render_heatmap(
  level2_raw_filtered,
  level2_palette,
  "cluster (annotation_level2)",
  "Raw mean loading",
  file.path(figure_path, "S4b_raw_mean_loading.pdf"),
  raw_limit,
  level2_order$row_order,
  level2_order$column_order,
  raw_mean_cutoff
)
render_heatmap(
  level2_normalized_filtered,
  level2_palette,
  "cluster (annotation_level2)",
  "Within-GP normalized mean loading",
  file.path(figure_path, "S4b_normalized_mean_loading.pdf"),
  raw_limit,
  level2_order$row_order,
  level2_order$column_order,
  raw_mean_cutoff
)

write.csv(
  data.frame(
    panel = c("S4a", "S4b"),
    grouping = c("organ_simplified", "annotation_level2"),
    raw_mean_cutoff = raw_mean_cutoff,
    full_gp_count = c(nrow(organ_raw), nrow(level2_raw)),
    retained_gp_count = c(nrow(organ_raw_filtered), nrow(level2_raw_filtered)),
    full_group_count = c(ncol(organ_raw), ncol(level2_raw)),
    retained_group_count = c(ncol(organ_raw_filtered), ncol(level2_raw_filtered))
  ),
  file.path(figure_path, "S4_filter_summary.csv"),
  row.names = FALSE,
  quote = FALSE
)

message("Wrote Figure S4 heatmaps to ", normalizePath(figure_path))
sessionInfo()R version 4.5.1 (2025-06-13)
Platform: aarch64-apple-darwin20
Running under: macOS Sequoia 15.6.1
Matrix products: default
BLAS: /System/Library/Frameworks/Accelerate.framework/Versions/A/Frameworks/vecLib.framework/Versions/A/libBLAS.dylib
LAPACK: /Library/Frameworks/R.framework/Versions/4.5-arm64/Resources/lib/libRlapack.dylib; LAPACK version 3.12.1
locale:
[1] C.UTF-8/C.UTF-8/C.UTF-8/C/C.UTF-8/C.UTF-8
time zone: Asia/Shanghai
tzcode source: internal
attached base packages:
[1] stats graphics grDevices utils datasets methods base
loaded via a namespace (and not attached):
[1] vctrs_0.7.3 cli_3.6.6 knitr_1.50 rlang_1.2.0
[5] xfun_0.55 stringi_1.8.7 otel_0.2.0 promises_1.5.0
[9] jsonlite_2.0.0 workflowr_1.7.2 glue_1.8.1 rprojroot_2.1.1
[13] git2r_0.36.2 htmltools_0.5.9 httpuv_1.6.16 sass_0.4.10
[17] rmarkdown_2.30 evaluate_1.0.5 jquerylib_0.1.4 tibble_3.3.0
[21] fastmap_1.2.0 yaml_2.3.12 lifecycle_1.0.5 stringr_1.6.0
[25] compiler_4.5.1 fs_1.6.6 Rcpp_1.1.1-1.1 pkgconfig_2.0.3
[29] later_1.4.4 digest_0.6.39 R6_2.6.1 pillar_1.11.1
[33] magrittr_2.0.5 bslib_0.9.0 tools_4.5.1 cachem_1.1.0