Figure 5: GPs and tissue
Ziang Zhang
Last updated: 2026-07-17
Checks: 6 1
Knit directory:
immgenT-GP-analysis/analysis/
This reproducible R Markdown analysis was created with workflowr (version 1.7.2). The Checks tab describes the reproducibility checks that were applied when the results were created. The Past versions tab lists the development history.
The R Markdown file has unstaged changes. To know which version of
the R Markdown file created these results, you’ll want to first commit
it to the Git repo. If you’re still working on the analysis, you can
ignore this warning. When you’re finished, you can run
wflow_publish to commit the R Markdown file and build the
HTML.
Great job! The global environment was empty. Objects defined in the global environment can affect the analysis in your R Markdown file in unknown ways. For reproduciblity it’s best to always run the code in an empty environment.
The command set.seed(1) was run prior to running the
code in the R Markdown file. Setting a seed ensures that any results
that rely on randomness, e.g. subsampling or permutations, are
reproducible.
Great job! Recording the operating system, R version, and package versions is critical for reproducibility.
Nice! There were no cached chunks for this analysis, so you can be confident that you successfully produced the results during this run.
Great job! Using relative paths to the files within your workflowr project makes it easier to run your code on other machines.
Great! You are using Git for version control. Tracking code development and connecting the code version to the results is critical for reproducibility.
The results in this page were generated with repository version 3577da1. See the Past versions tab to see a history of the changes made to the R Markdown and HTML files.
Note that you need to be careful to ensure that all relevant files for
the analysis have been committed to Git prior to generating the results
(you can use wflow_publish or
wflow_git_commit). workflowr only checks the R Markdown
file, but you know if there are other scripts or data files that it
depends on. Below is the status of the Git repository when the results
were generated:
Ignored files:
    Ignored:    .DS_Store
    Ignored:    .claude/
    Ignored:    analysis/.DS_Store
    Ignored:    analysis/.Rhistory
    Ignored:    analysis/assets/.DS_Store
    Ignored:    analysis/site_libs/
    Ignored:    code/.DS_Store
    Ignored:    data
    Ignored:    experiments/.DS_Store
    Ignored:    figures/.DS_Store
    Ignored:    figures/final-selected/.DS_Store
    Ignored:    figures/final-selected/bits/.DS_Store
    Ignored:    figures/final-selected/bits/Figure 1/.DS_Store
    Ignored:    figures/final-selected/bits/Figure 2/.DS_Store
    Ignored:    figures/final-selected/bits/Figure 3/.DS_Store
    Ignored:    figures/final-selected/bits/Figure 4/.DS_Store
    Ignored:    figures/final-selected/bits/Figure 6/.DS_Store
    Ignored:    figures/final-selected/bits/Figure 7/.DS_Store
    Ignored:    figures/final-selected/bits/Figure S1/.DS_Store
    Ignored:    figures/final-selected/bits/Figure S2/.DS_Store
    Ignored:    figures/final-selected/bits/Figure S3/.DS_Store
    Ignored:    figures/final-selected/bits/Figure S6/.DS_Store
    Ignored:    figures/final-selected/bits/Figure S7/.DS_Store
    Ignored:    figures/generated/.DS_Store
    Ignored:    figures/generated/Figure 1/.DS_Store
    Ignored:    figures/generated/Figure 2/.DS_Store
    Ignored:    tmp/

Untracked files:
    Untracked:  code/other/topic_flashier_20250212.R
    Untracked:  code/other/topic_wrapper_20250215_alldata_backfit.sh
    Untracked:  experiments/active_metric_comparison/
    Untracked:  experiments/figure6b_sparsity_ordered/
    Untracked:  experiments/gene_umap_gp_space/
    Untracked:  experiments/protein_threshold_gp_loading_diff/
    Untracked:  experiments/surface_protein_activation_scatter/
    Untracked:  figures/generated/Figure 1/1B.pdf
    Untracked:  figures/generated/Figure 3/3A.pdf
    Untracked:  figures/generated/Figure 3/3B.pdf
    Untracked:  figures/generated/Figure 3/3H.pdf
    Untracked:  figures/generated/Figure 3/3I.pdf
    Untracked:  figures/generated/Figure 3/3J.pdf
    Untracked:  figures/generated/Figure 3/3K.pdf
    Untracked:  figures/generated/Figure 3/3L.pdf
    Untracked:  figures/generated/Figure 3/3M.pdf
    Untracked:  figures/generated/Figure 4/4f.pdf
    Untracked:  figures/generated/Figure 4/4g.pdf
    Untracked:  figures/generated/Figure 5/
    Untracked:  figures/generated/Figure 6/6a.pdf
    Untracked:  figures/generated/Figure 7/
    Untracked:  log/2026-07-13-surface-protein-activation-scatter.md
    Untracked:  log/2026-07-15-protein-threshold-gp-loading-diff-tables.md
    Untracked:  plan/2026-07-13-active-cell-gene-metrics-exploration.md
    Untracked:  plan/2026-07-13-surface-protein-activation-scatter.md
    Untracked:  plan/2026-07-13_figure6b_triangular_order_plan.md
    Untracked:  plan/2026-07-13_figure6b_wide_gp_columns_formal_plan.md
    Untracked:  plan/2026-07-14_figure6b_heatmap_typography_plan.md
    Untracked:  plan/2026-07-15-protein-threshold-gp-loading-diff-tables.md
    Untracked:  tables/

Unstaged changes:
    Modified:   analysis/Figure5.Rmd
    Modified:   analysis/Methods_FlashierFit.Rmd
    Modified:   analysis/assets/Figure5/5c.png
    Modified:   figures/generated/Figure 1/1A.pdf
    Modified:   figures/generated/Figure 1/1C.pdf
    Modified:   figures/generated/Figure 1/1D.pdf
    Deleted:    figures/generated/Figure 1/1E.pdf
    Deleted:    figures/generated/Figure 1/1F.pdf
    Deleted:    figures/generated/Figure 1/1G.pdf
    Deleted:    figures/generated/Figure 1/1H.pdf
    Deleted:    figures/generated/Figure 1/1I.pdf
    Deleted:    figures/generated/Figure 1/hist_active_cells_per_GP.pdf
    Deleted:    figures/generated/Figure 1/hist_active_genes_prop_per_GP.pdf
    Deleted:    figures/generated/Figure 1/scatter_e_active_cells_vs_genes.pdf
    Modified:   figures/generated/Figure 2/2A.pdf
    Modified:   figures/generated/Figure 2/2B.pdf
    Modified:   figures/generated/Figure 2/2C.pdf
    Modified:   figures/generated/Figure 2/2D.pdf
    Modified:   figures/generated/Figure 2/2E.pdf
    Modified:   figures/generated/Figure 2/2F.pdf
    Deleted:    figures/generated/Figure 2/2G.pdf
    Deleted:    figures/generated/Figure 2/2H.pdf
    Deleted:    figures/generated/Figure 2/2I.pdf
    Deleted:    figures/generated/Figure 2/2J.pdf
    Deleted:    figures/generated/Figure 2/2K.pdf
    Deleted:    figures/generated/Figure 2/2L.pdf
    Deleted:    figures/generated/Figure 2/2M.pdf
    Modified:   figures/generated/Figure 3/3c.pdf
    Modified:   figures/generated/Figure 3/3d.pdf
    Modified:   figures/generated/Figure 3/3e.pdf
    Modified:   figures/generated/Figure 3/3f.pdf
    Modified:   figures/generated/Figure 3/3g.pdf
    Deleted:    figures/generated/Figure 4/4a.pdf
    Deleted:    figures/generated/Figure 4/4b.pdf
    Modified:   figures/generated/Figure 4/4c.pdf
    Modified:   figures/generated/Figure 4/4d.pdf
    Modified:   figures/generated/Figure 4/4e.pdf
    Modified:   figures/generated/Figure S1/S1A.pdf
    Modified:   figures/generated/Figure S1/S1B.pdf
    Modified:   figures/generated/Figure S1/S1C.pdf
    Modified:   figures/generated/Figure S1/S1D.pdf
    Modified:   figures/generated/Figure S1/S1E.pdf
    Modified:   script/Figure5.R
Note that any generated files, e.g. HTML, png, CSS, etc., are not included in this status report because it is ok for generated content to have uncommitted changes.
These are the previous versions of the repository in which changes were
made to the R Markdown (analysis/Figure5.Rmd) and HTML
(docs/Figure5.html) files. If you’ve configured a remote
Git repository (see ?wflow_git_remote), click on the
hyperlinks in the table below to view the files as they were in that
past version.
| File | Version | Author | Date | Message |
|---|---|---|---|---|
| Rmd | 3577da1 | Ziang Zhang | 2026-07-17 | Fig 5c: center-only (no standardization), left panel as heatmap |
| html | 3577da1 | Ziang Zhang | 2026-07-17 | Fig 5c: center-only (no standardization), left panel as heatmap |
| Rmd | 2873ad2 | Ziang Zhang | 2026-07-16 | Unify Fig 3/4/5 panel filenames with new figure numbers |
| html | 2873ad2 | Ziang Zhang | 2026-07-16 | Unify Fig 3/4/5 panel filenames with new figure numbers |
| Rmd | b197499 | Ziang Zhang | 2026-07-16 | Restructure main figures (renumber + split Figure 1) |
| html | b197499 | Ziang Zhang | 2026-07-16 | Restructure main figures (renumber + split Figure 1) |
All panels are produced by script/Figure5.R.
The code below is shown for reference (not re-executed on this page);
the images are its pre-rendered output.
Setup
Data loading, shared across all panels below.
# Figure 5. GPs and tissue.
#
# Panels produced (see figures/final-selected/bits/Figure 5/Figure_Organ_caption.md
# for the full caption text):
#   4a  Max AUC (organ) vs max AUC (level-1 lineage) scatter, per GP.
#   4b  GP37+ rate by lineage, mammary gland vs. the same lineage elsewhere.
#   4c  Marker genes of the 7 organ-specific GPs: expression dotplot across
#       organs (left) + per-GP gene-score heatmap (right), combined.
#   4d  As 4a, but organ AUC vs Level-2 (fine-grained sub-lineage/cluster)
#       AUC, with the 7 organ-specific GPs (red) and a contrasting
#       cluster-specific set (blue) highlighted.
#   4e  Alluvial diagram: organ of origin -> GP -> Level-2 cell type, for
#       GP+ cells of the 7 organ-specific GPs.
#
# Source: ported from Figure_Organ.R, which mixed these 5 panels with
# other exploratory analyses (extra AUC scatter variants, per-organ ROC
# curves, a broken/undefined-object "gp_decomposition.pdf" panel) that are
# dropped here since they don't correspond to a final figure panel.
#
# Required inputs (data/) -- see code/README.md's "Data provenance" table
# for the full picture:
#   L_pm_filtered.rds, F_pm_filtered.rds     [code/pipeline/01b_filter_cells.R]
#   igt1_96_..._ADTonly.Rds                  [primary input Seurat object]
#   shifted_log_counts_subset.rds            [gap, no producer script here]
#   level_1_AUC_list_figure_no_thymocytes_healthy.rds,
#   level_2_AUC_list_figure_no_thymocytes_healthy.rds,
#   organ_simplified_AUC_list_figure_no_thymocytes_healthy.rds
#     [code/pipeline/02_compute_auc.R]

library(ggplot2)
library(ggrepel)
library(patchwork)
library(dplyr)
library(tidyr)
library(purrr)
library(tibble)
library(Matrix)
library(viridis)
library(cowplot)
library(ggalluvial)

data_path <- "data/"
figure_path <- "figures/generated/Figure 5/"

# ============================================================
# Load data (healthy, non-thymocyte reference)
# ============================================================
level_1_AUC_list <- readRDS(paste0(
  data_path, "level_1_AUC_list_figure_no_thymocytes_healthy.rds"
))
level_2_AUC_list <- readRDS(paste0(
  data_path, "level_2_AUC_list_figure_no_thymocytes_healthy.rds"
))
organ_AUC_list <- readRDS(paste0(
  data_path, "organ_simplified_AUC_list_figure_no_thymocytes_healthy.rds"
))
# Read from the Seurat object directly, not the stale cached seurat_meta.rds
# (see code/R/setup_data.R for why).
seurat_meta <- readRDS(paste0(
  data_path, "igt1_96_withtotalvi20260206_clean_ADTonly.Rds"
))@meta.data
L_pm_filtered <- readRDS(paste0(data_path, "L_pm_filtered.rds"))
seurat_meta_filtered <- seurat_meta[rownames(L_pm_filtered), ]

# Rename K## to GP## for display consistency
colnames(L_pm_filtered) <- gsub("^K", "GP", colnames(L_pm_filtered))
colnames(level_1_AUC_list$auc) <- gsub("^K", "GP", colnames(level_1_AUC_list$auc))
colnames(level_2_AUC_list$auc) <- gsub("^K", "GP", colnames(level_2_AUC_list$auc))
colnames(level_2_AUC_list$threshold) <- gsub("^K", "GP", colnames(level_2_AUC_list$threshold))
colnames(organ_AUC_list$auc) <- gsub("^K", "GP", colnames(organ_AUC_list$auc))
colnames(organ_AUC_list$threshold) <- gsub("^K", "GP", colnames(organ_AUC_list$threshold))

# Restrict reference to healthy, non-thymocyte cells
seurat_meta_filtered_no_thymocytes_healthy <- seurat_meta_filtered %>%
  filter(annotation_level1 != "thymocyte", condition_broad == "healthy")

# The 7 organ-specific GPs highlighted throughout this figure (caption 4d/4e)
gps_of_interest <- c("GP3", "GP6", "GP11", "GP26", "GP29", "GP37", "GP177")

# Labels a highlighted point with its top categories above `threshold` AUC.
top_cats_label <- function(factor_name, auc_matrix, positive_mask, threshold = 0.85, n = 3) {
  vals <- auc_matrix[, factor_name]
  vals <- vals[positive_mask[, factor_name]]
  vals <- sort(vals[vals > threshold], decreasing = TRUE)
  cats <- names(vals)[seq_len(min(n, length(vals)))]
  if (length(cats) == 0) return(factor_name)
  paste0(factor_name, ":\n", paste(cats, collapse = "\n"))
}

# ============================================================
# 4a: Max AUC Organ vs Level-1
(a) Max AUC: organ vs. lineage
# ============================================================
level_1_small_count <- table(seurat_meta_filtered_no_thymocytes_healthy$annotation_level1)
level_1_small_count <- names(level_1_small_count[level_1_small_count < 1000])
level_1_AUC <- level_1_AUC_list$auc
level_1_AUC <- level_1_AUC[!rownames(level_1_AUC) %in% level_1_small_count, ]

organ_AUC <- organ_AUC_list$auc
organ_small_count <- table(seurat_meta_filtered_no_thymocytes_healthy$organ_simplified)
organ_small_count <- names(organ_small_count[organ_small_count < 100])
organ_AUC <- organ_AUC[!rownames(organ_AUC) %in% organ_small_count, ]

# Positivity masks: mean loading in category > overall mean -> high loading predicts membership
healthy_cells <- rownames(seurat_meta_filtered_no_thymocytes_healthy)
L_healthy <- L_pm_filtered[healthy_cells, ]
overall_mean <- colMeans(L_healthy, na.rm = TRUE)

level_1_cat_mean <- t(sapply(rownames(level_1_AUC), function(cat) {
  idx <- seurat_meta_filtered_no_thymocytes_healthy$annotation_level1 == cat
  colMeans(L_healthy[idx, , drop = FALSE], na.rm = TRUE)
}))
level_1_AUC_positive <- sweep(level_1_cat_mean, 2, overall_mean, "-") > 0

organ_cat_mean <- t(sapply(rownames(organ_AUC), function(cat) {
  idx <- seurat_meta_filtered_no_thymocytes_healthy$organ_simplified == cat
  colMeans(L_healthy[idx, , drop = FALSE], na.rm = TRUE)
}))
organ_AUC_positive <- sweep(organ_cat_mean, 2, overall_mean, "-") > 0

level_1_AUC_masked <- level_1_AUC
level_1_AUC_masked[!level_1_AUC_positive] <- NA
level_1_AUC_max <- apply(level_1_AUC_masked, 2, max, na.rm = TRUE)
level_1_AUC_max_name <- apply(level_1_AUC_masked, 2, function(x) rownames(level_1_AUC_masked)[which.max(x)])
o <- order(level_1_AUC_max, decreasing = TRUE)
table_level_1_AUC <- data.frame(
  Factor = colnames(level_1_AUC)[o], Max_AUC = level_1_AUC_max[o], Annotation = level_1_AUC_max_name[o]
)

organ_AUC_masked <- organ_AUC
organ_AUC_masked[!organ_AUC_positive] <- NA
organ_AUC_max <- apply(organ_AUC_masked, 2, max, na.rm = TRUE)
organ_AUC_max_name <- apply(organ_AUC_masked, 2, function(x) rownames(organ_AUC_masked)[which.max(x)])

max_AUC_df <- data.frame(
  Factor = table_level_1_AUC$Factor,
  annotation_Level1 = table_level_1_AUC$Annotation,
  annotation_Organ = organ_AUC_max_name[match(table_level_1_AUC$Factor, names(organ_AUC_max))],
  Max_AUC_Organ = organ_AUC_max[match(table_level_1_AUC$Factor, names(organ_AUC_max))],
  Max_AUC_Level1 = table_level_1_AUC$Max_AUC
)
df <- max_AUC_df %>% mutate(residual = Max_AUC_Level1 - Max_AUC_Organ, abs_res = abs(residual))

# Factors to highlight: AUC > 0.9 in at least one axis (organ or level-1)
highlighted_factors <- df %>%
  filter(is.finite(residual), Max_AUC_Organ > 0.9 | Max_AUC_Level1 > 0.9) %>%
  pull(Factor)

label_above <- df %>%
  filter(Factor %in% highlighted_factors, residual > 0) %>%
  mutate(nudge_x = -0.035, label_text = sapply(Factor, top_cats_label, auc_matrix = level_1_AUC, positive_mask = level_1_AUC_positive))
label_below <- df %>%
  filter(Factor %in% highlighted_factors, residual <= 0) %>%
  mutate(nudge_x = 0.035, label_text = sapply(Factor, top_cats_label, auc_matrix = organ_AUC, positive_mask = organ_AUC_positive))

p_4a <- ggplot(df, aes(Max_AUC_Organ, Max_AUC_Level1)) +
  geom_point(alpha = 0.3, size = 1.8) +
  geom_point(data = label_above, color = "#1f78b4", alpha = 0.8, size = 1.8) +
  geom_point(data = label_below, color = "#e31a1c", alpha = 0.8, size = 1.8) +
  geom_abline(slope = 1, intercept = 0, linetype = "dashed", color = "black") +
  coord_cartesian(xlim = c(0.46, 1.04), ylim = c(0.5, 1.02), expand = FALSE) +
  labs(x = "Max AUC (Organ Simplified)", y = "Max AUC (Level-1)", title = "Max AUC: Organ vs Level-1") +
  theme_minimal(base_size = 13) +
  geom_text_repel(
    data = label_above, aes(label = label_text), color = "#1f78b4", size = 2.5, lineheight = 0.85,
    direction = "y", nudge_x = label_above$nudge_x, segment.color = "#1f78b4",
    arrow = arrow(length = unit(0.008, "npc"), type = "closed", angle = 20),
    force = 3, force_pull = 0.1, box.padding = 0.4, point.padding = 0.15,
    max.time = 10, max.iter = 2e4, max.overlaps = 20, min.segment.length = 0.01, segment.alpha = 0.7
  ) +
  geom_text_repel(
    data = label_below, aes(label = label_text), color = "#e31a1c", size = 2.5, lineheight = 0.85,
    direction = "y", nudge_x = label_below$nudge_x, segment.color = "#e31a1c",
    arrow = arrow(length = unit(0.008, "npc"), type = "closed", angle = 20),
    force = 3, force_pull = 0.1, box.padding = 0.4, point.padding = 0.15,
    max.time = 10, max.iter = 2e4, max.overlaps = 20, min.segment.length = 0.01, segment.alpha = 0.7
  )
ggsave(filename = paste0(figure_path, "5a.pdf"), plot = p_4a, width = 8, height = 8, dpi = 300)

# ============================================================
# 4d prep: Max AUC Organ vs Level-2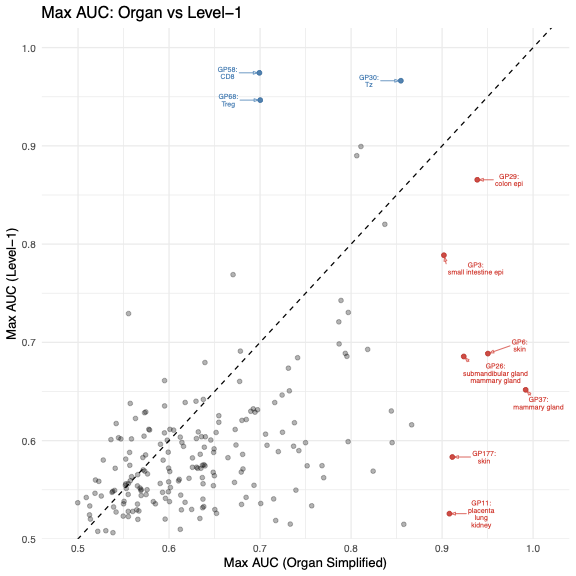
| Version | Author | Date |
|---|---|---|
| 2873ad2 | Ziang Zhang | 2026-07-16 |
Fig. 5a. Per-GP maximum AUC for predicting organ of origin (x-axis) versus lineage (y-axis); each point is one GP and the dashed line marks equal performance. Categories with too few cells are dropped (lineage < 1,000 cells, organ < 100 cells). GPs reaching AUC > 0.9 on either axis are highlighted – red below the diagonal (better at organ; organ-specific) labeled with their top organs, blue above the diagonal (better at lineage) labeled with their top lineages (up to three categories each, AUC > 0.85).
(b) GP37+ rate in mammary gland vs. elsewhere
# ============================================================
plot_gp_threshold_group_activation_rate <- function(
  gp, organ, threshold, loading_mat, organ_info, group_info,
  group_label = "Level-2", base_size = 13, min_in_organ = 10,
  group_colors = ZemmourLib::immgent_colors$level2, fallback_group_color = "grey60",
  reference = c("not_in_group", "not_in_organ")
) {
  reference <- match.arg(reference)
  if (!gp %in% colnames(loading_mat)) stop(sprintf("GP '%s' not found in loading matrix.", gp))
  if (!organ %in% organ_info) stop(sprintf("Organ '%s' not found in organ_info.", organ))

  loading <- loading_mat[, gp]
  keep <- !(is.na(loading) | is.na(organ_info) | is.na(group_info))
  loading <- loading[keep]
  organ_info <- organ_info[keep]
  group_info <- as.character(group_info[keep])

  in_organ <- organ_info == organ
  positive <- loading > threshold
  group_levels <- sort(unique(group_info))

  rate_df <- data.frame(
    group = group_levels,
    n_in_organ = vapply(group_levels, function(l) sum(group_info == l & in_organ), integer(1)),
    n_pos_in_organ = vapply(group_levels, function(l) sum(group_info == l & in_organ & positive), integer(1))
  )

  if (reference == "not_in_group") {
    rate_df$n_ref <- vapply(group_levels, function(l) sum(group_info != l & in_organ), integer(1))
    rate_df$n_pos_ref <- vapply(group_levels, function(l) sum(group_info != l & in_organ & positive), integer(1))
    ref_label <- "Not in group (same organ)"
    title_vs <- sprintf("%s vs. same-organ non-group", organ)
  } else {
    rate_df$n_ref <- vapply(group_levels, function(l) sum(group_info == l & !in_organ), integer(1))
    rate_df$n_pos_ref <- vapply(group_levels, function(l) sum(group_info == l & !in_organ & positive), integer(1))
    ref_label <- "Not in organ (same group)"
    title_vs <- sprintf("%s vs. same-group non-organ", organ)
  }

  rate_df$rate_in_organ <- rate_df$n_pos_in_organ / rate_df$n_in_organ
  rate_df$rate_ref <- rate_df$n_pos_ref / rate_df$n_ref
  rate_df <- rate_df[rate_df$n_in_organ >= min_in_organ, , drop = FALSE]
  if (nrow(rate_df) == 0) stop(sprintf("No %s type has >= %d cells in '%s'.", group_label, min_in_organ, organ))

  long_df <- data.frame(
    group = rep(rate_df$group, 2),
    type = factor(rep(c("In organ", ref_label), each = nrow(rate_df)), levels = c("In organ", ref_label)),
    rate = c(rate_df$rate_in_organ, rate_df$rate_ref)
  )
  level_order <- rate_df$group[order(rate_df$rate_in_organ, decreasing = TRUE)]
  long_df$group <- factor(long_df$group, levels = level_order)

  fill_values <- group_colors[as.character(level_order)]
  missing_colors <- is.na(fill_values)
  if (any(missing_colors)) {
    fill_values[missing_colors] <- fallback_group_color
    warning(sprintf(
      "%s annotations missing from group_colors and colored %s: %s",
      group_label, fallback_group_color, paste(level_order[missing_colors], collapse = ", ")
    ))
  }
  alpha_vals <- c(1, 0.35)
  names(alpha_vals) <- c("In organ", ref_label)

  ggplot(long_df, aes(x = group, y = rate, fill = group, alpha = type)) +
    geom_col(position = position_dodge(width = 0.8), width = 0.75, color = "grey35", linewidth = 0.15) +
    scale_fill_manual(values = fill_values, guide = "none") +
    scale_alpha_manual(values = alpha_vals, guide = guide_legend(override.aes = list(fill = "grey40"))) +
    labs(
      x = sprintf("%s annotation", group_label),
      y = sprintf("Proportion of cells with %s > %.3g", gp, threshold),
      alpha = NULL,
      title = sprintf("%s+ rate by %s: %s", gp, group_label, title_vs),
      subtitle = sprintf("threshold = %.3g; %s types with < %d cells in %s dropped", threshold, group_label, min_in_organ, organ)
    ) +
    theme_minimal(base_size = base_size) +
    theme(axis.text.x = element_text(angle = 45, hjust = 1), legend.position = "top")
}

p_4b <- plot_gp_threshold_group_activation_rate(
  gp = "GP37",
  organ = "mammary gland",
  threshold = organ_AUC_list$threshold["mammary gland", "GP37"],
  min_in_organ = 100,
  loading_mat = L_pm_filtered[rownames(seurat_meta_filtered_no_thymocytes_healthy), ],
  organ_info = seurat_meta_filtered_no_thymocytes_healthy$organ_simplified,
  group_info = seurat_meta_filtered_no_thymocytes_healthy$annotation_level1,
  group_label = "Level-1",
  group_colors = ZemmourLib::immgent_colors$level1,
  reference = "not_in_organ"
)
ggsave(filename = paste0(figure_path, "5b.pdf"), plot = p_4b, width = 8, height = 5, dpi = 300)

# ============================================================
# 4e: alluvial, organ -> GP -> Level-2, for GP+ cells of the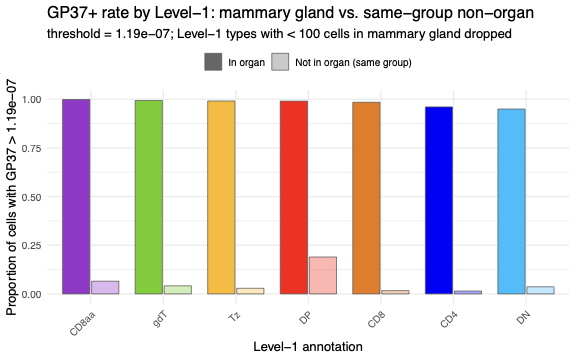
| Version | Author | Date |
|---|---|---|
| 2873ad2 | Ziang Zhang | 2026-07-16 |
Fig. 5b. GP37+ rate by lineage in mammary gland versus the same lineage elsewhere. A cell is GP37+ if its GP37 loading exceeds the organ-specific optimal threshold from the AUC analysis. For each lineage, the solid bar is the fraction of mammary-gland cells of that lineage that are GP37+ and the faded bar is the fraction of the same lineage outside mammary gland; bars are colored by lineage and ordered by in-organ rate, and lineages with < 100 cells in mammary gland are dropped.
(c) Marker genes of the 7 organ-specific GPs
#     heatmap, combined
# ============================================================
F_pm_filtered <- readRDS(paste0(data_path, "F_pm_filtered.rds"))
colnames(F_pm_filtered) <- gsub("^F", "GP", colnames(F_pm_filtered))
D_scale <- diag(1 / apply(F_pm_filtered, 2, function(x) max(abs(x), na.rm = TRUE)))
F_pm_scaled <- F_pm_filtered %*% D_scale
colnames(F_pm_scaled) <- colnames(F_pm_filtered)

n_top_genes <- 20
min_loading <- 0.25
F_sub <- F_pm_scaled[, gps_of_interest, drop = FALSE]
selected_genes <- lapply(gps_of_interest, function(gp) {
  vals <- F_sub[, gp]
  names(sort(vals[vals > min_loading], decreasing = TRUE))[seq_len(min(n_top_genes, sum(vals > min_loading)))]
})
selected_genes <- unique(unlist(selected_genes))

# Diagonal gene ordering by dominant GP (highest loading); used by both panels
GP_orders <- c("GP37", "GP26", "GP6", "GP177", "GP3", "GP29", "GP11")
dominant_gp <- apply(F_sub[selected_genes, , drop = FALSE], 1, function(x) GP_orders[which.max(x[GP_orders])])
dominant_loading <- mapply(function(g, gp) F_sub[g, gp], selected_genes, dominant_gp)
gene_order_df <- data.frame(Gene = selected_genes, dominant_gp = factor(dominant_gp, levels = GP_orders), loading = dominant_loading, stringsAsFactors = FALSE)
gene_order_df <- gene_order_df[order(gene_order_df$dominant_gp, -gene_order_df$loading), ]
heatmap_gene_order <- gene_order_df$Gene

expr <- readRDS(paste0(data_path, "shifted_log_counts_subset.rds")) # rows = cells, cols = genes
tissue_order <- c(
  "mammary gland", "submandibular gland", "skin", "small intestine epi", "colon epi",
  "small intestine LP", "colon LP", "peritoneal cavity", "placenta", "liver", "lung",
  "kidney", "spleen", "LN"
)
features <- rev(colnames(expr))
meta_use <- seurat_meta_filtered_no_thymocytes_healthy[rownames(expr), , drop = FALSE]
keep_cells <- meta_use$organ_simplified %in% tissue_order
expr_use <- expr[keep_cells, features, drop = FALSE]
meta_use <- meta_use[keep_cells, , drop = FALSE]
meta_use$organ_simplified <- factor(meta_use$organ_simplified, levels = tissue_order)

# sparse-safe: returns both avg.exp and pct.exp in one pass (matches Seurat DotPlot)
dot_stats <- function(mat) {
  avg_exp <- if (inherits(mat, "sparseMatrix")) {
    mat2 <- mat
    mat2@x <- expm1(mat2@x)
    Matrix::colMeans(mat2)
  } else {
    colMeans(expm1(mat))
  }
  list(avg.exp = as.numeric(avg_exp), pct.exp = as.numeric(Matrix::colMeans(mat > 0)))
}

all_tissues <- unique(as.character(meta_use$organ_simplified))
dot_df_all <- map_dfr(all_tissues, function(tissue) {
  stats <- dot_stats(expr_use[meta_use$organ_simplified == tissue, features, drop = FALSE])
  tibble(features.plot = features, id = tissue, avg.exp = stats$avg.exp)
})
global_stats <- dot_df_all |>
  dplyr::group_by(features.plot) |>
  dplyr::summarise(g_mean = mean(avg.exp), g_sd = sd(avg.exp), .groups = "drop")

tissues_present <- tissue_order[tissue_order %in% as.character(meta_use$organ_simplified)]
dot_df_scaled <- map_dfr(tissues_present, function(tissue) {
  stats <- dot_stats(expr_use[meta_use$organ_simplified == tissue, features, drop = FALSE])
  tibble(features.plot = features, id = tissue, avg.exp = stats$avg.exp, pct.exp = stats$pct.exp)
}) |>
  dplyr::mutate(pct.exp = pct.exp * 100, id = factor(id, levels = tissues_present)) |>
  dplyr::left_join(global_stats, by = "features.plot") |>
  dplyr::mutate(avg.exp.c = avg.exp - g_mean) |>  # center only (no standardization)
  # rev() because coord_flip() inverts factor level order (first level ends up at the bottom)
  dplyr::mutate(features.plot = factor(features.plot, levels = rev(heatmap_gene_order)))

# colour clipped to [-1, 1] so mid-range genes stay visible (a few high-expression
# genes otherwise dominate the scale)
p_scaled <- ggplot(dot_df_scaled, aes(x = features.plot, y = id)) +
  geom_tile(aes(fill = avg.exp.c)) +
  scale_fill_gradient2(low = "steelblue", mid = "white", high = "firebrick", midpoint = 0,
                       limits = c(-1, 1), oob = scales::squish, name = "Avg Exp\n(centered)") +
  coord_flip() +
  cowplot::theme_cowplot() +
  theme(axis.text.x = element_text(angle = 45, hjust = 1), axis.title.x = element_blank(), axis.title.y = element_blank())

plot_df_hm <- as.data.frame(F_sub[heatmap_gene_order, , drop = FALSE])
plot_df_hm$Gene <- rownames(plot_df_hm)
plot_df_hm <- tidyr::pivot_longer(plot_df_hm, cols = -Gene, names_to = "GP", values_to = "Loading")
plot_df_hm$GP <- factor(plot_df_hm$GP, levels = GP_orders)
plot_df_hm$Gene <- factor(plot_df_hm$Gene, levels = rev(heatmap_gene_order))
limit_hm <- max(abs(plot_df_hm$Loading), na.rm = TRUE)

p_gene_heatmap <- ggplot(plot_df_hm, aes(x = GP, y = Gene, fill = Loading)) +
  geom_tile() +
  scale_fill_gradient2(low = "steelblue", mid = "white", high = "firebrick", midpoint = 0, limits = c(-limit_hm, limit_hm), name = "Loading") +
  labs(title = "Top positive genes per organ GP", x = NULL, y = NULL) +
  theme_minimal(base_size = 9) +
  theme(axis.text.x = element_text(angle = 45, hjust = 1, size = 9), axis.text.y = element_text(size = 8), panel.grid = element_blank(), plot.title = element_text(face = "bold", size = 11))

# Side-by-side: gene vs tissue (dotplot, wider) | gene vs GP (heatmap, narrower)
p_4c <- (p_scaled + (p_gene_heatmap + theme(axis.text.y = element_blank(), axis.ticks.y = element_blank(), axis.title.y = element_blank()))) +
  plot_layout(widths = c(2, 1), guides = "collect") &
  theme(legend.position = "bottom")

pdf(paste0(figure_path, "5c.pdf"), width = 10, height = 16, useDingbats = FALSE)
print(p_4c)
dev.off()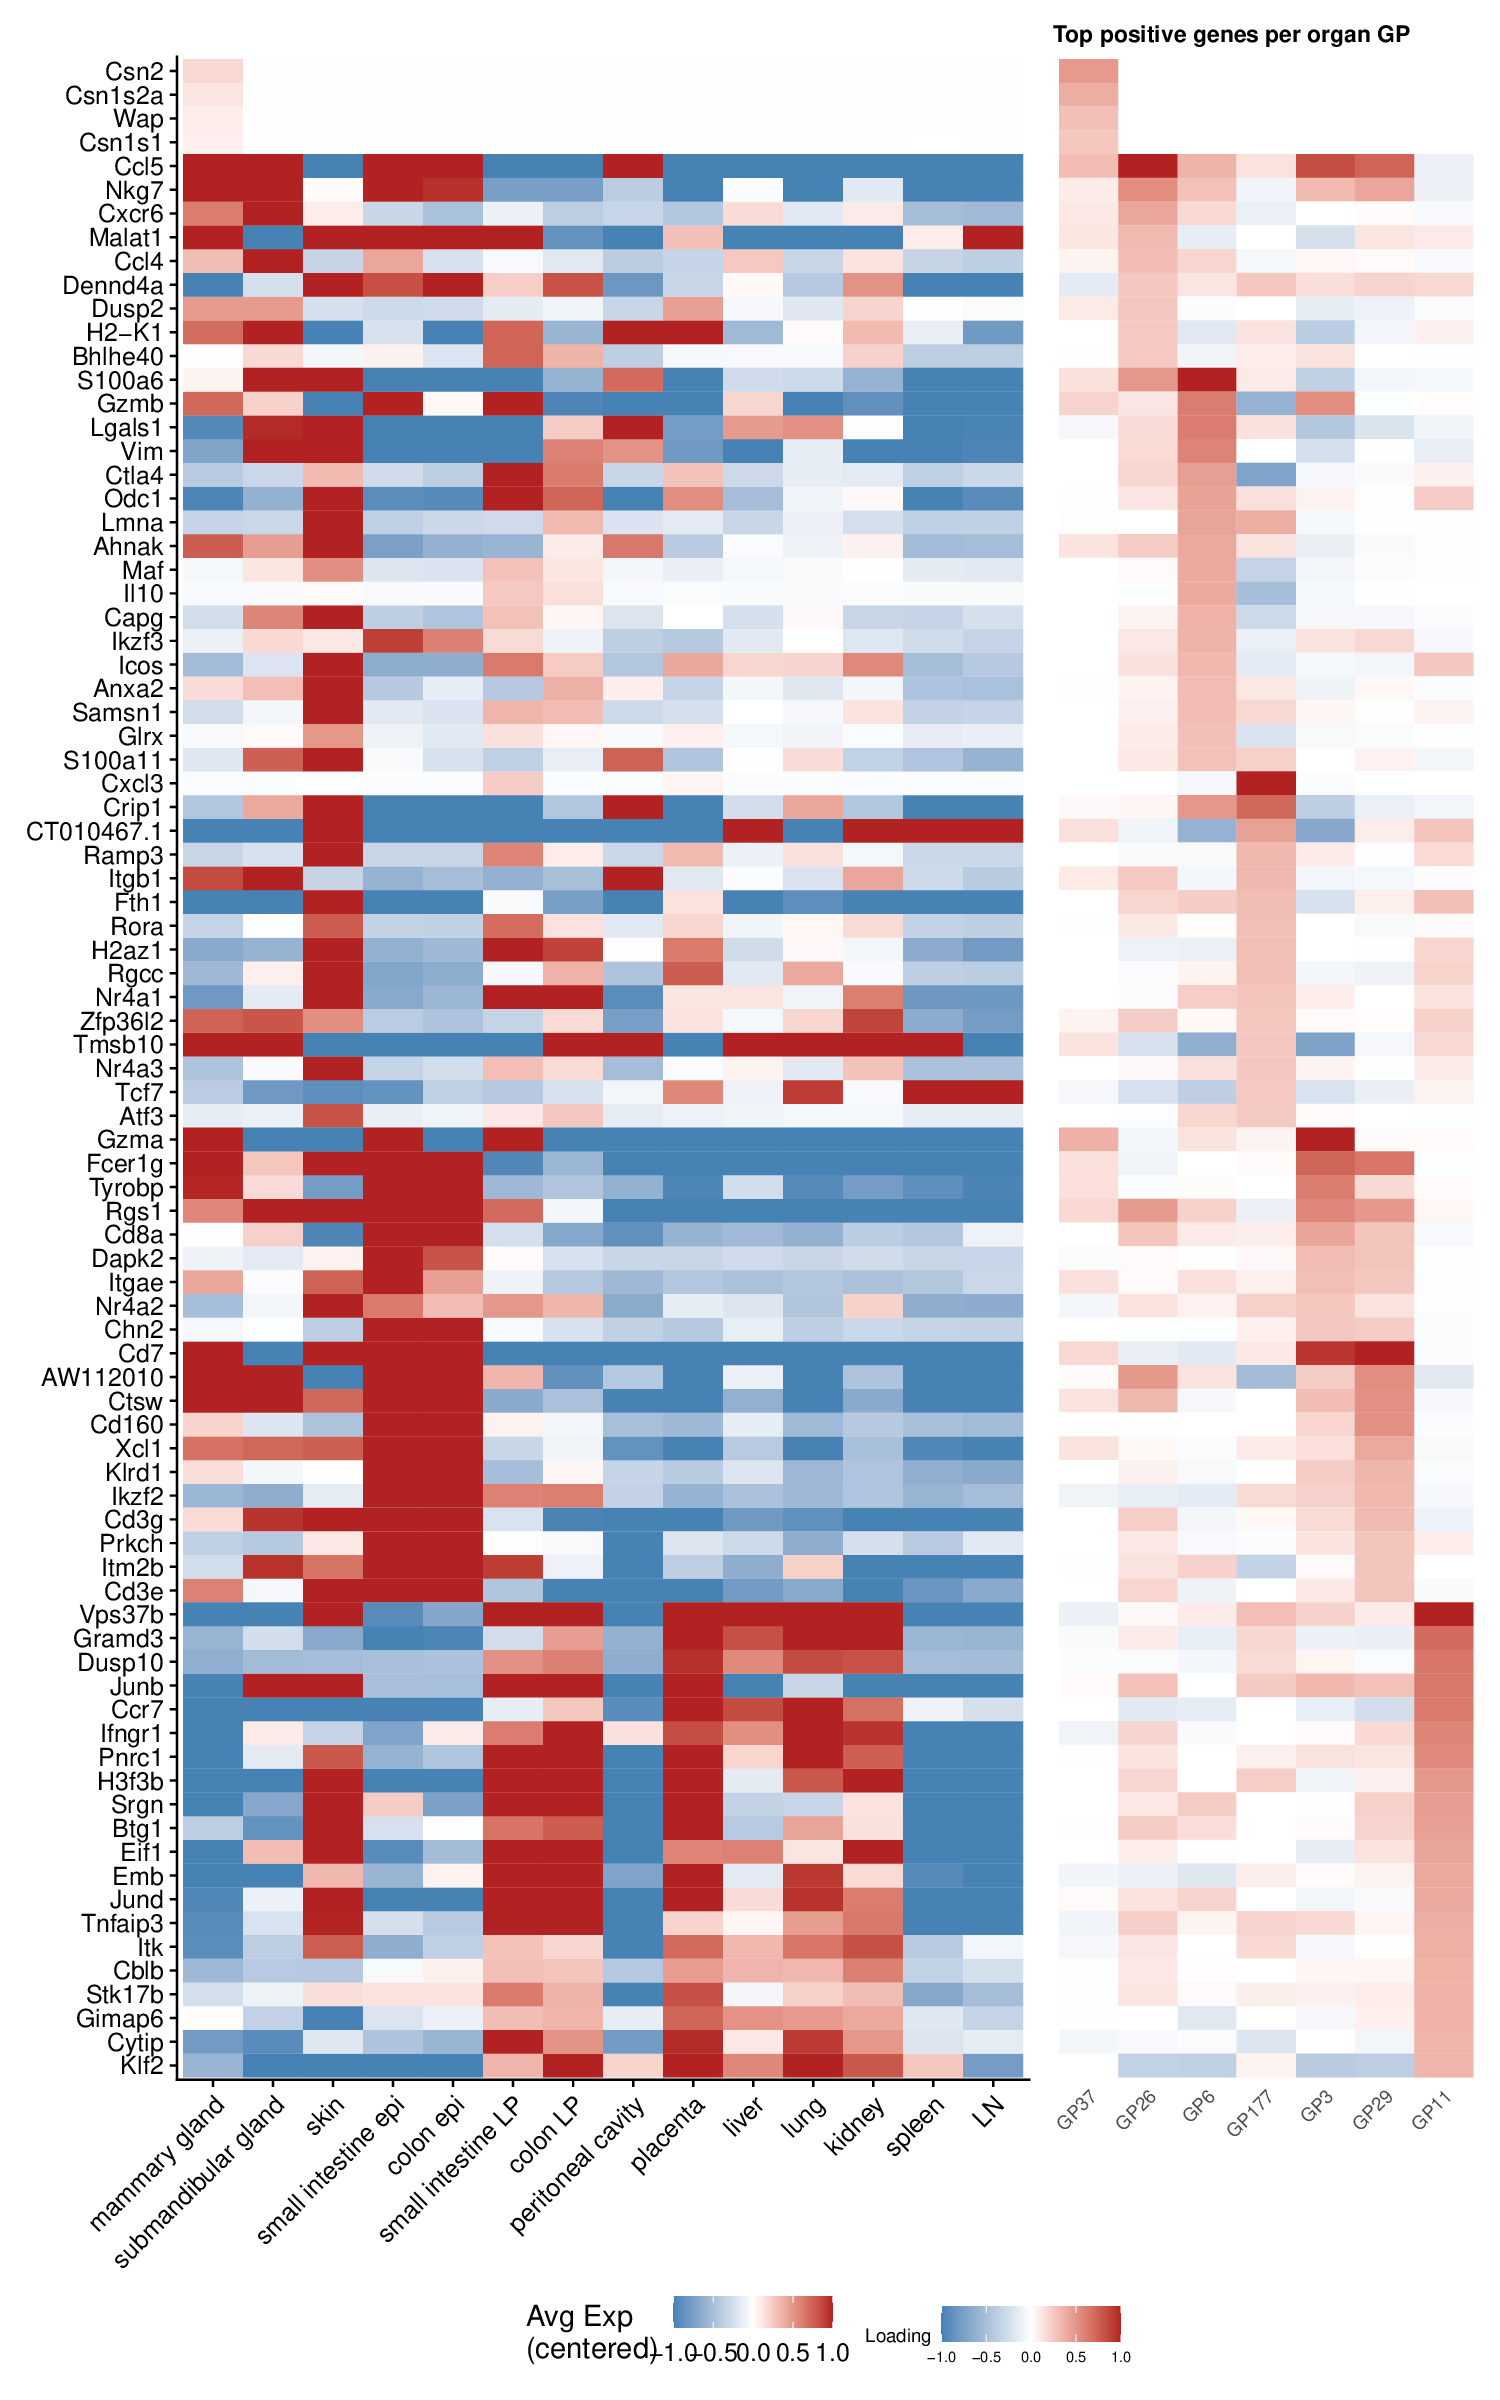
Fig. 5c. Marker genes of the seven organ-specific GPs. Genes are the union of the top 20 positively scoring genes per GP (score > 0.25 on the max-abs-scaled gene-score matrix), ordered diagonally by each gene’s dominant GP and then by descending score. Left, heatmap of mean expression across 14 organs, centered per gene (each gene’s across-organ mean subtracted; not standardized / not divided by SD), with color clipped to [-1, 1] so mid-range genes stay visible; right, heatmap of the per-GP scaled gene scores for the same genes across the seven GPs, centered at zero (blue, negative; red, positive).
(d) Max AUC: organ vs. cluster
# ============================================================
level_2_AUC <- level_2_AUC_list$auc
level_2_small_count <- table(seurat_meta_filtered_no_thymocytes_healthy$annotation_level2)
level_2_small_count <- names(level_2_small_count[level_2_small_count < 100])
level_2_AUC <- level_2_AUC[!rownames(level_2_AUC) %in% level_2_small_count, ]

level_2_cat_mean <- t(sapply(rownames(level_2_AUC), function(cat) {
  idx <- seurat_meta_filtered_no_thymocytes_healthy$annotation_level2 == cat
  colMeans(L_healthy[idx, , drop = FALSE], na.rm = TRUE)
}))
level_2_AUC_positive <- sweep(level_2_cat_mean, 2, overall_mean, "-") > 0

# 4d/4e reuse `organ_AUC_max_name`, but recomputed against the Level-2
# category-count filter to match the original script's exact numbers.
organ_AUC_masked_l2 <- organ_AUC
organ_AUC_positive_l2 <- sweep(
  t(sapply(rownames(organ_AUC), function(cat) {
    idx <- seurat_meta_filtered_no_thymocytes_healthy$organ_simplified == cat
    colMeans(L_healthy[idx, , drop = FALSE], na.rm = TRUE)
  })),
  2, overall_mean, "-"
) > 0
organ_AUC_masked_l2[!organ_AUC_positive_l2] <- NA
organ_AUC_max <- apply(organ_AUC_masked_l2, 2, max, na.rm = TRUE)
organ_AUC_max_name <- apply(organ_AUC_masked_l2, 2, function(x) rownames(organ_AUC_masked_l2)[which.max(x)])

# ============================================================
# 4d: Max AUC Organ vs Level-2, 7 organ-specific GPs (red) vs.
#     contrasting cluster-specific GPs (blue) highlighted
# ============================================================
seven_gp_df <- df |>
  dplyr::filter(Factor %in% gps_of_interest) |>
  dplyr::mutate(label_text = sapply(Factor, top_cats_label, auc_matrix = level_2_AUC, positive_mask = level_2_AUC_positive, threshold = 0.9, n = 3))

top_left_gps <- c("GP14", "GP36", "GP16", "GP151", "GP21", "GP122", "GP2", "GP171", "GP5", "GP13")
top_left_df <- df |>
  dplyr::filter(Factor %in% top_left_gps) |>
  dplyr::mutate(label_text = sapply(Factor, top_cats_label, auc_matrix = level_2_AUC, positive_mask = level_2_AUC_positive, threshold = 0.9, n = 3))

p_4d <- ggplot(df, aes(Max_AUC_Organ, Max_AUC_Level1)) +
  geom_point(alpha = 0.2, size = 1.5, color = "grey60") +
  geom_point(data = top_left_df, color = "#1f78b4", size = 2.2, alpha = 0.9) +
  geom_text_repel(
    data = top_left_df, aes(label = label_text), color = "#1f78b4", lineheight = 0.85, size = 2.5,
    direction = "y", nudge_x = -0.1, segment.color = "#1f78b4",
    arrow = arrow(length = unit(0.008, "npc"), type = "closed", angle = 20),
    force = 4, force_pull = 0.05, box.padding = 0.5, point.padding = 0.15,
    max.time = 10, max.iter = 2e4, max.overlaps = 30, min.segment.length = 0.01, segment.alpha = 0.7
  ) +
  geom_point(data = seven_gp_df, color = "#e31a1c", size = 2.2, alpha = 0.9) +
  geom_text_repel(
    data = seven_gp_df, aes(label = label_text), color = "#e31a1c", size = 2.5, lineheight = 0.85,
    direction = "y", nudge_x = 0.18, xlim = c(1.0, NA), segment.color = "#e31a1c",
    arrow = arrow(length = unit(0.008, "npc"), type = "closed", angle = 20),
    force = 6, force_pull = 0.02, box.padding = 0.6, point.padding = 0.15,
    max.time = 10, max.iter = 2e4, max.overlaps = 30, min.segment.length = 0.01, segment.alpha = 0.7
  ) +
  geom_abline(slope = 1, intercept = 0, linetype = "dashed", color = "black") +
  coord_cartesian(xlim = c(0.46, 1.04), ylim = c(0.5, 1.02), expand = FALSE, clip = "off") +
  labs(x = "Max AUC (Organ Simplified)", y = "Max AUC (Level-2)", title = "Max AUC: Organ vs Level-2 - organ-specific GPs") +
  theme_minimal(base_size = 13) +
  theme(plot.margin = margin(10, 80, 10, 80))
ggsave(filename = paste0(figure_path, "5d.pdf"), plot = p_4d, width = 8, height = 8, dpi = 300)

# ============================================================
# 4b: GP37+ rate by lineage, mammary gland vs. elsewhere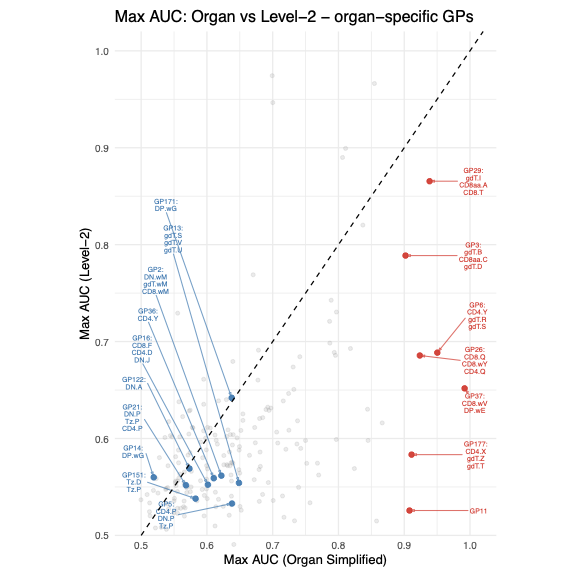
| Version | Author | Date |
|---|---|---|
| 2873ad2 | Ziang Zhang | 2026-07-16 |
Fig. 5d. As in (a), but predictive performance is measured against clusters obtained from ImmgenT-cosmo (y-axis; clusters with < 100 cells dropped). All GPs are shown in grey; the seven organ-specific GPs (GP3, GP6, GP11, GP26, GP29, GP37, GP177) are highlighted in red and labeled with their best clusters, while a contrasting set of cluster-specific GPs (high cluster AUC, low organ AUC) is highlighted in blue; the dashed line marks equal performance.
(e) Organ, GP, and cluster alluvial diagram
#     7 organ-specific GPs
# ============================================================
best_organ_per_gp <- organ_AUC_max_name[gps_of_interest]
gp_thresholds <- mapply(function(gp, organ) organ_AUC_list$threshold[organ, gp], gps_of_interest, best_organ_per_gp)
names(gp_thresholds) <- gps_of_interest

n_cap_gp <- 300
set.seed(42)
alluvial_rows <- lapply(gps_of_interest, function(gp) {
  positive_idx <- L_healthy[, gp] > gp_thresholds[gp]
  meta_pos <- seurat_meta_filtered_no_thymocytes_healthy[positive_idx, ]
  d <- data.frame(gp_program = gp, organ = meta_pos$organ_simplified, level2 = meta_pos$annotation_level2, stringsAsFactors = FALSE)
  if (nrow(d) > n_cap_gp) d <- dplyr::slice_sample(d, n = n_cap_gp)
  d
})

count_df <- do.call(rbind, alluvial_rows) |>
  dplyr::count(organ, gp_program, level2, name = "n") |>
  dplyr::filter(!is.na(organ), !is.na(level2), n >= 5)

organ_order <- count_df |> dplyr::summarise(total = sum(n), .by = organ) |> dplyr::arrange(dplyr::desc(total)) |> dplyr::pull(organ)
level2_order <- count_df |> dplyr::summarise(total = sum(n), .by = level2) |> dplyr::arrange(dplyr::desc(total)) |> dplyr::pull(level2)

count_df <- count_df |>
  dplyr::mutate(
    organ = factor(organ, levels = rev(organ_order)),
    gp_program = factor(gp_program, levels = rev(gps_of_interest)),
    level2 = factor(level2, levels = rev(level2_order))
  )

gp_colors <- ZemmourLib::immgent_colors$organ_simplified[unname(best_organ_per_gp)]
gp_colors[is.na(gp_colors)] <- "grey60"
names(gp_colors) <- gps_of_interest

p_4e <- ggplot(count_df, aes(axis1 = organ, axis2 = gp_program, axis3 = level2, y = n)) +
  ggalluvial::geom_alluvium(aes(fill = gp_program), width = 1 / 4, alpha = 0.6, knot.pos = 0.4) +
  ggalluvial::geom_stratum(width = 1 / 4, fill = "grey92", color = "grey50", linewidth = 0.3) +
  ggplot2::geom_text(stat = ggalluvial::StatStratum, aes(label = after_stat(stratum)), size = 3, angle = 90) +
  scale_fill_manual(values = gp_colors, guide = "none") +
  scale_x_discrete(limits = c("Organ", "GP", "Level-2"), expand = c(0.12, 0.12)) +
  labs(y = "Number of GP+ cells", title = "GP+ cells: organ origin and cell type") +
  theme_minimal(base_size = 12) +
  theme(panel.grid = element_blank(), axis.text.y = element_blank(), axis.ticks = element_blank()) +
  coord_flip()
ggsave(filename = paste0(figure_path, "5e.pdf"), plot = p_4e, width = 20, height = 10, dpi = 300)

# ============================================================
# 4c: organ marker genes - expression dotplot + per-GP gene-score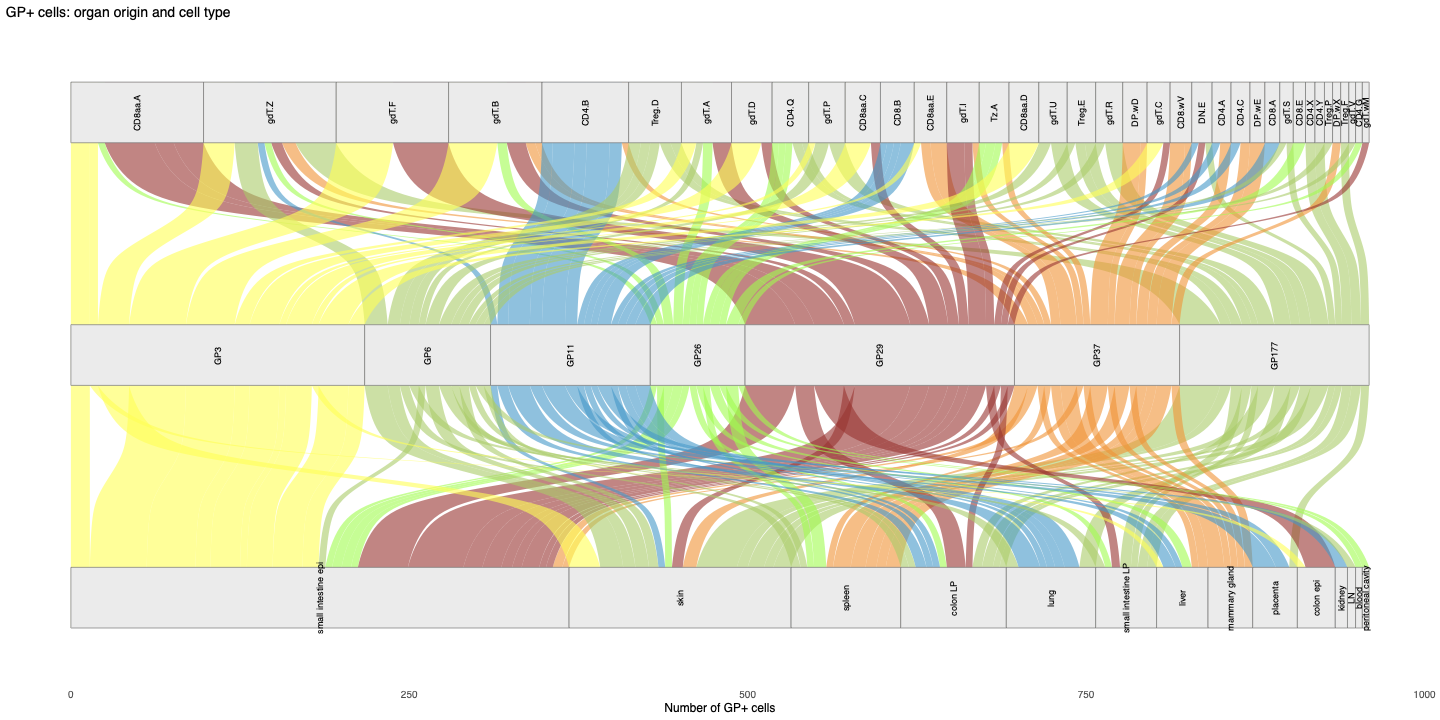
| Version | Author | Date |
|---|---|---|
| 2873ad2 | Ziang Zhang | 2026-07-16 |
Fig. 5e. Alluvial diagram of GP+ cells linking organ of origin, GP, and ImmgenT-cosmo cluster. For each of the seven organ-specific GPs, GP+ cells (loading above that GP’s best-organ threshold) are subsampled to <=300 per GP and traced from their organ of origin through the GP to their cluster; flows are colored by GP (using each GP’s best-predicted organ color), flows representing fewer than 5 cells are dropped, and a cell may appear under more than one GP. Axis width denotes the number of GP+ cells.
sessionInfo()R version 4.5.1 (2025-06-13)
Platform: aarch64-apple-darwin20
Running under: macOS Sequoia 15.6.1
Matrix products: default
BLAS: /System/Library/Frameworks/Accelerate.framework/Versions/A/Frameworks/vecLib.framework/Versions/A/libBLAS.dylib
LAPACK: /Library/Frameworks/R.framework/Versions/4.5-arm64/Resources/lib/libRlapack.dylib; LAPACK version 3.12.1
locale:
[1] en_CA/en_CA/en_CA/C/en_CA/en_CA
time zone: Asia/Shanghai
tzcode source: internal
attached base packages:
[1] stats graphics grDevices utils datasets methods base
loaded via a namespace (and not attached):
[1] vctrs_0.7.3 cli_3.6.6 knitr_1.50 rlang_1.2.0
[5] xfun_0.55 stringi_1.8.7 otel_0.2.0 promises_1.5.0
[9] jsonlite_2.0.0 workflowr_1.7.2 glue_1.8.1 rprojroot_2.1.1
[13] git2r_0.36.2 htmltools_0.5.9 httpuv_1.6.16 sass_0.4.10
[17] rmarkdown_2.30 evaluate_1.0.5 jquerylib_0.1.4 tibble_3.3.0
[21] fastmap_1.2.0 yaml_2.3.12 lifecycle_1.0.5 whisker_0.4.1
[25] stringr_1.6.0 compiler_4.5.1 fs_1.6.6 Rcpp_1.1.1-1.1
[29] pkgconfig_2.0.3 later_1.4.4 digest_0.6.39 R6_2.6.1
[33] pillar_1.11.1 magrittr_2.0.5 bslib_0.9.0 tools_4.5.1
[37] cachem_1.1.0