Modeling Changes in Microbiome
Last updated: 2020-05-07
Checks: 6 1
Knit directory: Fiber_Intervention_Study/
This reproducible R Markdown analysis was created with workflowr (version 1.6.2). The Checks tab describes the reproducibility checks that were applied when the results were created. The Past versions tab lists the development history.
The R Markdown file has unstaged changes. To know which version of the R Markdown file created these results, you’ll want to first commit it to the Git repo. If you’re still working on the analysis, you can ignore this warning. When you’re finished, you can run wflow_publish to commit the R Markdown file and build the HTML.
Great job! The global environment was empty. Objects defined in the global environment can affect the analysis in your R Markdown file in unknown ways. For reproduciblity it’s best to always run the code in an empty environment.
The command set.seed(20191210) was run prior to running the code in the R Markdown file. Setting a seed ensures that any results that rely on randomness, e.g. subsampling or permutations, are reproducible.
Great job! Recording the operating system, R version, and package versions is critical for reproducibility.
Nice! There were no cached chunks for this analysis, so you can be confident that you successfully produced the results during this run.
Great job! Using relative paths to the files within your workflowr project makes it easier to run your code on other machines.
Great! You are using Git for version control. Tracking code development and connecting the code version to the results is critical for reproducibility.
The results in this page were generated with repository version 2d97c53. See the Past versions tab to see a history of the changes made to the R Markdown and HTML files.
Note that you need to be careful to ensure that all relevant files for the analysis have been committed to Git prior to generating the results (you can use wflow_publish or wflow_git_commit). workflowr only checks the R Markdown file, but you know if there are other scripts or data files that it depends on. Below is the status of the Git repository when the results were generated:
Ignored files:
    Ignored:    .Rhistory
    Ignored:    .Rproj.user/
    Ignored:    reference-papers/Dietary_Variables.xlsx
    Ignored:    reference-papers/Johnson_2019.pdf

Untracked files:
    Untracked:  analysis/microbiome_diet_trends.Rmd
    Untracked:  fig/figure2.pdf
    Untracked:  fig/figure2_legend.pdf
    Untracked:  fig/figure3.pdf
    Untracked:  fig/figure3_legend.pdf
    Untracked:  fig/figure4.pdf
    Untracked:  fig/figure4_legend.pdf

Unstaged changes:
    Modified:   analysis/analysis_beta_diversity.Rmd
    Modified:   analysis/change_in_alpha_diversity.Rmd
    Deleted:    analysis/dietary_intake_figure.Rmd
    Modified:   analysis/lme_microbiome.Rmd
    Modified:   code/load_packages.R
    Modified:   data/analysis-data/Dietary_Variables.xlsx
    Modified:   fig/figure1.pdf
    Modified:   fig/figure1_legend.pdf
    Modified:   fig/predicted_Actinobacteria_model5.png
    Modified:   fig/predicted_Actinobacteria_model7.png
    Modified:   fig/predicted_Bacteroidetes_model5.png
    Modified:   fig/predicted_Bacteroidetes_model7.png
    Modified:   fig/predicted_Cyanobacteria_model5.png
    Modified:   fig/predicted_Cyanobacteria_model7.png
    Modified:   fig/predicted_Euryarchaeota_model5.png
    Modified:   fig/predicted_Euryarchaeota_model7.png
    Modified:   fig/predicted_Firmicutes_model5.png
    Modified:   fig/predicted_Firmicutes_model7.png
    Modified:   fig/predicted_Fusobacteria_model5.png
    Modified:   fig/predicted_Fusobacteria_model7.png
    Modified:   fig/predicted_Lentisphaerae_model5.png
    Modified:   fig/predicted_Lentisphaerae_model7.png
    Modified:   fig/predicted_Proteobacteria_model5.png
    Modified:   fig/predicted_Proteobacteria_model7.png
    Modified:   fig/predicted_Tenericutes_model5.png
    Modified:   fig/predicted_Tenericutes_model7.png
    Modified:   fig/predicted_Verrucomicrobia_model5.png
    Modified:   fig/predicted_Verrucomicrobia_model7.png
Note that any generated files, e.g. HTML, png, CSS, etc., are not included in this status report because it is ok for generated content to have uncommitted changes.
These are the previous versions of the repository in which changes were made to the R Markdown (analysis/lme_microbiome.Rmd) and HTML (docs/lme_microbiome.html) files. If you’ve configured a remote Git repository (see ?wflow_git_remote), click on the hyperlinks in the table below to view the files as they were in that past version.
| File | Version | Author | Date | Message |
|---|---|---|---|---|
| html | 51b6275 | noah-padgett | 2020-02-20 | Build site. |
| Rmd | 1c719ff | noah-padgett | 2020-02-20 | updated output window size |
| html | 1c719ff | noah-padgett | 2020-02-20 | updated output window size |
| html | a6488a7 | noah-padgett | 2020-02-06 | Build site. |
| Rmd | 0674e1b | noah-padgett | 2020-02-06 | fixed index |
| html | 6de5819 | noah-padgett | 2020-02-06 | Build site. |
| Rmd | 77daa75 | noah-padgett | 2020-02-06 | fixed index |
| Rmd | dd420c9 | noah-padgett | 2020-02-06 | updated glmm results and index |
| html | dd420c9 | noah-padgett | 2020-02-06 | updated glmm results and index |
This page contains the investigation of the changes over time.
Data prep
This is only to recode some variables to ease interpretation.
microbiome_data$meta.dat <- microbiome_data$meta.dat %>%
  mutate(intB = ifelse(Intervention=="B", 1,0),
         time = as.numeric(Week) - 1,
         female = ifelse(Gender == "F", 1, 0),
         hispanic = ifelse(Ethnicity %in% c("White", "Asian", "Native America"), 1, 0))
Phylum Level Microbiome and Intervention
We will build up to the effect of the intervention by investigating covariates to see if we can exclude them from model with intervention. Due to only having 11 people, we will only estimate 1 random effect per model (random intercepts). All other effects are fixed, but we will only estimate up to 2 effects. Meaning we can only include two covariates in each model at a time.
In all models, \(h(.)\) is an arbitrary link function. We selected the Poisson model for the outcomes so the link function is the log link.
For all significance test, we will use \(p < 0.05\) as the level to declare significance, but we will largely focus on magnitude of effects.
Unconditional Model
This is a random intercepts model (worst case). No covariates are included.
\[\begin{align*} h\left(Y_{ij}\right)&=\beta_{0j} + r_{ij}\\ \beta_{0j}&= \gamma_{00} + u_{0j}\\ \end{align*}\]
phylum.fit0 <- glmm_microbiome(mydata=microbiome_data,model.number=0,
                               taxa.level="Phylum", link="poisson",
                               model="1 + (1|SubjectID)")
#########################################
#########################################
Model:  Actinobacteria ~ 1 + (1 | SubjectID)
<environment: 0x0000000041f2dbb0>

Link:    poisson


Intraclass Correlation (ICC):   0.5588572

Fixed Effects (change in log)

                   Outcome Estimate Std. Error  z value Pr(>|z|)
(Intercept) Actinobacteria  3.60892    0.34173 10.56075        0


Random Effects (SD on log scale)

 Groups    Name        Std.Dev.
 SubjectID (Intercept) 1.1255

Significance test not available

#########################################
#########################################
Model:  Bacteroidetes ~ 1 + (1 | SubjectID)
<environment: 0x0000000041f2dbb0>

Link:    poisson


Intraclass Correlation (ICC):   0.1012137

Fixed Effects (change in log)

                  Outcome Estimate Std. Error  z value Pr(>|z|)
(Intercept) Bacteroidetes  8.74822    0.10121 86.43962        0


Random Effects (SD on log scale)

 Groups    Name        Std.Dev.
 SubjectID (Intercept) 0.33558

Significance test not available

#########################################
#########################################
Model:  Cyanobacteria ~ 1 + (1 | SubjectID)
<environment: 0x0000000041f2dbb0>

Link:    poisson


Intraclass Correlation (ICC):   0.8456119

Fixed Effects (change in log)

                  Outcome Estimate Std. Error z value Pr(>|z|)
(Intercept) Cyanobacteria     1.99    0.72467 2.74608  0.00603


Random Effects (SD on log scale)

 Groups    Name        Std.Dev.
 SubjectID (Intercept) 2.3403

Significance test not available

#########################################
#########################################
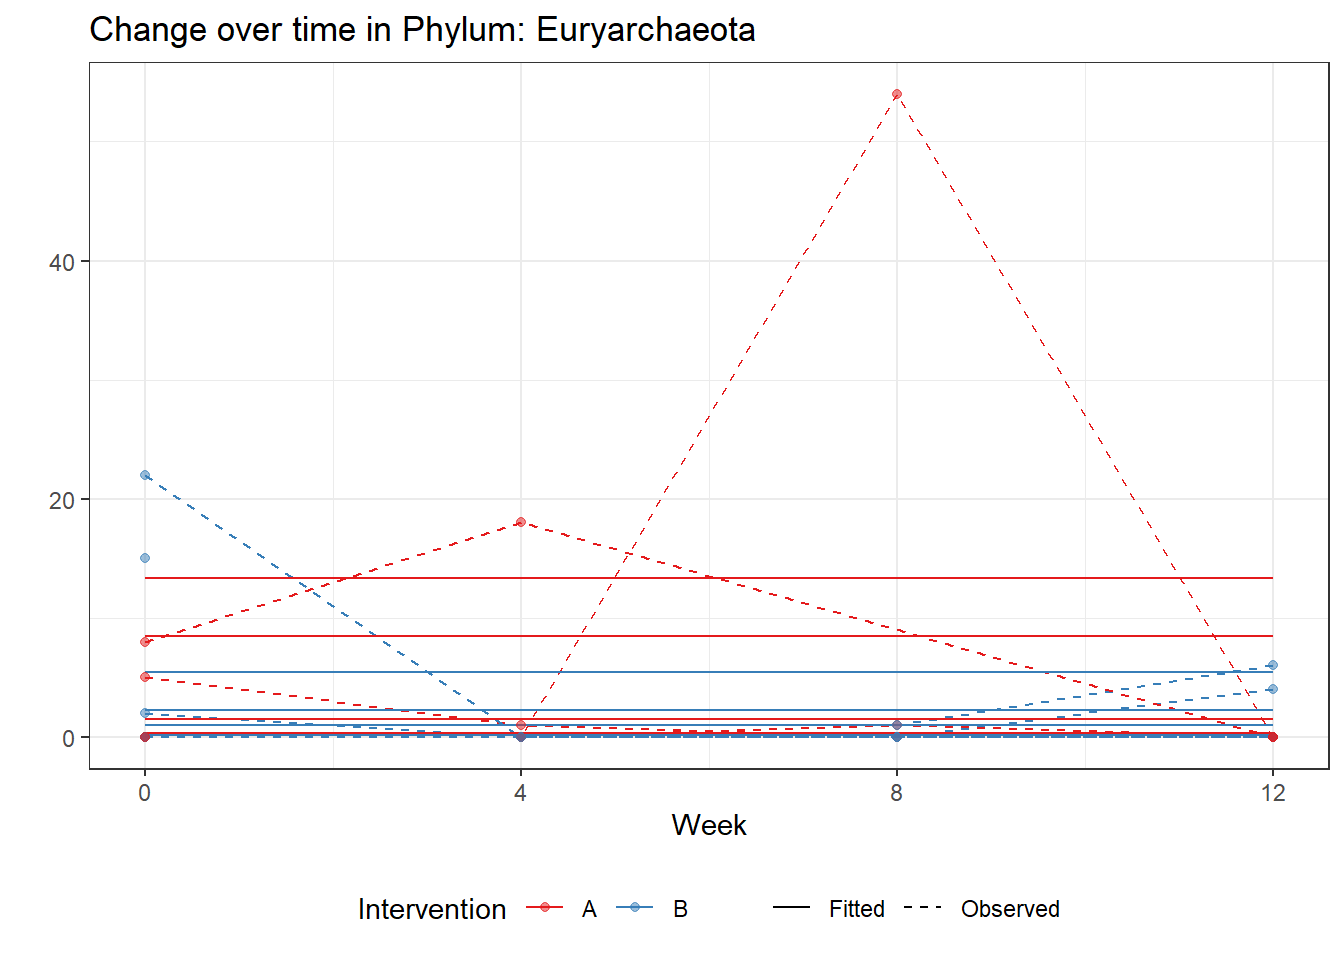
Model:  Euryarchaeota ~ 1 + (1 | SubjectID)
<environment: 0x0000000041f2dbb0>

Link:    poisson


Intraclass Correlation (ICC):   0.7888934
Fixed Effects (change in log)

                  Outcome Estimate Std. Error z value Pr(>|z|)
(Intercept) Euryarchaeota  0.20274    0.63788 0.31784  0.75061


Random Effects (SD on log scale)

 Groups    Name        Std.Dev.
 SubjectID (Intercept) 1.9331

Significance test not available

#########################################
#########################################
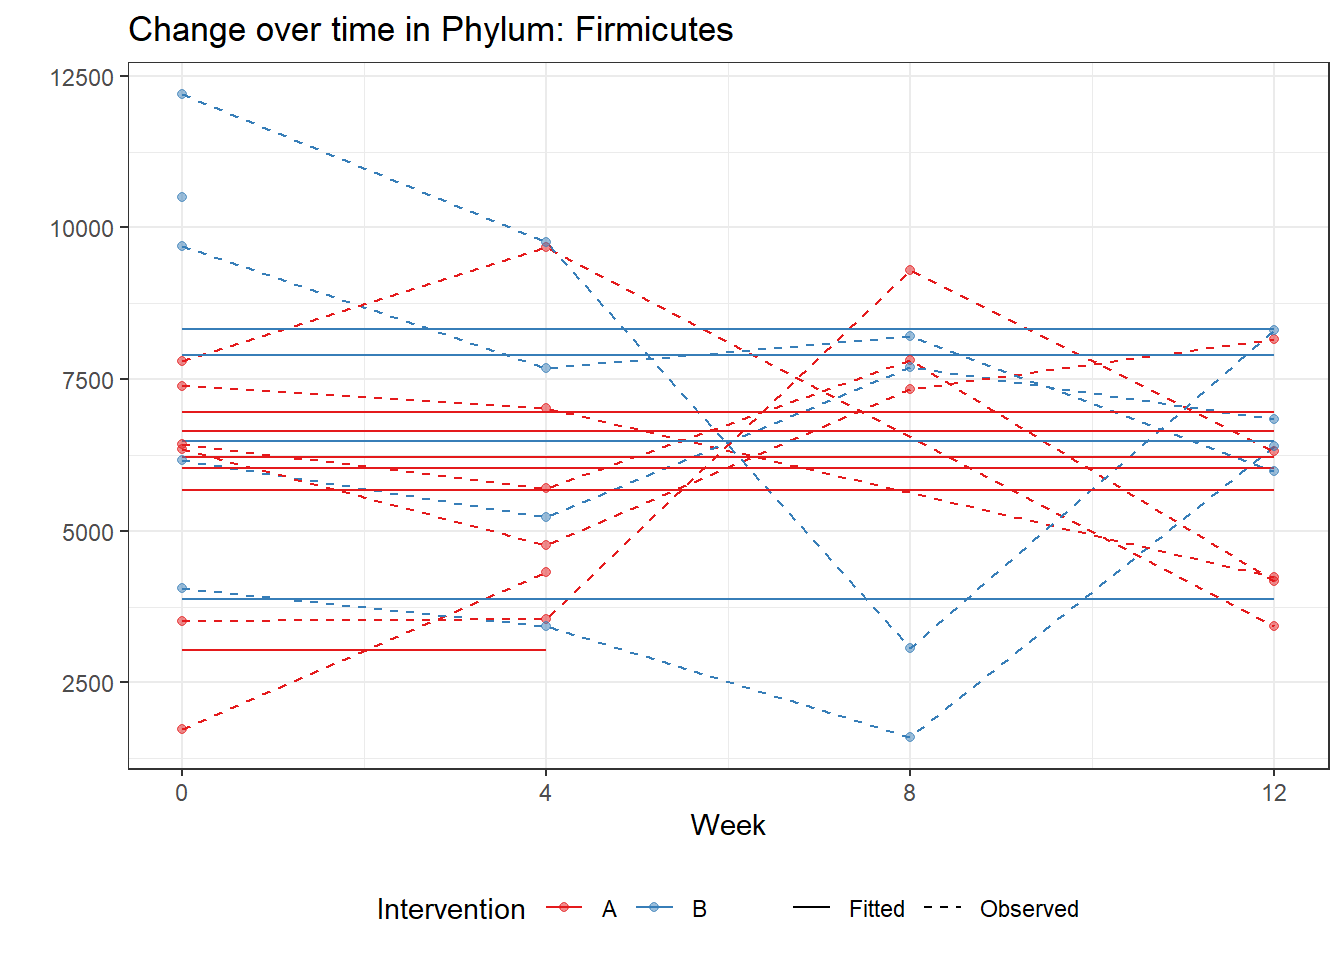
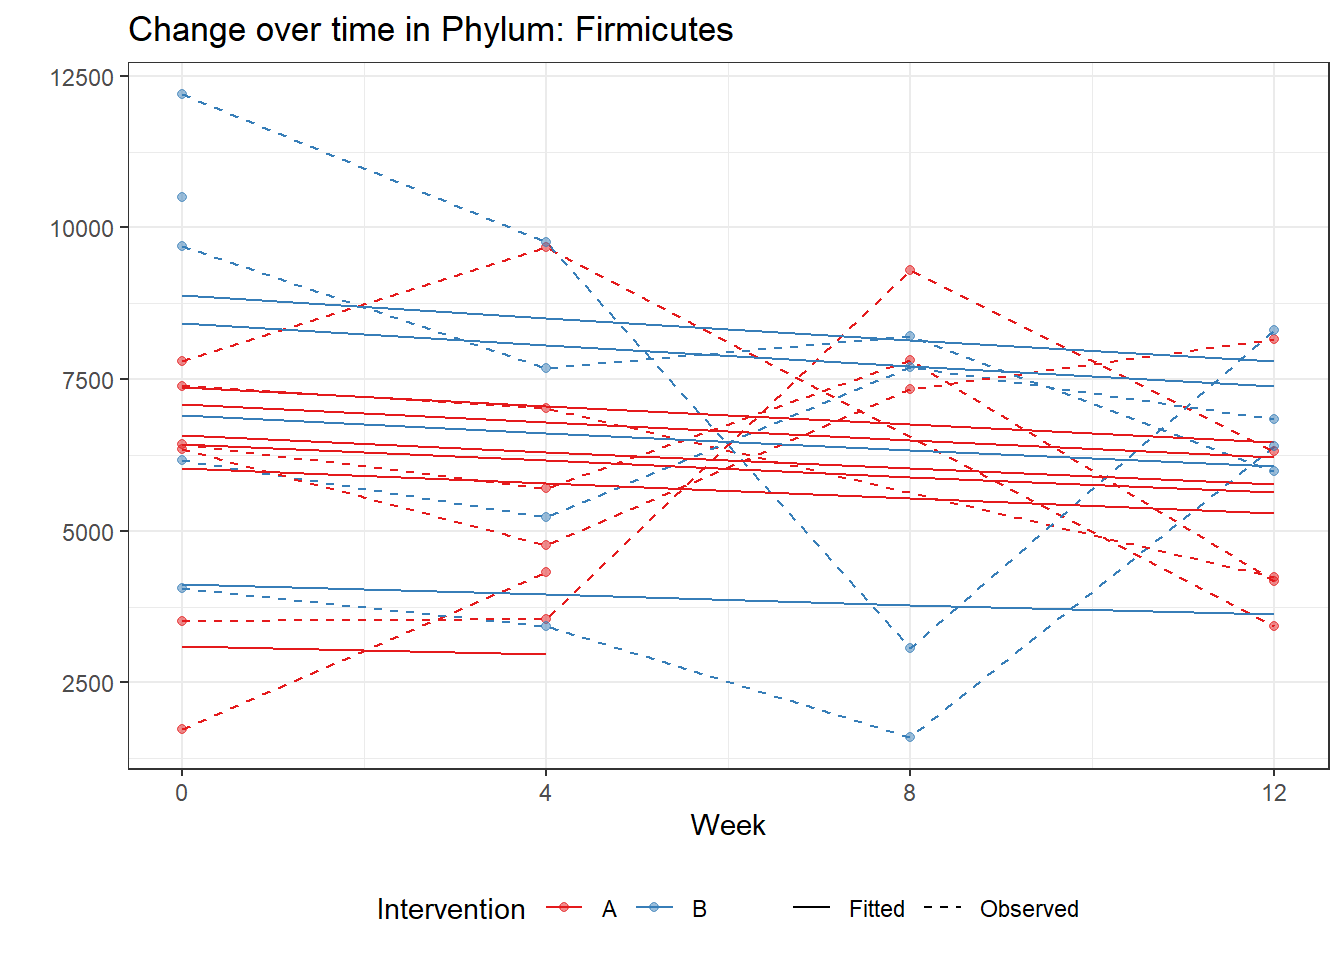
Model:  Firmicutes ~ 1 + (1 | SubjectID)
<environment: 0x0000000041f2dbb0>

Link:    poisson


Intraclass Correlation (ICC):   0.09724719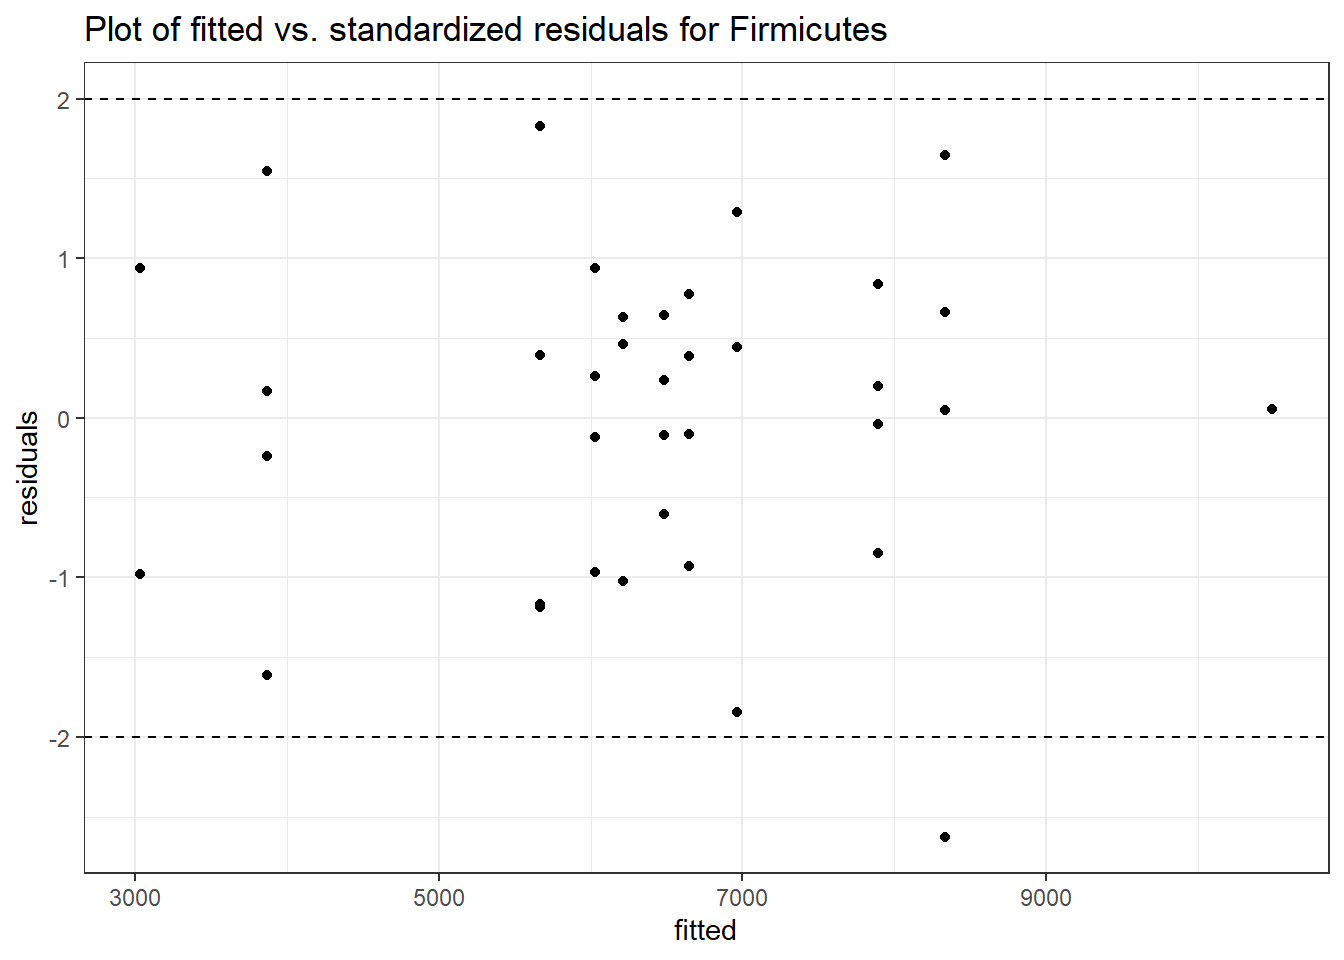
Fixed Effects (change in log)

               Outcome Estimate Std. Error  z value Pr(>|z|)
(Intercept) Firmicutes  8.73145    0.09899 88.20897        0


Random Effects (SD on log scale)

 Groups    Name        Std.Dev.
 SubjectID (Intercept) 0.32821

Significance test not available

#########################################
#########################################
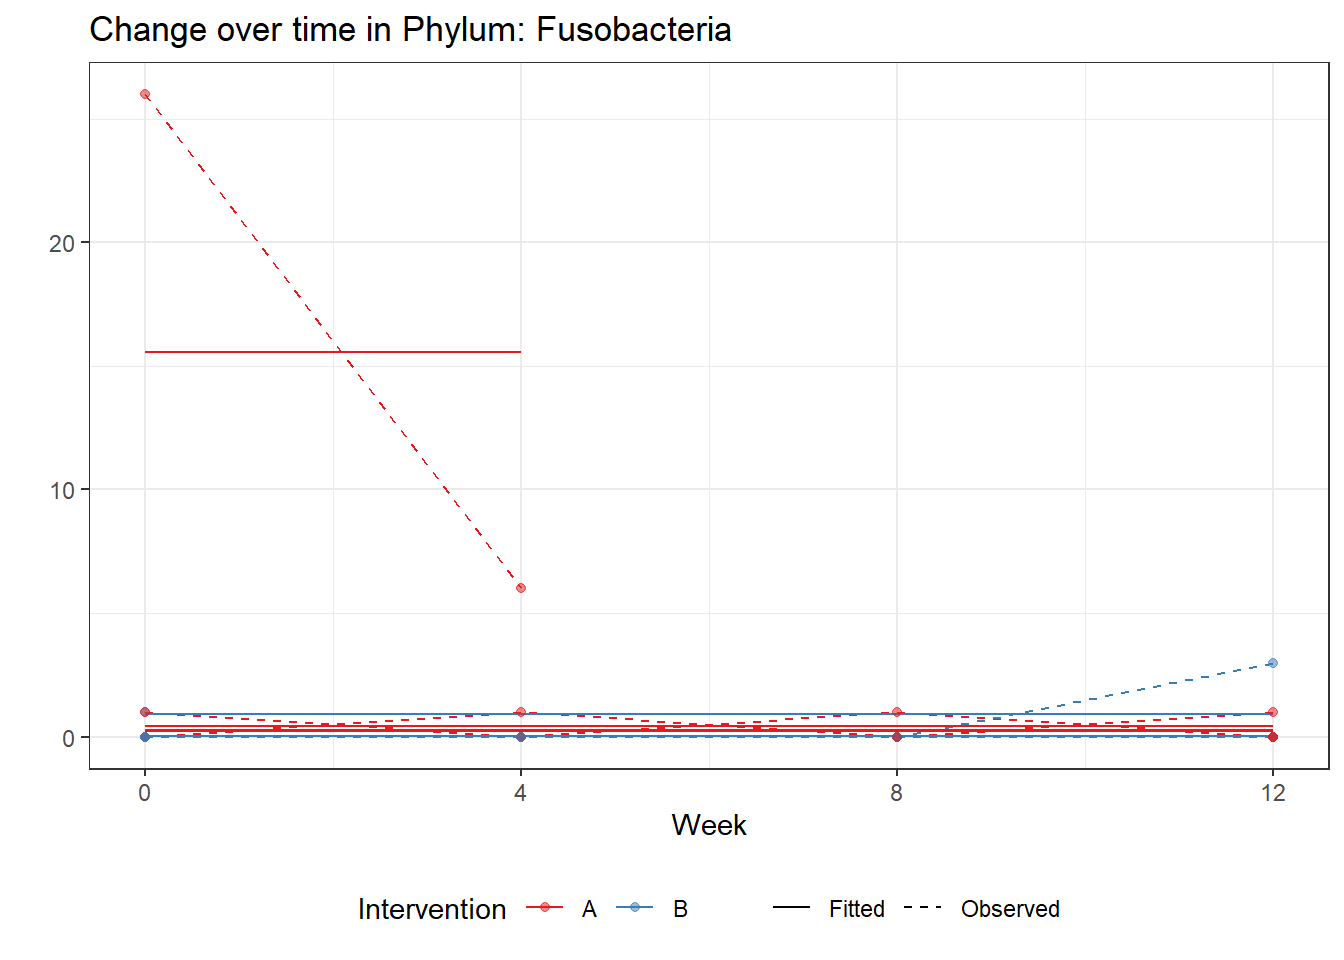
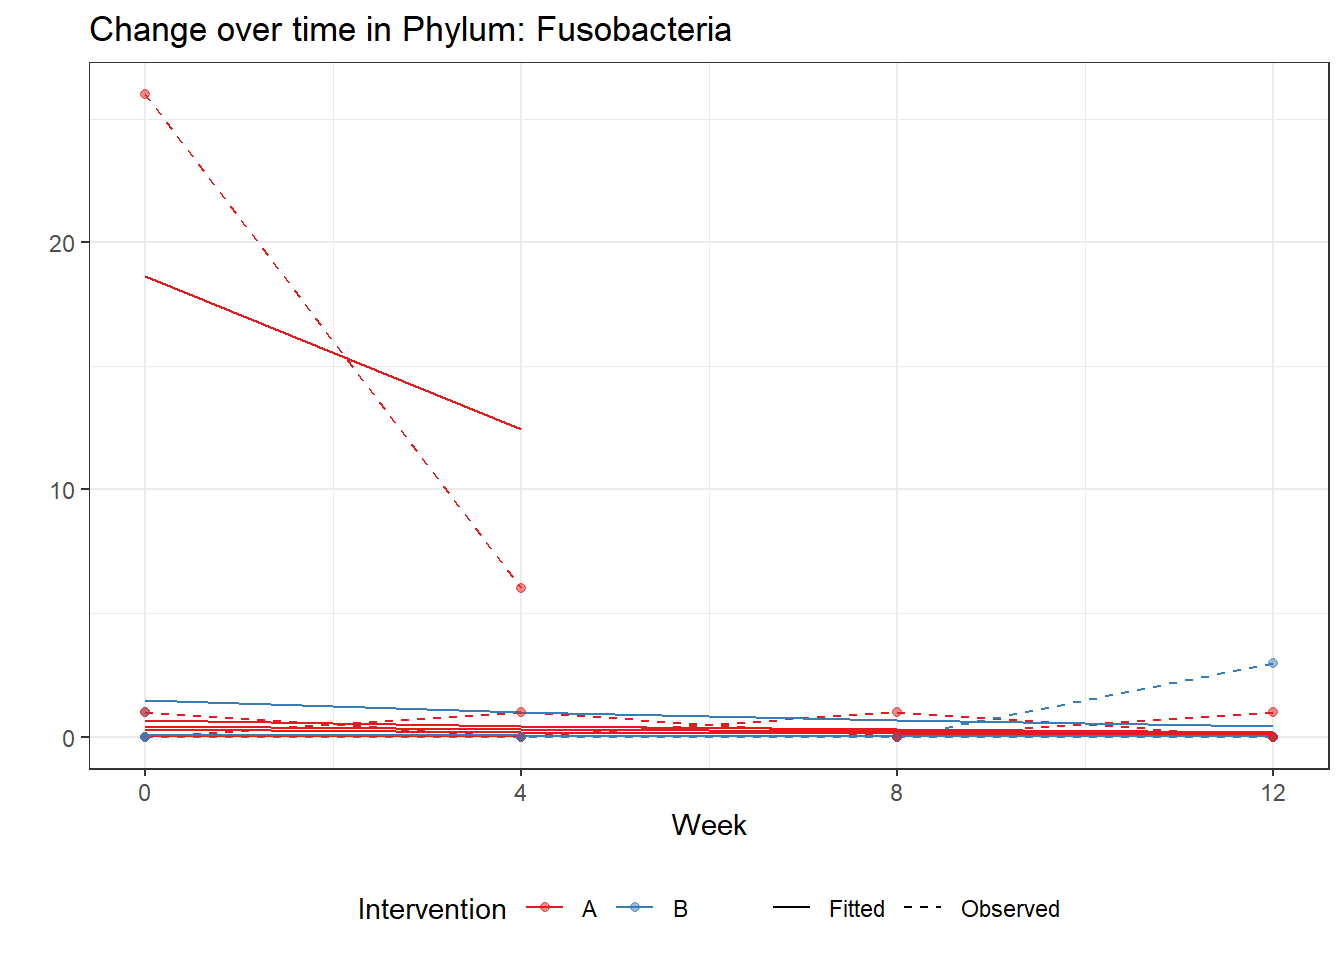
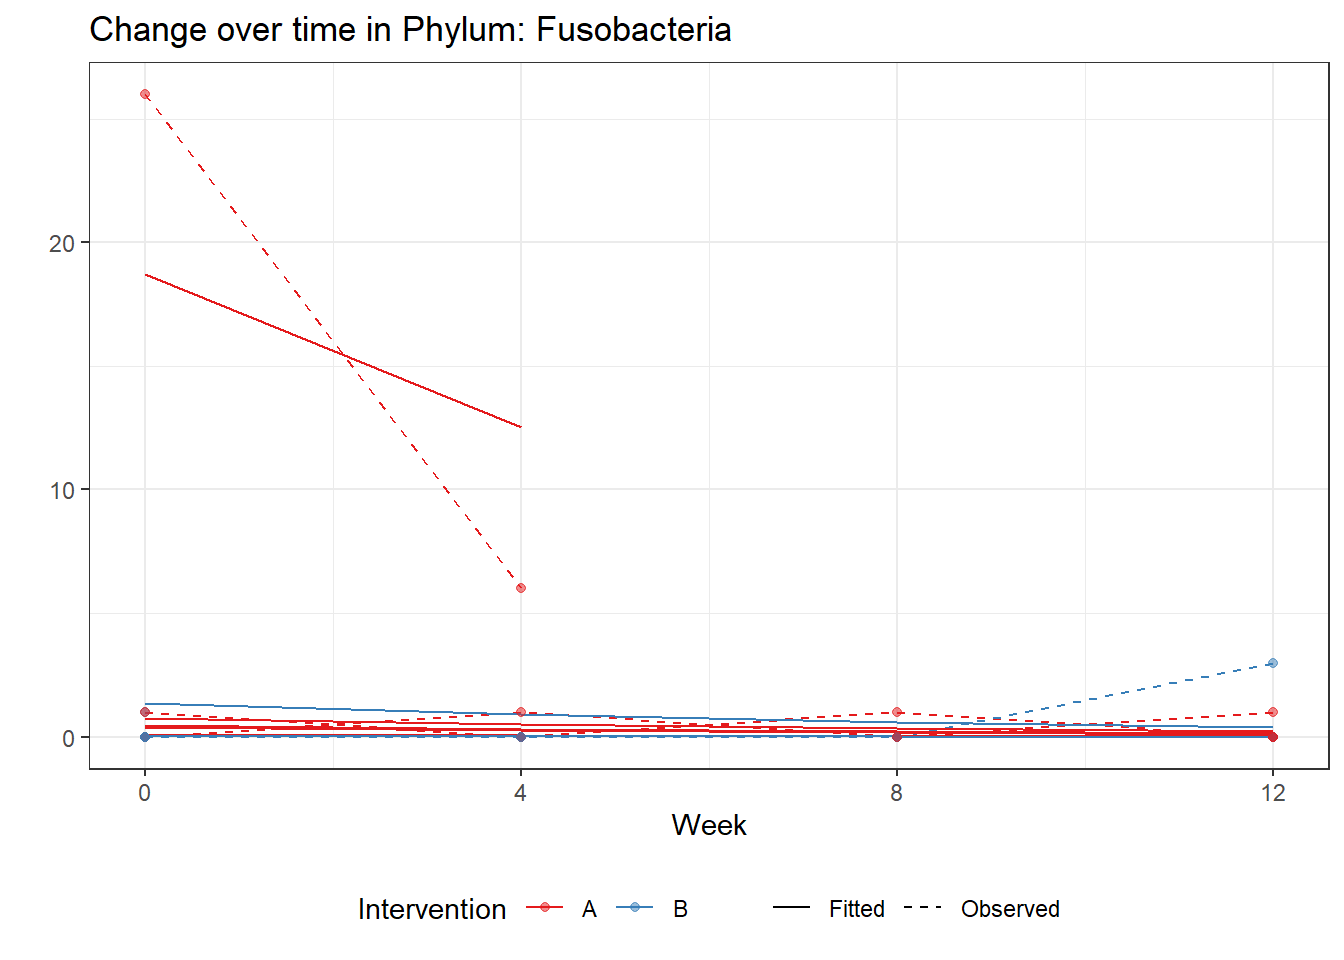
Model:  Fusobacteria ~ 1 + (1 | SubjectID)
<environment: 0x0000000041f2dbb0>

Link:    poisson


Intraclass Correlation (ICC):   0.854714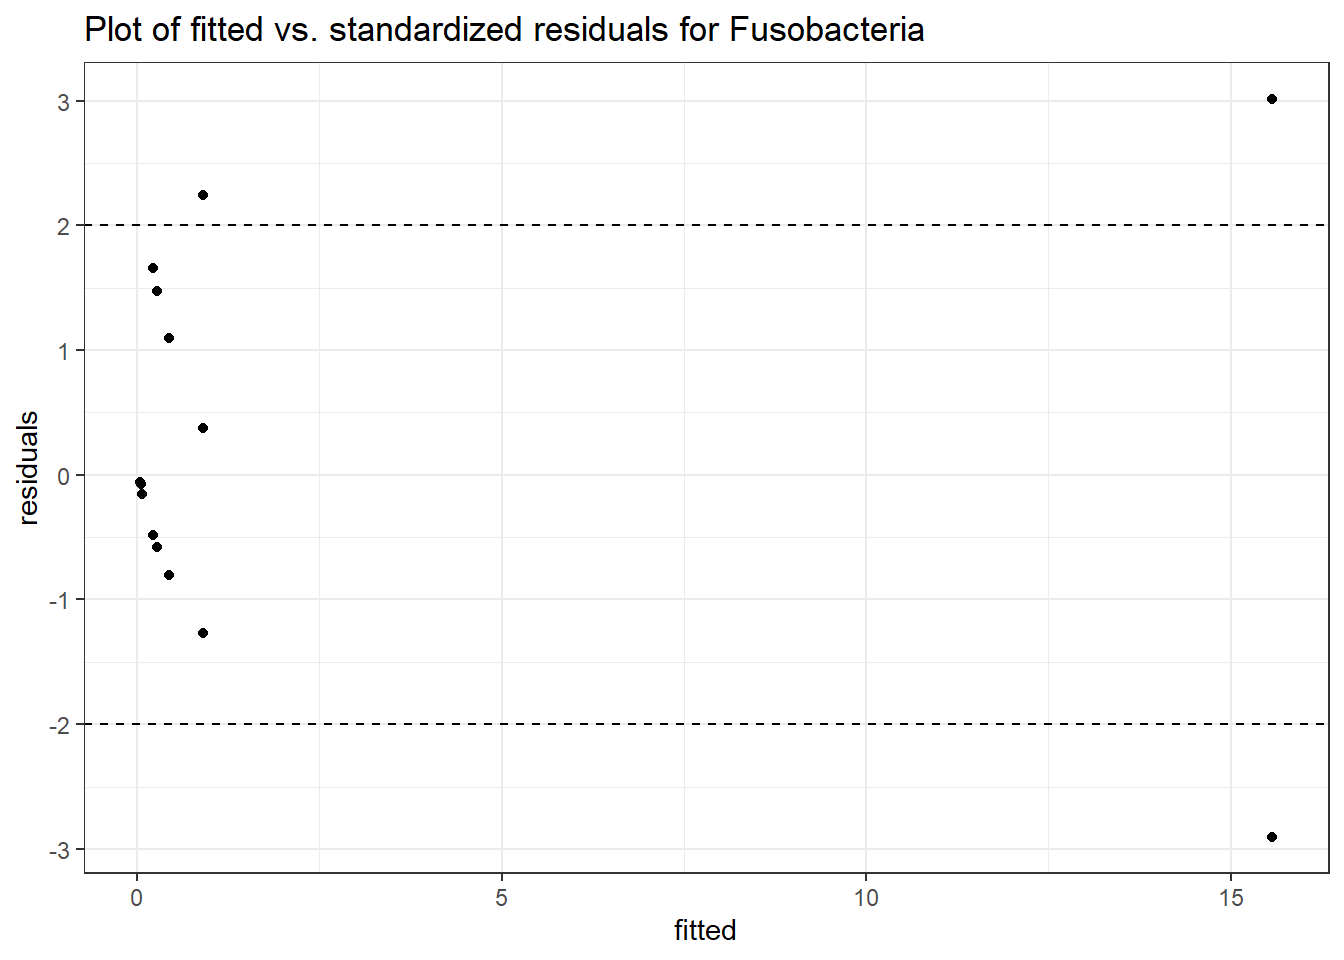
Fixed Effects (change in log)

                 Outcome Estimate Std. Error  z value Pr(>|z|)
(Intercept) Fusobacteria -2.28008    1.12843 -2.02057  0.04332


Random Effects (SD on log scale)

 Groups    Name        Std.Dev.
 SubjectID (Intercept) 2.4255

Significance test not available

#########################################
#########################################
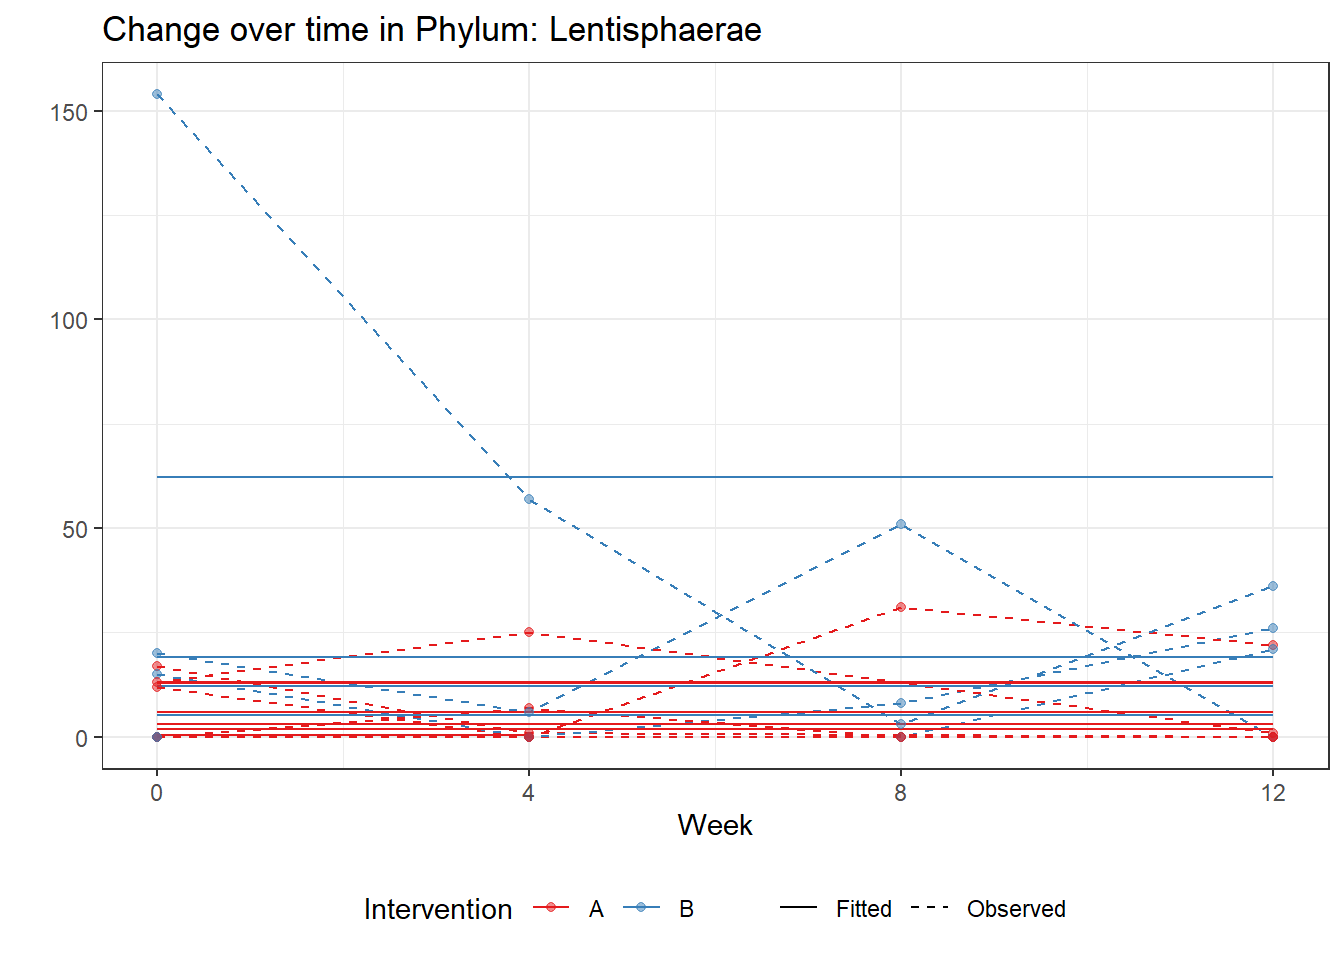
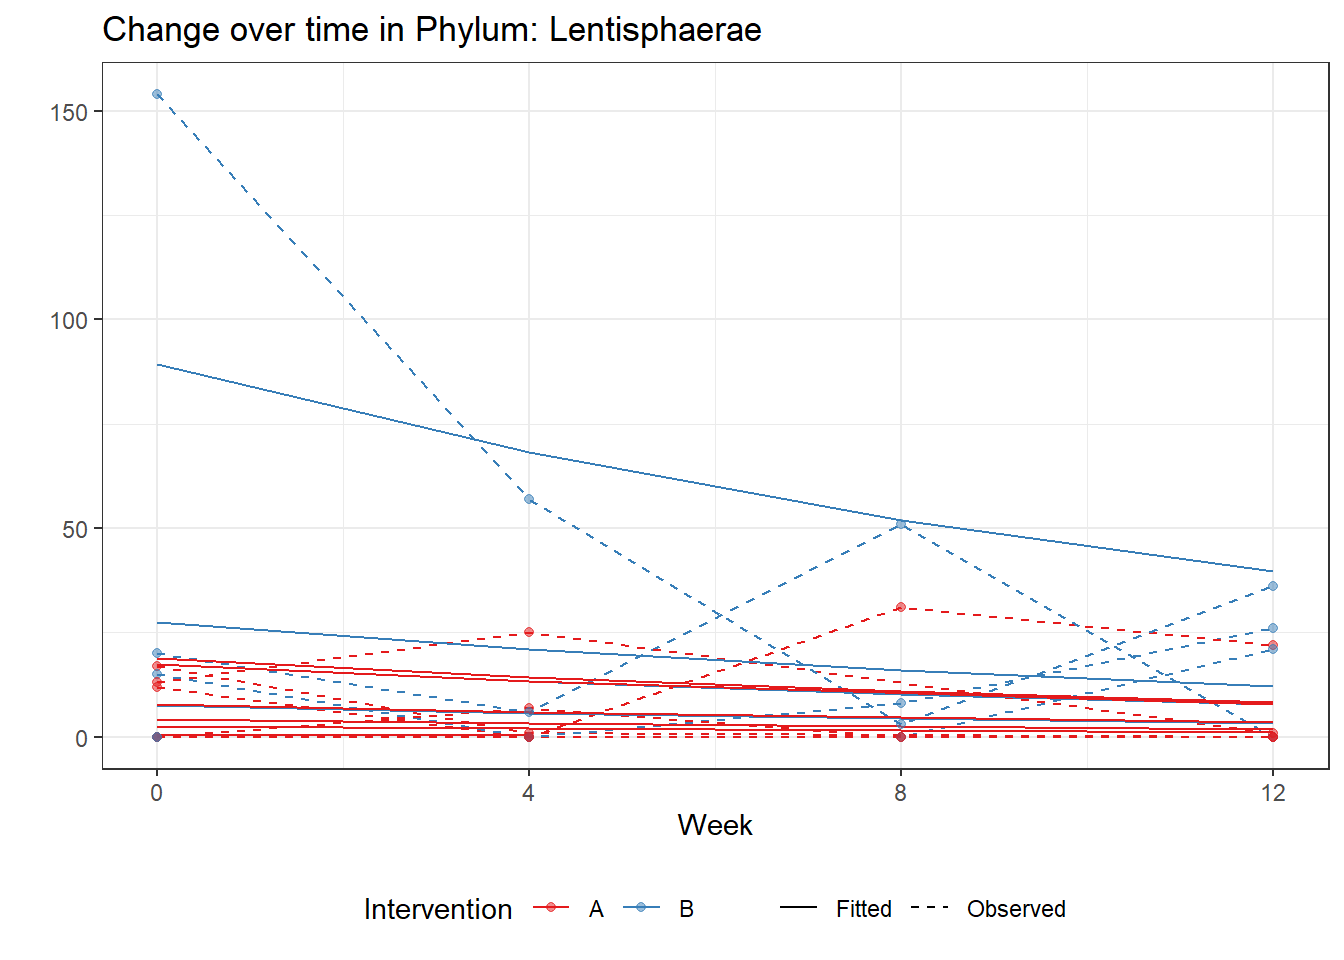
Model:  Lentisphaerae ~ 1 + (1 | SubjectID)
<environment: 0x0000000041f2dbb0>

Link:    poisson


Intraclass Correlation (ICC):   0.6843902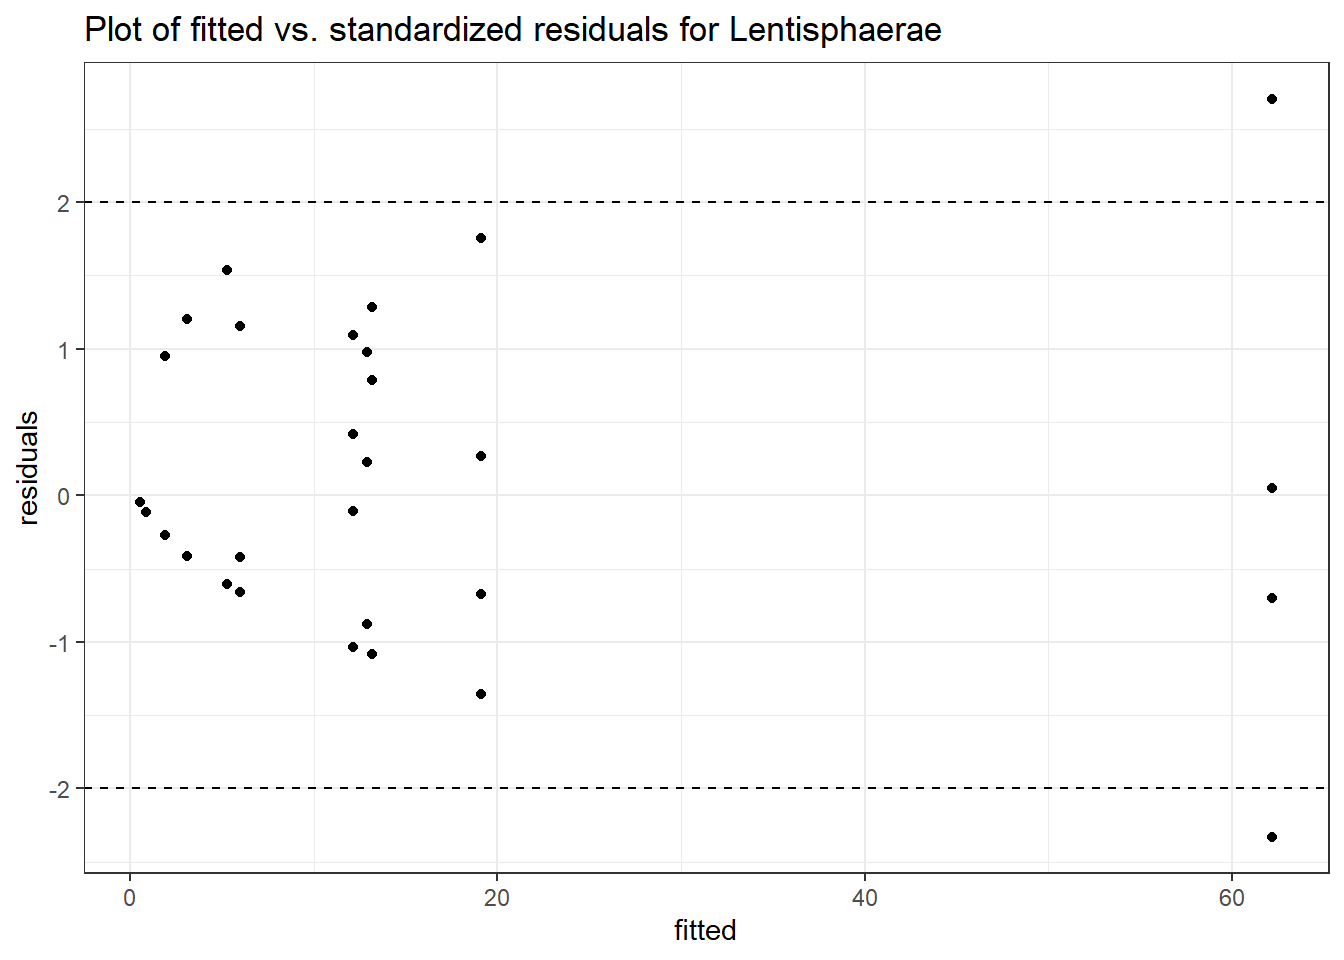
Fixed Effects (change in log)

                  Outcome Estimate Std. Error z value Pr(>|z|)
(Intercept) Lentisphaerae  1.67757    0.46839 3.58158  0.00034


Random Effects (SD on log scale)

 Groups    Name        Std.Dev.
 SubjectID (Intercept) 1.4726

Significance test not available

#########################################
#########################################
Model:  Proteobacteria ~ 1 + (1 | SubjectID)
<environment: 0x0000000041f2dbb0>

Link:    poisson


Intraclass Correlation (ICC):   0.09326096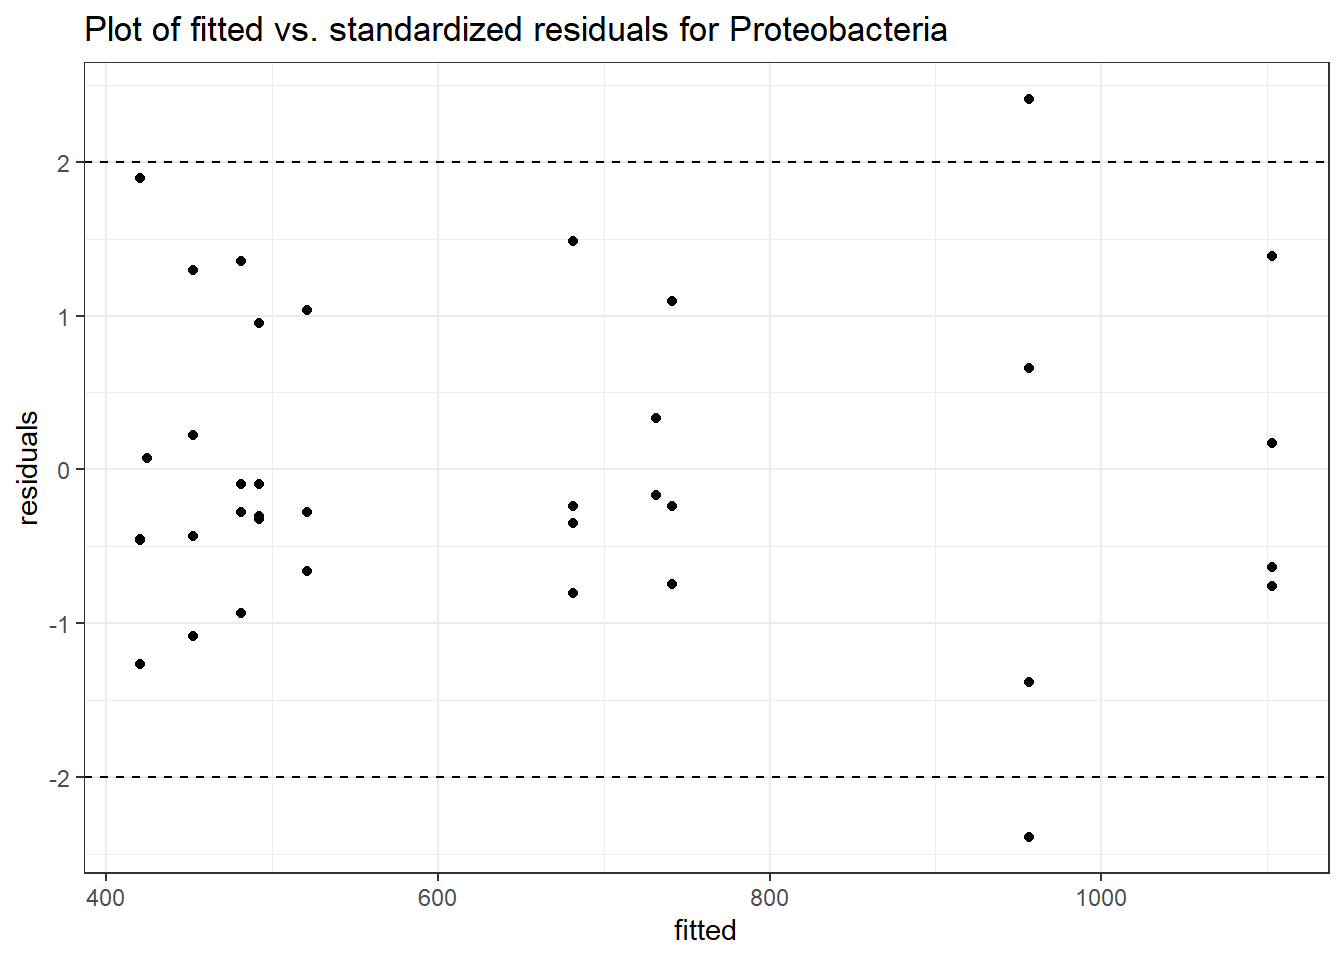
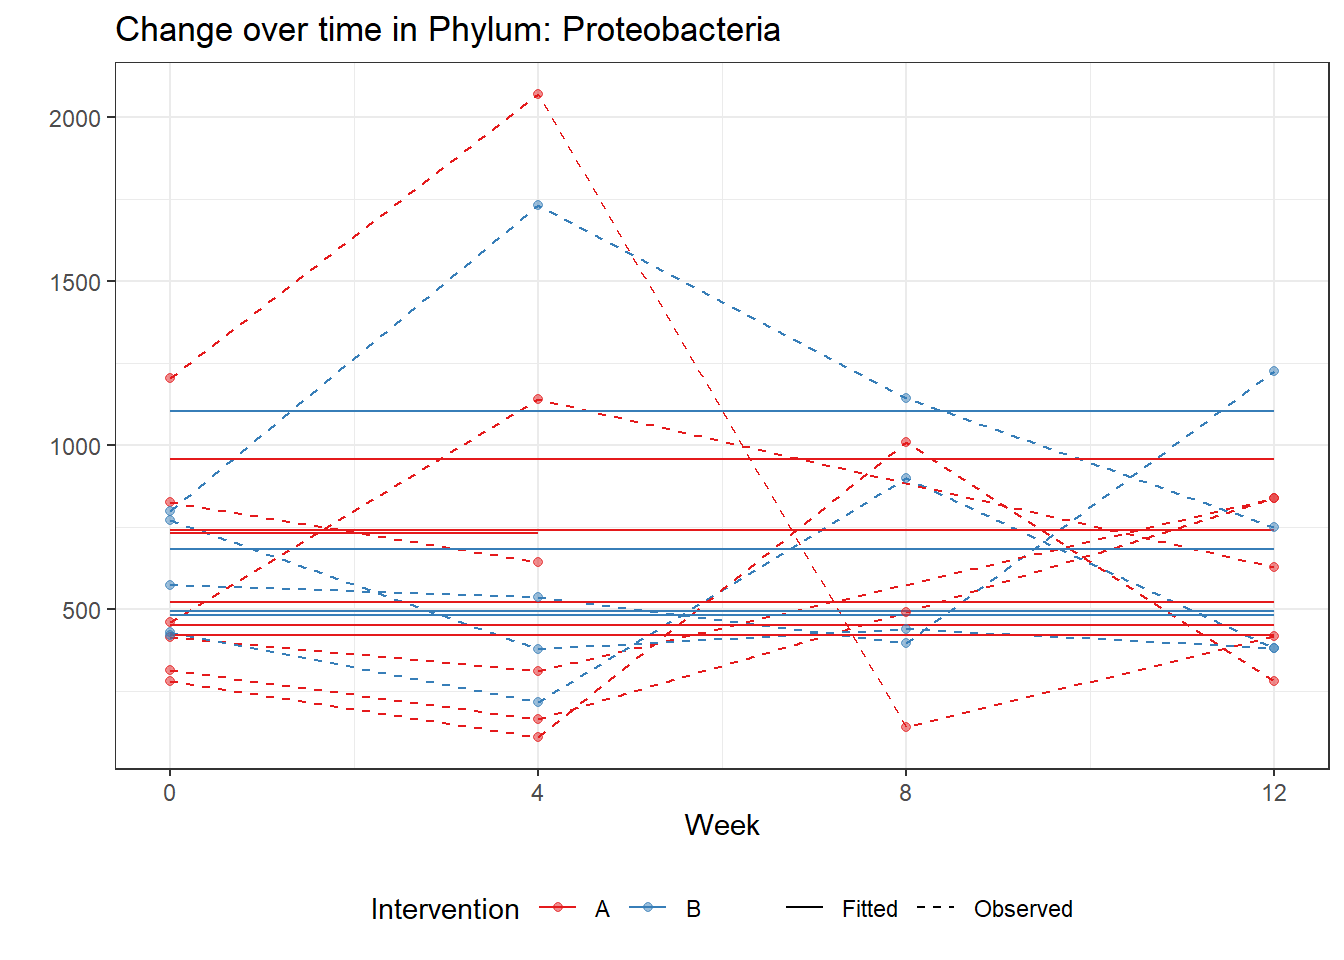
Fixed Effects (change in log)

                   Outcome Estimate Std. Error z value Pr(>|z|)
(Intercept) Proteobacteria  6.40274      0.097 66.0065        0


Random Effects (SD on log scale)

 Groups    Name        Std.Dev.
 SubjectID (Intercept) 0.32071

Significance test not available

#########################################
#########################################
Model:  Tenericutes ~ 1 + (1 | SubjectID)
<environment: 0x0000000041f2dbb0>

Link:    poisson


Intraclass Correlation (ICC):   0.9129633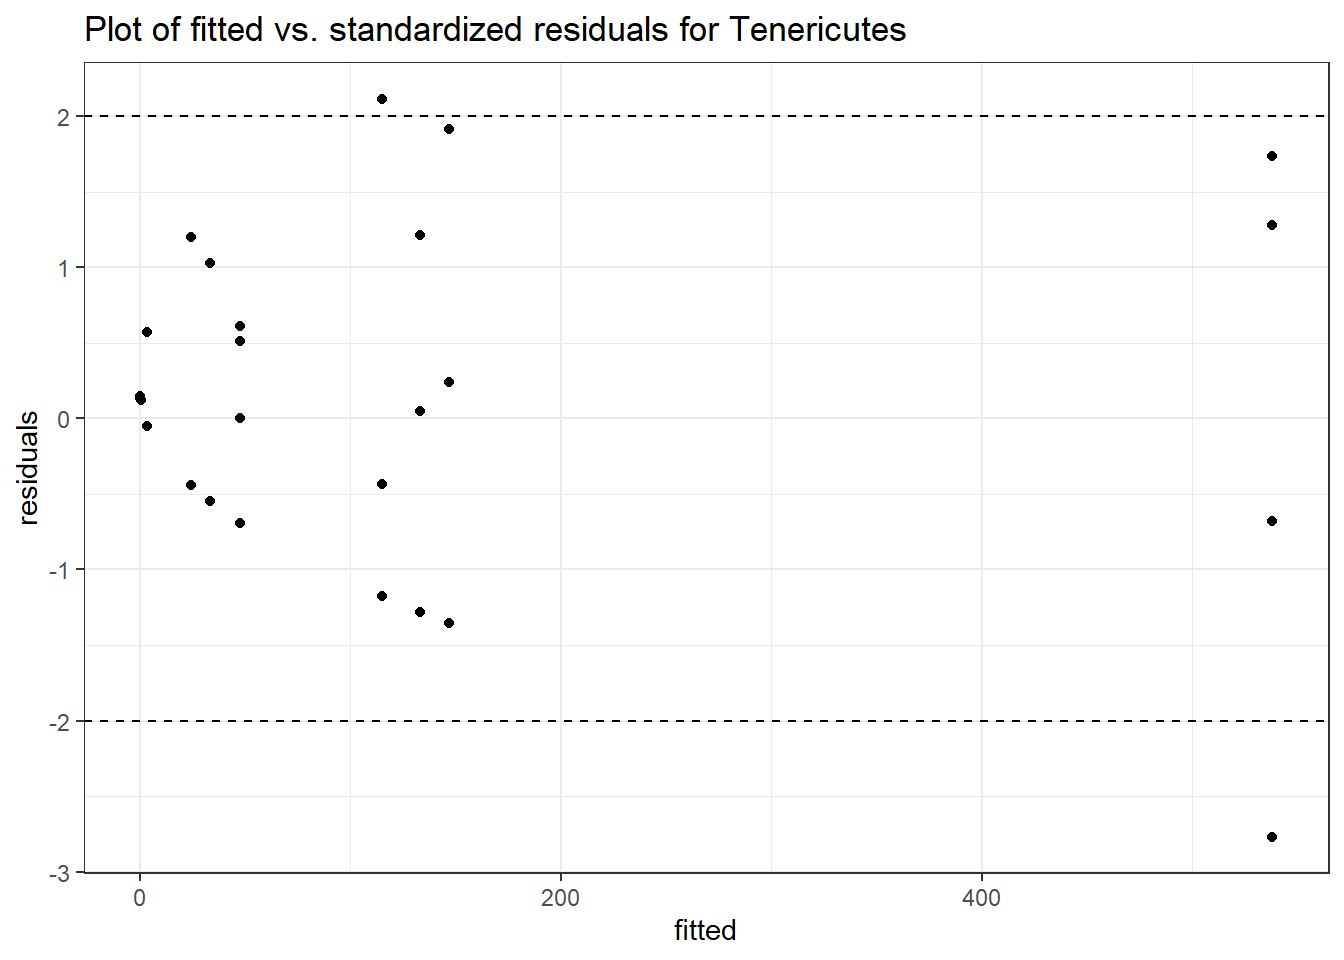
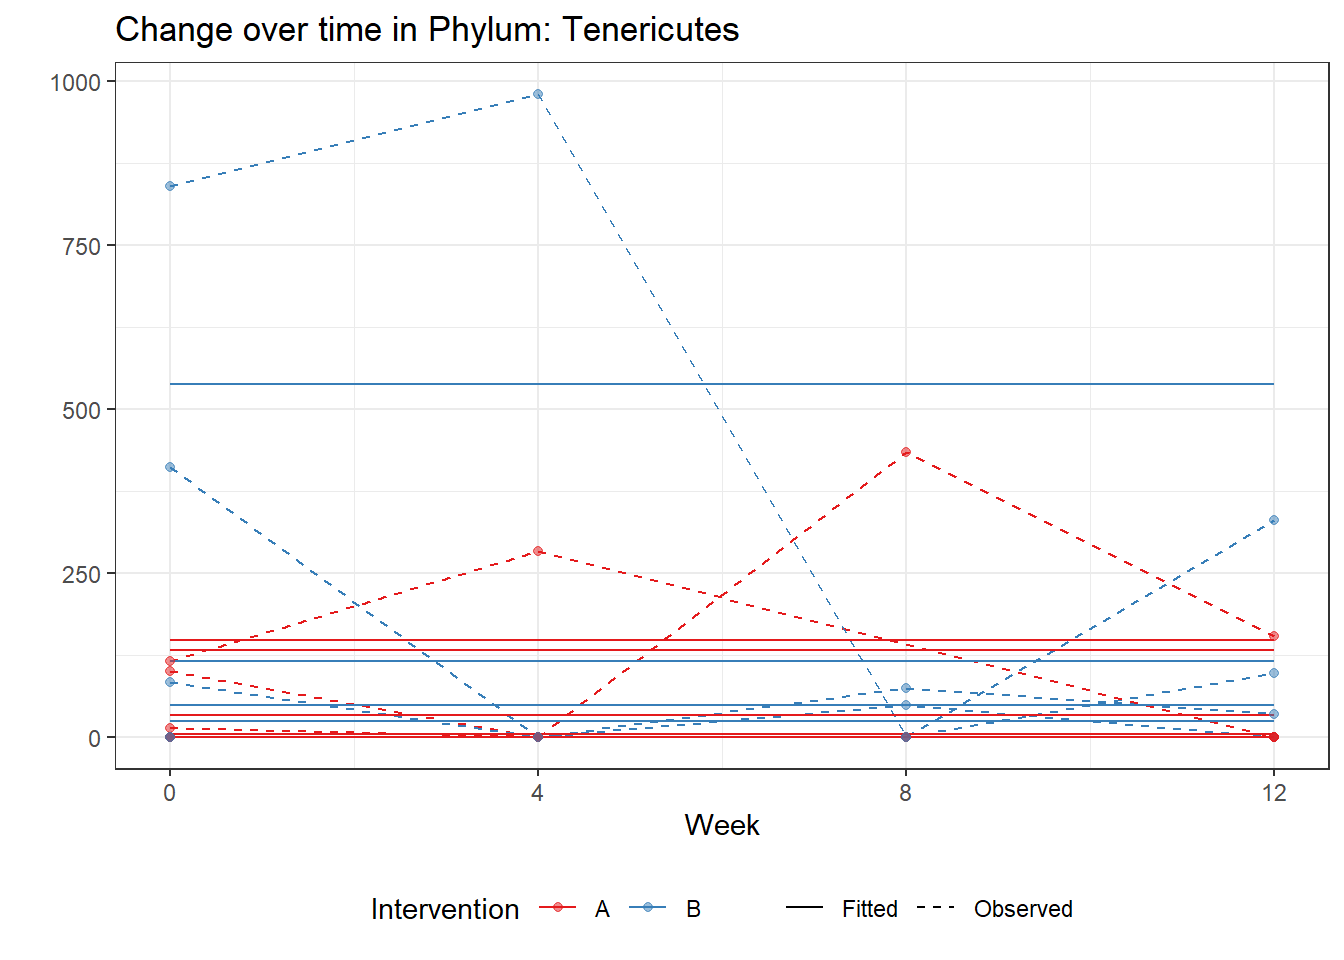
Fixed Effects (change in log)

                Outcome Estimate Std. Error z value Pr(>|z|)
(Intercept) Tenericutes  2.29296    1.01091  2.2682  0.02332


Random Effects (SD on log scale)

 Groups    Name        Std.Dev.
 SubjectID (Intercept) 3.2387

Significance test not available

#########################################
#########################################
Model:  Verrucomicrobia ~ 1 + (1 | SubjectID)
<environment: 0x0000000041f2dbb0>

Link:    poisson


Intraclass Correlation (ICC):   0.8745356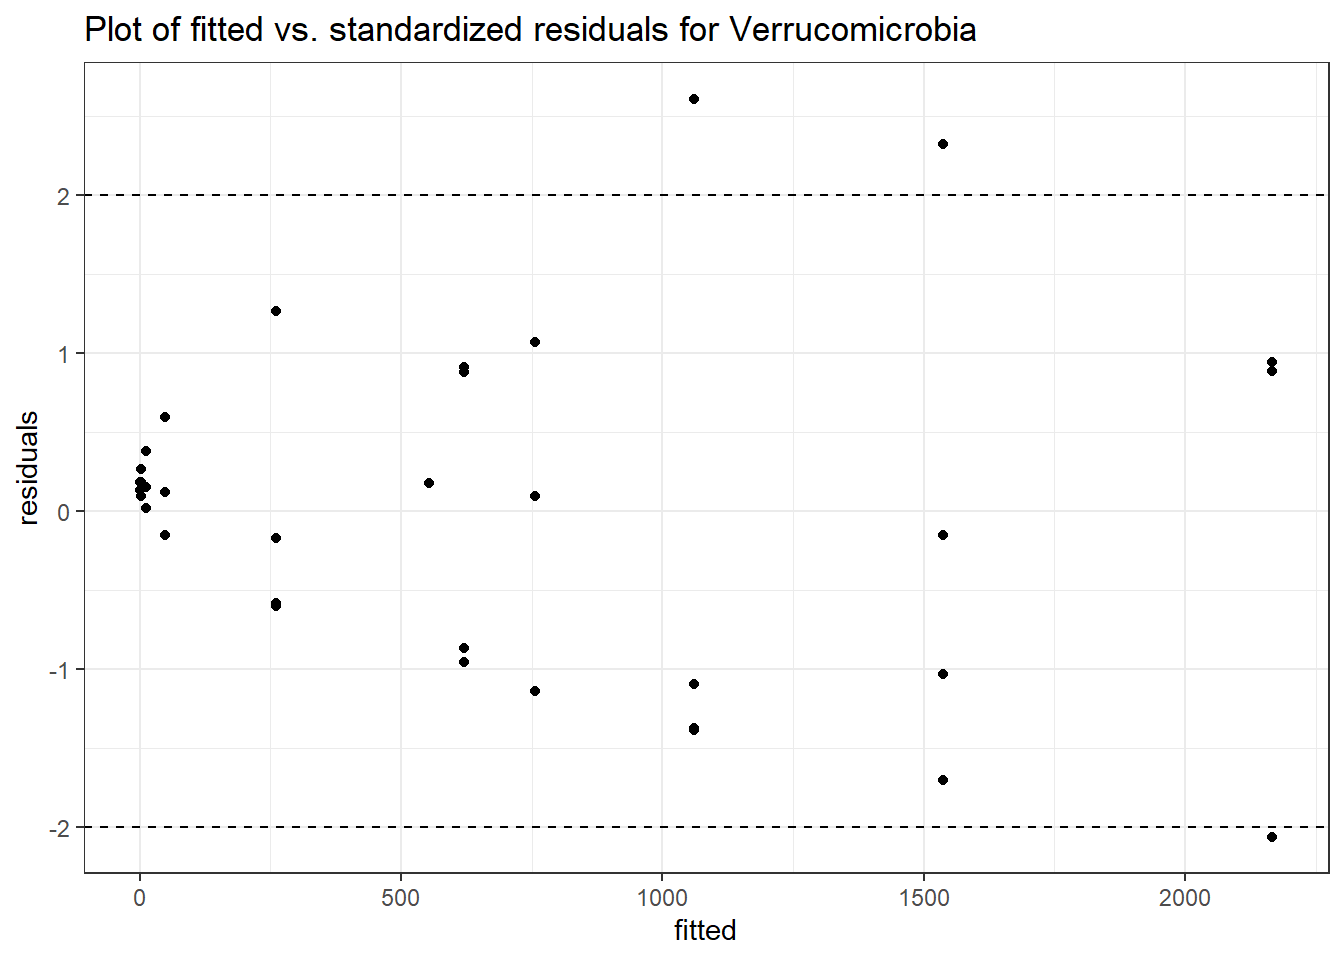
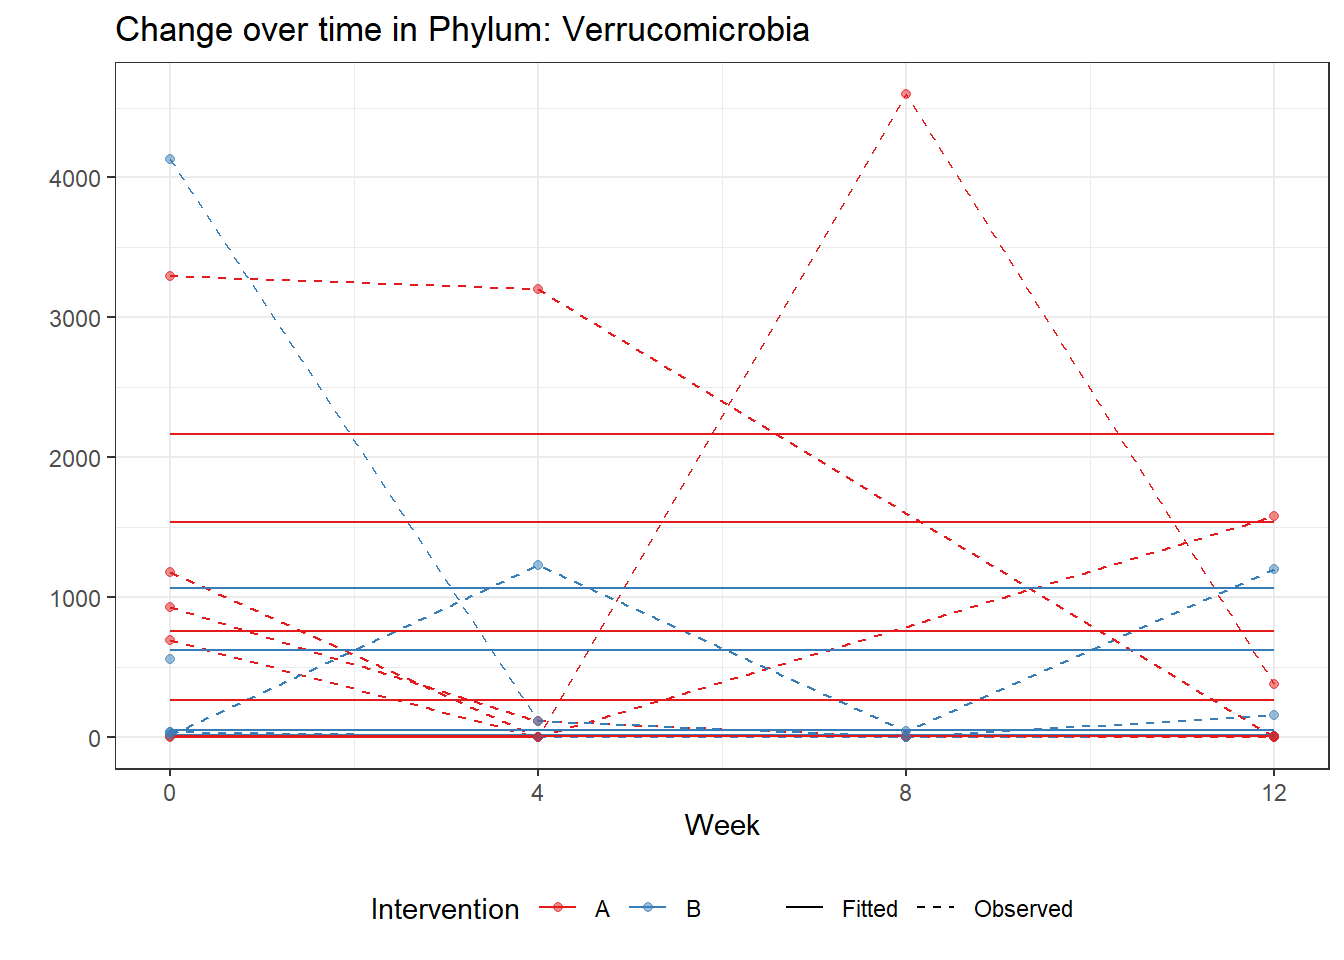
Fixed Effects (change in log)

                    Outcome Estimate Std. Error z value Pr(>|z|)
(Intercept) Verrucomicrobia  4.89307    0.79979 6.11792        0


Random Effects (SD on log scale)

 Groups    Name        Std.Dev.
 SubjectID (Intercept) 2.6401

Significance test not available
Fixed Effect of Time
\[\begin{align*} h\left(Y_{ij}\right)&=\beta_{0j} + \beta_{1j}*(Week)_{ij}+ r_{ij}\\ \beta_{0j}&= \gamma_{00} + u_{0j}\\ \beta_{1j}&= \gamma_{10}\\ \end{align*}\]
phylum.fit1 <- glmm_microbiome(mydata=microbiome_data,model.number=1,
                               taxa.level="Phylum", link="poisson",
                               model="1 + time + (1|SubjectID)")
#########################################
#########################################
Model:  Actinobacteria ~ 1 + time + (1 | SubjectID)
<environment: 0x00000000405d6288>

Link:    poisson


Intraclass Correlation (ICC):   0.5426055

Fixed Effects (change in log)

                   Outcome Estimate Std. Error   z value Pr(>|z|)
(Intercept) Actinobacteria  3.89720    0.33155  11.75456        0
time        Actinobacteria -0.26049    0.02241 -11.62621        0


Random Effects (SD on log scale)

 Groups    Name        Std.Dev.
 SubjectID (Intercept) 1.0892

Significance test not available

#########################################
#########################################
Model:  Bacteroidetes ~ 1 + time + (1 | SubjectID)
<environment: 0x00000000405d6288>

Link:    poisson


Intraclass Correlation (ICC):   0.09952787

Fixed Effects (change in log)

                  Outcome Estimate Std. Error   z value Pr(>|z|)
(Intercept) Bacteroidetes  8.77944    0.10029  87.53848        0
time        Bacteroidetes -0.02541    0.00189 -13.45403        0


Random Effects (SD on log scale)

 Groups    Name        Std.Dev.
 SubjectID (Intercept) 0.33246

Significance test not available

#########################################
#########################################
Model:  Cyanobacteria ~ 1 + time + (1 | SubjectID)
<environment: 0x00000000405d6288>

Link:    poisson


Intraclass Correlation (ICC):   0.8578909

Fixed Effects (change in log)

                  Outcome Estimate Std. Error   z value Pr(>|z|)
(Intercept) Cyanobacteria  2.55435    0.75897   3.36553  0.00076
time        Cyanobacteria -0.60192    0.02518 -23.90231  0.00000


Random Effects (SD on log scale)

 Groups    Name        Std.Dev.
 SubjectID (Intercept) 2.457

Significance test not available

#########################################
#########################################
Model:  Euryarchaeota ~ 1 + time + (1 | SubjectID)
<environment: 0x00000000405d6288>

Link:    poisson


Intraclass Correlation (ICC):   0.7860171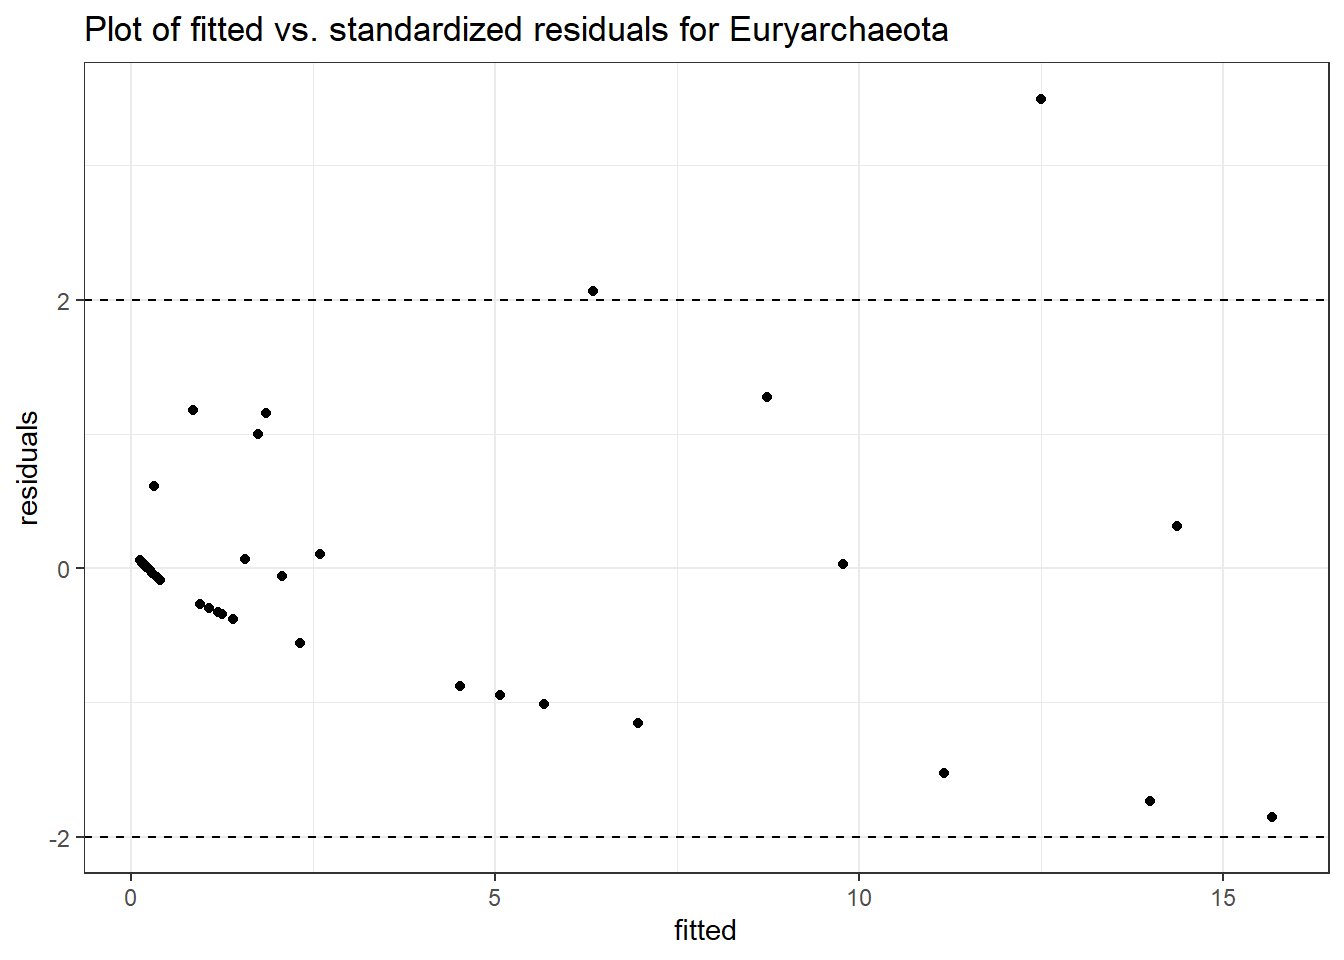
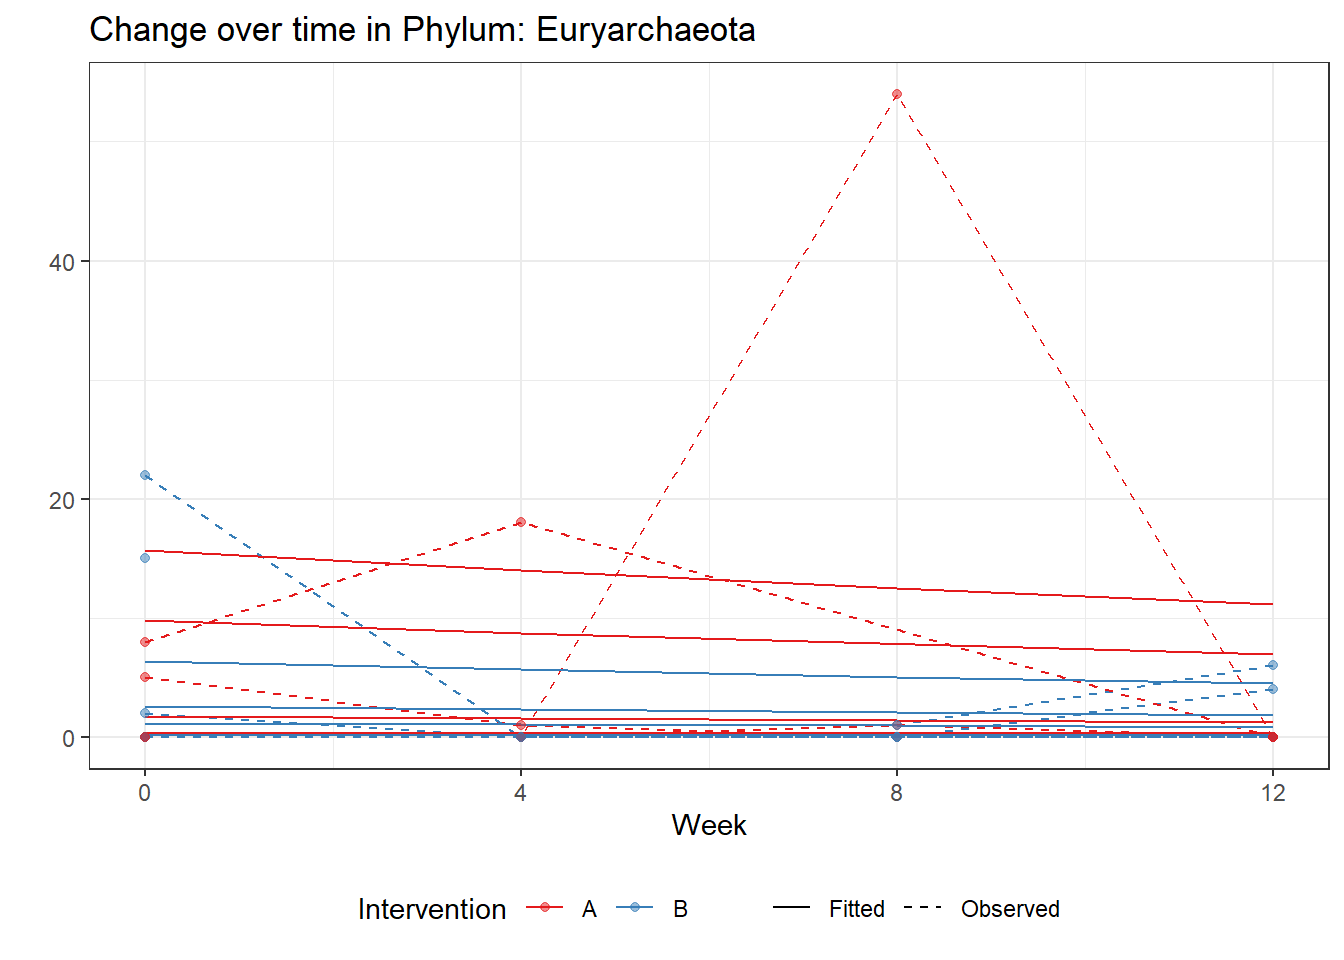
Fixed Effects (change in log)

                  Outcome Estimate Std. Error  z value Pr(>|z|)
(Intercept) Euryarchaeota  0.34352    0.63946  0.53719  0.59113
time        Euryarchaeota -0.11323    0.07861 -1.44043  0.14975


Random Effects (SD on log scale)

 Groups    Name        Std.Dev.
 SubjectID (Intercept) 1.9166

Significance test not available

#########################################
#########################################
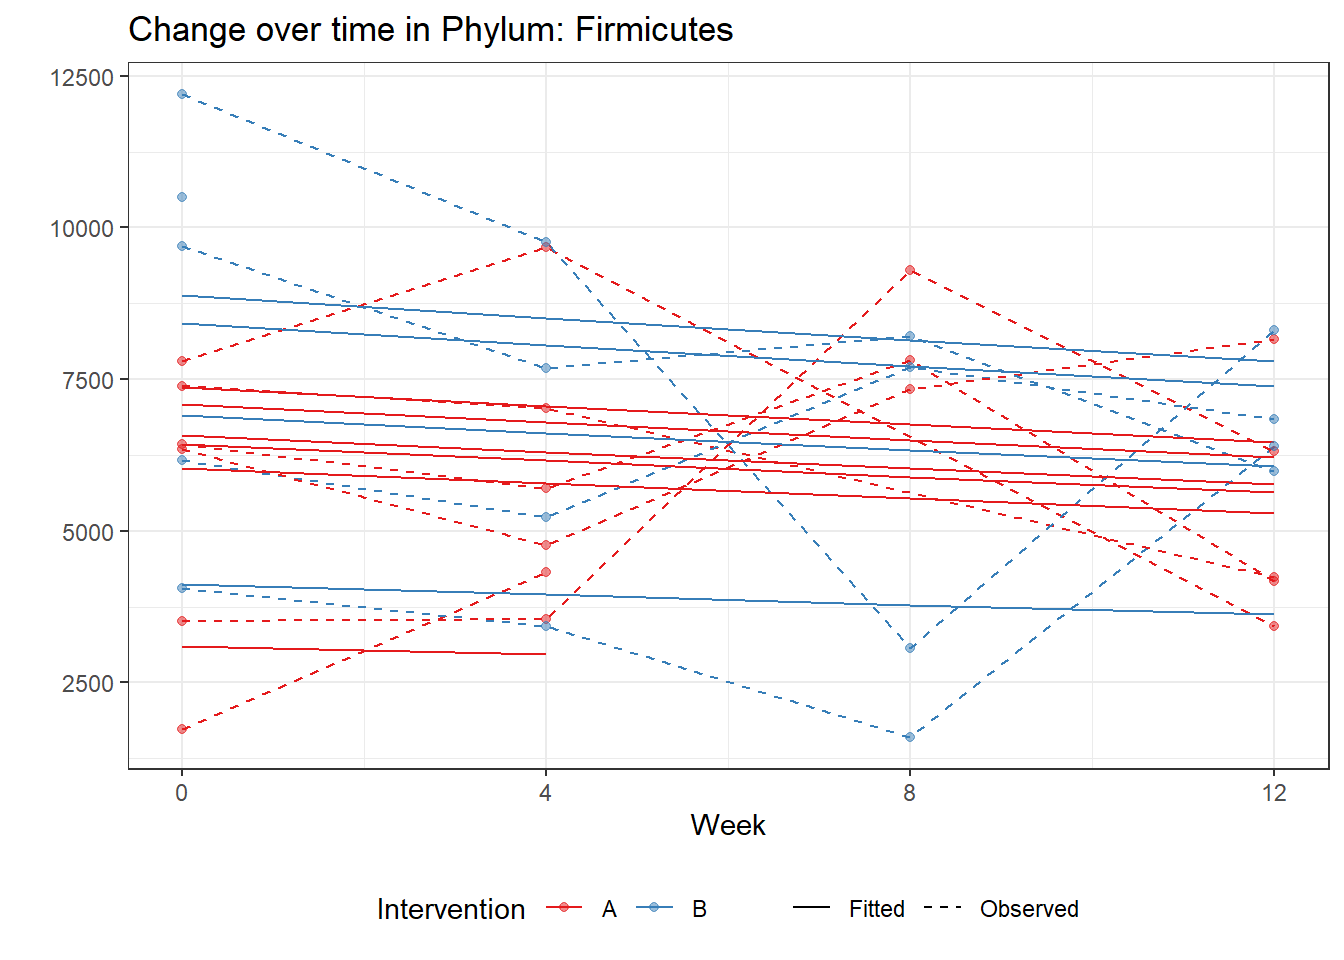
Model:  Firmicutes ~ 1 + time + (1 | SubjectID)
<environment: 0x00000000405d6288>

Link:    poisson


Intraclass Correlation (ICC):   0.096963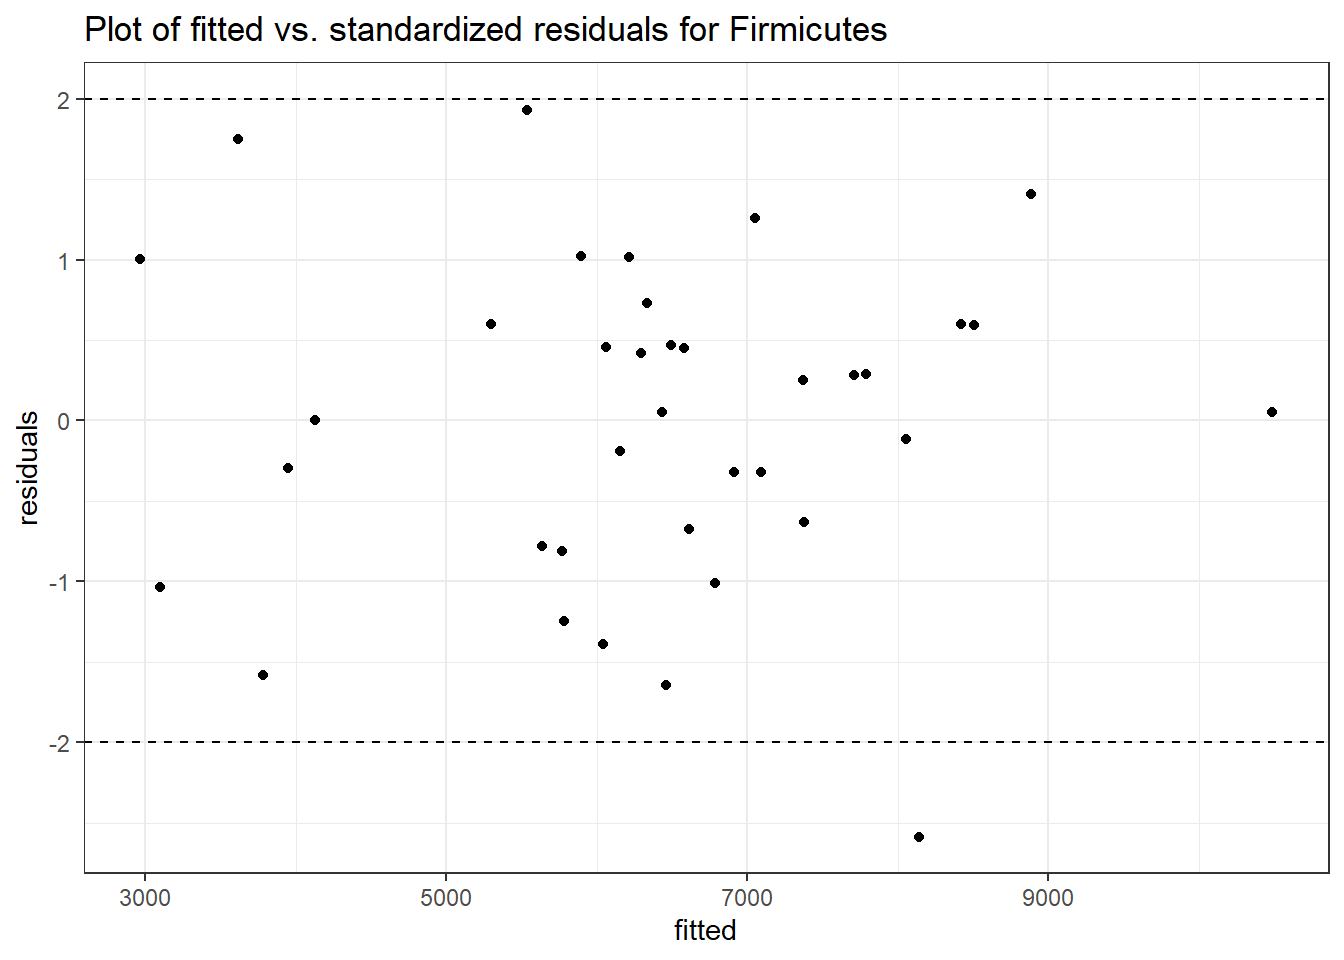
Fixed Effects (change in log)

               Outcome Estimate Std. Error   z value Pr(>|z|)
(Intercept) Firmicutes  8.78496    0.09885  88.86992        0
time        Firmicutes -0.04391    0.00187 -23.47528        0


Random Effects (SD on log scale)

 Groups    Name        Std.Dev.
 SubjectID (Intercept) 0.32768

Significance test not available

#########################################
#########################################
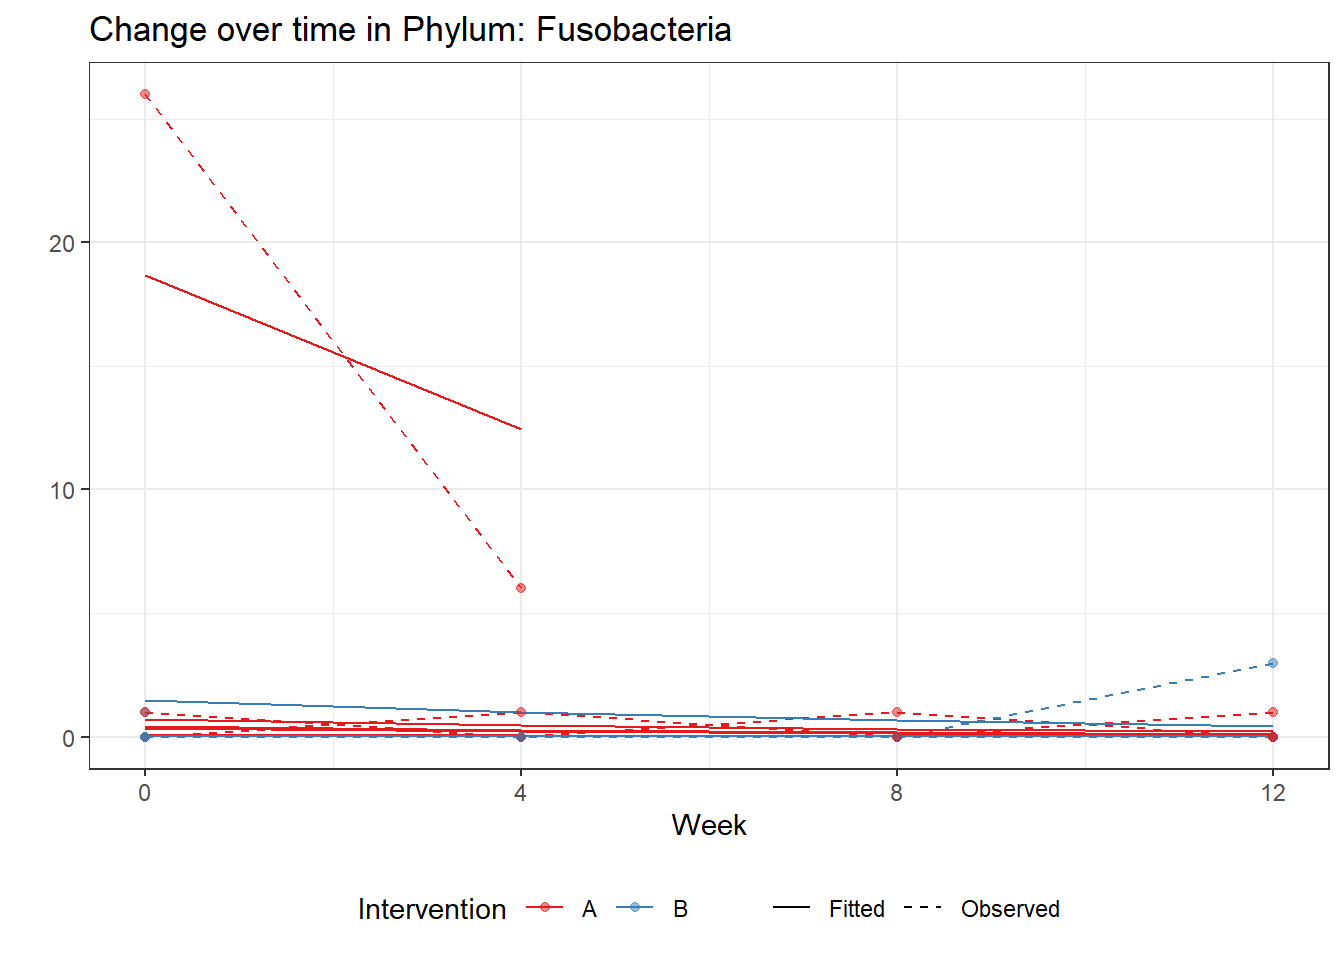
Model:  Fusobacteria ~ 1 + time + (1 | SubjectID)
<environment: 0x00000000405d6288>

Link:    poisson


Intraclass Correlation (ICC):   0.8416402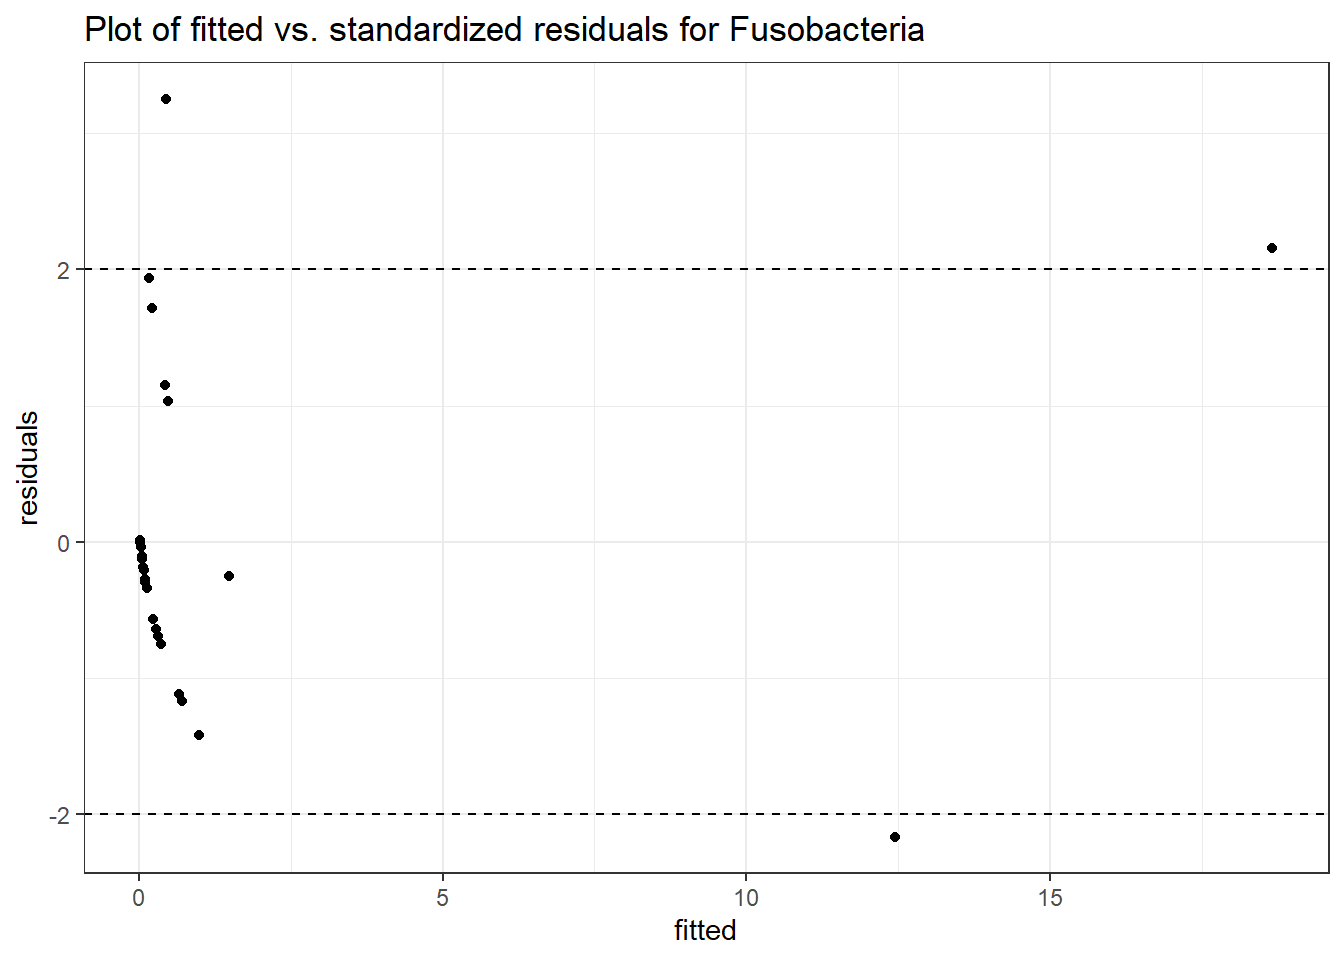
Fixed Effects (change in log)

                 Outcome Estimate Std. Error  z value Pr(>|z|)
(Intercept) Fusobacteria -1.77193    1.10786 -1.59941  0.10973
time        Fusobacteria -0.40467    0.24249 -1.66879  0.09516


Random Effects (SD on log scale)

 Groups    Name        Std.Dev.
 SubjectID (Intercept) 2.3054

Significance test not available

#########################################
#########################################
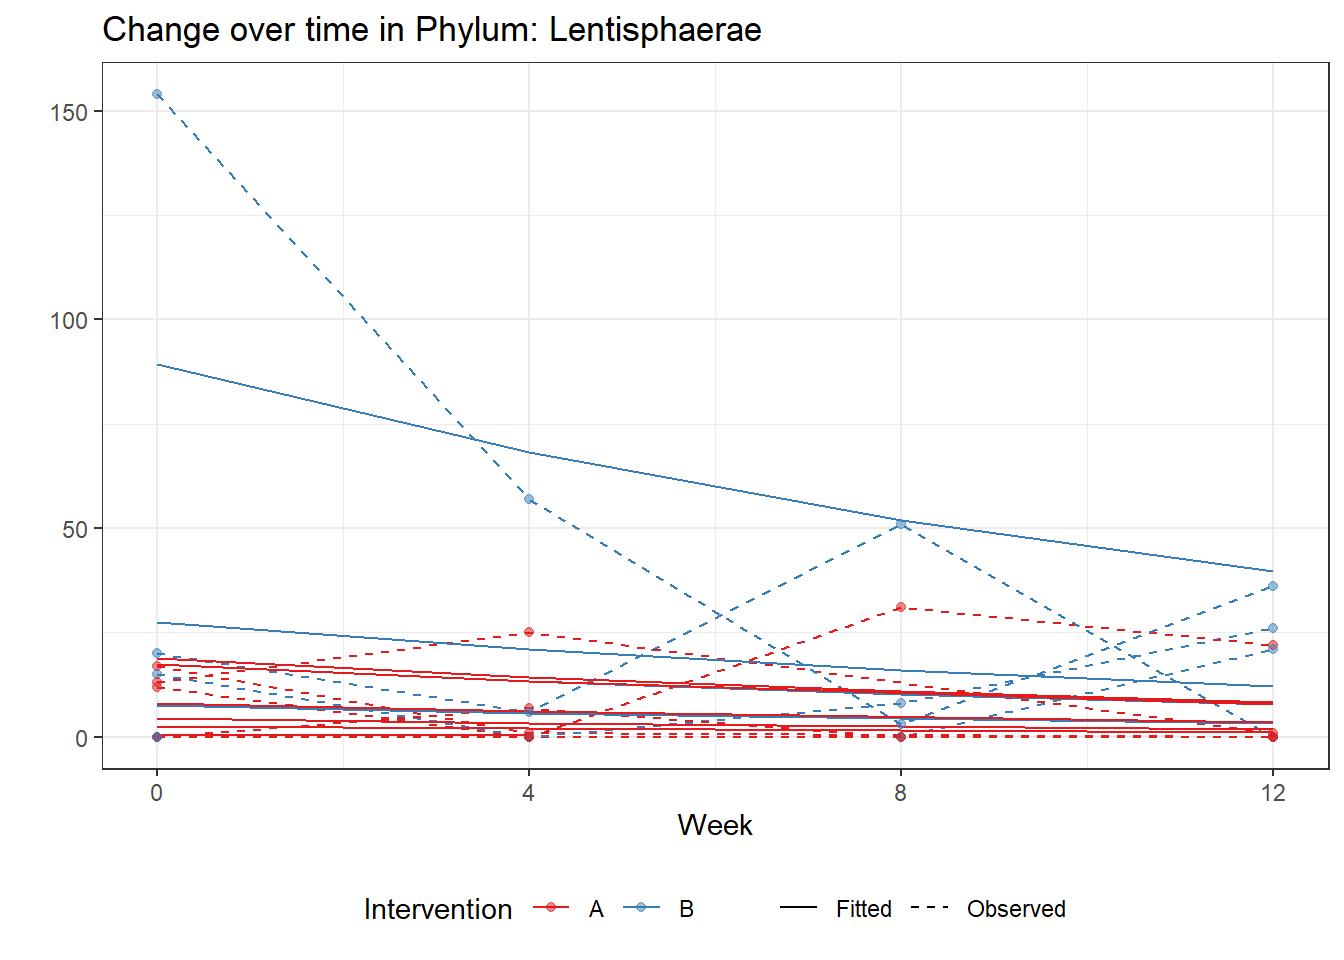
Model:  Lentisphaerae ~ 1 + time + (1 | SubjectID)
<environment: 0x00000000405d6288>

Link:    poisson


Intraclass Correlation (ICC):   0.7110489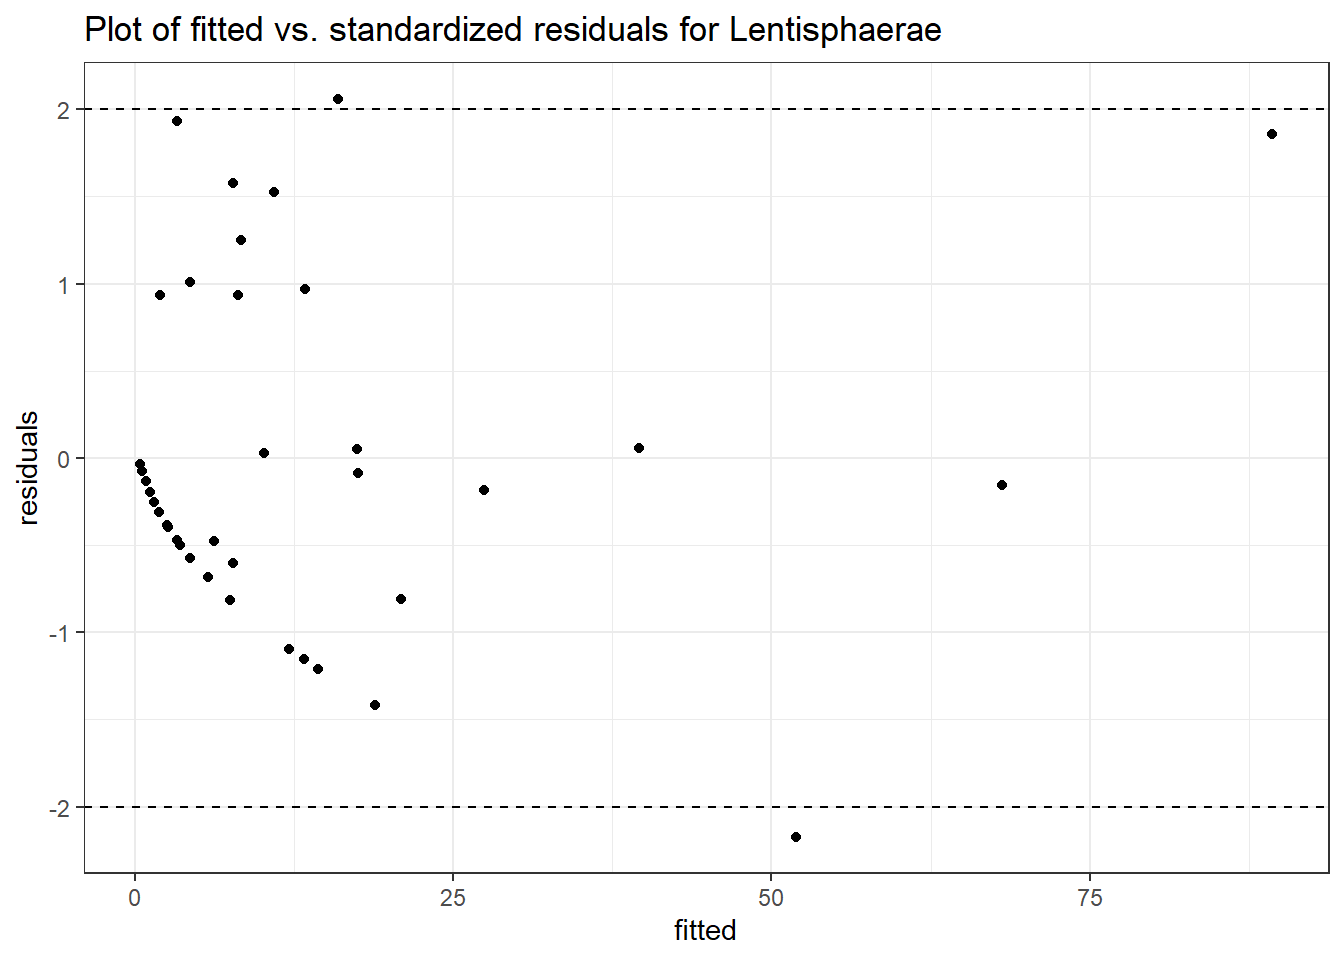
Fixed Effects (change in log)

                  Outcome Estimate Std. Error  z value Pr(>|z|)
(Intercept) Lentisphaerae  1.96678    0.49800  3.94935    8e-05
time        Lentisphaerae -0.27109    0.03998 -6.78139    0e+00


Random Effects (SD on log scale)

 Groups    Name        Std.Dev.
 SubjectID (Intercept) 1.5687

Significance test not available

#########################################
#########################################
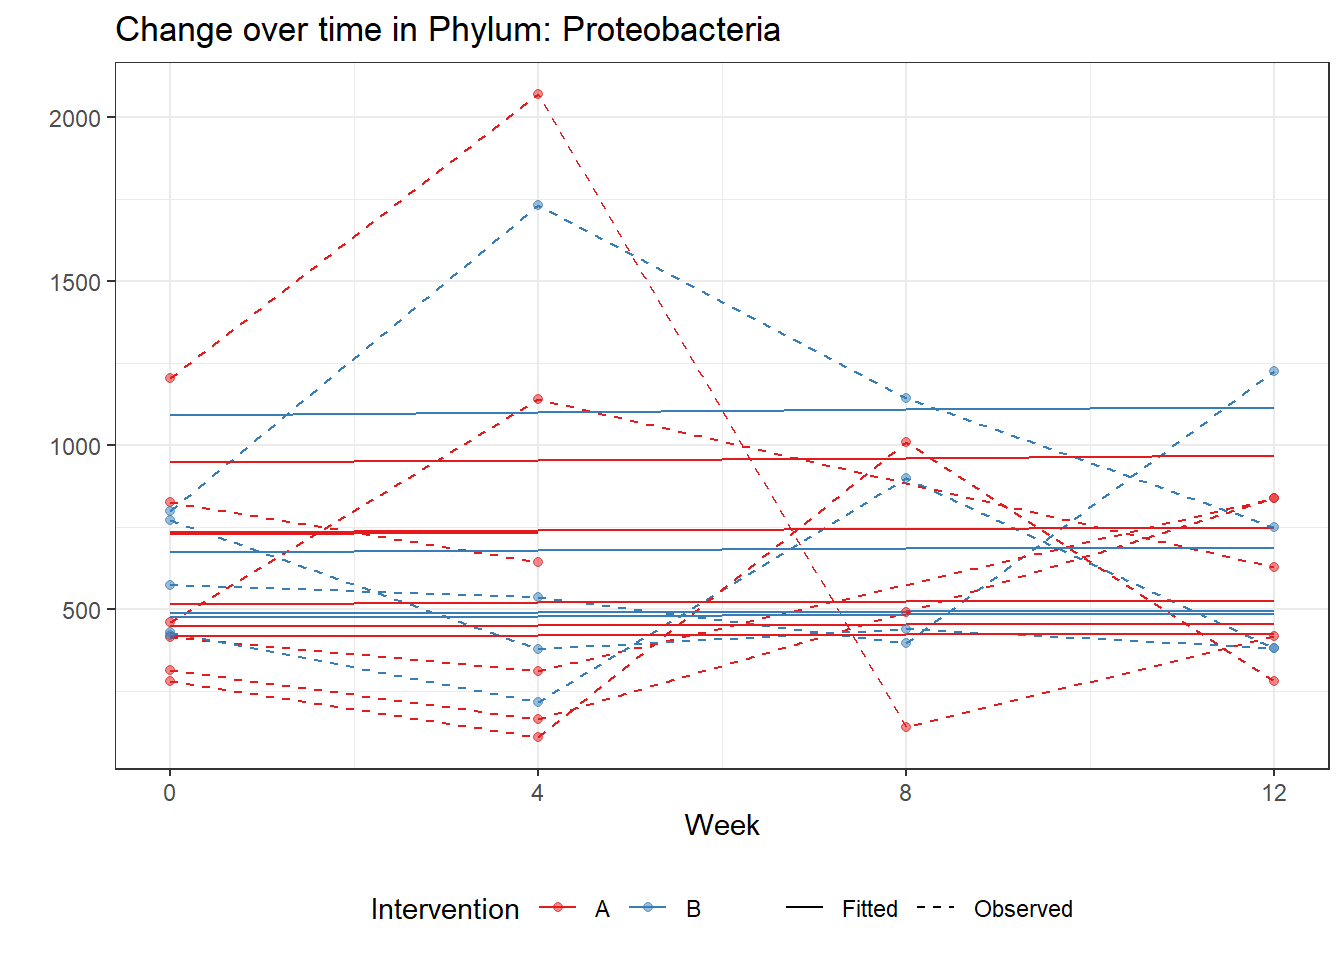
Model:  Proteobacteria ~ 1 + time + (1 | SubjectID)
<environment: 0x00000000405d6288>

Link:    poisson


Intraclass Correlation (ICC):   0.09290682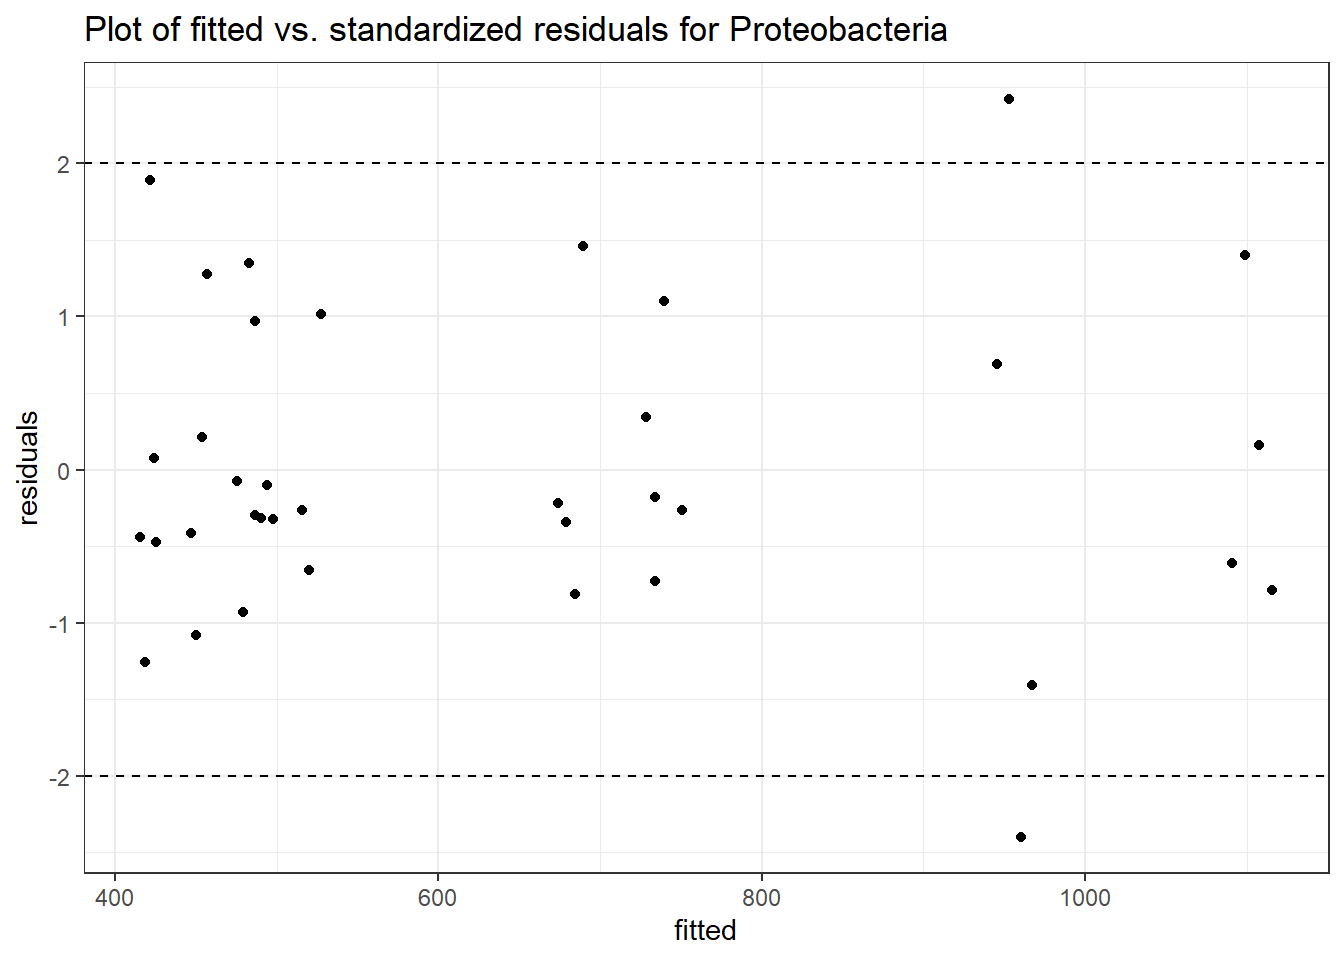
Fixed Effects (change in log)

                   Outcome Estimate Std. Error  z value Pr(>|z|)
(Intercept) Proteobacteria  6.39332    0.09708 65.85861  0.00000
time        Proteobacteria  0.00755    0.00585  1.29033  0.19694


Random Effects (SD on log scale)

 Groups    Name        Std.Dev.
 SubjectID (Intercept) 0.32004

Significance test not available

#########################################
#########################################
Model:  Tenericutes ~ 1 + time + (1 | SubjectID)
<environment: 0x00000000405d6288>

Link:    poisson


Intraclass Correlation (ICC):   0.9180696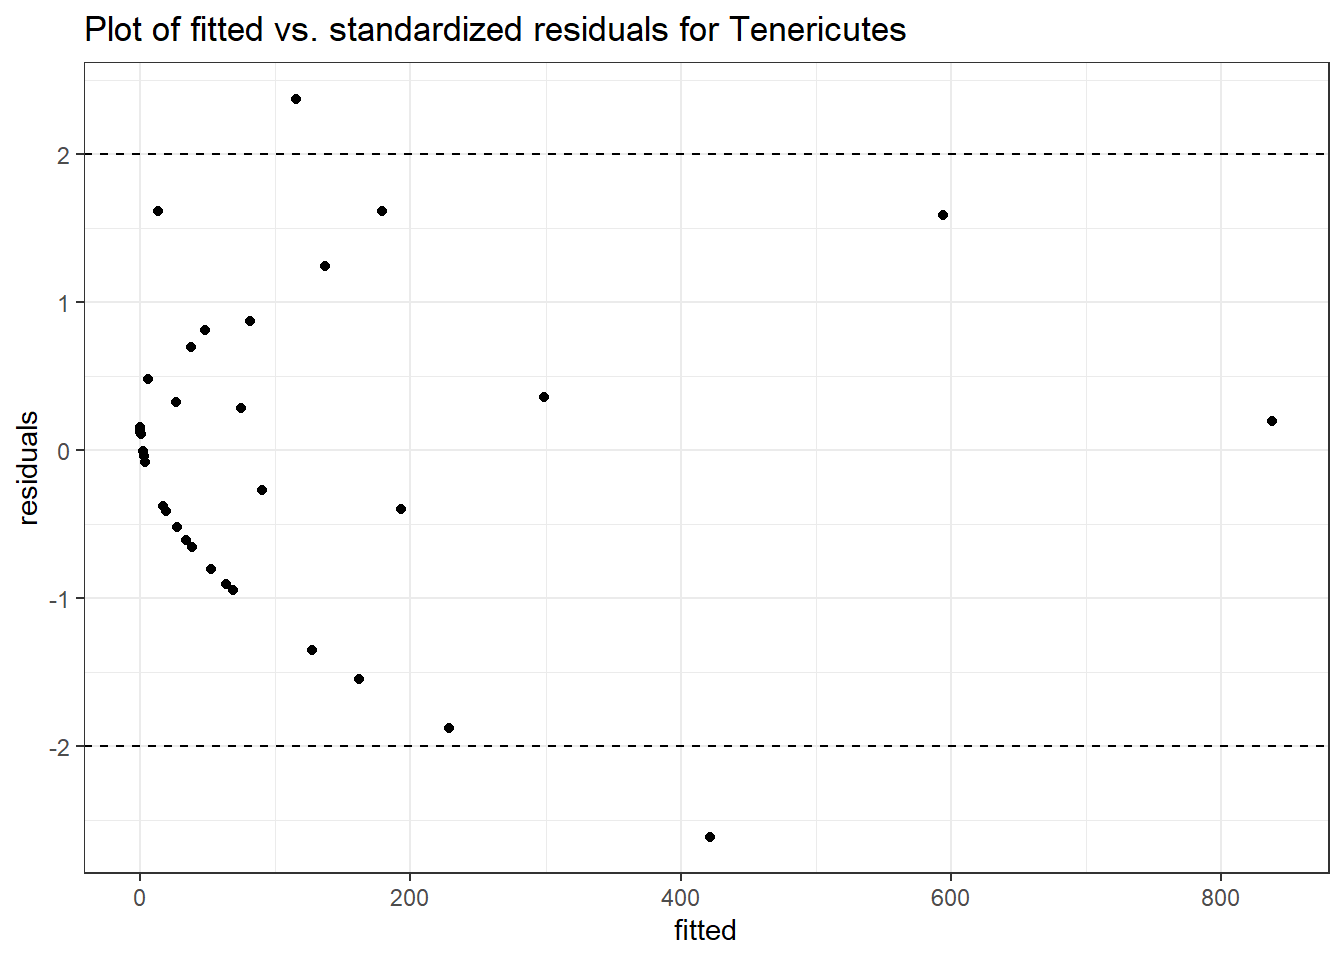
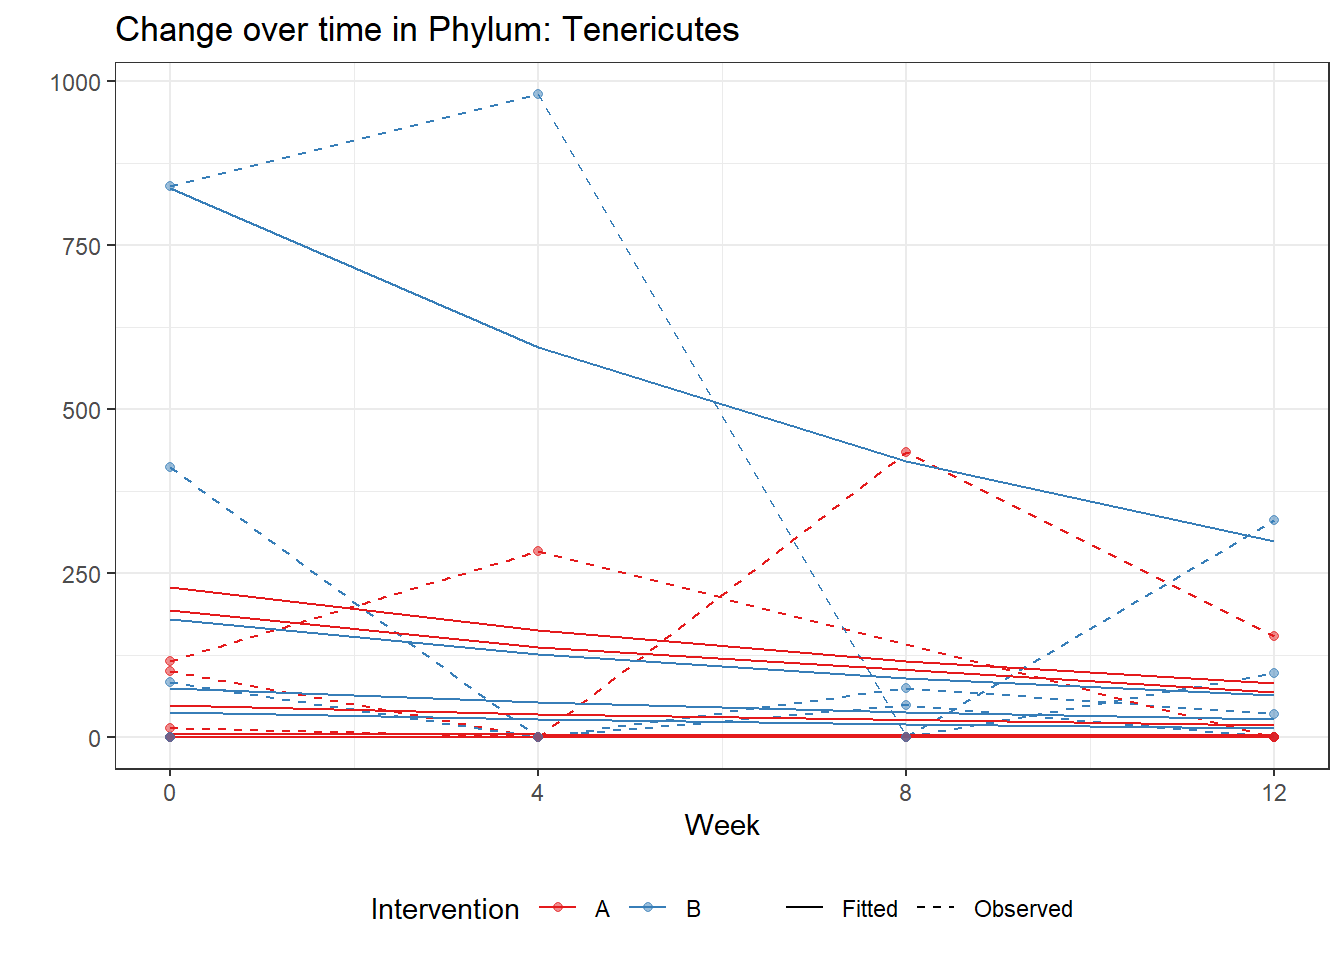
Fixed Effects (change in log)

                Outcome Estimate Std. Error   z value Pr(>|z|)
(Intercept) Tenericutes  2.64267    1.04333   2.53291  0.01131
time        Tenericutes -0.34365    0.01482 -23.18291  0.00000


Random Effects (SD on log scale)

 Groups    Name        Std.Dev.
 SubjectID (Intercept) 3.3475

Significance test not available

#########################################
#########################################
Model:  Verrucomicrobia ~ 1 + time + (1 | SubjectID)
<environment: 0x00000000405d6288>

Link:    poisson


Intraclass Correlation (ICC):   0.8761372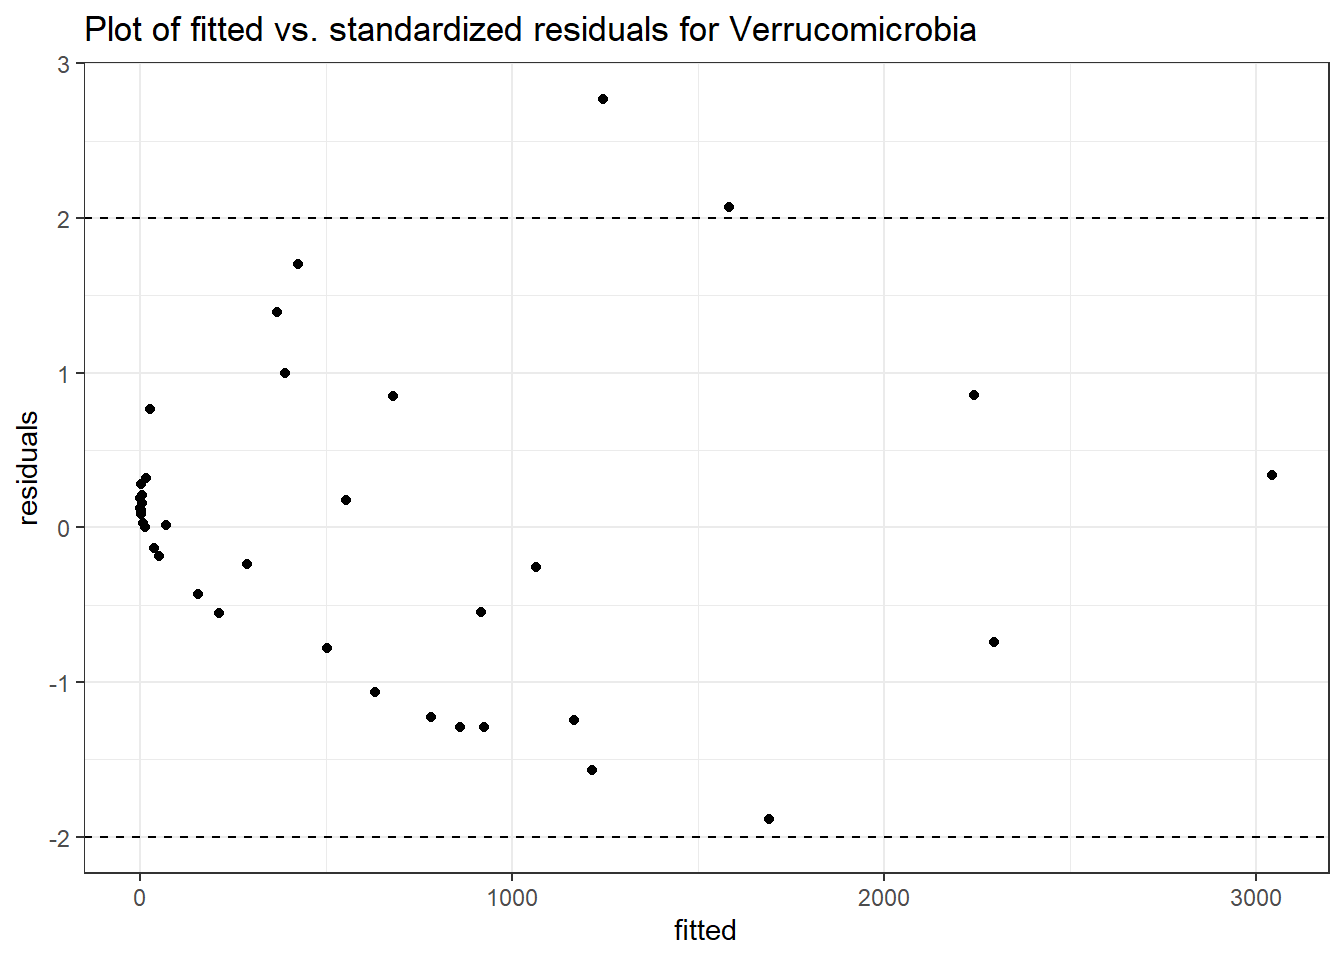
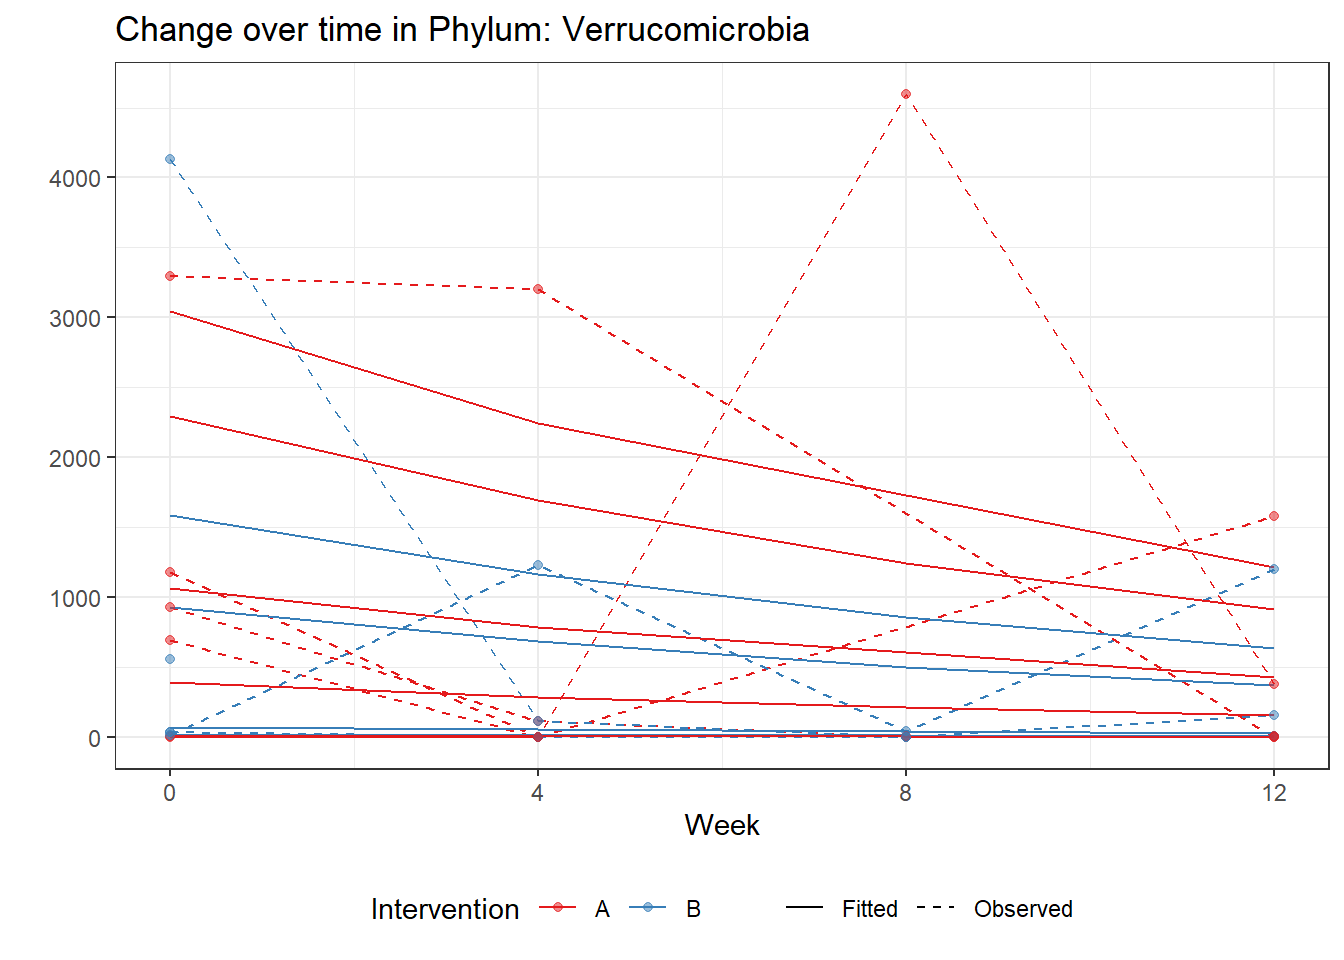
Fixed Effects (change in log)

                    Outcome Estimate Std. Error   z value Pr(>|z|)
(Intercept) Verrucomicrobia  5.22355    0.80562   6.48390        0
time        Verrucomicrobia -0.30578    0.00609 -50.22346        0


Random Effects (SD on log scale)

 Groups    Name        Std.Dev.
 SubjectID (Intercept) 2.6596

Significance test not available
So, we found that time does significantly influence at least some of the bacteria over time. This is contrary to the results when we used the normal theory model.
Covariates: Time + Gender
\[\begin{align*} h\left(Y_{ij}\right)&=\beta_{0j} + \beta_{1j}*(Week)_{ij} + r_{ij}\\ \beta_{0j}&= \gamma_{00} + \gamma_{01}(Gender)_{j} + u_{0j}\\ \beta_{1j}&= \gamma_{10}\\ \end{align*}\]
Gender is coded as female (effect of being female compared to males).
phylum.fit2 <- glmm_microbiome(mydata=microbiome_data,model.number=2,
                               taxa.level="Phylum", link="poisson",
                               model="1 + time + female + (1|SubjectID)")
#########################################
#########################################
Model:  Actinobacteria ~ 1 + time + female + (1 | SubjectID)
<environment: 0x000000002f679a68>

Link:    poisson


Intraclass Correlation (ICC):   0.4883953

Fixed Effects (change in log)

                   Outcome Estimate Std. Error   z value Pr(>|z|)
(Intercept) Actinobacteria  3.24428    0.49851   6.50796  0.00000
time        Actinobacteria -0.26066    0.02240 -11.63501  0.00000
female      Actinobacteria  1.02306    0.62074   1.64812  0.09933


Random Effects (SD on log scale)

 Groups    Name        Std.Dev.
 SubjectID (Intercept) 0.97705

Significance test not available

#########################################
#########################################
Model:  Bacteroidetes ~ 1 + time + female + (1 | SubjectID)
<environment: 0x000000002f679a68>

Link:    poisson


Intraclass Correlation (ICC):   0.07091696

Fixed Effects (change in log)

                  Outcome Estimate Std. Error   z value Pr(>|z|)
(Intercept) Bacteroidetes  9.02407    0.13819  65.29994  0.00000
time        Bacteroidetes -0.02541    0.00189 -13.45618  0.00000
female      Bacteroidetes -0.38442    0.17322  -2.21917  0.02647


Random Effects (SD on log scale)

 Groups    Name        Std.Dev.
 SubjectID (Intercept) 0.27628

Significance test not available

#########################################
#########################################
Model:  Cyanobacteria ~ 1 + time + female + (1 | SubjectID)
<environment: 0x000000002f679a68>

Link:    poisson


Intraclass Correlation (ICC):   0.8578945

Fixed Effects (change in log)

                  Outcome Estimate Std. Error   z value Pr(>|z|)
(Intercept) Cyanobacteria  2.55302    1.25648   2.03188  0.04217
time        Cyanobacteria -0.60192    0.02518 -23.90230  0.00000
female      Cyanobacteria  0.00203    1.57224   0.00129  0.99897


Random Effects (SD on log scale)

 Groups    Name        Std.Dev.
 SubjectID (Intercept) 2.457

Significance test not available

#########################################
#########################################
Model:  Euryarchaeota ~ 1 + time + female + (1 | SubjectID)
<environment: 0x000000002f679a68>

Link:    poisson


Intraclass Correlation (ICC):   0.7363739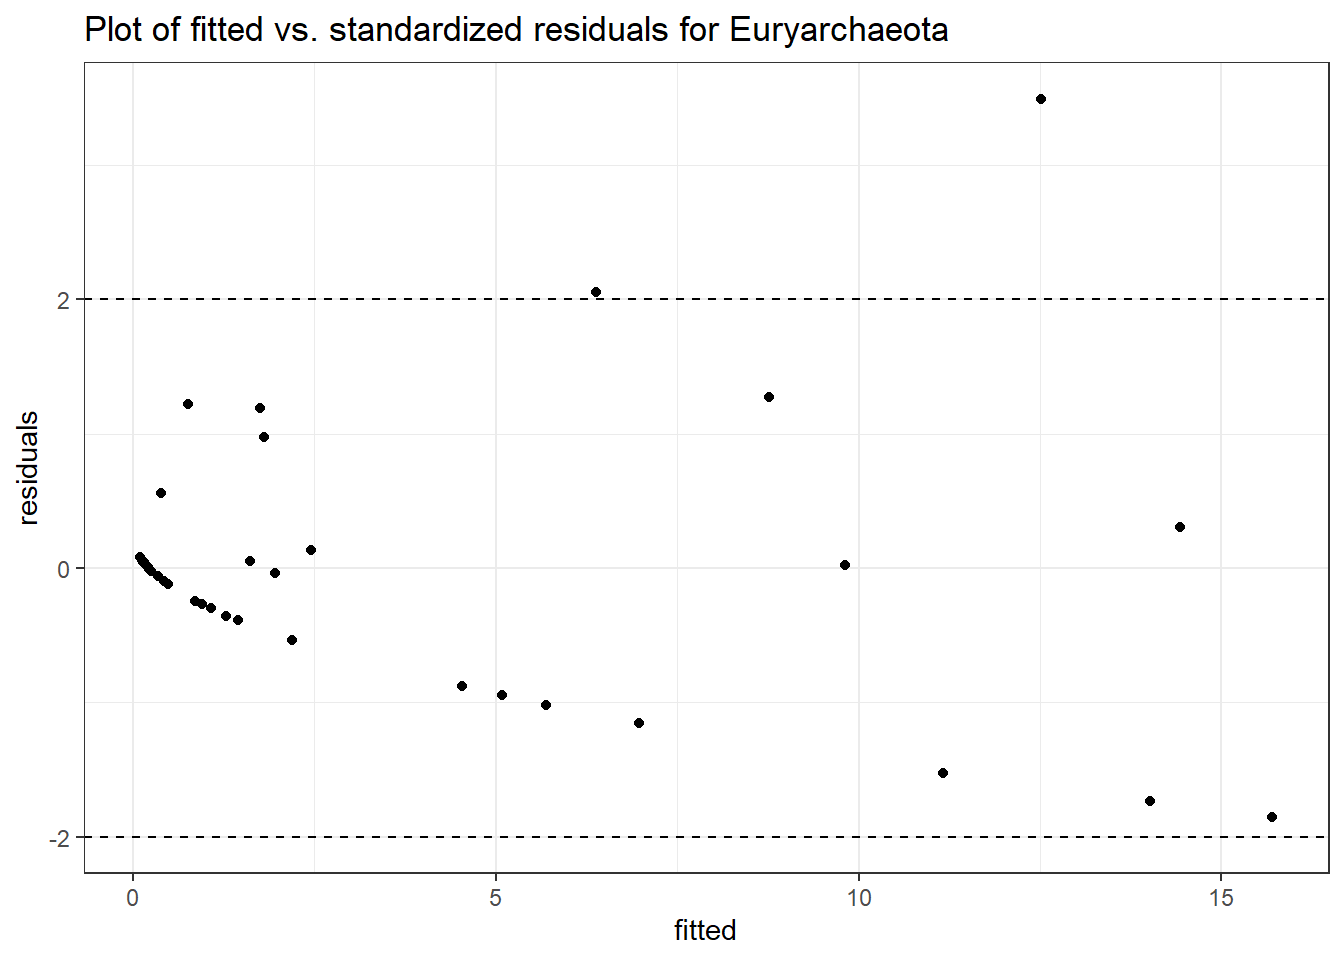
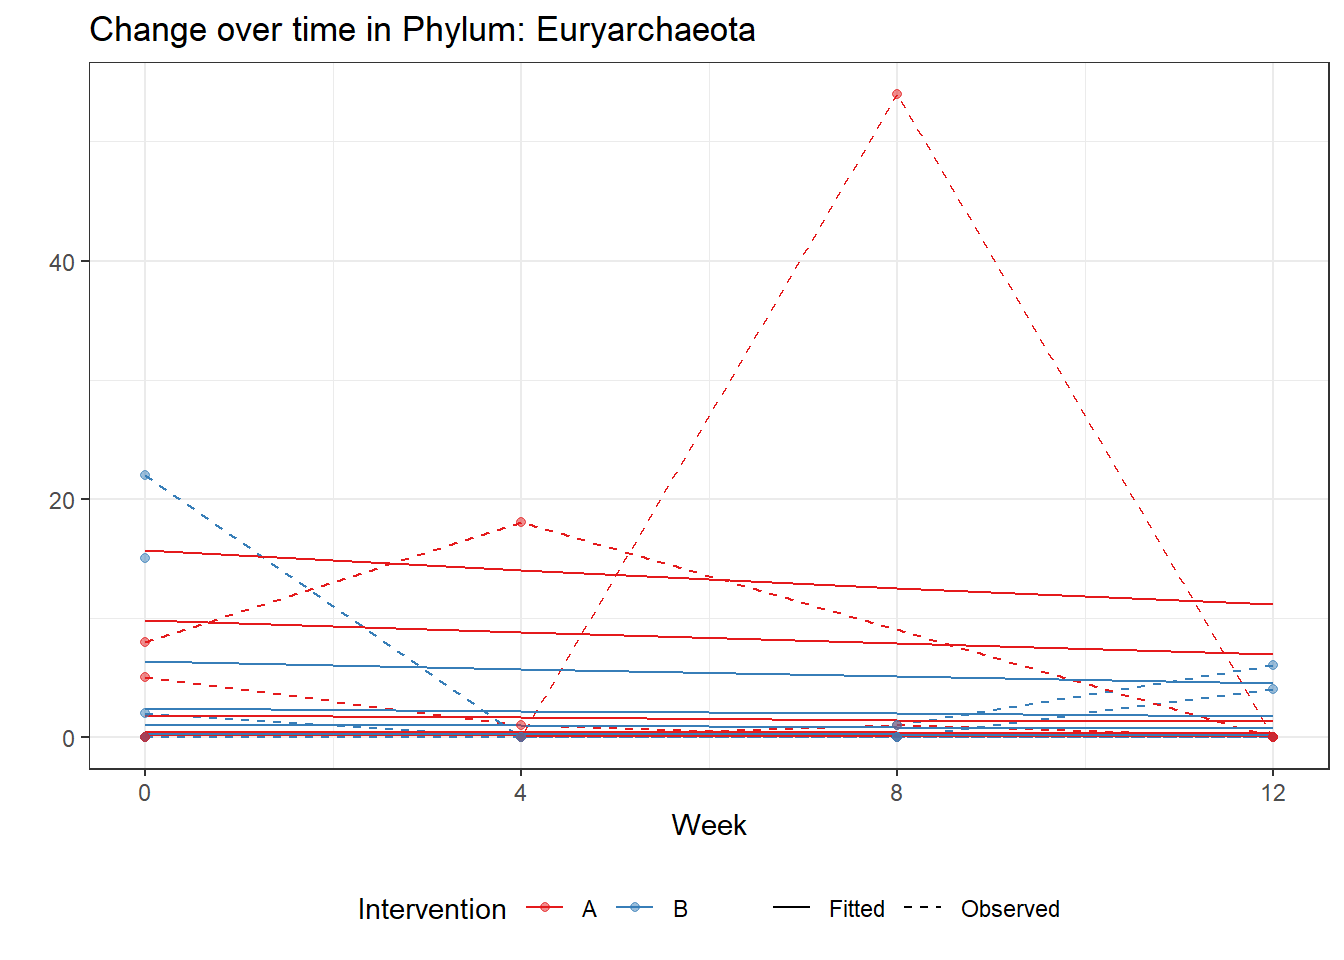
Fixed Effects (change in log)

                  Outcome Estimate Std. Error  z value Pr(>|z|)
(Intercept) Euryarchaeota -0.90825    1.05155 -0.86373  0.38774
time        Euryarchaeota -0.11360    0.07975 -1.42442  0.15432
female      Euryarchaeota  1.96695    1.20950  1.62625  0.10390


Random Effects (SD on log scale)

 Groups    Name        Std.Dev.
 SubjectID (Intercept) 1.6713

Significance test not available

#########################################
#########################################
Model:  Firmicutes ~ 1 + time + female + (1 | SubjectID)
<environment: 0x000000002f679a68>

Link:    poisson


Intraclass Correlation (ICC):   0.05726281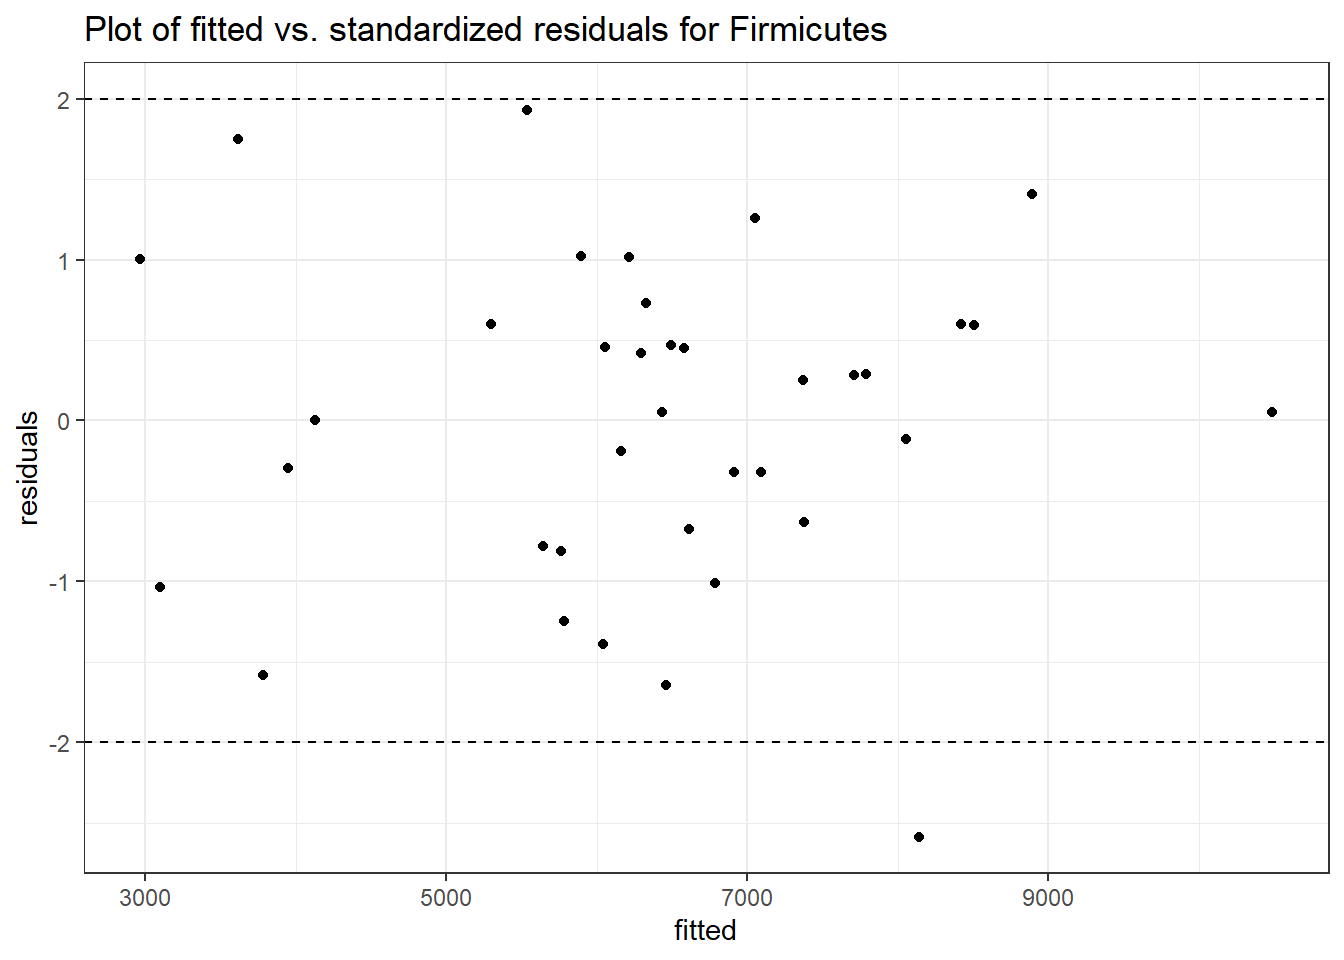
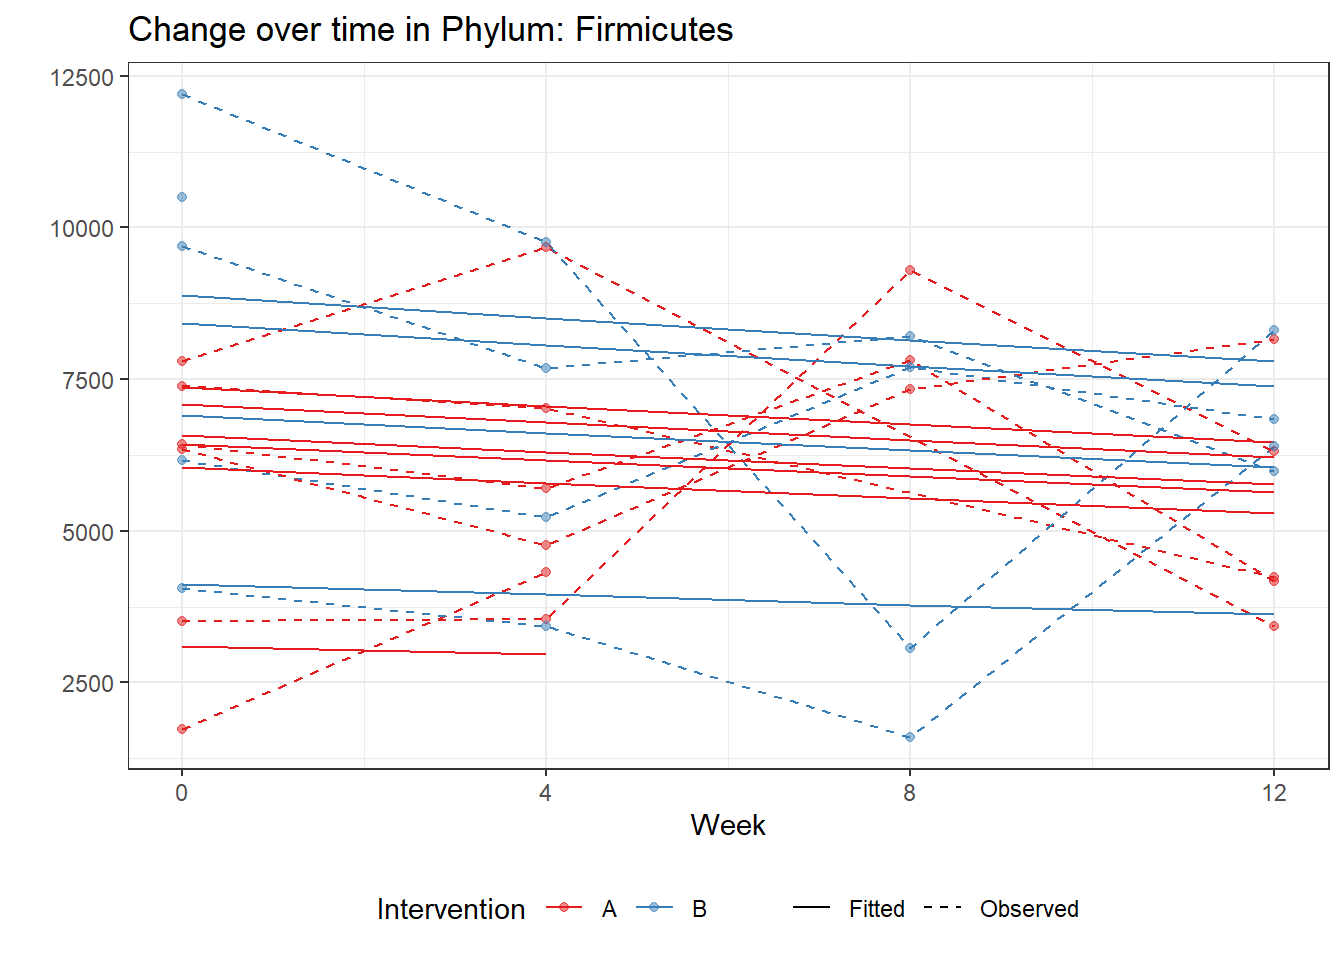
Fixed Effects (change in log)

               Outcome Estimate Std. Error   z value Pr(>|z|)
(Intercept) Firmicutes  8.49933    0.12333  68.91608  0.00000
time        Firmicutes -0.04391    0.00187 -23.47765  0.00000
female      Firmicutes  0.44885    0.15456   2.90402  0.00368


Random Effects (SD on log scale)

 Groups    Name        Std.Dev.
 SubjectID (Intercept) 0.24646

Significance test not available

#########################################
#########################################
Model:  Fusobacteria ~ 1 + time + female + (1 | SubjectID)
<environment: 0x000000002f679a68>

Link:    poisson


Intraclass Correlation (ICC):   0.8398348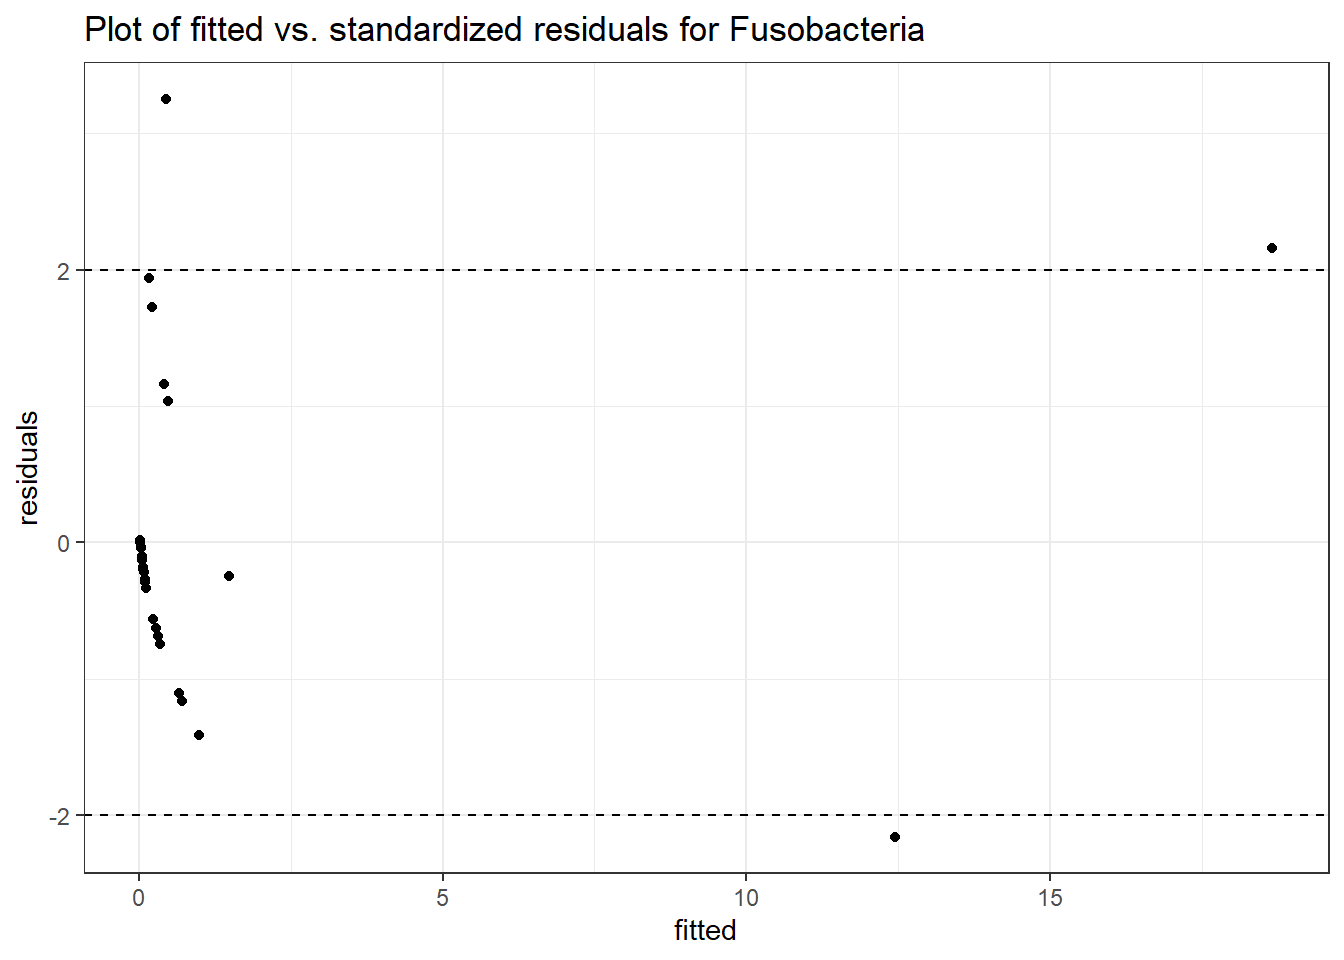
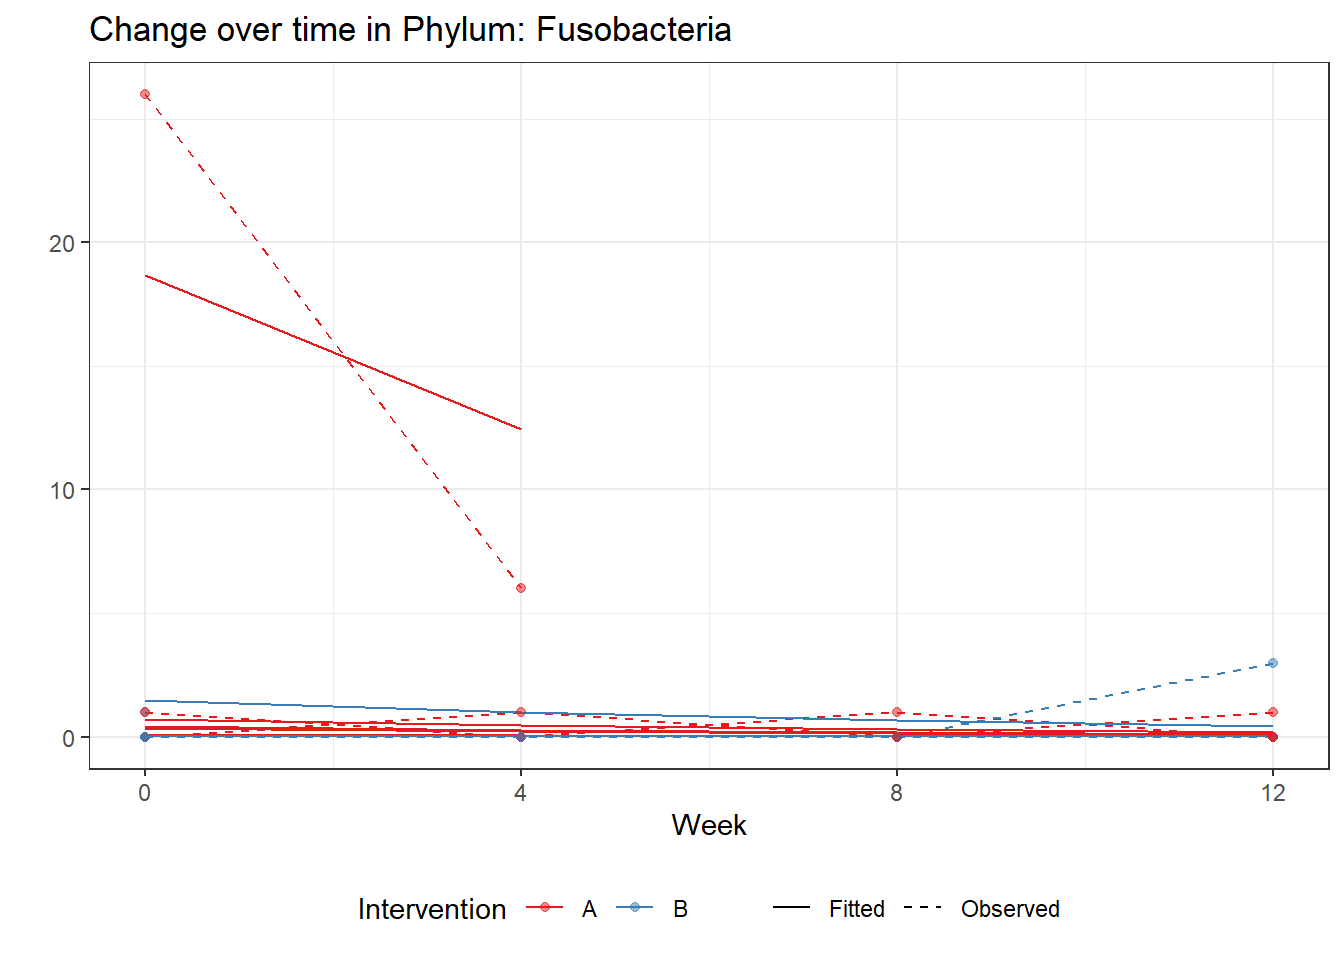
Fixed Effects (change in log)

                 Outcome Estimate Std. Error  z value Pr(>|z|)
(Intercept) Fusobacteria -1.70091    1.82355 -0.93274  0.35095
time        Fusobacteria -0.40465    0.24247 -1.66883  0.09515
female      Fusobacteria -0.08897    1.87964 -0.04733  0.96225


Random Effects (SD on log scale)

 Groups    Name        Std.Dev.
 SubjectID (Intercept) 2.2899

Significance test not available

#########################################
#########################################
Model:  Lentisphaerae ~ 1 + time + female + (1 | SubjectID)
<environment: 0x000000002f679a68>

Link:    poisson


Intraclass Correlation (ICC):   0.697862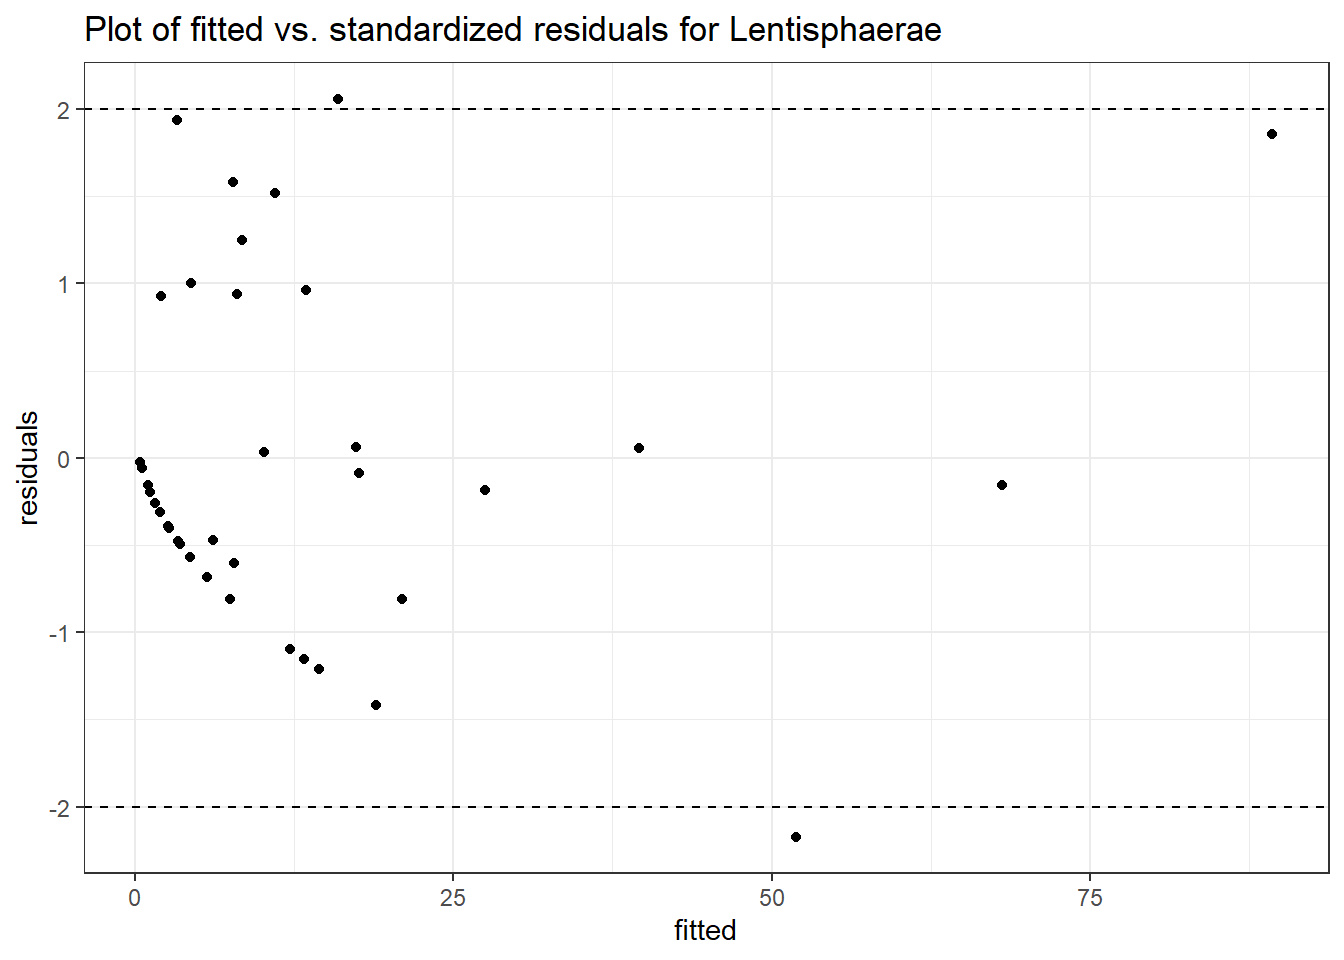
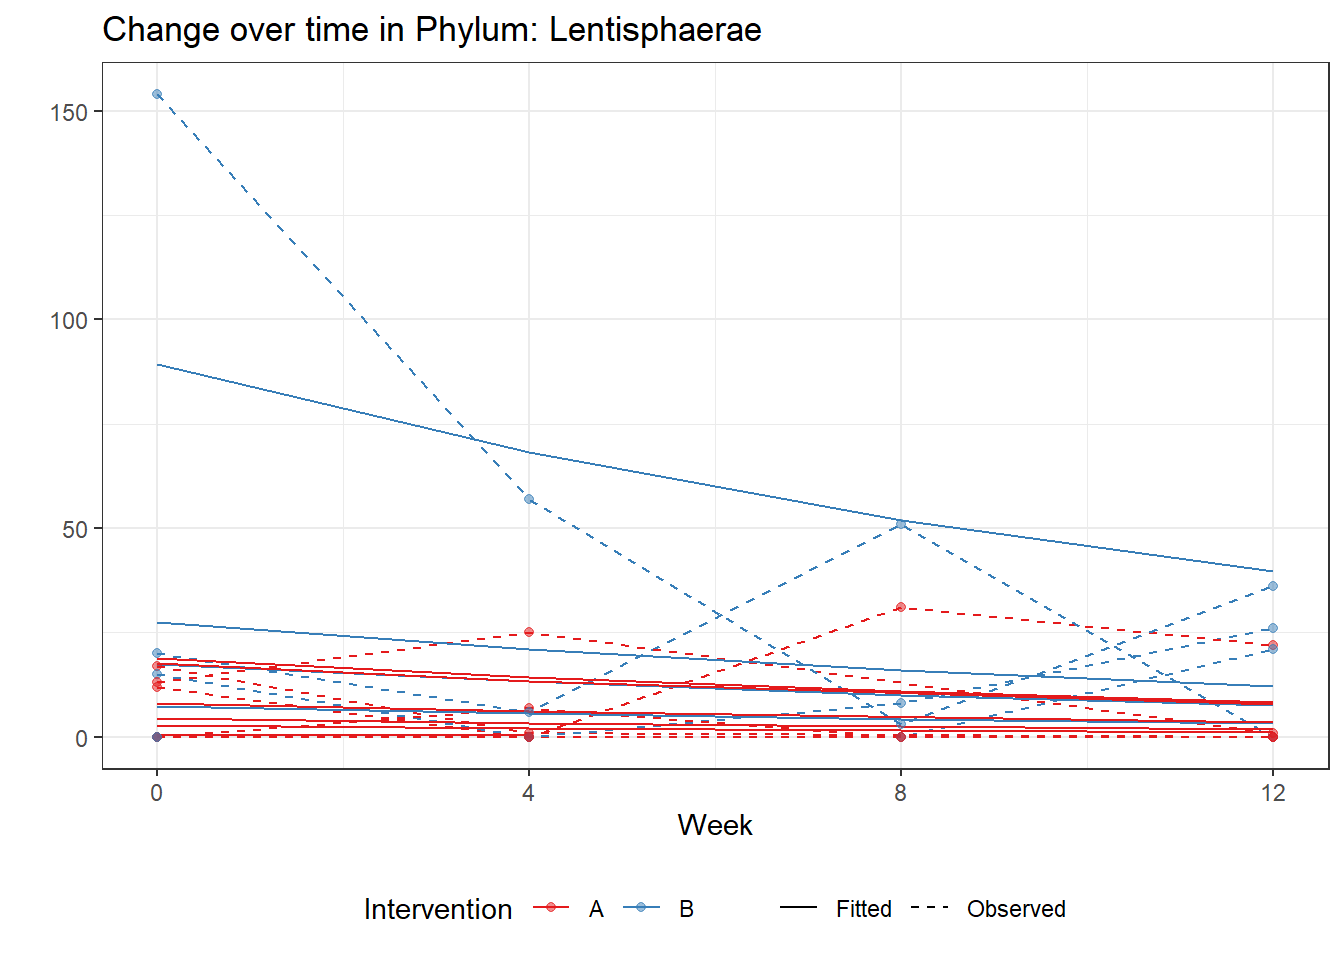
Fixed Effects (change in log)

                  Outcome Estimate Std. Error  z value Pr(>|z|)
(Intercept) Lentisphaerae  1.50001    0.80365  1.86649  0.06197
time        Lentisphaerae -0.27101    0.03998 -6.77909  0.00000
female      Lentisphaerae  0.74300    0.99183  0.74912  0.45378


Random Effects (SD on log scale)

 Groups    Name        Std.Dev.
 SubjectID (Intercept) 1.5198

Significance test not available

#########################################
#########################################
Model:  Proteobacteria ~ 1 + time + female + (1 | SubjectID)
<environment: 0x000000002f679a68>

Link:    poisson


Intraclass Correlation (ICC):   0.09278889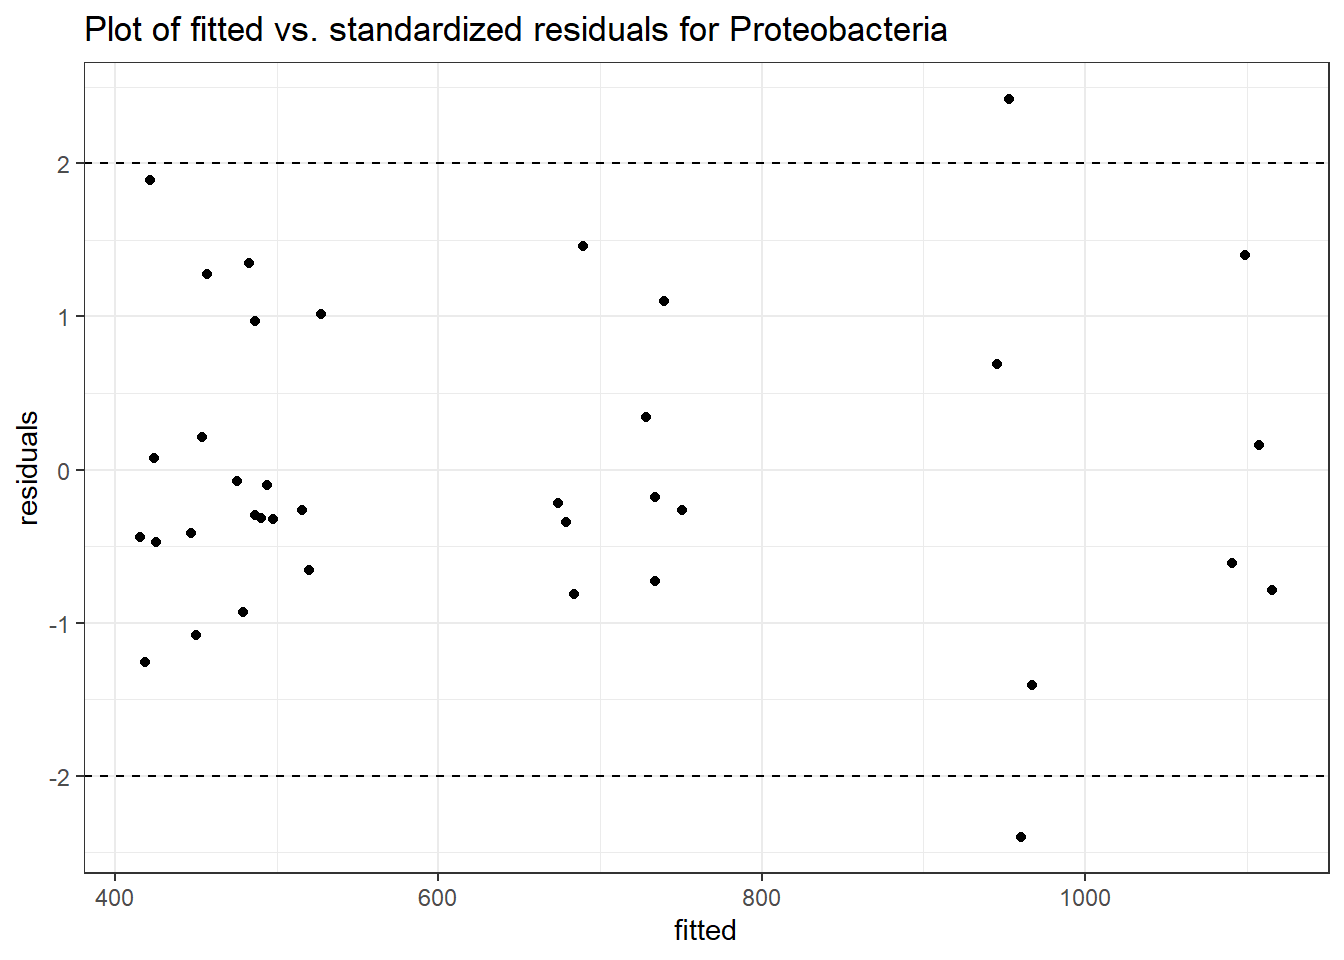
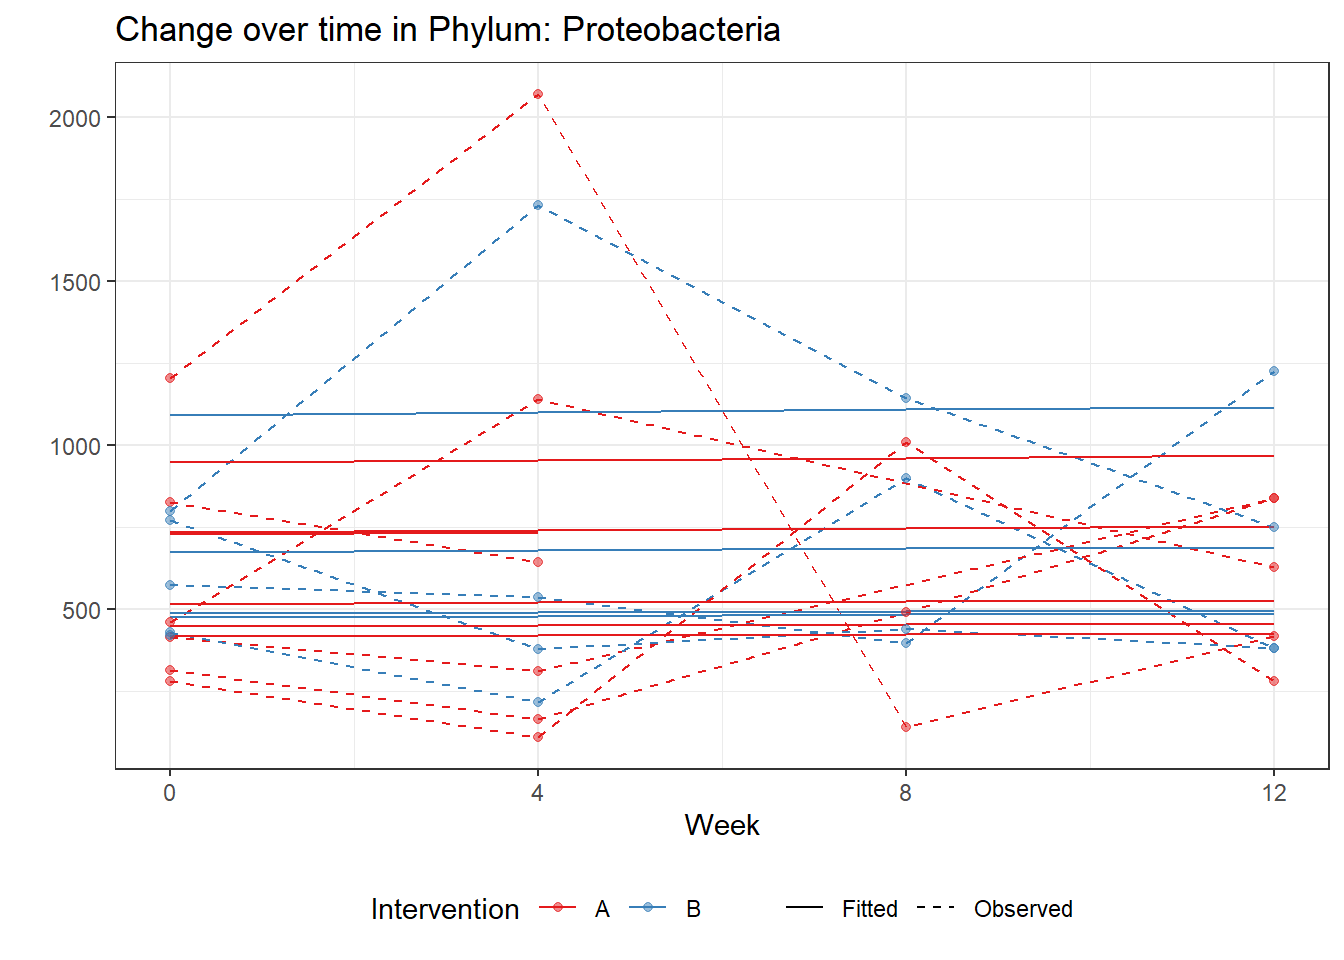
Fixed Effects (change in log)

                   Outcome Estimate Std. Error  z value Pr(>|z|)
(Intercept) Proteobacteria  6.37843    0.16050 39.74222  0.00000
time        Proteobacteria  0.00754    0.00585  1.29010  0.19702
female      Proteobacteria  0.02341    0.20105  0.11642  0.90732


Random Effects (SD on log scale)

 Groups    Name        Std.Dev.
 SubjectID (Intercept) 0.31981

Significance test not available

#########################################
#########################################
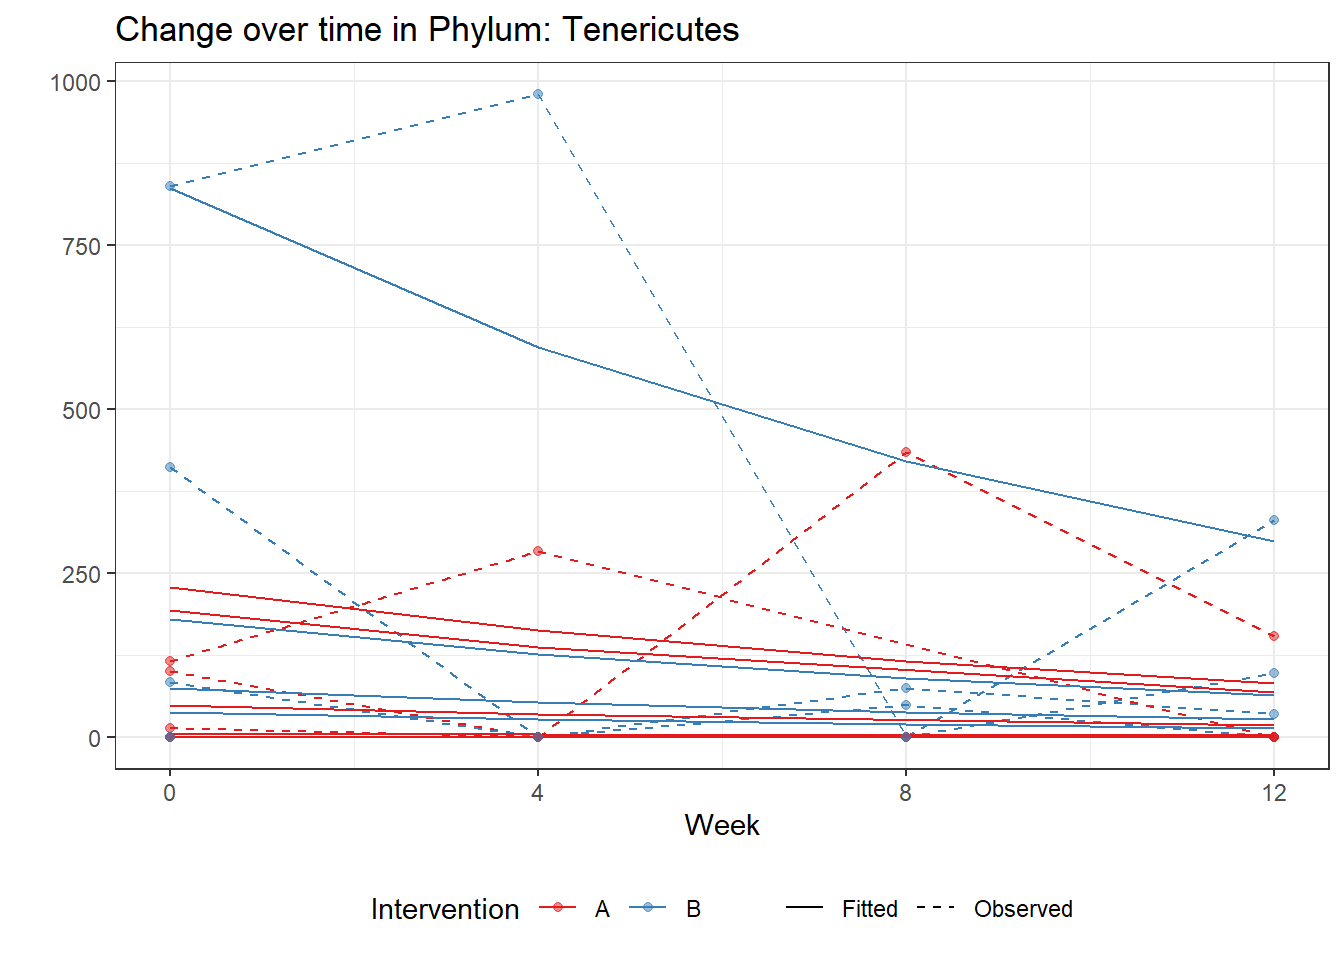
Model:  Tenericutes ~ 1 + time + female + (1 | SubjectID)
<environment: 0x000000002f679a68>

Link:    poisson


Intraclass Correlation (ICC):   0.9173448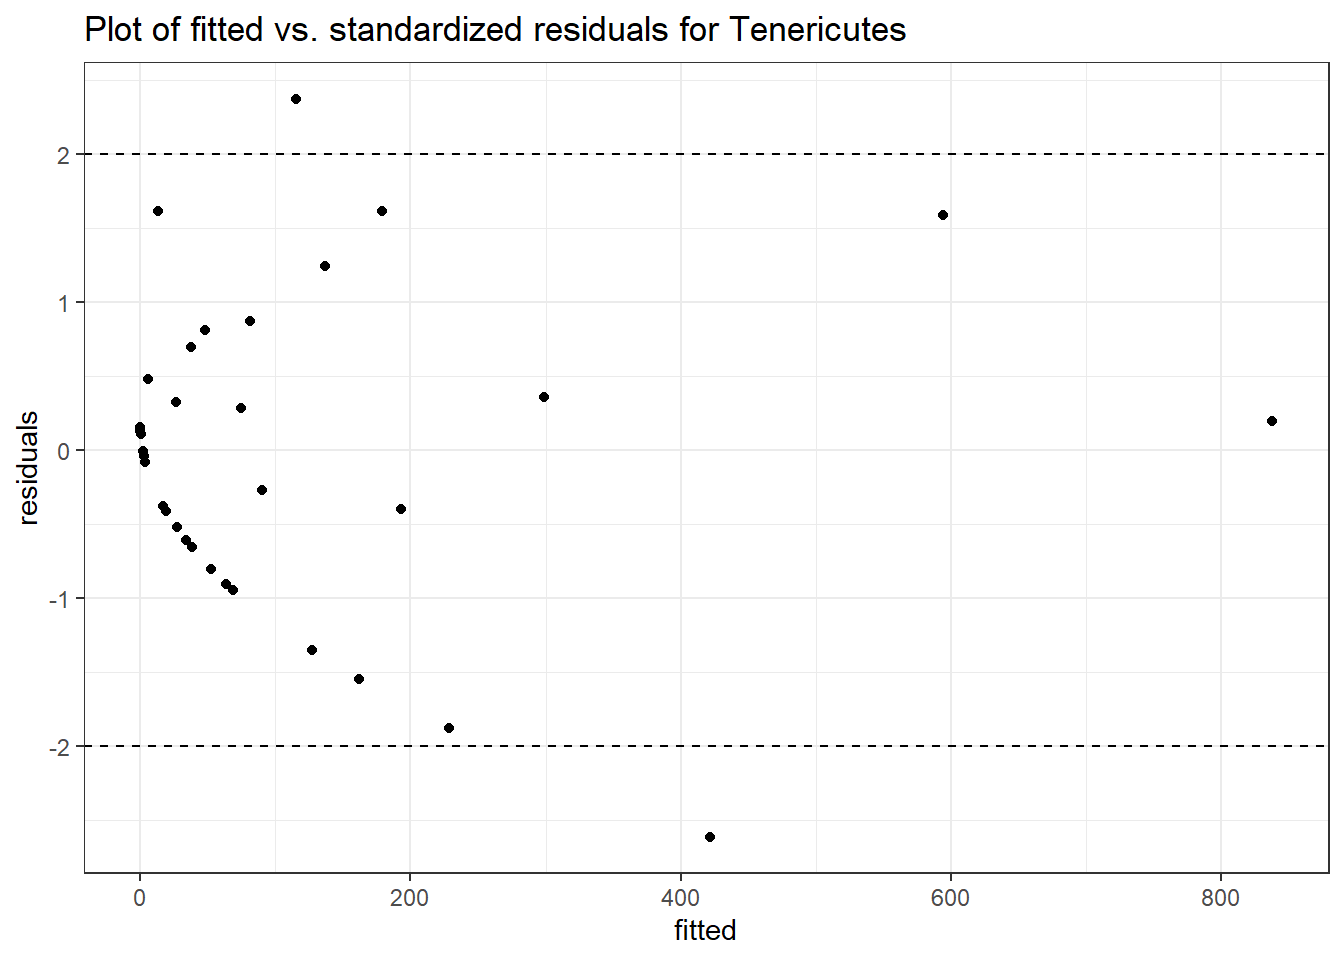
Fixed Effects (change in log)

                Outcome Estimate Std. Error   z value Pr(>|z|)
(Intercept) Tenericutes  2.34245    1.70805   1.37141  0.17025
time        Tenericutes -0.34365    0.01482 -23.18289  0.00000
female      Tenericutes  0.48030    2.13654   0.22480  0.82213


Random Effects (SD on log scale)

 Groups    Name        Std.Dev.
 SubjectID (Intercept) 3.3314

Significance test not available

#########################################
#########################################
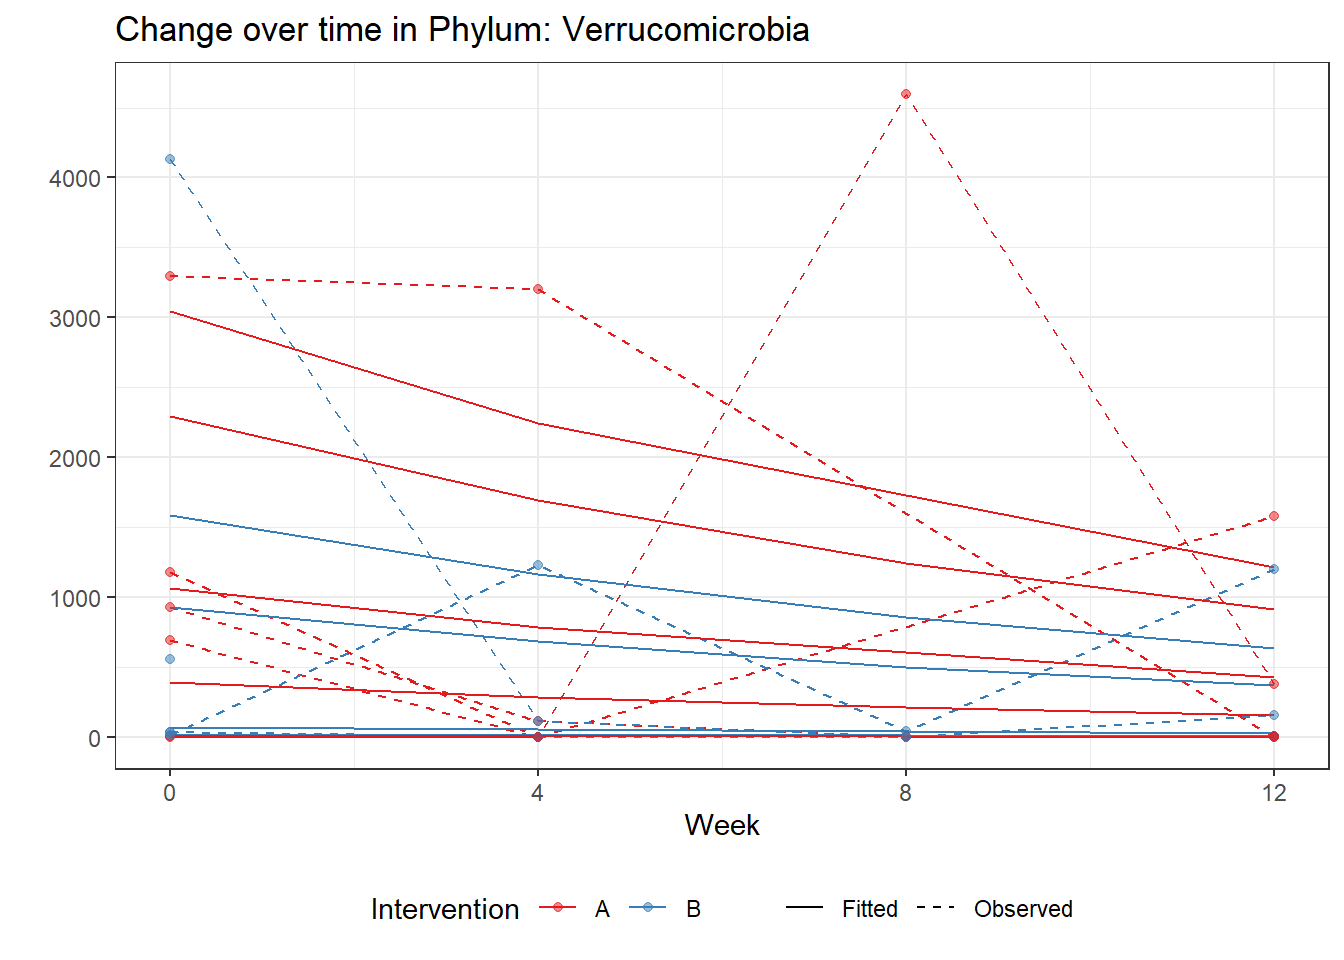
Model:  Verrucomicrobia ~ 1 + time + female + (1 | SubjectID)
<environment: 0x000000002f679a68>

Link:    poisson


Intraclass Correlation (ICC):   0.8645285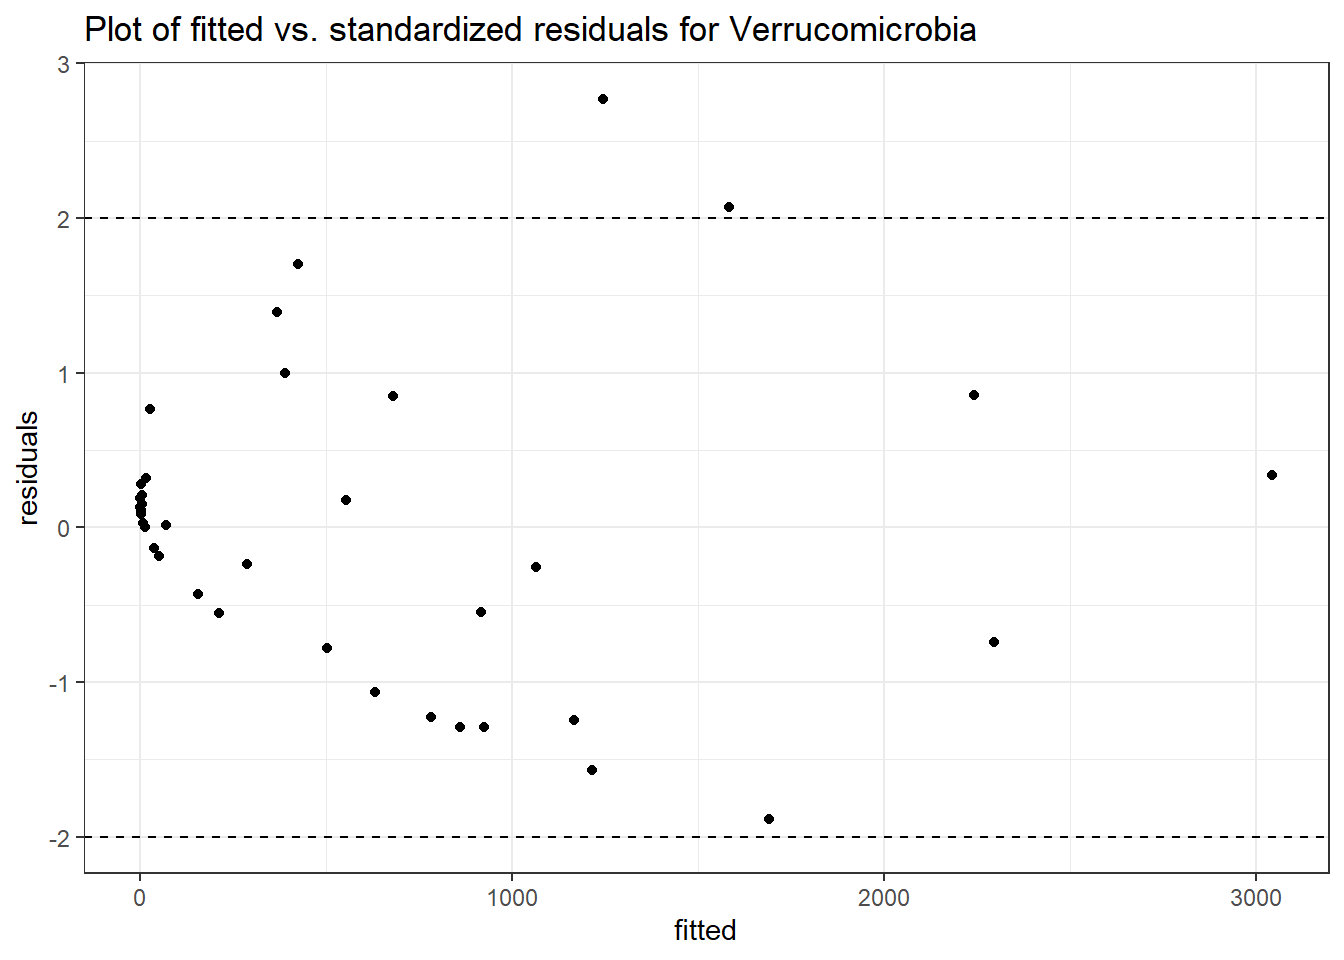
Fixed Effects (change in log)

                    Outcome Estimate Std. Error   z value Pr(>|z|)
(Intercept) Verrucomicrobia  4.07726    1.27761   3.19130  0.00142
time        Verrucomicrobia -0.30578    0.00609 -50.22344  0.00000
female      Verrucomicrobia  1.79441    1.59433   1.12550  0.26038


Random Effects (SD on log scale)

 Groups    Name        Std.Dev.
 SubjectID (Intercept) 2.5262

Significance test not available
Controlling for the effect of time, Gender was only signficant for Bacteroidetes and Firmicutes. We will take out gender out of model to test other effects, but will come back when testing intervention.
Covariates: Time + Ethnicity
\[\begin{align*} h\left(Y_{ij}\right)&=\beta_{0j} + \beta_{1j}*(Week)_{ij}+ r_{ij}\\ \beta_{0j}&= \gamma_{00} + \gamma_{01}(Ethnicity)_{j} + u_{0j}\\ \beta_{1j}&= \gamma_{10}\\ \end{align*}\]
Ethnicity is coded as Hispanic (effect of being Hispanic compared to White, Asian or Native American). Groups were coded this way due to sample size.
phylum.fit3 <- glmm_microbiome(mydata=microbiome_data,model.number=3,
                               taxa.level="Phylum", link="poisson",
                               model="1 + time + hispanic + (1|SubjectID)")
#########################################
#########################################
Model:  Actinobacteria ~ 1 + time + hispanic + (1 | SubjectID)
<environment: 0x00000000065308b0>

Link:    poisson


Intraclass Correlation (ICC):   0.5267952

Fixed Effects (change in log)

                   Outcome Estimate Std. Error   z value Pr(>|z|)
(Intercept) Actinobacteria  3.52412    0.53525   6.58404  0.00000
time        Actinobacteria -0.26035    0.02241 -11.61946  0.00000
hispanic    Actinobacteria  0.58475    0.66803   0.87534  0.38139


Random Effects (SD on log scale)

 Groups    Name        Std.Dev.
 SubjectID (Intercept) 1.0551

Significance test not available

#########################################
#########################################
Model:  Bacteroidetes ~ 1 + time + hispanic + (1 | SubjectID)
<environment: 0x00000000065308b0>

Link:    poisson


Intraclass Correlation (ICC):   0.07964047

Fixed Effects (change in log)

                  Outcome Estimate Std. Error   z value Pr(>|z|)
(Intercept) Bacteroidetes  8.98436    0.14713  61.06205  0.00000
time        Bacteroidetes -0.02542    0.00189 -13.46185  0.00000
hispanic    Bacteroidetes -0.32200    0.18443  -1.74594  0.08082


Random Effects (SD on log scale)

 Groups    Name        Std.Dev.
 SubjectID (Intercept) 0.29416

Significance test not available

#########################################
#########################################
Model:  Cyanobacteria ~ 1 + time + hispanic + (1 | SubjectID)
<environment: 0x00000000065308b0>

Link:    poisson


Intraclass Correlation (ICC):   0.8325719

Fixed Effects (change in log)

                  Outcome Estimate Std. Error   z value Pr(>|z|)
(Intercept) Cyanobacteria  3.90294    1.12565   3.46729  0.00053
time        Cyanobacteria -0.60194    0.02518 -23.90315  0.00000
hispanic    Cyanobacteria -2.10908    1.42385  -1.48125  0.13854


Random Effects (SD on log scale)

 Groups    Name        Std.Dev.
 SubjectID (Intercept) 2.23

Significance test not available

#########################################
#########################################
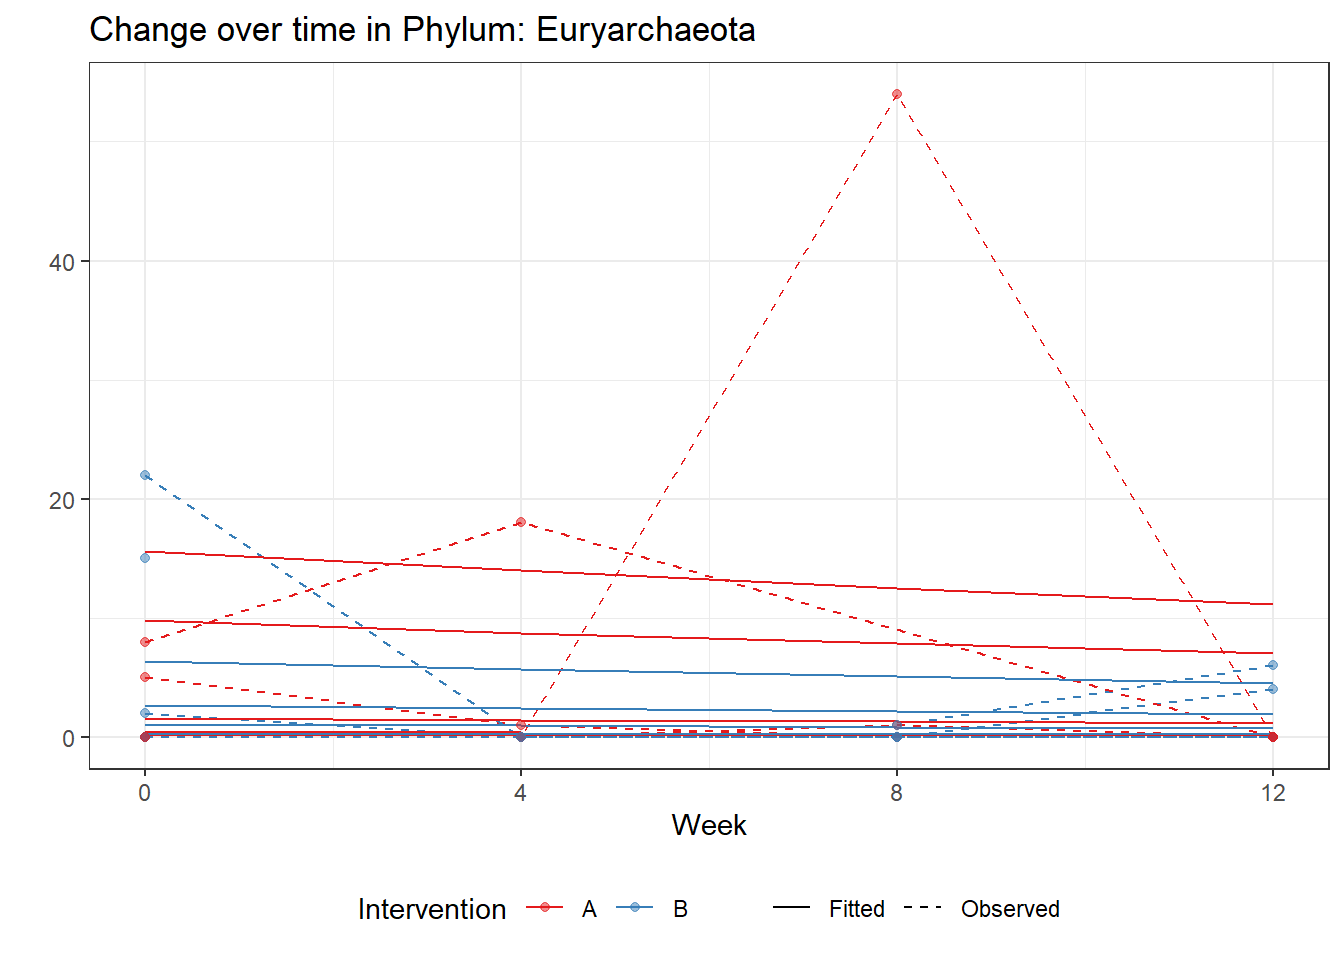
Model:  Euryarchaeota ~ 1 + time + hispanic + (1 | SubjectID)
<environment: 0x00000000065308b0>

Link:    poisson


Intraclass Correlation (ICC):   0.7021741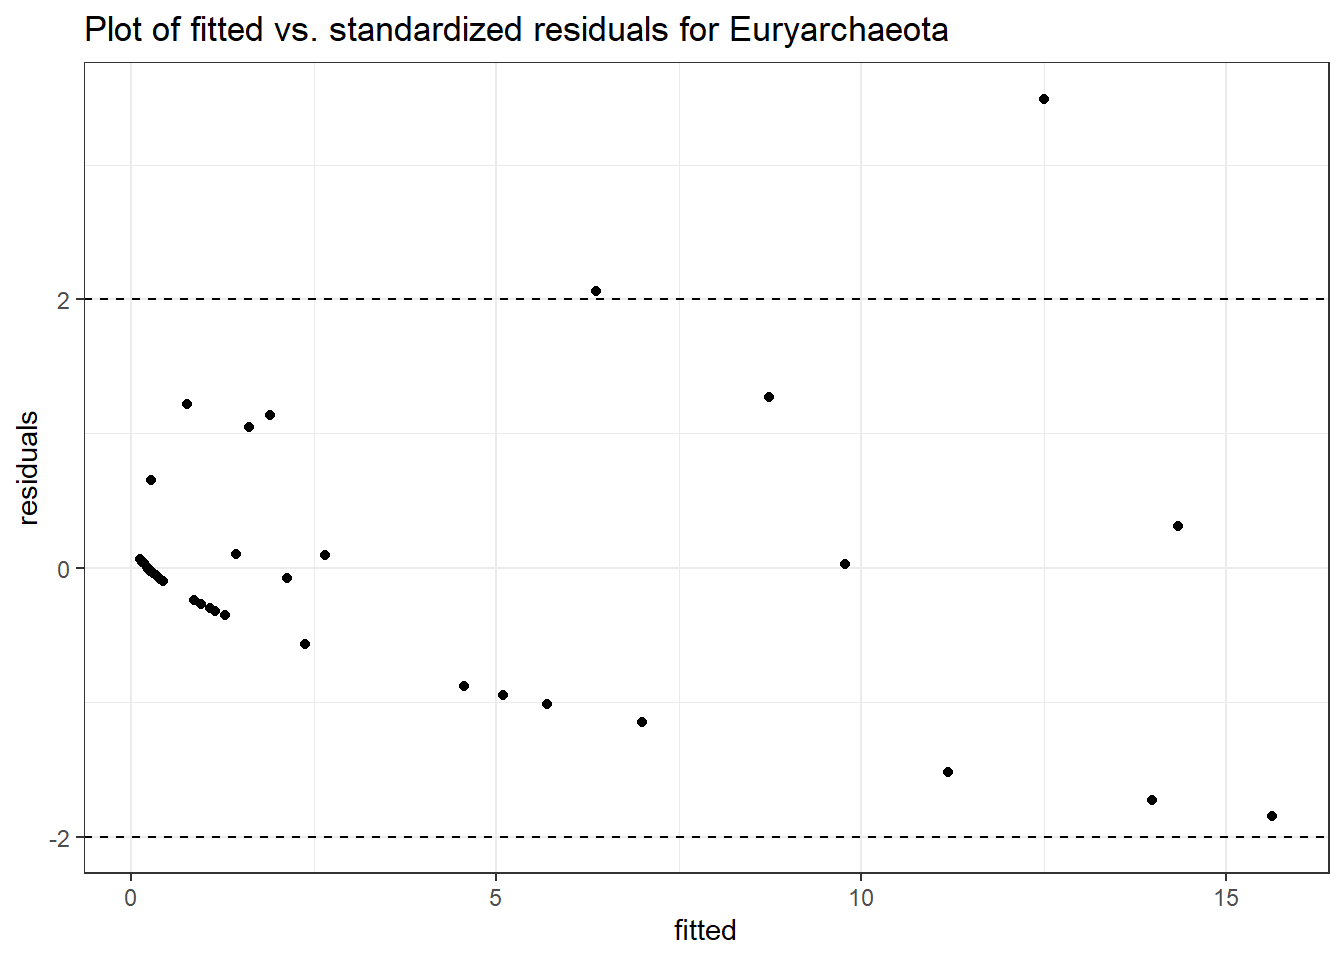
Fixed Effects (change in log)

                  Outcome Estimate Std. Error  z value Pr(>|z|)
(Intercept) Euryarchaeota -0.75656    0.88533 -0.85455  0.39280
time        Euryarchaeota -0.11145    0.07869 -1.41636  0.15667
hispanic    Euryarchaeota  1.87423    1.06086  1.76671  0.07728


Random Effects (SD on log scale)

 Groups    Name        Std.Dev.
 SubjectID (Intercept) 1.5355

Significance test not available

#########################################
#########################################
Model:  Firmicutes ~ 1 + time + hispanic + (1 | SubjectID)
<environment: 0x00000000065308b0>

Link:    poisson


Intraclass Correlation (ICC):   0.09257982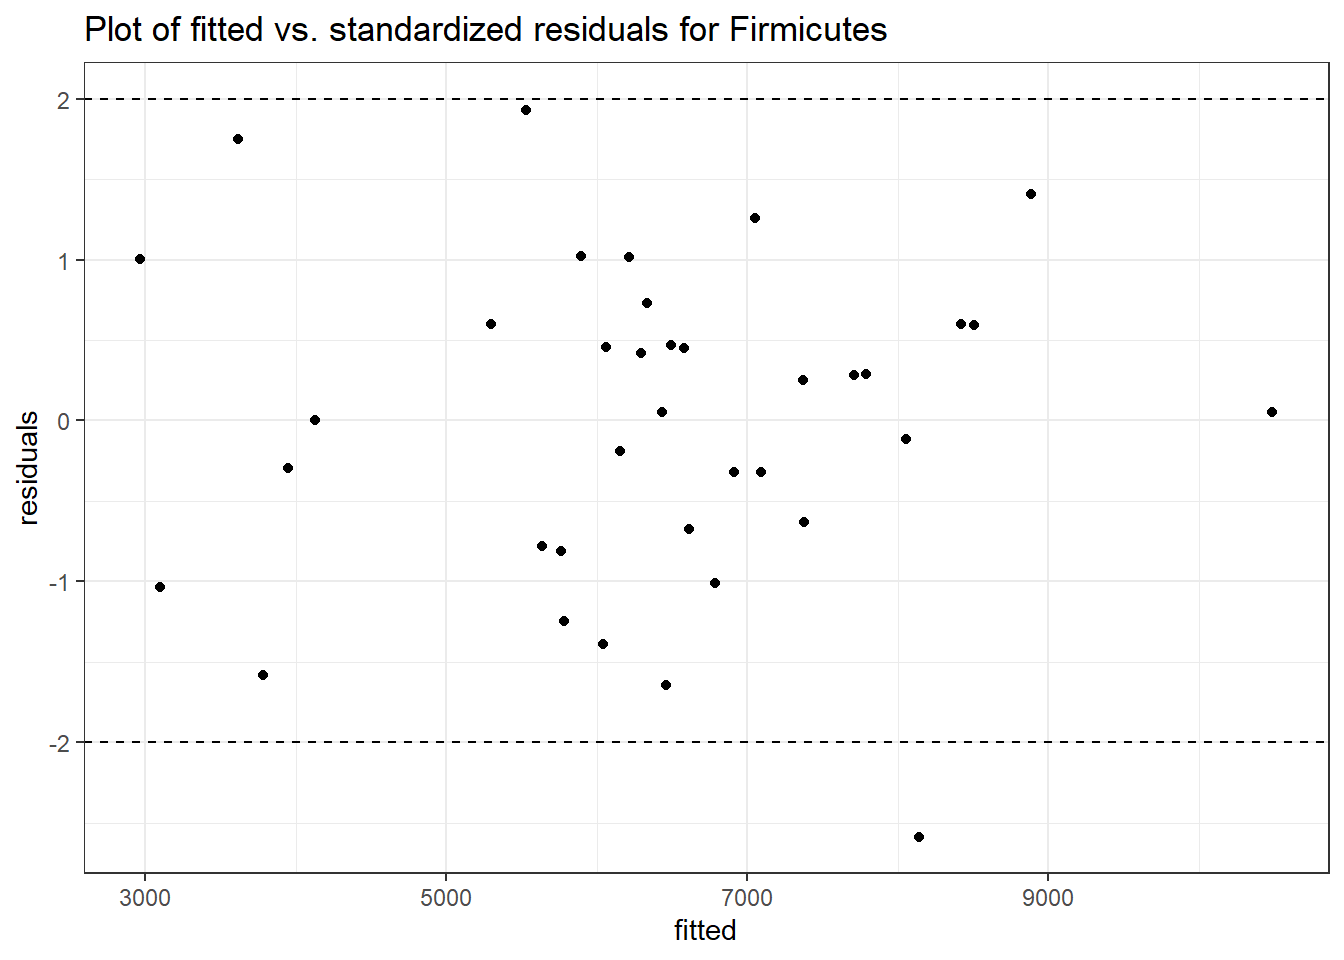
Fixed Effects (change in log)

               Outcome Estimate Std. Error   z value Pr(>|z|)
(Intercept) Firmicutes  8.68835    0.15977  54.38205  0.00000
time        Firmicutes -0.04390    0.00187 -23.47284  0.00000
hispanic    Firmicutes  0.15182    0.20026   0.75814  0.44837


Random Effects (SD on log scale)

 Groups    Name        Std.Dev.
 SubjectID (Intercept) 0.31941

Significance test not available

#########################################
#########################################
Model:  Fusobacteria ~ 1 + time + hispanic + (1 | SubjectID)
<environment: 0x00000000065308b0>

Link:    poisson


Intraclass Correlation (ICC):   0.8273398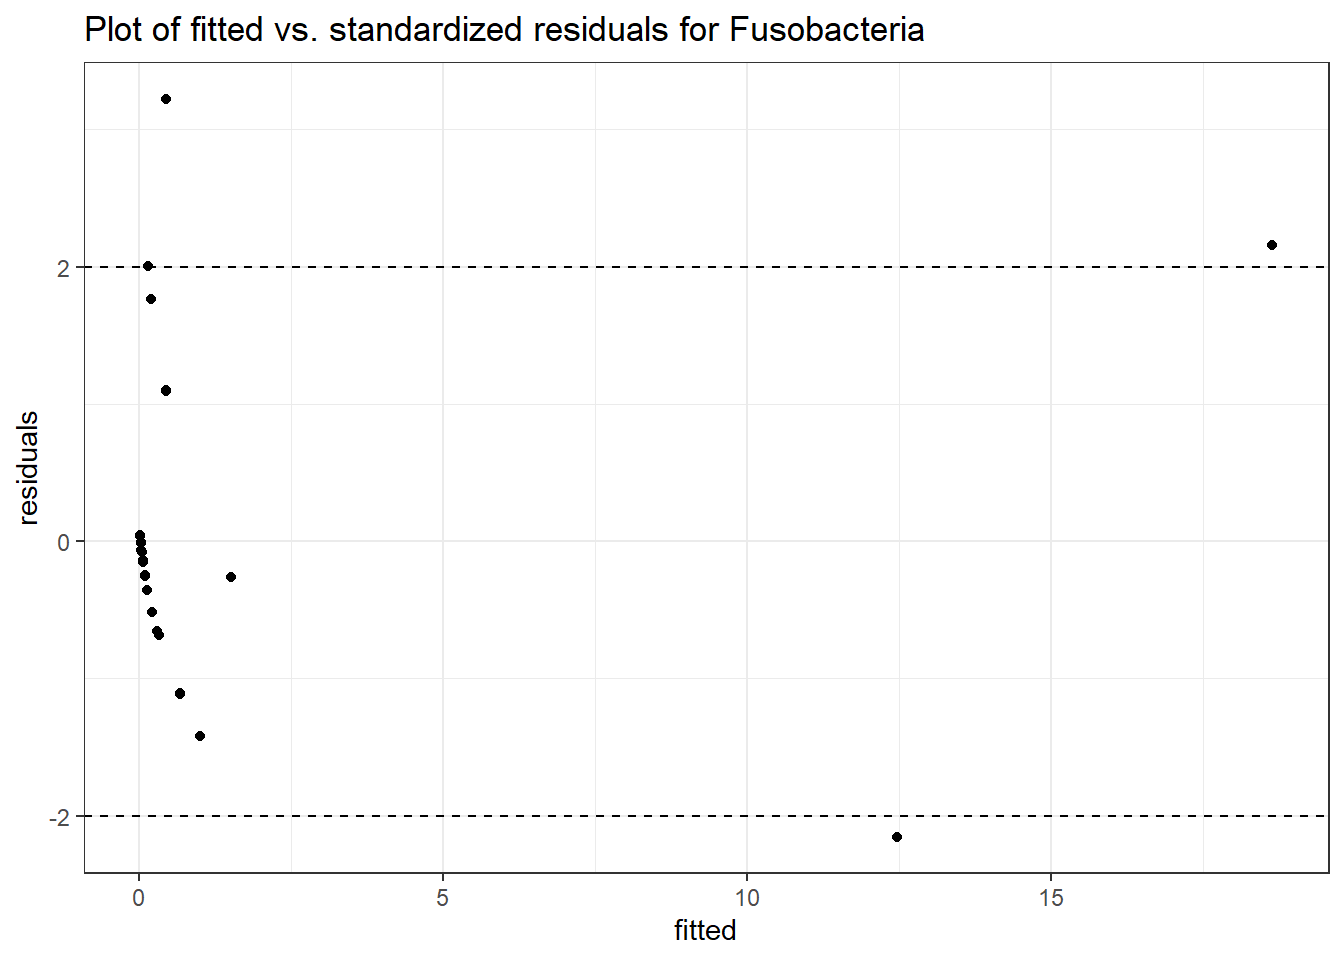
Fixed Effects (change in log)

                 Outcome Estimate Std. Error  z value Pr(>|z|)
(Intercept) Fusobacteria -2.25724    1.49545 -1.50941  0.13119
time        Fusobacteria -0.40251    0.24257 -1.65936  0.09704
hispanic    Fusobacteria  0.88922    1.71475  0.51857  0.60406


Random Effects (SD on log scale)

 Groups    Name        Std.Dev.
 SubjectID (Intercept) 2.189

Significance test not available

#########################################
#########################################
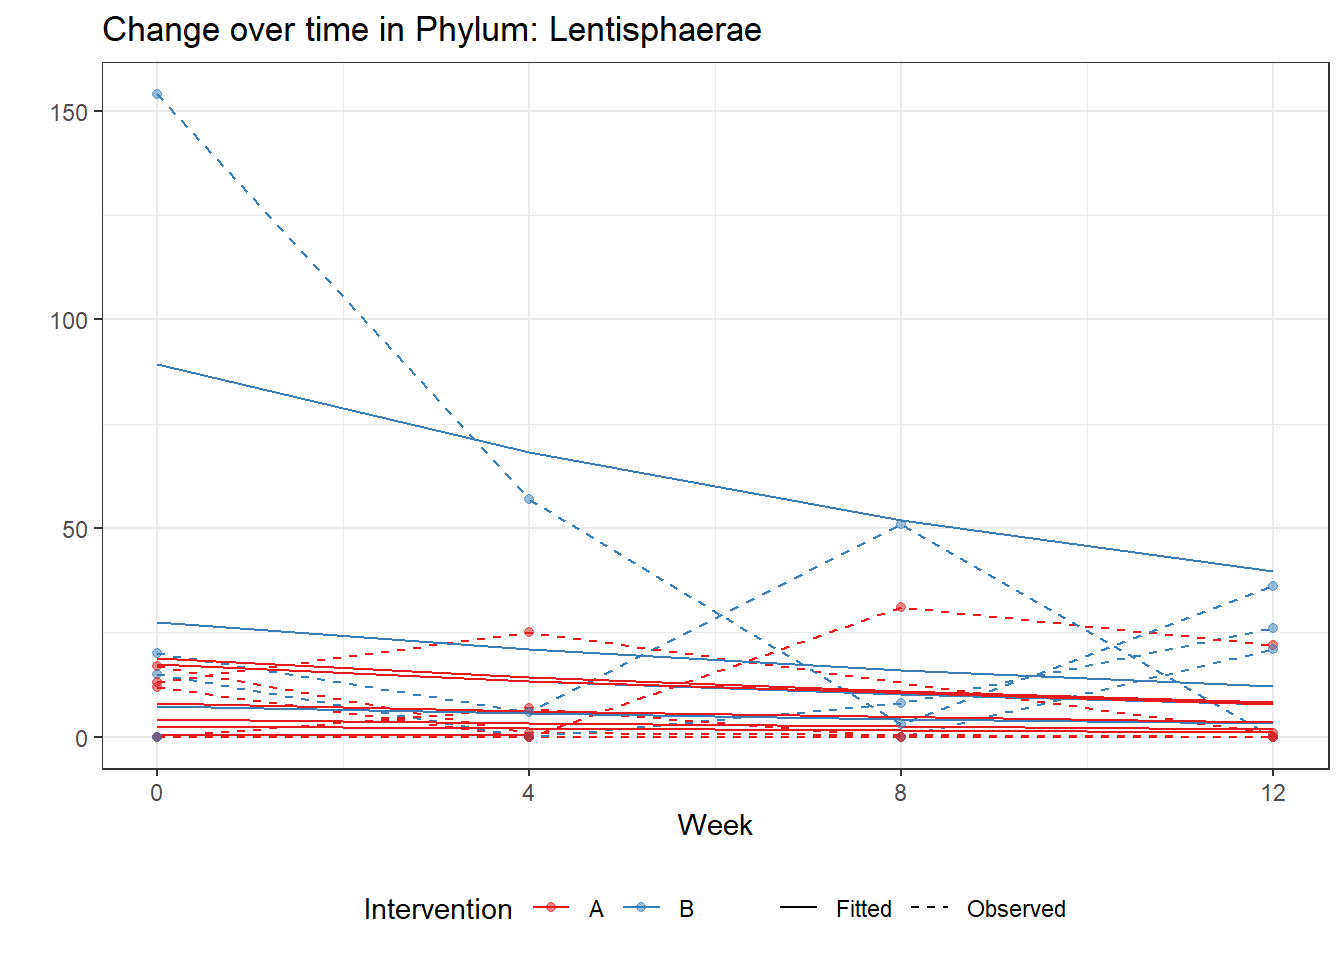
Model:  Lentisphaerae ~ 1 + time + hispanic + (1 | SubjectID)
<environment: 0x00000000065308b0>

Link:    poisson


Intraclass Correlation (ICC):   0.6850713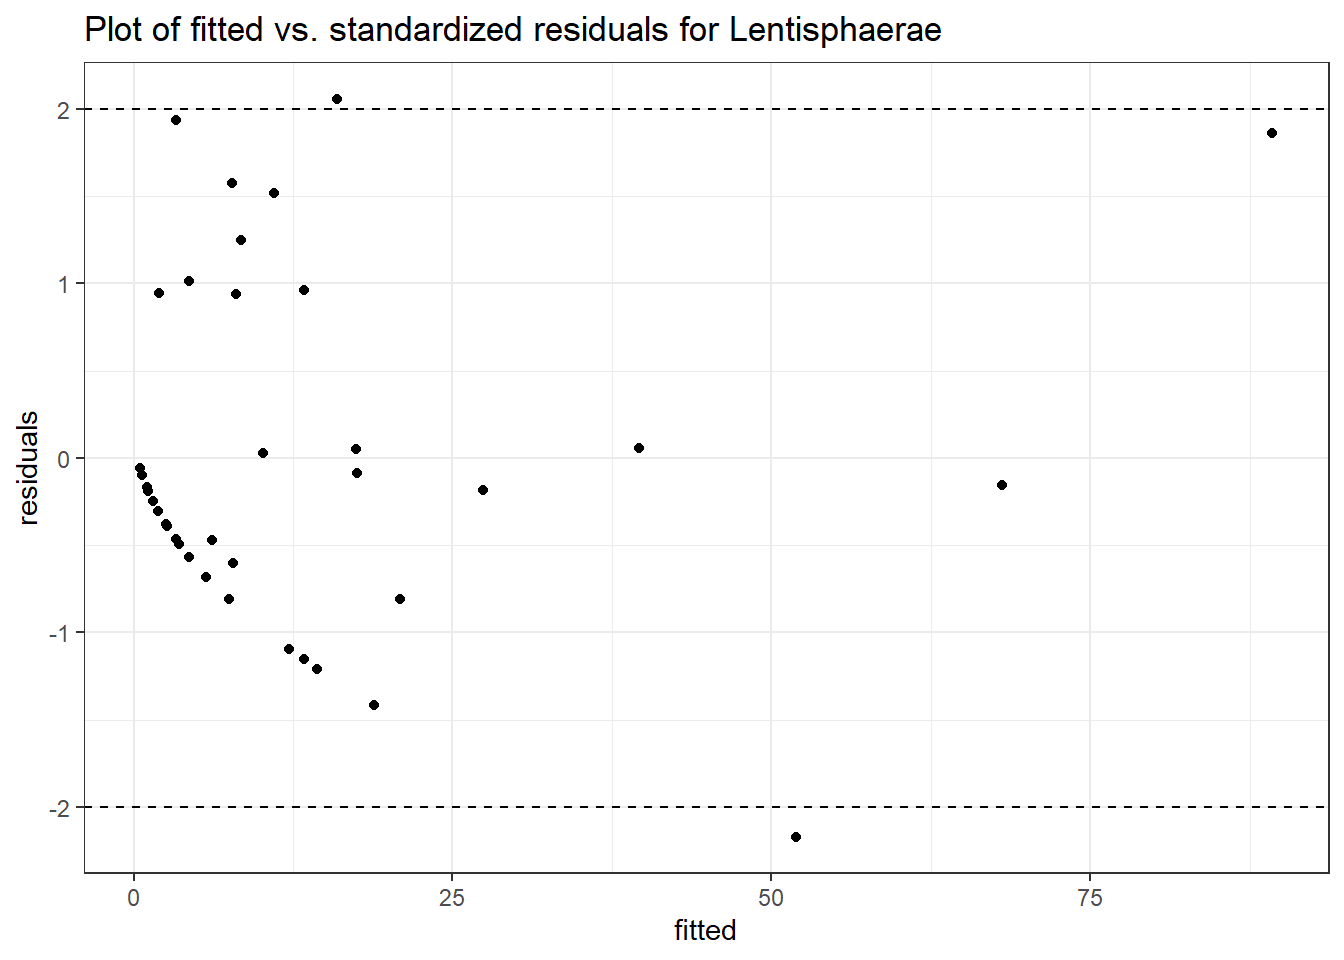
Fixed Effects (change in log)

                  Outcome Estimate Std. Error  z value Pr(>|z|)
(Intercept) Lentisphaerae  1.59306    0.75228  2.11762  0.03421
time        Lentisphaerae -0.27062    0.03999 -6.76680  0.00000
hispanic    Lentisphaerae  0.63780    0.95946  0.66476  0.50621


Random Effects (SD on log scale)

 Groups    Name        Std.Dev.
 SubjectID (Intercept) 1.4749

Significance test not available

#########################################
#########################################
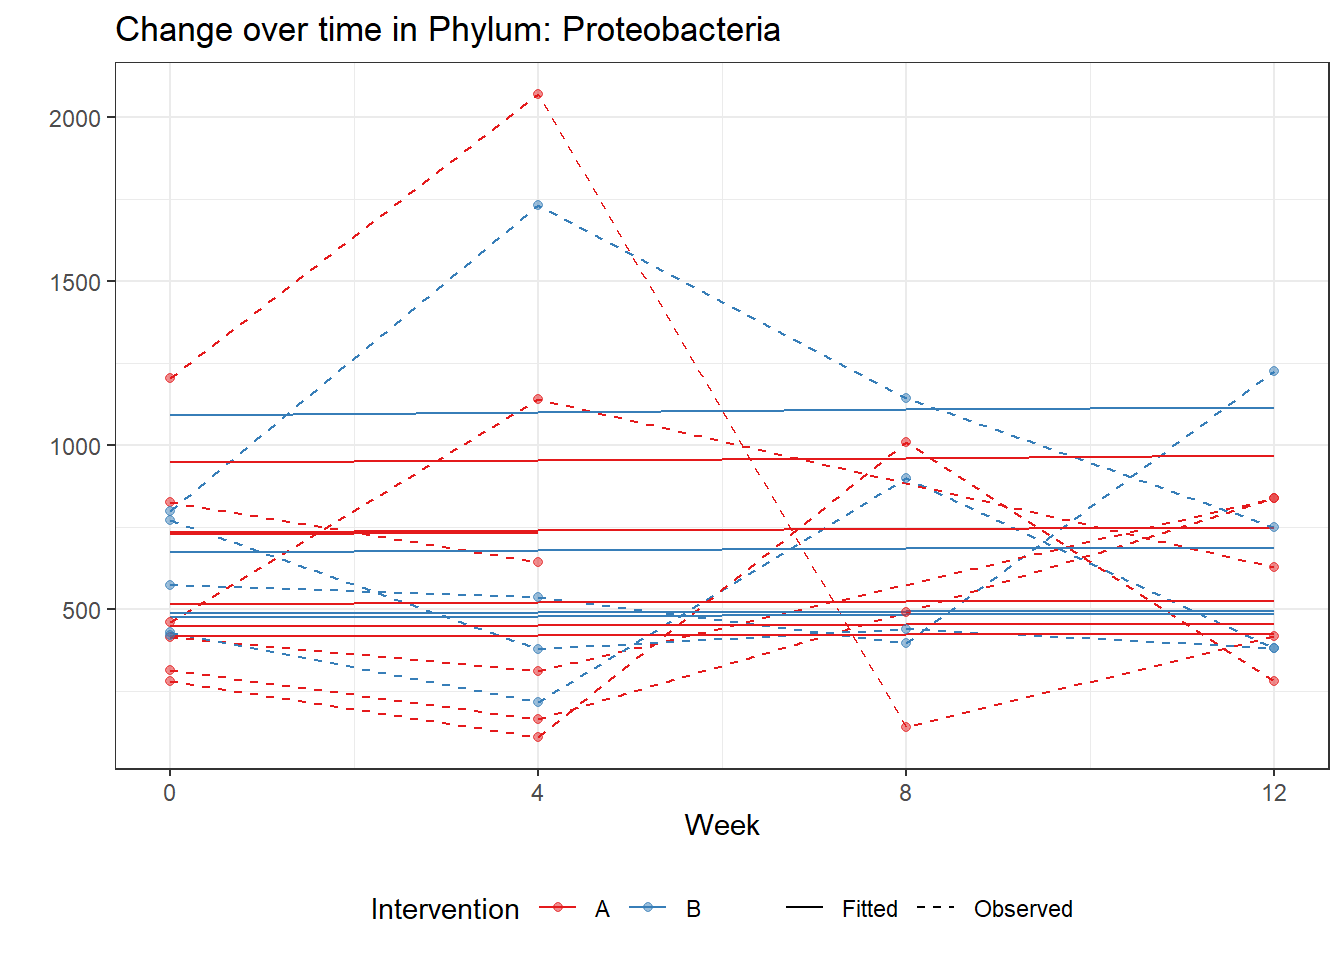
Model:  Proteobacteria ~ 1 + time + hispanic + (1 | SubjectID)
<environment: 0x00000000065308b0>

Link:    poisson


Intraclass Correlation (ICC):   0.09234374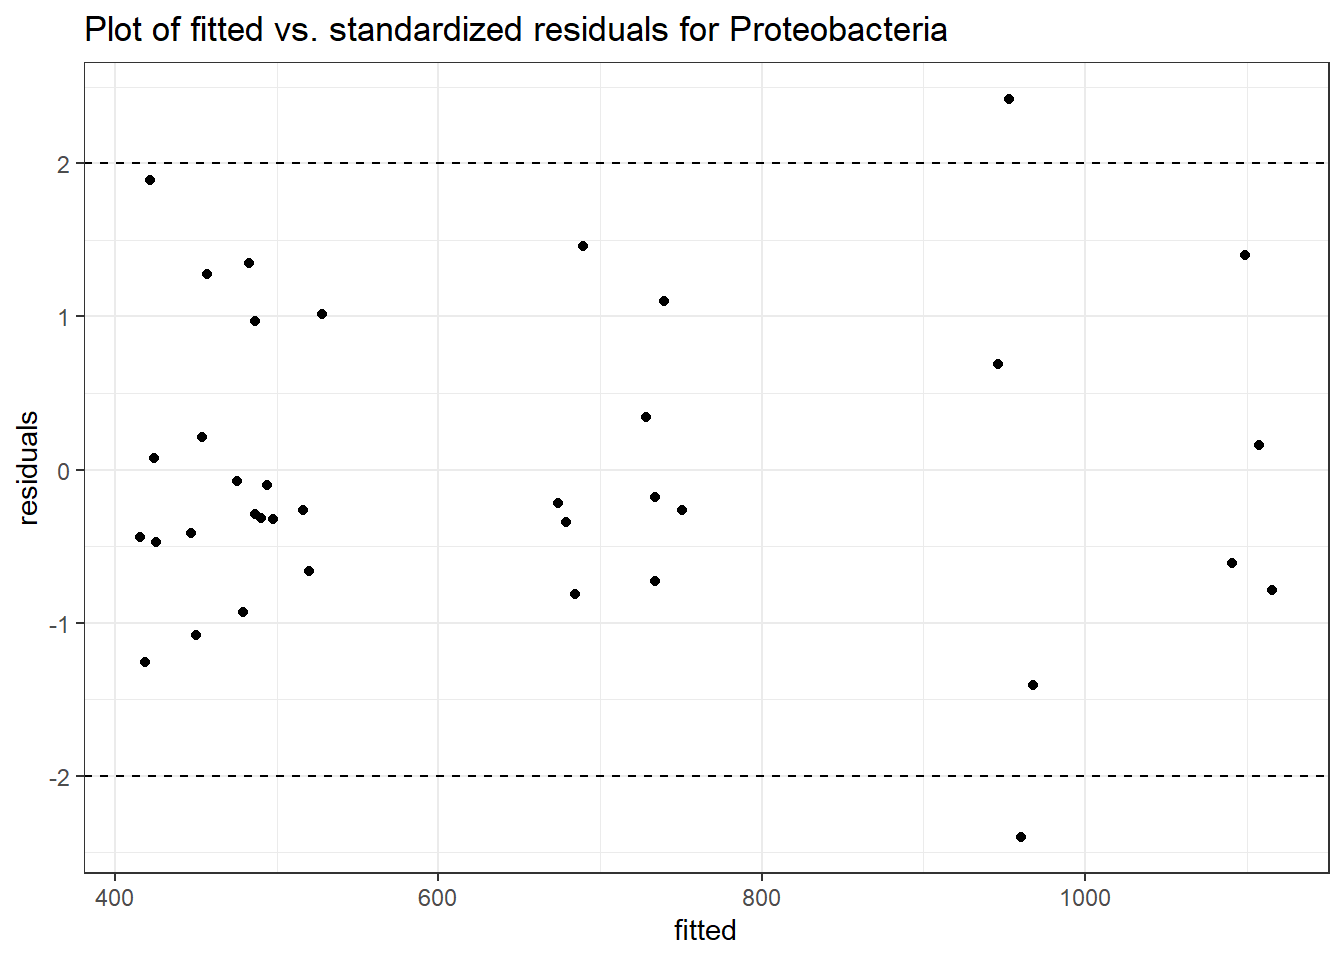
Fixed Effects (change in log)

                   Outcome Estimate Std. Error  z value Pr(>|z|)
(Intercept) Proteobacteria  6.42834    0.16007 40.15939  0.00000
time        Proteobacteria  0.00753    0.00585  1.28766  0.19786
hispanic    Proteobacteria -0.05503    0.20049 -0.27450  0.78370


Random Effects (SD on log scale)

 Groups    Name        Std.Dev.
 SubjectID (Intercept) 0.31896

Significance test not available

#########################################
#########################################
Model:  Tenericutes ~ 1 + time + hispanic + (1 | SubjectID)
<environment: 0x00000000065308b0>

Link:    poisson


Intraclass Correlation (ICC):   0.9091899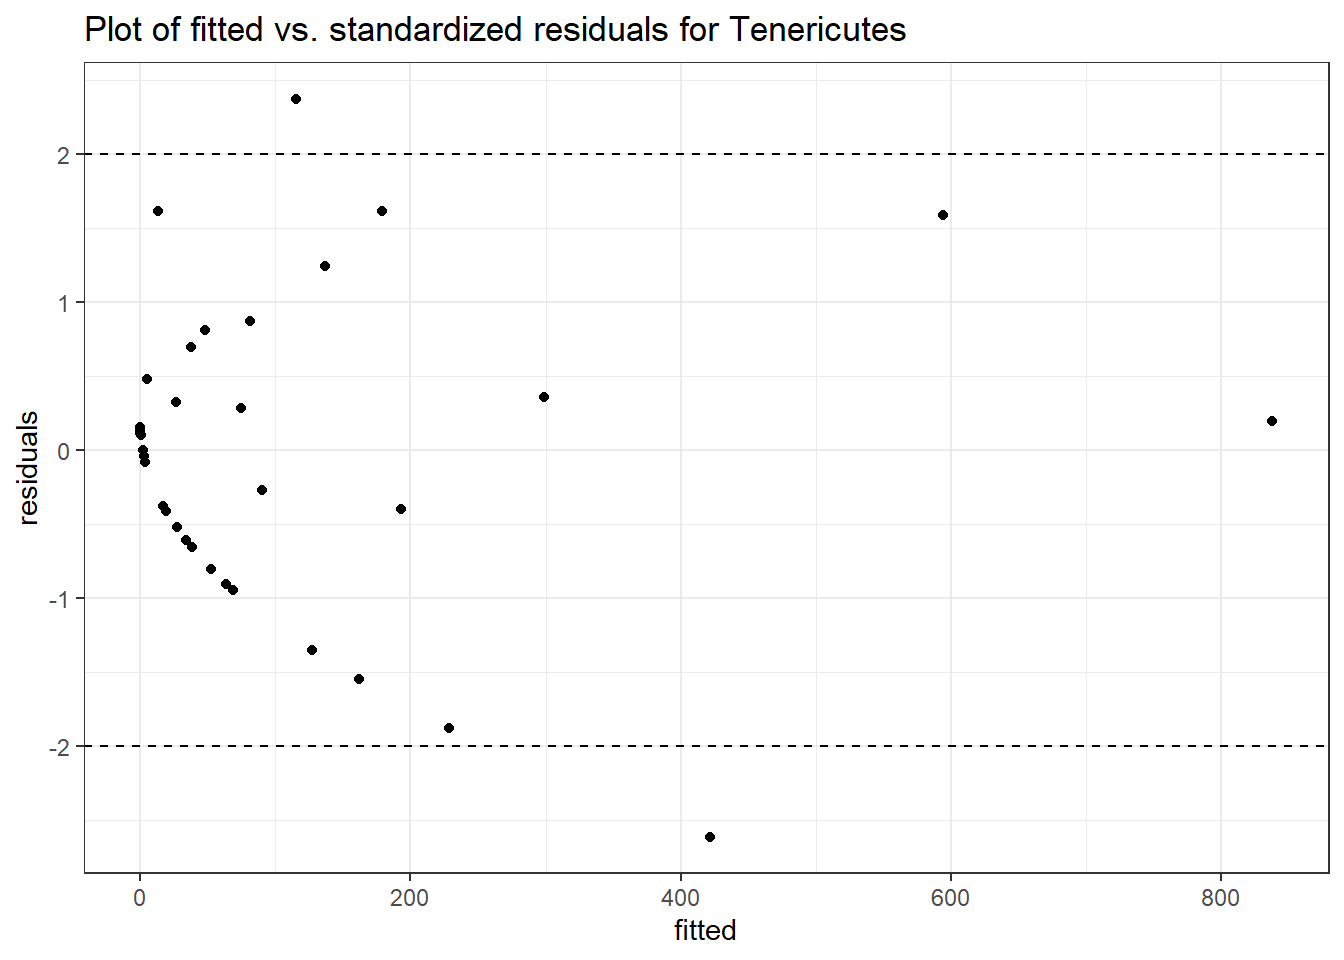
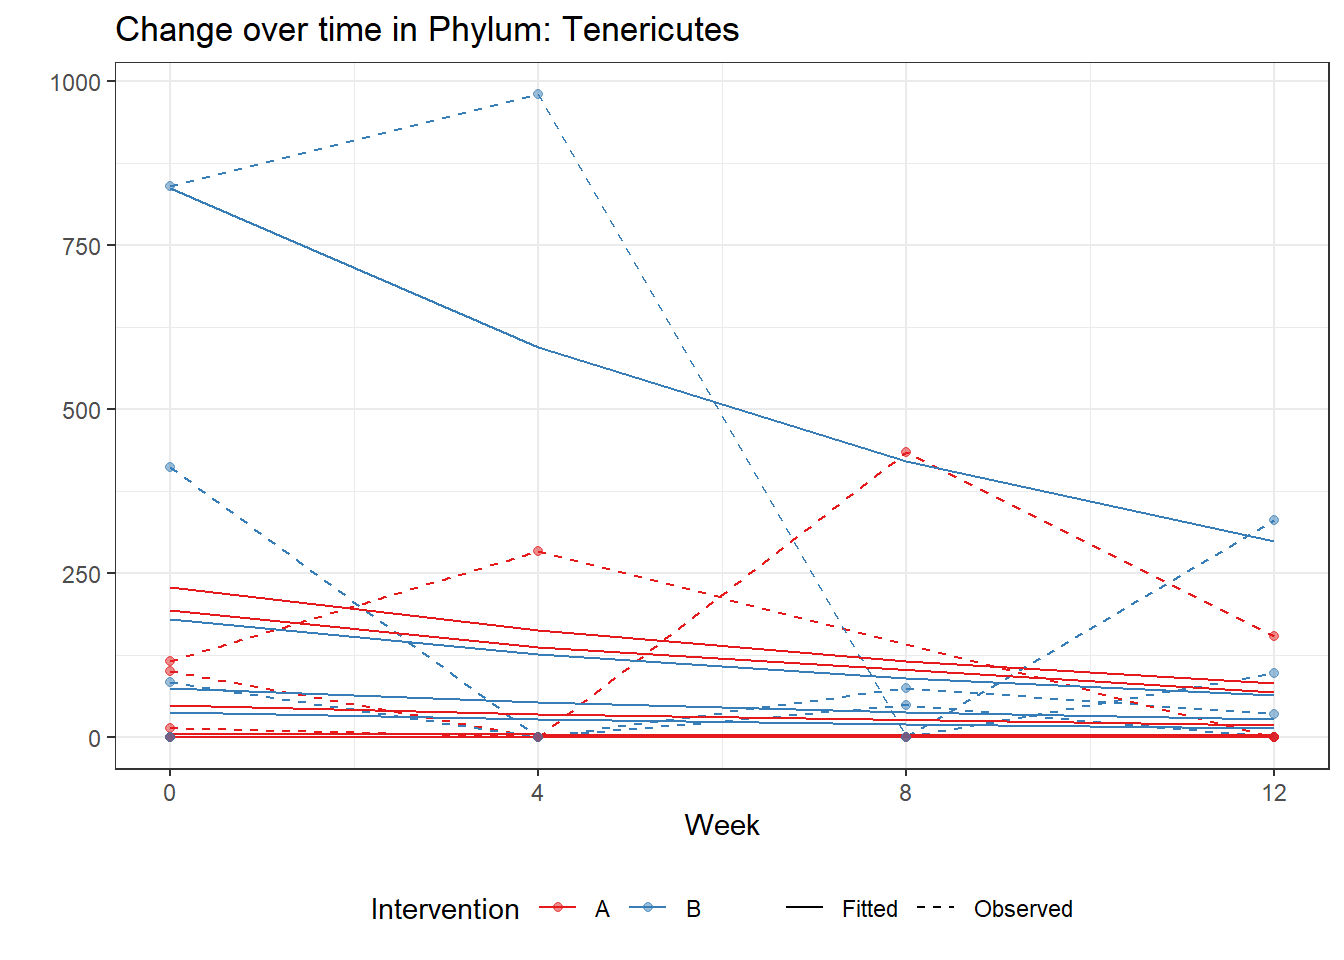
Fixed Effects (change in log)

                Outcome Estimate Std. Error   z value Pr(>|z|)
(Intercept) Tenericutes  1.59152    1.62705   0.97816  0.32799
time        Tenericutes -0.34362    0.01482 -23.18060  0.00000
hispanic    Tenericutes  1.73375    2.03217   0.85315  0.39358


Random Effects (SD on log scale)

 Groups    Name        Std.Dev.
 SubjectID (Intercept) 3.1642

Significance test not available

#########################################
#########################################
Model:  Verrucomicrobia ~ 1 + time + hispanic + (1 | SubjectID)
<environment: 0x00000000065308b0>

Link:    poisson


Intraclass Correlation (ICC):   0.8662343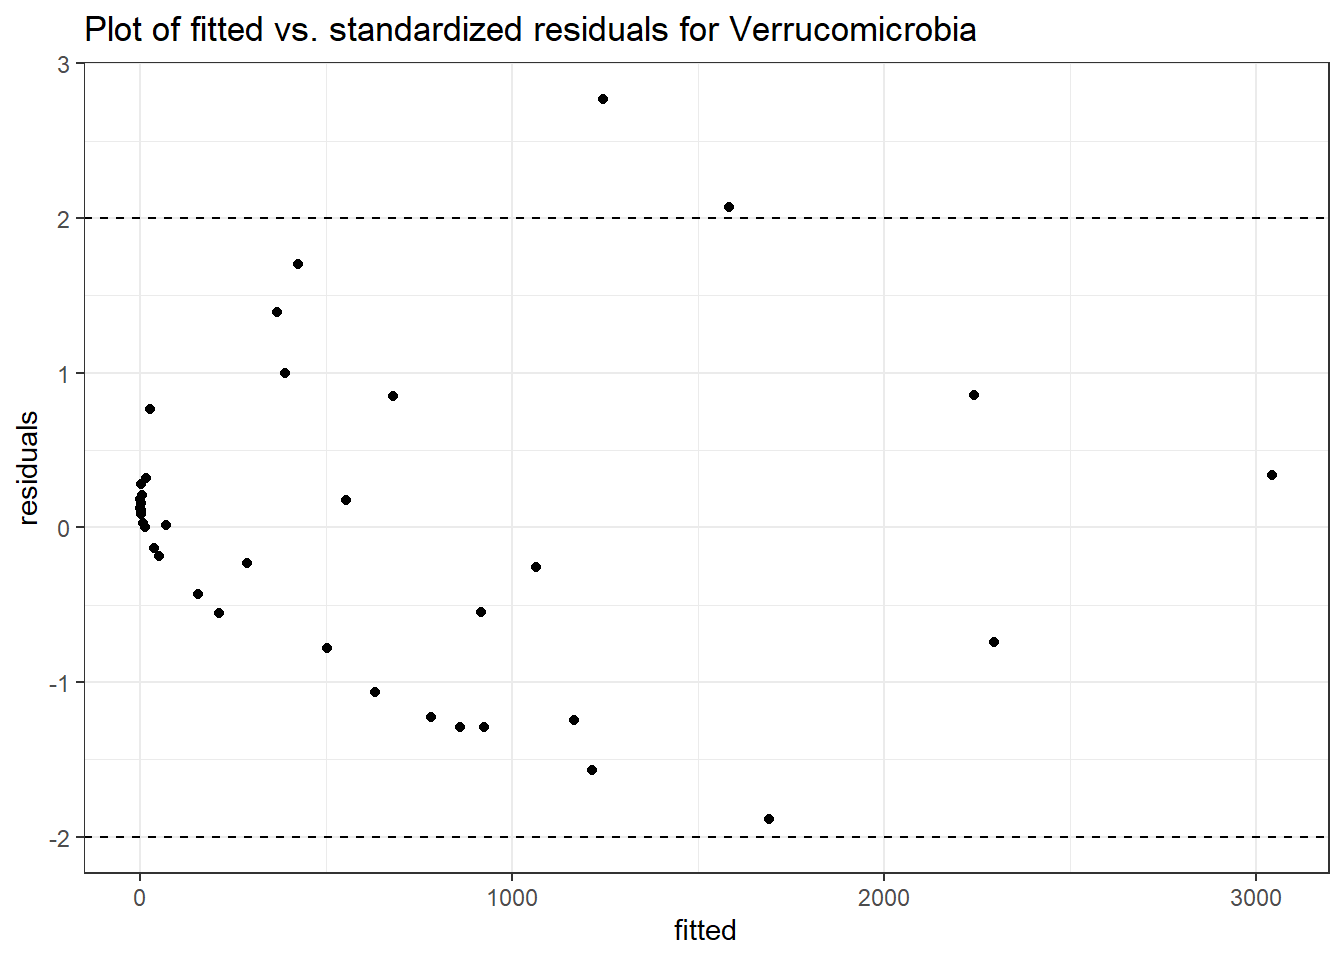
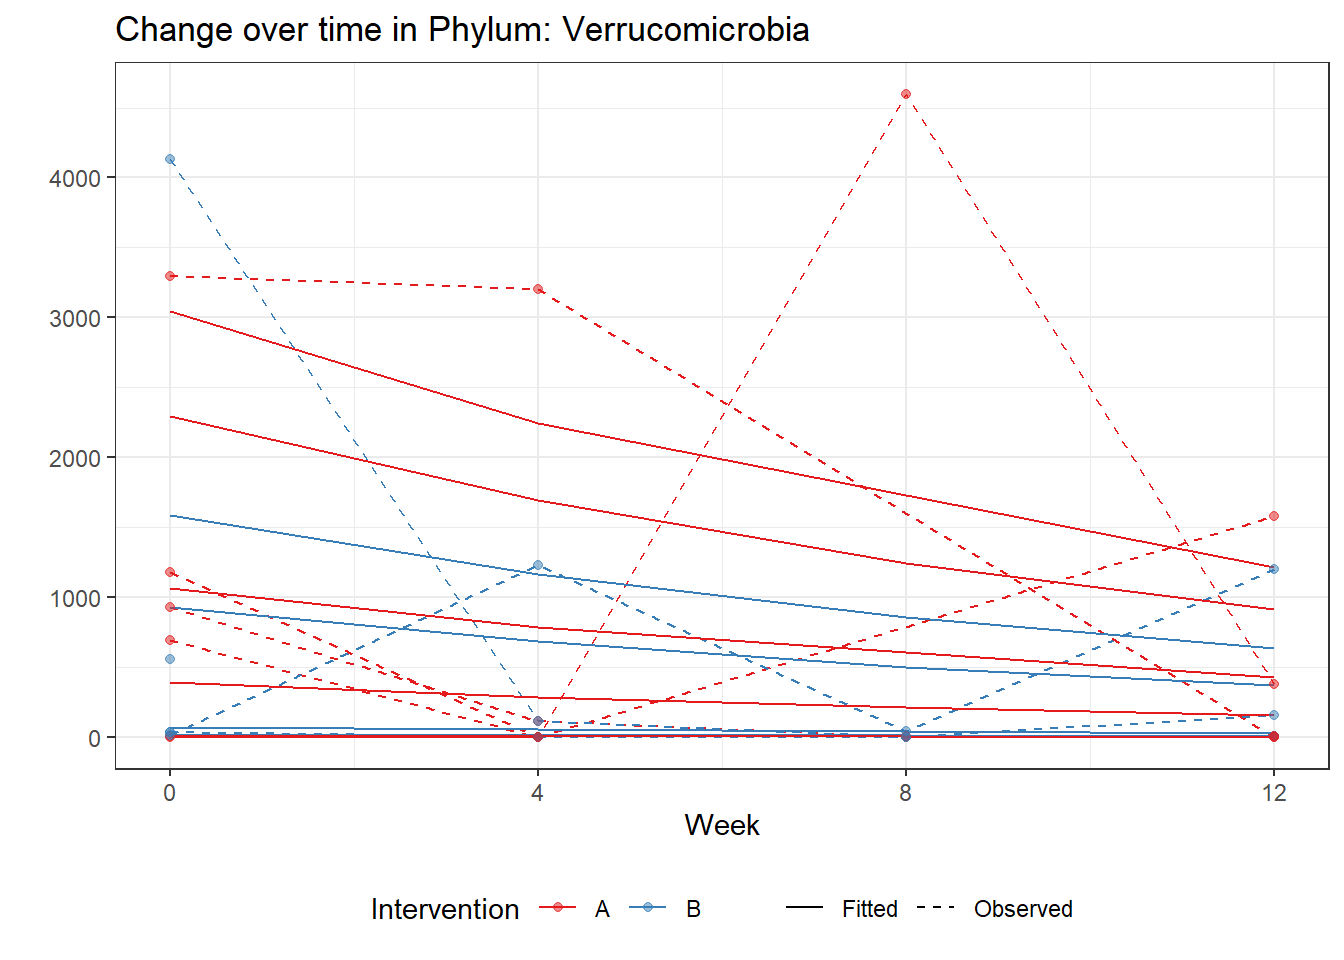
Fixed Effects (change in log)

                    Outcome Estimate Std. Error   z value Pr(>|z|)
(Intercept) Verrucomicrobia  4.28983    1.27709   3.35906  0.00078
time        Verrucomicrobia -0.30577    0.00609 -50.22242  0.00000
hispanic    Verrucomicrobia  1.47957    1.60311   0.92294  0.35604


Random Effects (SD on log scale)

 Groups    Name        Std.Dev.
 SubjectID (Intercept) 2.5448

Significance test not available
Controlling for the effect of time, Ethnicity was not significant for all Phylum.
Effect of Intervention
Next, we invested the effect of intervention, however, the results are parsed between which covariates are included in the model.
Intervention was coded as (group A = 0, and group B = 1). So, the results are interpretted as the effect of being in intervention group B.
Covariate(s): Time
\[\begin{align*} h\left(Y_{ij}\right)&=\beta_{0j} + \beta_{1j}*(Week)_{ij} + r_{ij}\\ \beta_{0j}&= \gamma_{00} + \gamma_{01}(Intervention)_{j} + u_{0j}\\ \beta_{1j}&= \gamma_{10}\\ \end{align*}\]
The effect of intervention is the main outcome of this study.
phylum.fit4 <- glmm_microbiome(mydata=microbiome_data,model.number=4,
                               taxa.level="Phylum", link="poisson",
                               model="1 + intB + time + (1|SubjectID)")
#########################################
#########################################
Model:  Actinobacteria ~ 1 + intB + time + (1 | SubjectID)
<environment: 0x000000003ca59558>

Link:    poisson


Intraclass Correlation (ICC):   0.4992711

Fixed Effects (change in log)

                   Outcome Estimate Std. Error   z value Pr(>|z|)
(Intercept) Actinobacteria  3.50884    0.41300   8.49601  0.00000
intB        Actinobacteria  0.85738    0.60937   1.40699  0.15943
time        Actinobacteria -0.26053    0.02240 -11.62836  0.00000


Random Effects (SD on log scale)

 Groups    Name        Std.Dev.
 SubjectID (Intercept) 0.99854

Significance test not available

#########################################
#########################################
Model:  Bacteroidetes ~ 1 + intB + time + (1 | SubjectID)
<environment: 0x000000003ca59558>

Link:    poisson


Intraclass Correlation (ICC):   0.09531271

Fixed Effects (change in log)

                  Outcome Estimate Std. Error   z value Pr(>|z|)
(Intercept) Bacteroidetes  8.84509    0.13256  66.72348  0.00000
intB        Bacteroidetes -0.14444    0.19660  -0.73466  0.46254
time        Bacteroidetes -0.02541    0.00189 -13.45500  0.00000


Random Effects (SD on log scale)

 Groups    Name        Std.Dev.
 SubjectID (Intercept) 0.32458

Significance test not available

#########################################
#########################################
Model:  Cyanobacteria ~ 1 + intB + time + (1 | SubjectID)
<environment: 0x000000003ca59558>

Link:    poisson


Intraclass Correlation (ICC):   0.8210815
Fixed Effects (change in log)

                  Outcome Estimate Std. Error   z value Pr(>|z|)
(Intercept) Cyanobacteria  3.65573    0.88488   4.13131  0.00004
intB        Cyanobacteria -2.41428    1.33763  -1.80489  0.07109
time        Cyanobacteria -0.60182    0.02518 -23.89744  0.00000


Random Effects (SD on log scale)

 Groups    Name        Std.Dev.
 SubjectID (Intercept) 2.1422

Significance test not available

#########################################
#########################################
Model:  Euryarchaeota ~ 1 + intB + time + (1 | SubjectID)
<environment: 0x000000003ca59558>

Link:    poisson
Warning in checkConv(attr(opt, "derivs"), opt$par, ctrl = control$checkConv, :
Model failed to converge with max|grad| = 0.0419304 (tol = 0.002, component 1)
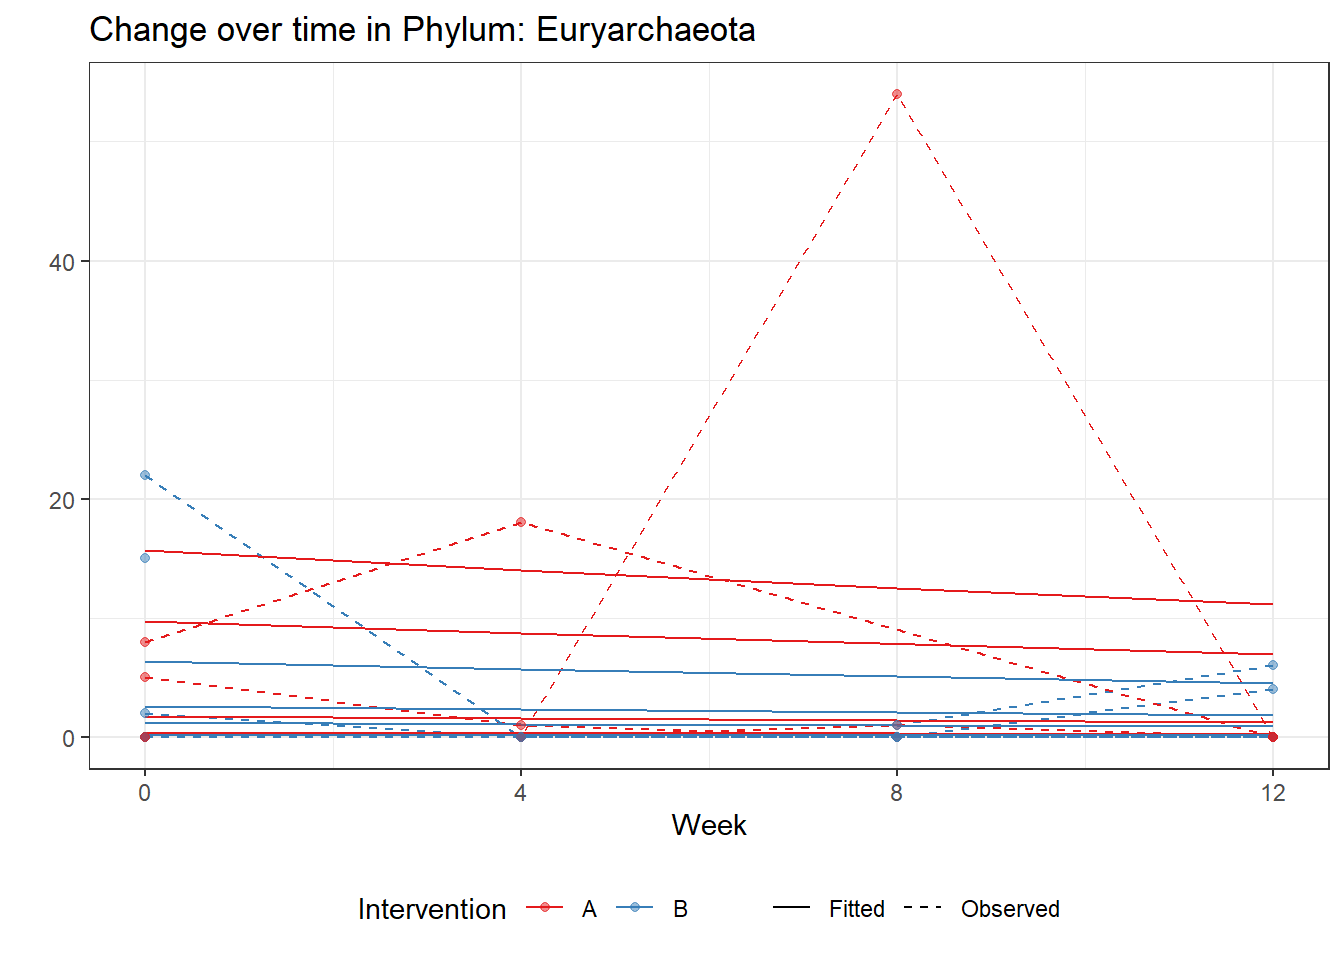
Intraclass Correlation (ICC): 0.7885852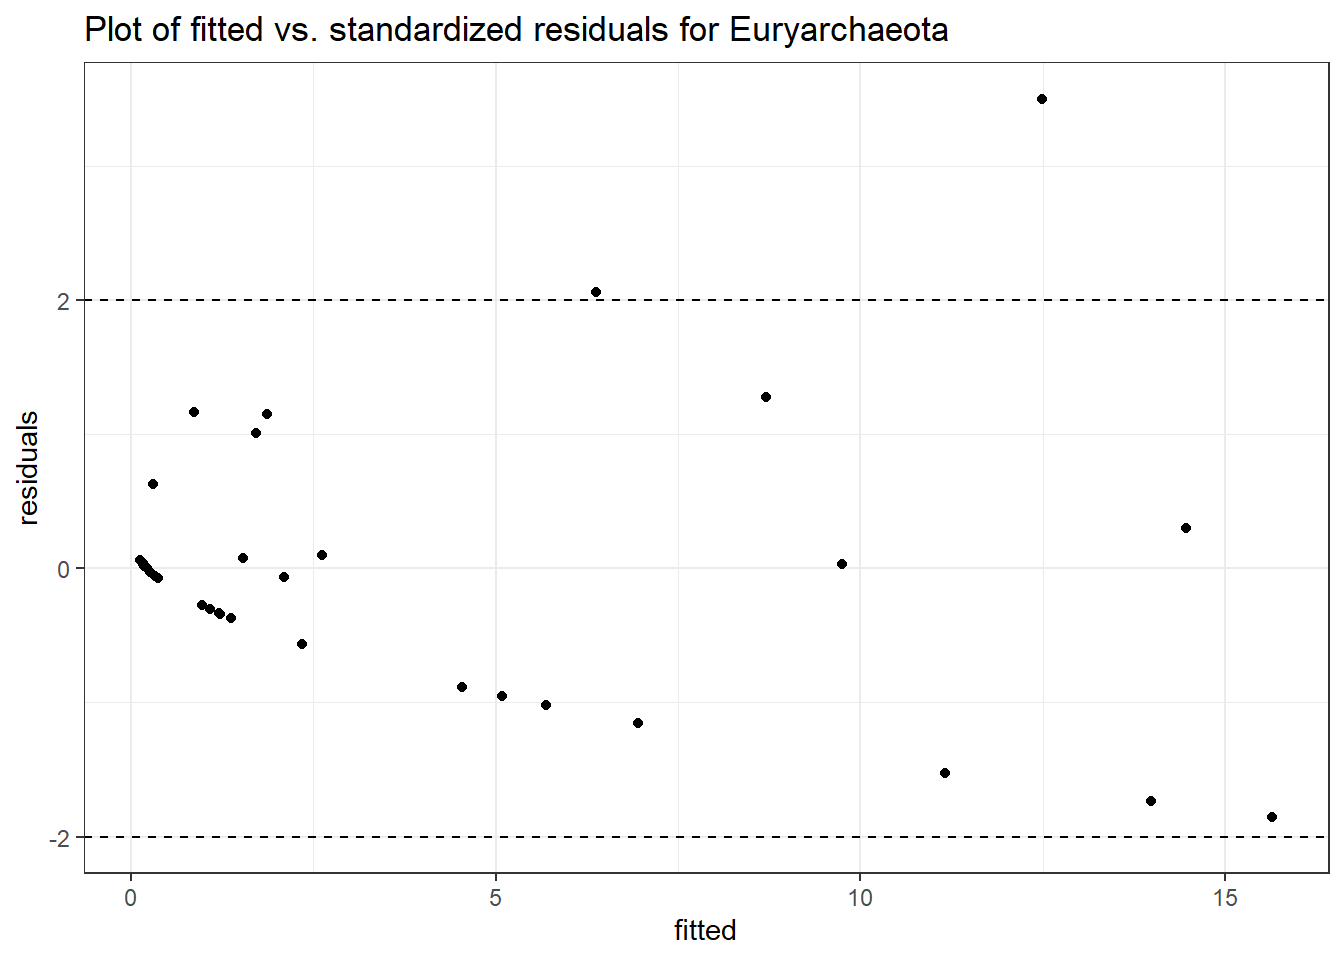
Fixed Effects (change in log)

                  Outcome Estimate Std. Error   z value Pr(>|z|)
(Intercept) Euryarchaeota -0.00149    0.00169  -0.88305  0.37721
intB        Euryarchaeota  0.67878    0.00169 402.52163  0.00000
time        Euryarchaeota -0.11280    0.00169 -66.88817  0.00000


Random Effects (SD on log scale)

 Groups    Name        Std.Dev.
 SubjectID (Intercept) 1.9313

Significance test not available

#########################################
#########################################
Model:  Firmicutes ~ 1 + intB + time + (1 | SubjectID)
<environment: 0x000000003ca59558>

Link:    poisson


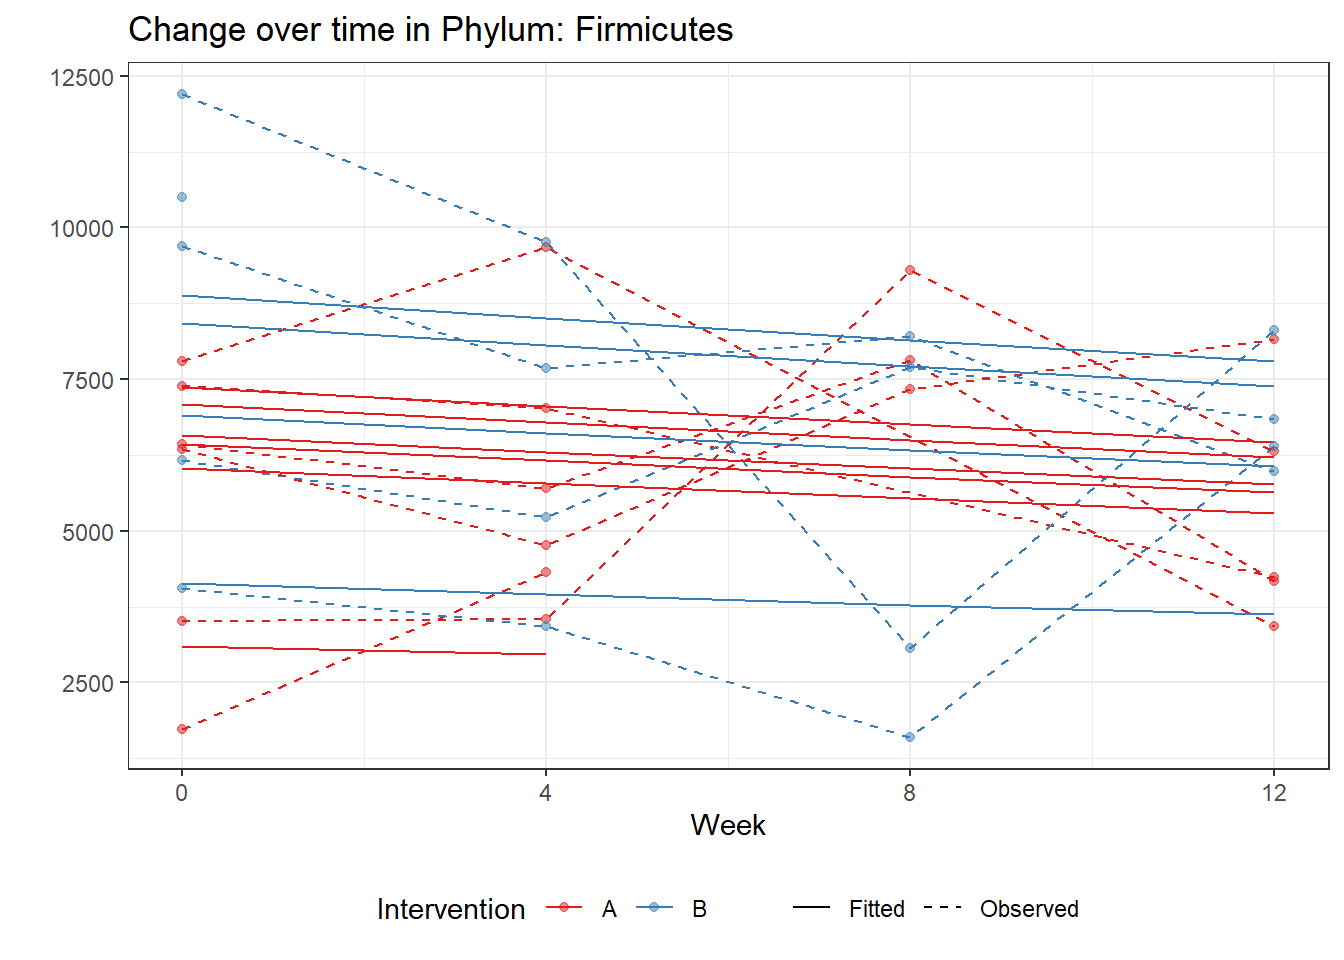
Intraclass Correlation (ICC):   0.0859897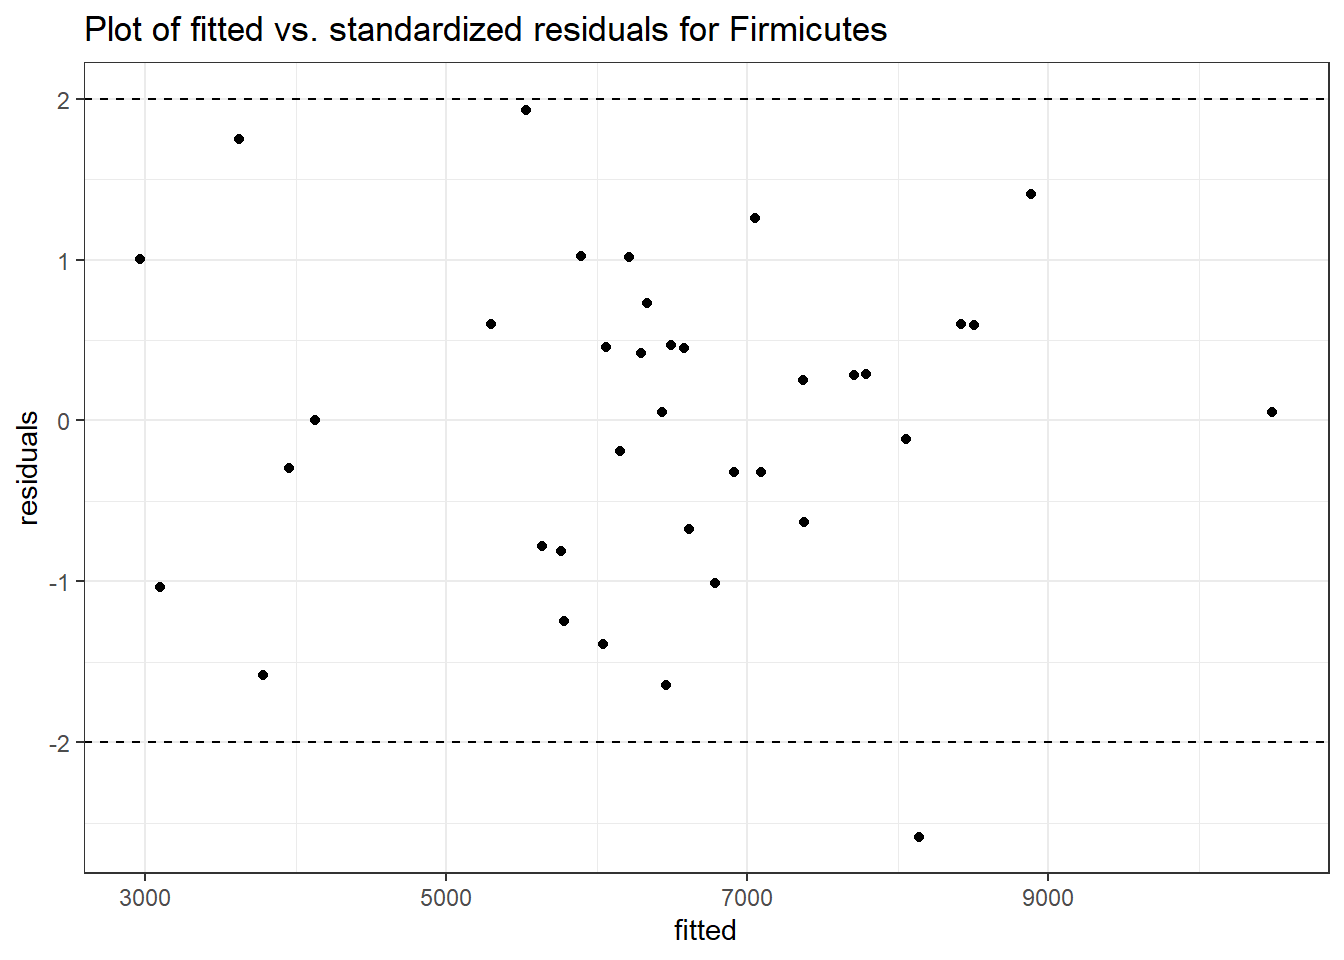
Fixed Effects (change in log)

               Outcome Estimate Std. Error   z value Pr(>|z|)
(Intercept) Firmicutes  8.67971    0.12528  69.28039  0.00000
intB        Firmicutes  0.23156    0.18579   1.24636  0.21263
time        Firmicutes -0.04391    0.00187 -23.47439  0.00000


Random Effects (SD on log scale)

 Groups    Name        Std.Dev.
 SubjectID (Intercept) 0.30672

Significance test not available

#########################################
#########################################
Model:  Fusobacteria ~ 1 + intB + time + (1 | SubjectID)
<environment: 0x000000003ca59558>

Link:    poisson


Intraclass Correlation (ICC):   0.8326759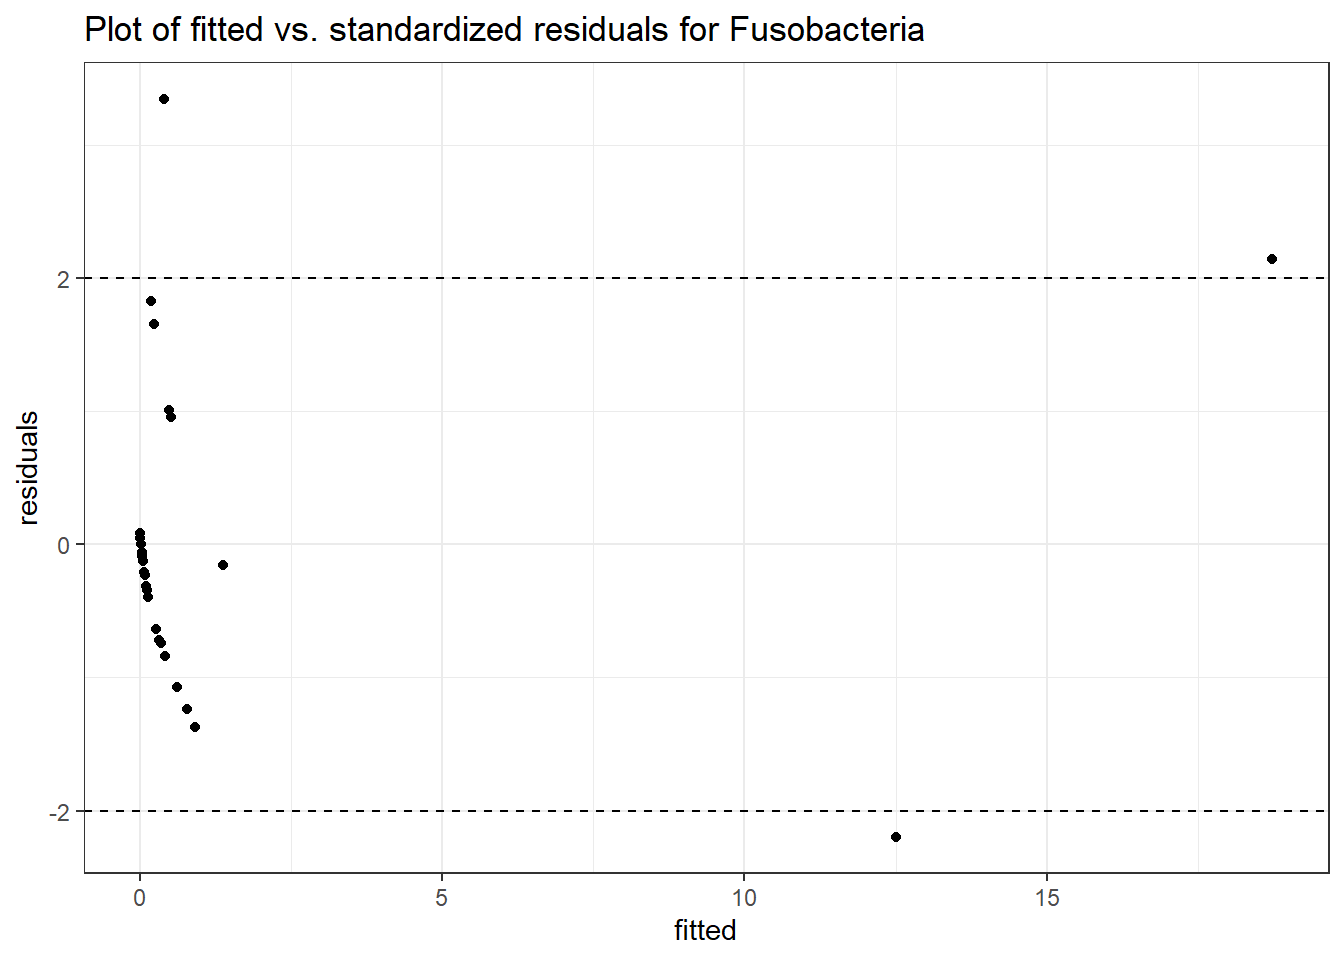
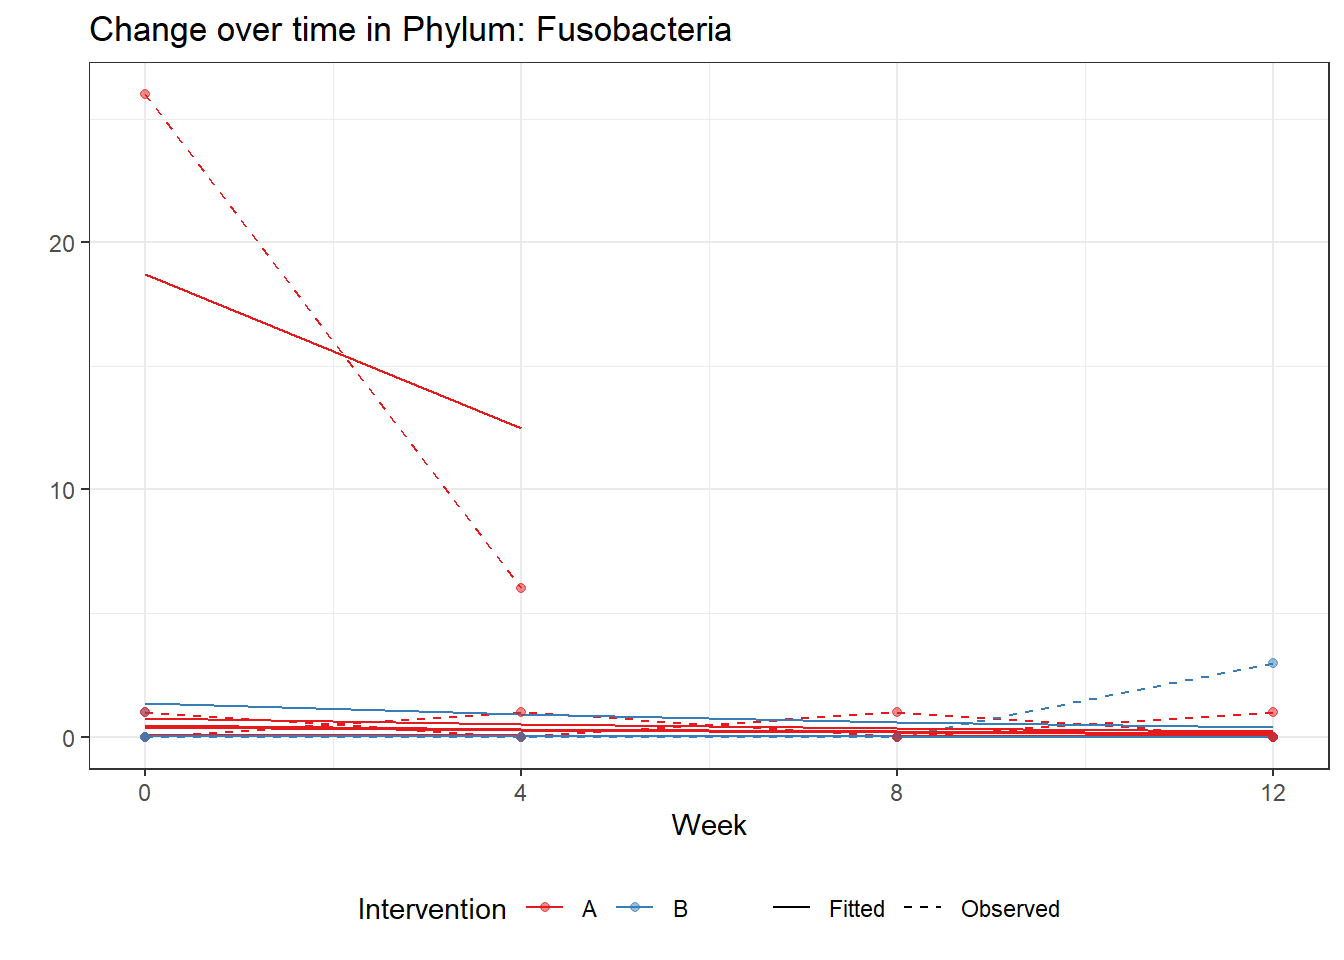
Fixed Effects (change in log)

                 Outcome Estimate Std. Error  z value Pr(>|z|)
(Intercept) Fusobacteria -0.89901    1.14984 -0.78185  0.43430
intB        Fusobacteria -2.13150    1.82425 -1.16843  0.24263
time        Fusobacteria -0.40385    0.24243 -1.66586  0.09574


Random Effects (SD on log scale)

 Groups    Name        Std.Dev.
 SubjectID (Intercept) 2.2308

Significance test not available

#########################################
#########################################
Model:  Lentisphaerae ~ 1 + intB + time + (1 | SubjectID)
<environment: 0x000000003ca59558>

Link:    poisson


Intraclass Correlation (ICC):   0.6748463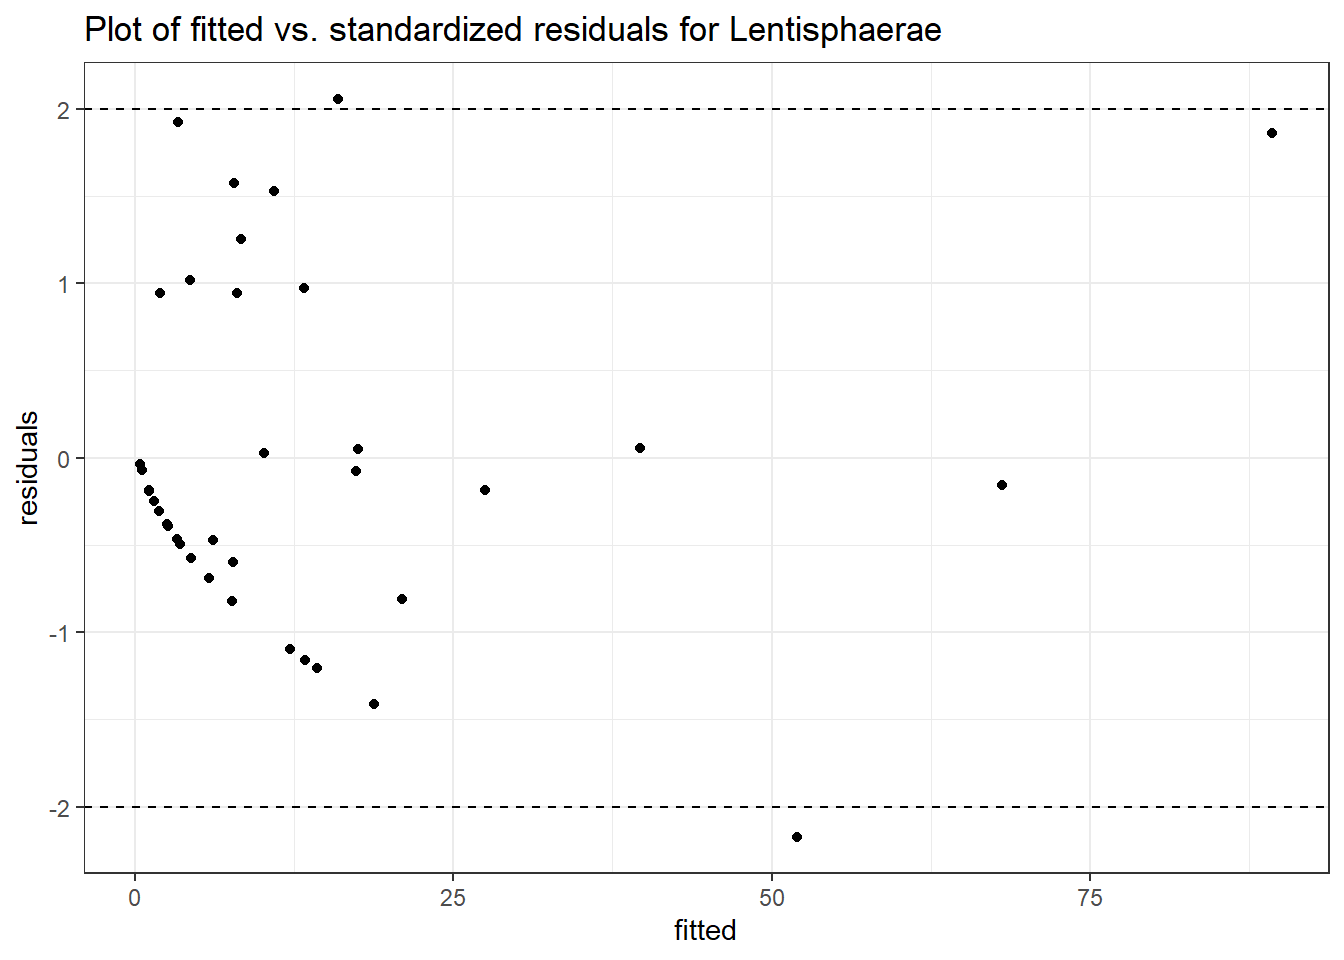
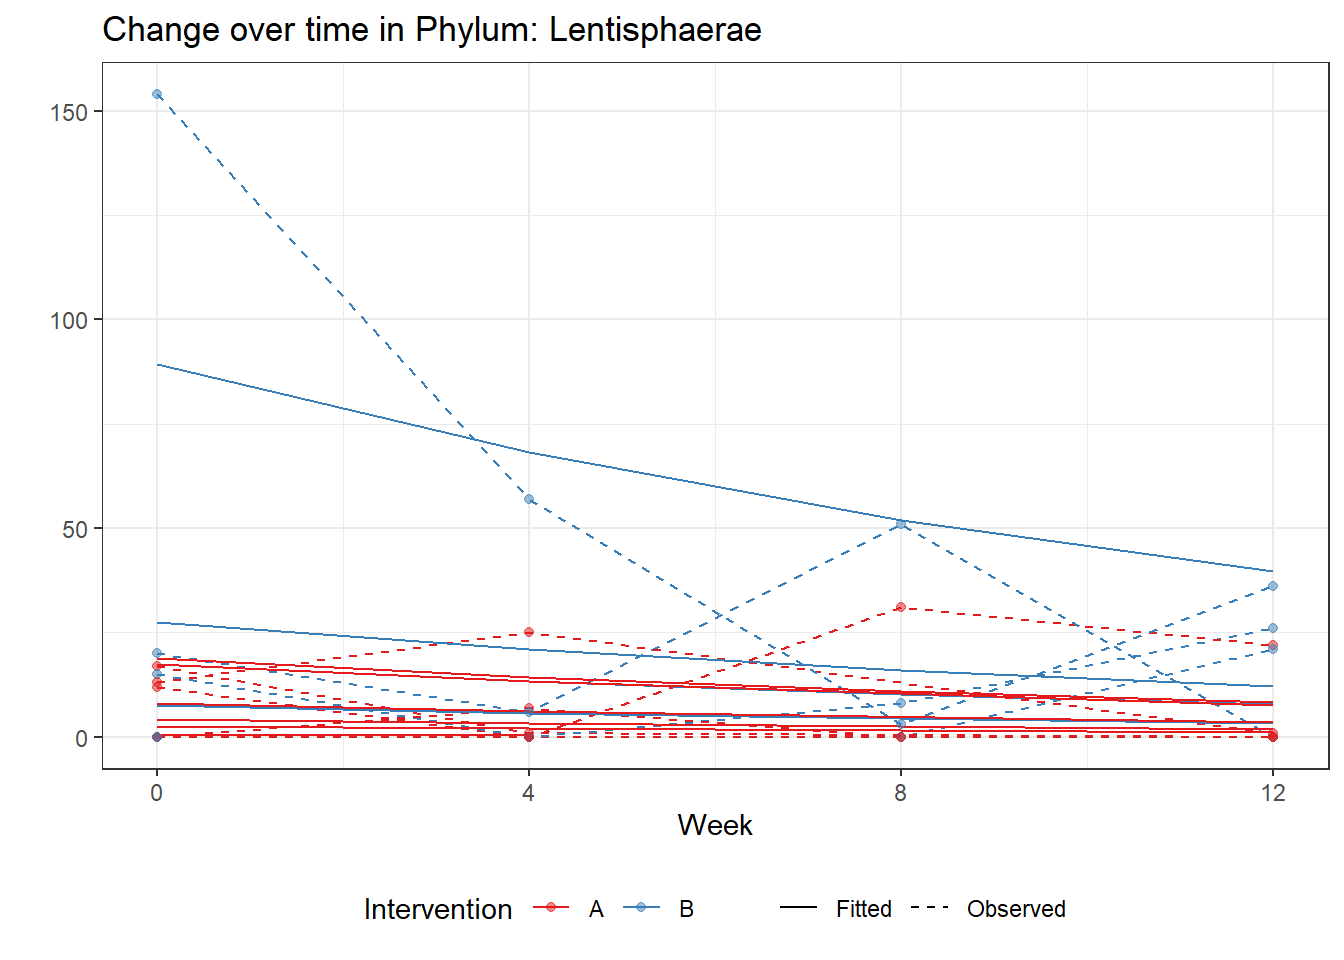
Fixed Effects (change in log)

                  Outcome Estimate Std. Error  z value Pr(>|z|)
(Intercept) Lentisphaerae  1.56301    0.61744  2.53142  0.01136
intB        Lentisphaerae  0.95309    0.90400  1.05431  0.29174
time        Lentisphaerae -0.27072    0.03999 -6.77006  0.00000


Random Effects (SD on log scale)

 Groups    Name        Std.Dev.
 SubjectID (Intercept) 1.4406

Significance test not available

#########################################
#########################################
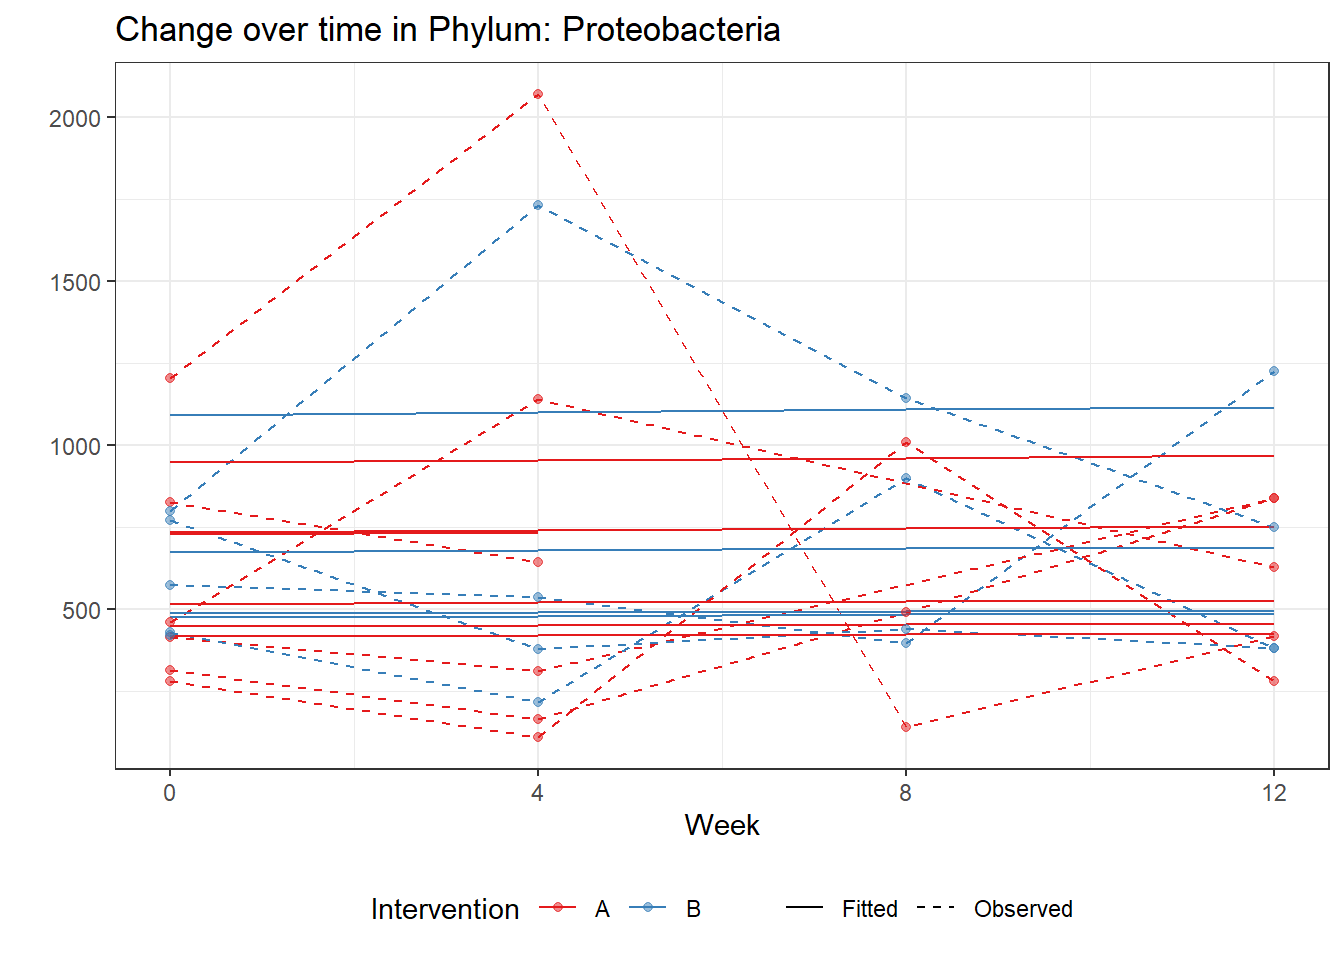
Model:  Proteobacteria ~ 1 + intB + time + (1 | SubjectID)
<environment: 0x000000003ca59558>

Link:    poisson


Intraclass Correlation (ICC):   0.09281958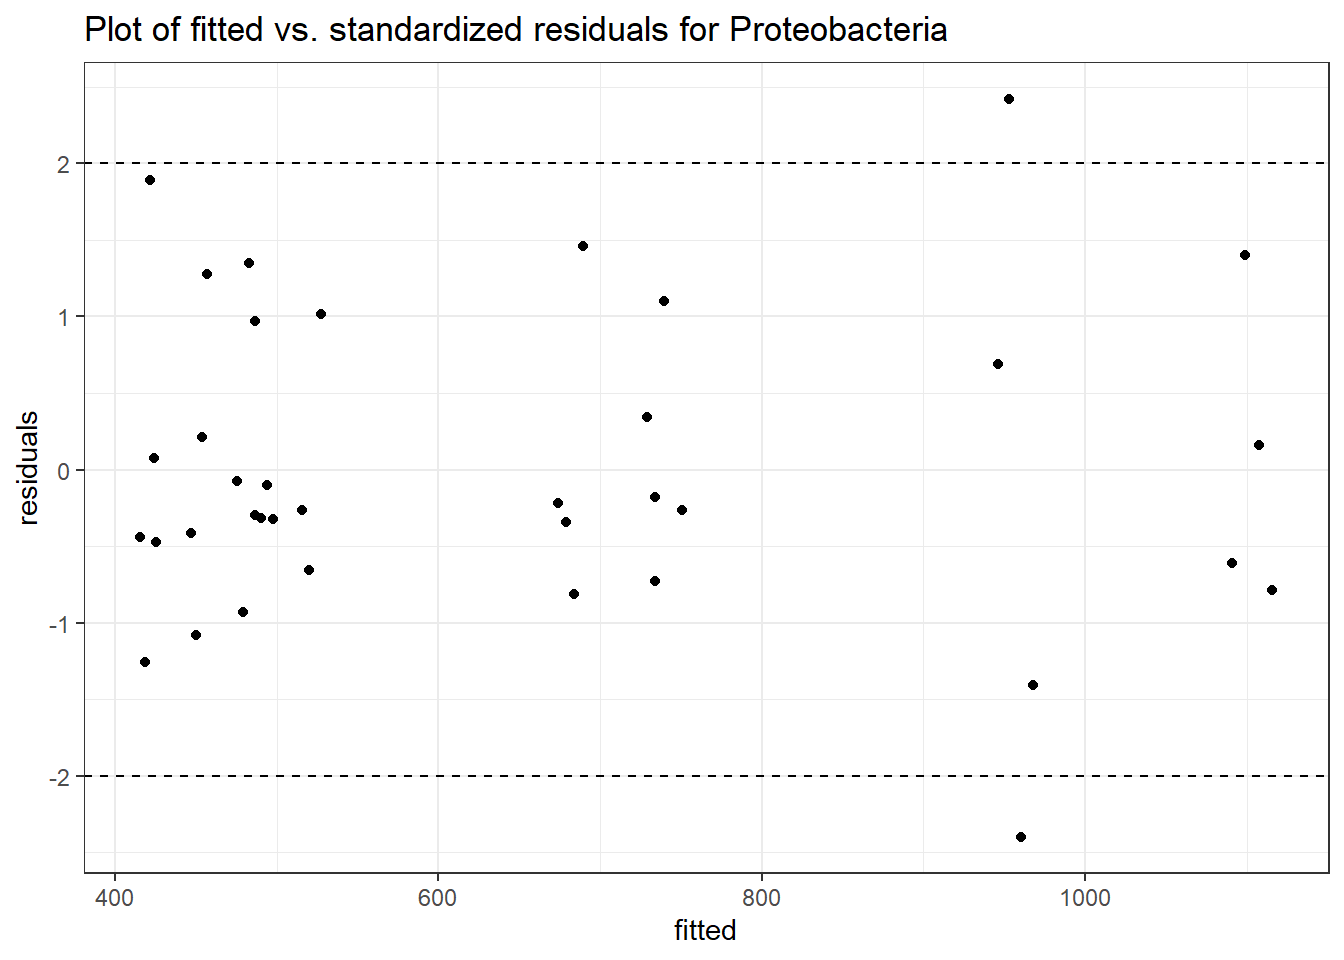
Fixed Effects (change in log)

                   Outcome Estimate Std. Error  z value Pr(>|z|)
(Intercept) Proteobacteria  6.40308    0.13114 48.82631  0.00000
intB        Proteobacteria -0.02151    0.19433 -0.11068  0.91187
time        Proteobacteria  0.00754    0.00585  1.29008  0.19702


Random Effects (SD on log scale)

 Groups    Name        Std.Dev.
 SubjectID (Intercept) 0.31987

Significance test not available

#########################################
#########################################
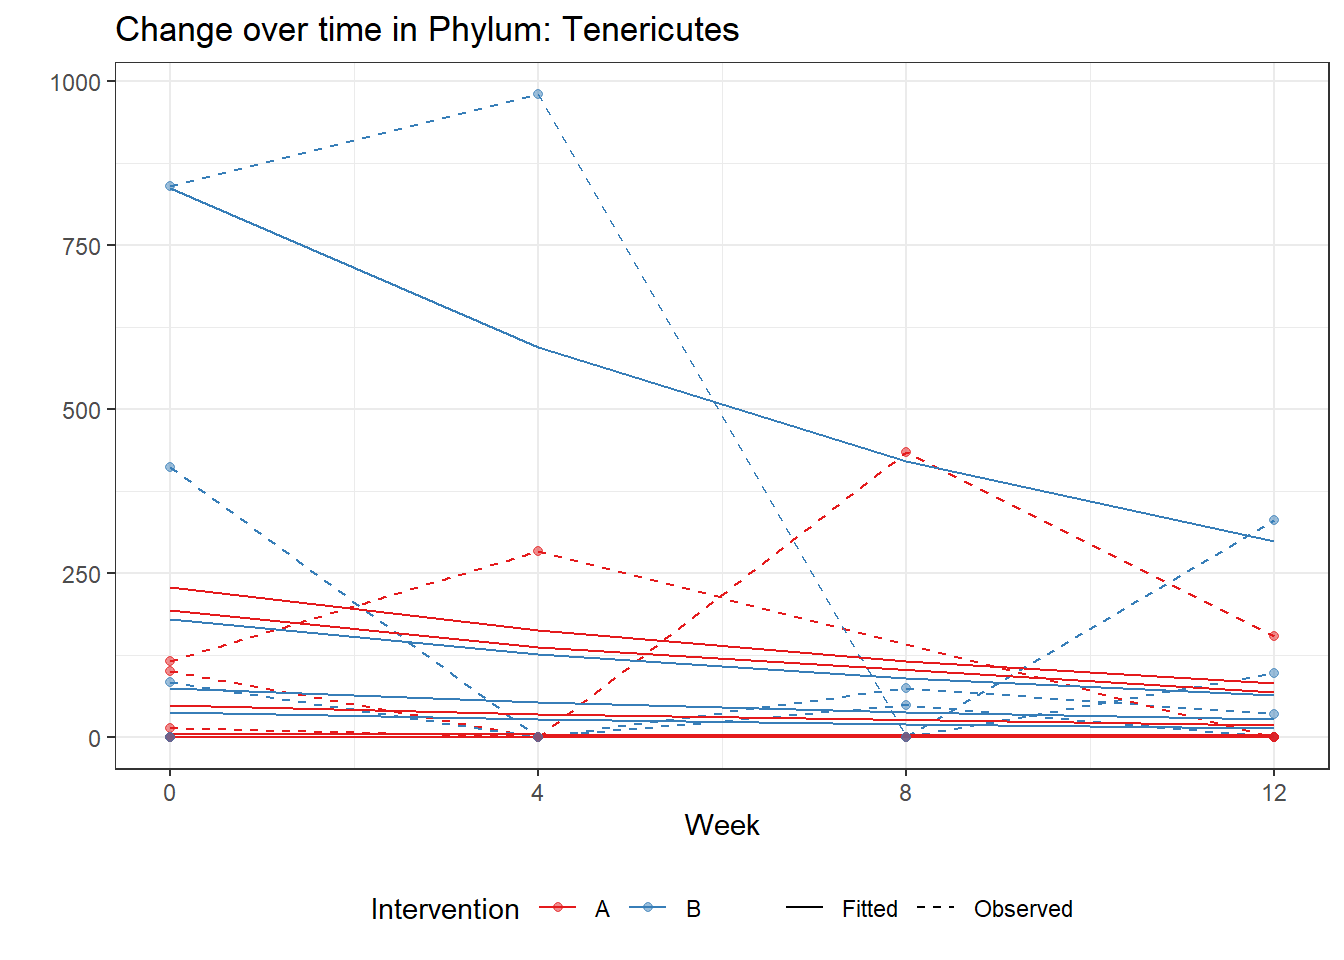
Model:  Tenericutes ~ 1 + intB + time + (1 | SubjectID)
<environment: 0x000000003ca59558>

Link:    poisson


Intraclass Correlation (ICC):   0.9107768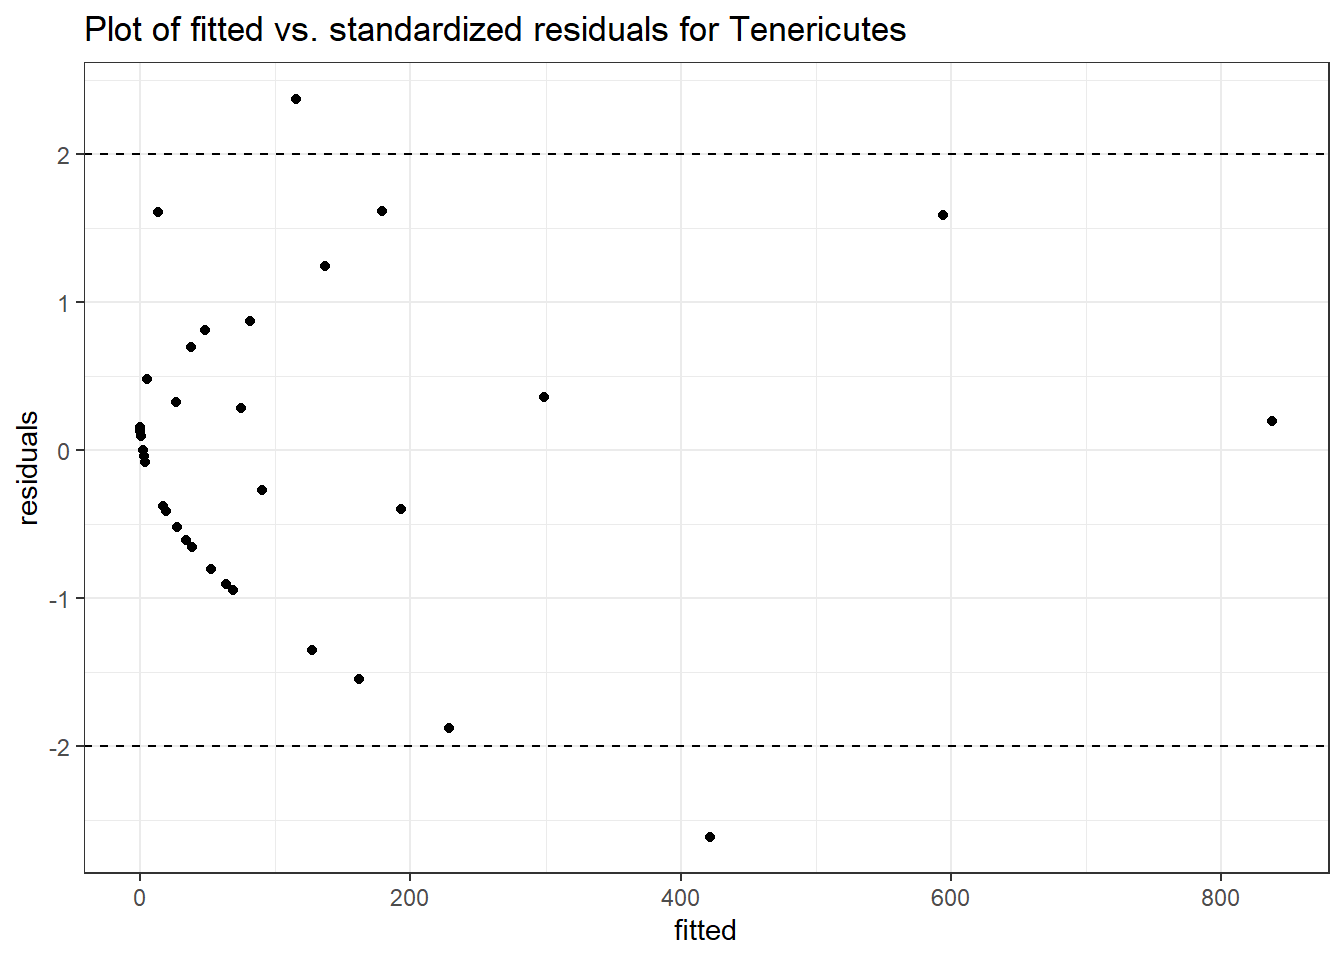
Fixed Effects (change in log)

                Outcome Estimate Std. Error   z value Pr(>|z|)
(Intercept) Tenericutes  1.83646    1.35864   1.35169  0.17648
intB        Tenericutes  1.82166    1.98222   0.91900  0.35810
time        Tenericutes -0.34364    0.01482 -23.18197  0.00000


Random Effects (SD on log scale)

 Groups    Name        Std.Dev.
 SubjectID (Intercept) 3.195

Significance test not available

#########################################
#########################################
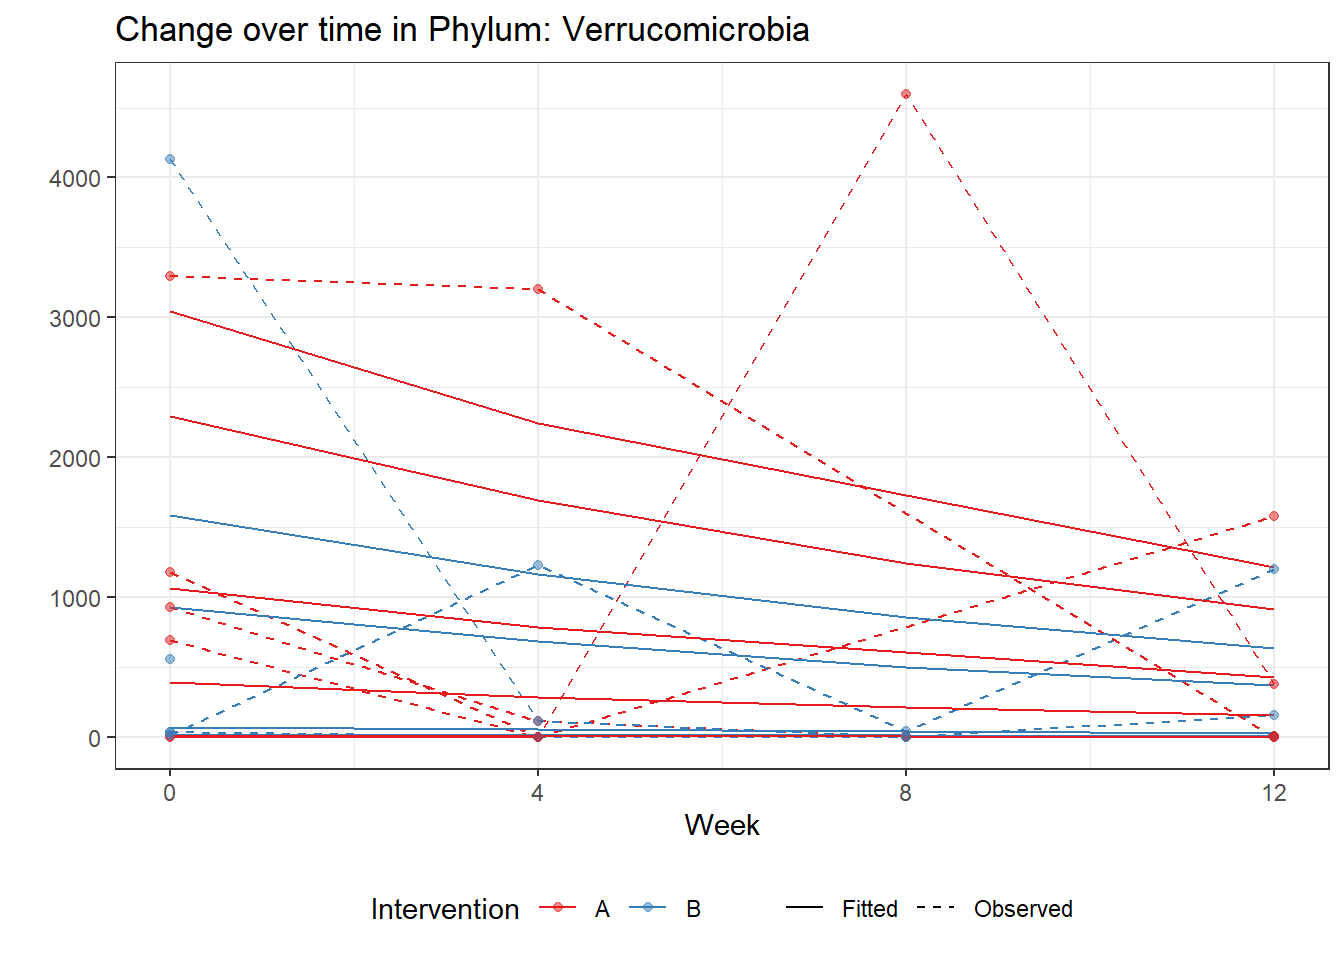
Model:  Verrucomicrobia ~ 1 + intB + time + (1 | SubjectID)
<environment: 0x000000003ca59558>

Link:    poisson


Intraclass Correlation (ICC):   0.8753226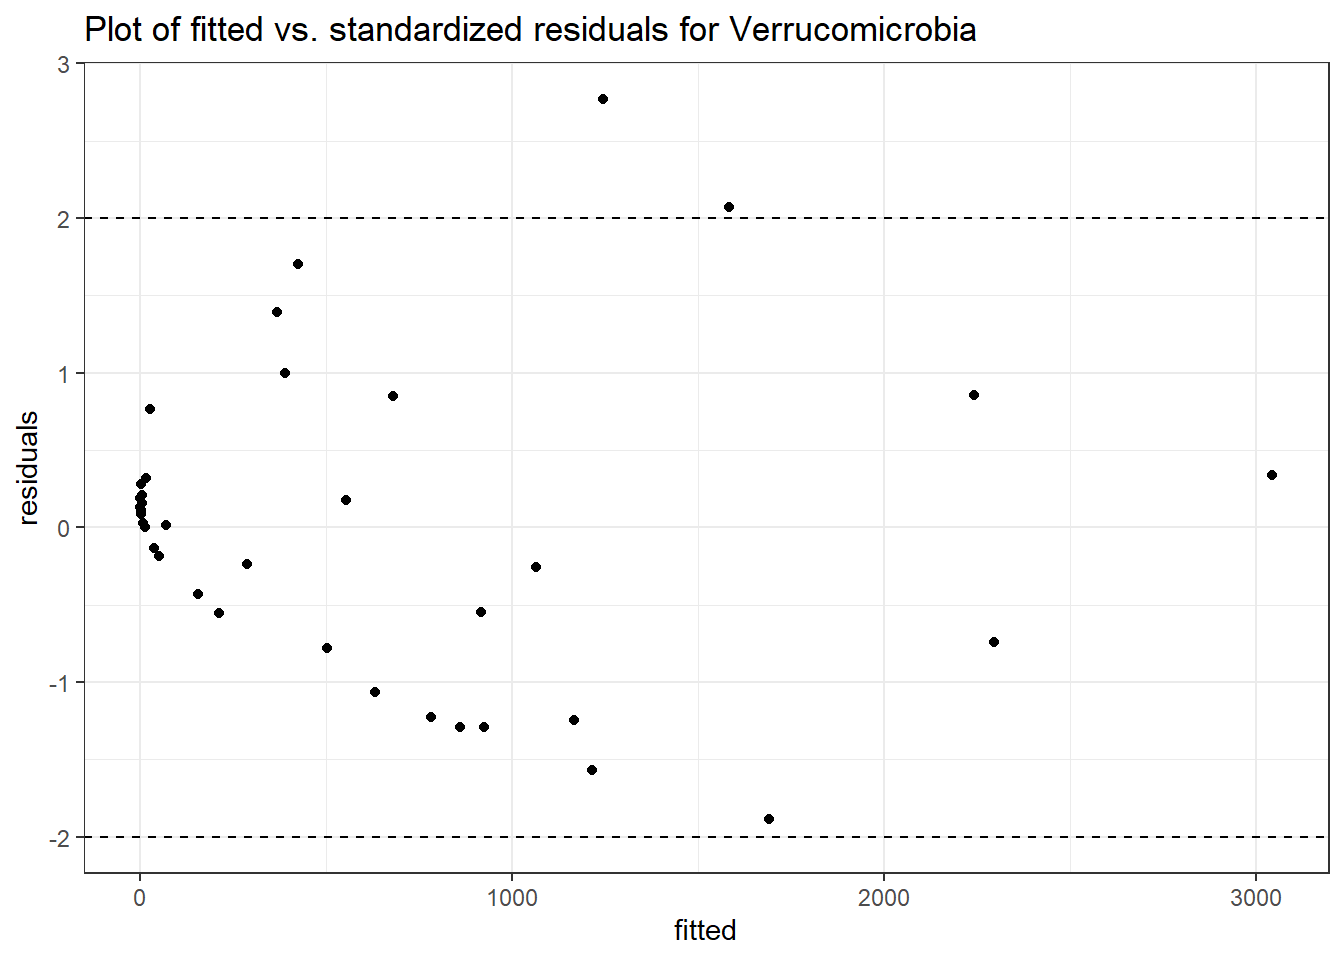
Fixed Effects (change in log)

                    Outcome Estimate Std. Error   z value Pr(>|z|)
(Intercept) Verrucomicrobia  4.97431    1.09055   4.56127  0.00001
intB        Verrucomicrobia  0.54433    1.61144   0.33779  0.73552
time        Verrucomicrobia -0.30578    0.00609 -50.22337  0.00000


Random Effects (SD on log scale)

 Groups    Name        Std.Dev.
 SubjectID (Intercept) 2.6497

Significance test not available
Controlling for the effect of time, the intervention resulted in a significant increase in abundance of Phylums: Euryarchaeota. This is in contrast to the effect of time, which was negatively associated with abundance. So, abundance of Euryarchaeota increased in intervention group B but not in group A.
Other interesting but not significant results. The effect of the intervention was in the opposite direction (positive) compared to the effect of time (negative) is Phylums: Actinobacteria, Firmicutes, Lentisphaerae, and Tenericutes.
Covariate(s): Time by intervention interaction
Here, the model tests whether the effect of the intervention is constant across time or does the effect of the intervention get stronger (or weaker) at time progress. And remember, time is coded 0, 1, 2, 3, so a 1 unit increase in time corresponds to 1 month or 4 weeks of the intervention.
\[\begin{align*} h\left(Y_{ij}\right)&=\beta_{0j} + \beta_{1j}(Week)_{ij} + r_{ij}\\ \beta_{0j}&= \gamma_{00} + \gamma_{01}(Intervention)_{j} + u_{0j}\\ \beta_{1j}&= \gamma_{10} + \gamma_{11}(Intervention)_{j}\\ \end{align*}\]
It could be that the intervention is directly related to time so included a average effect of time through the main effect effect is just adding more parameters and is not informative. If the effect of the intervention is still essentially zero, we will re-estimate the model without the main effect.
phylum.fit5 <- glmm_microbiome(mydata=microbiome_data,model.number=5,
                               taxa.level="Phylum", link="poisson",
                               model="1 + intB + time + intB:time + (1|SubjectID)")
#########################################
#########################################
Model:  Actinobacteria ~ 1 + intB + time + intB:time + (1 | SubjectID)
<environment: 0x00000000071c9878>

Link:    poisson


Intraclass Correlation (ICC):   0.5000466

Fixed Effects (change in log)

                   Outcome Estimate Std. Error   z value Pr(>|z|)
(Intercept) Actinobacteria  3.08368    0.41620   7.40904  0.00000
intB        Actinobacteria  1.45591    0.61285   2.37563  0.01752
time        Actinobacteria  0.09832    0.03672   2.67733  0.00742
intB:time   Actinobacteria -0.56276    0.04688 -12.00542  0.00000


Random Effects (SD on log scale)

 Groups    Name        Std.Dev.
 SubjectID (Intercept) 1.0001

Significance test not available

#########################################
#########################################
Model:  Bacteroidetes ~ 1 + intB + time + intB:time + (1 | SubjectID)
<environment: 0x00000000071c9878>

Link:    poisson


Intraclass Correlation (ICC):   0.09532667

Fixed Effects (change in log)

                  Outcome Estimate Std. Error  z value Pr(>|z|)
(Intercept) Bacteroidetes  8.84429    0.13259 66.70503  0.00000
intB        Bacteroidetes -0.14262    0.19667 -0.72516  0.46835
time        Bacteroidetes -0.02477    0.00249 -9.93904  0.00000
intB:time   Bacteroidetes -0.00150    0.00382 -0.39278  0.69448


Random Effects (SD on log scale)

 Groups    Name        Std.Dev.
 SubjectID (Intercept) 0.32461

Significance test not available

#########################################
#########################################
Model:  Cyanobacteria ~ 1 + intB + time + intB:time + (1 | SubjectID)
<environment: 0x00000000071c9878>

Link:    poisson


Intraclass Correlation (ICC):   0.8022182
Fixed Effects (change in log)

                  Outcome Estimate Std. Error   z value Pr(>|z|)
(Intercept) Cyanobacteria  3.87746    0.83283   4.65578        0
intB        Cyanobacteria -6.58632    1.32883  -4.95647        0
time        Cyanobacteria -0.98832    0.03438 -28.74885        0
intB:time   Cyanobacteria  2.64708    0.13435  19.70301        0


Random Effects (SD on log scale)

 Groups    Name        Std.Dev.
 SubjectID (Intercept) 2.014

Significance test not available

#########################################
#########################################
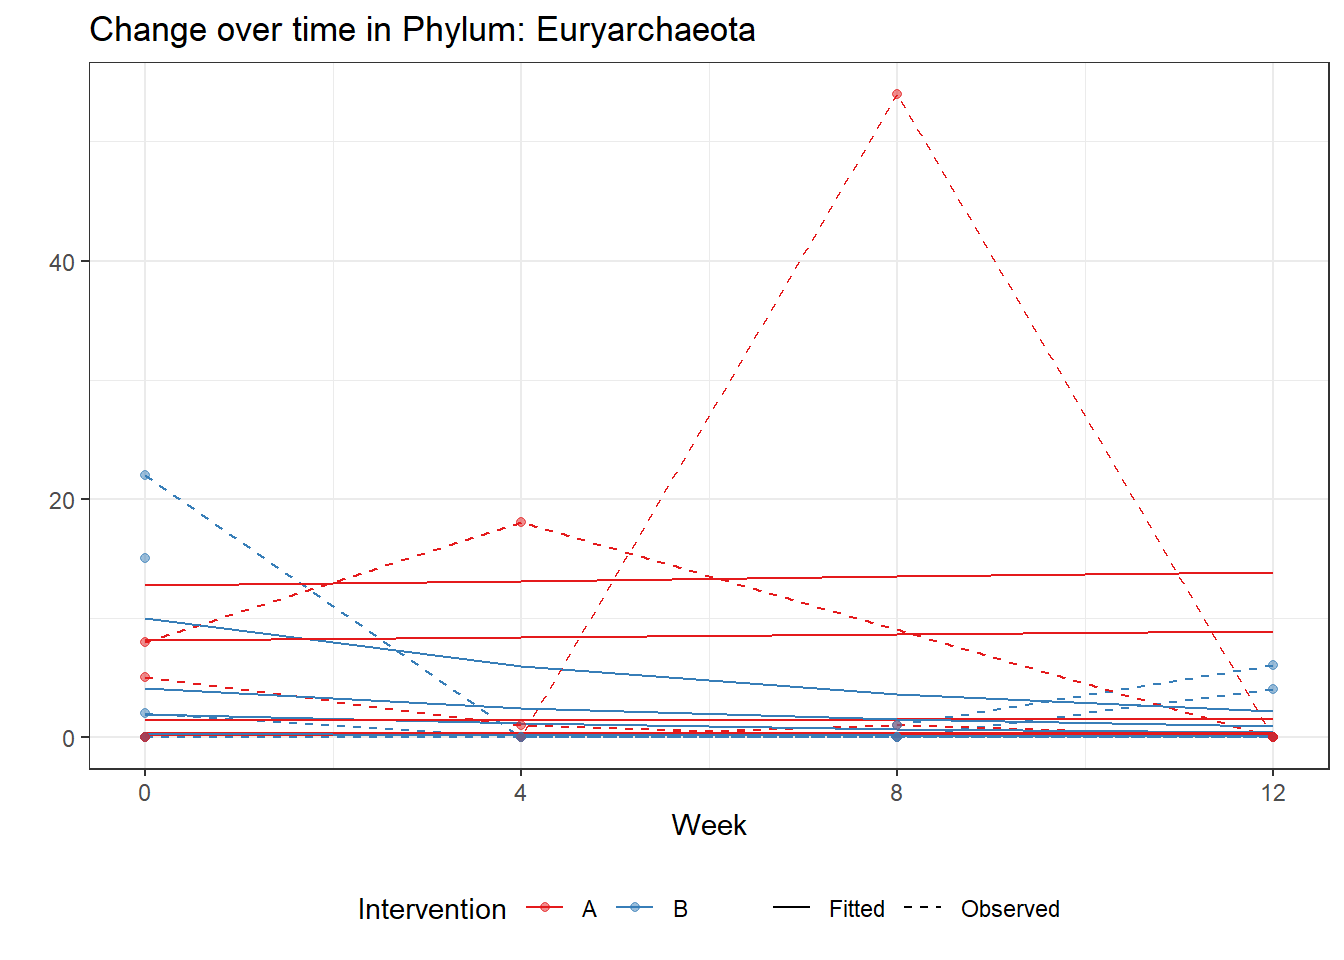
Model:  Euryarchaeota ~ 1 + intB + time + intB:time + (1 | SubjectID)
<environment: 0x00000000071c9878>

Link:    poisson
Warning in checkConv(attr(opt, "derivs"), opt$par, ctrl = control$checkConv, :
Model failed to converge with max|grad| = 0.0409519 (tol = 0.002, component 1)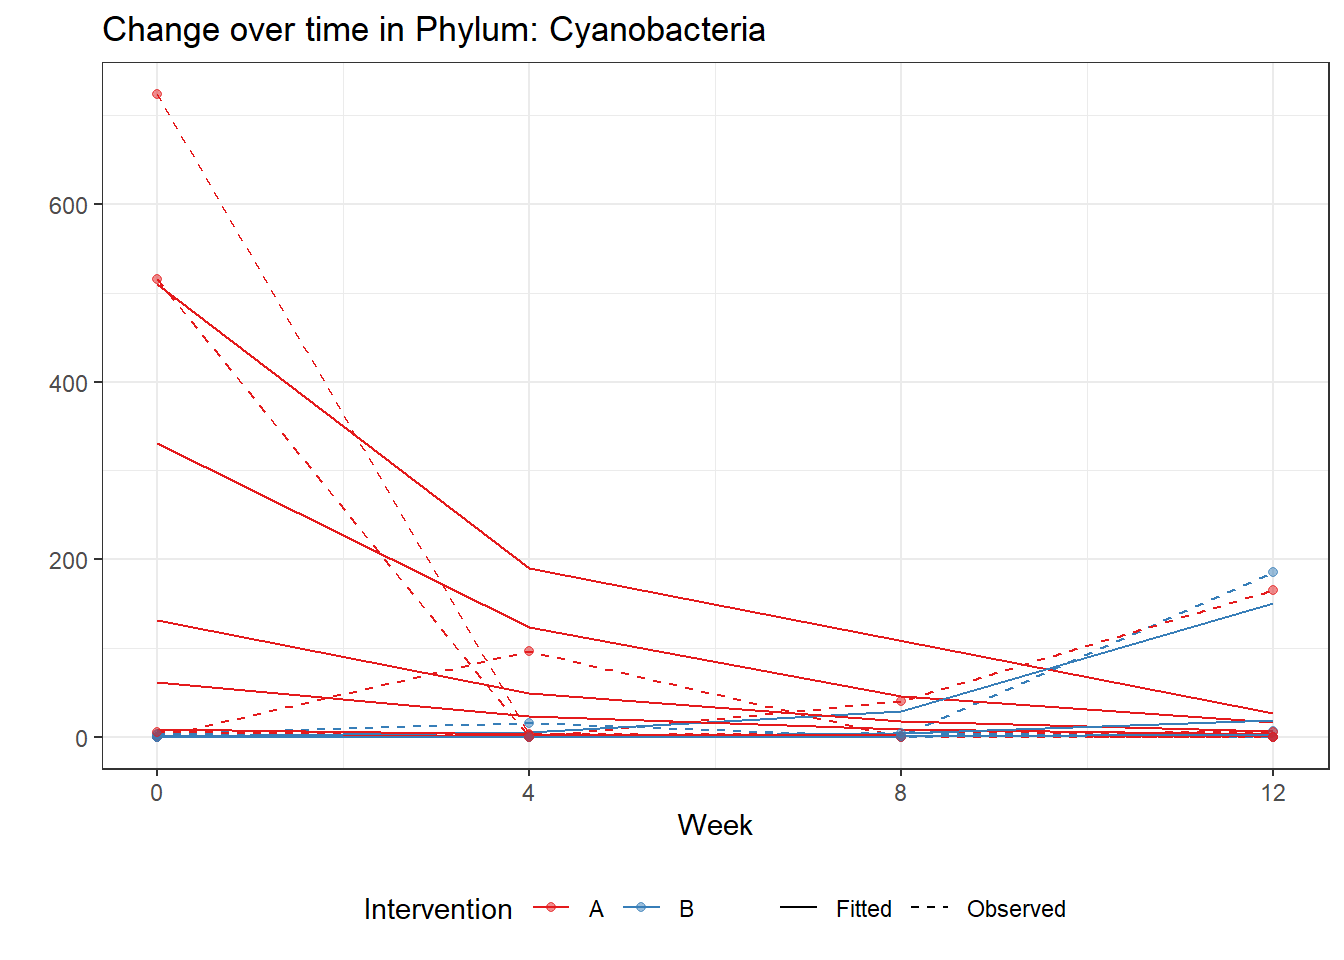
Intraclass Correlation (ICC): 0.7741486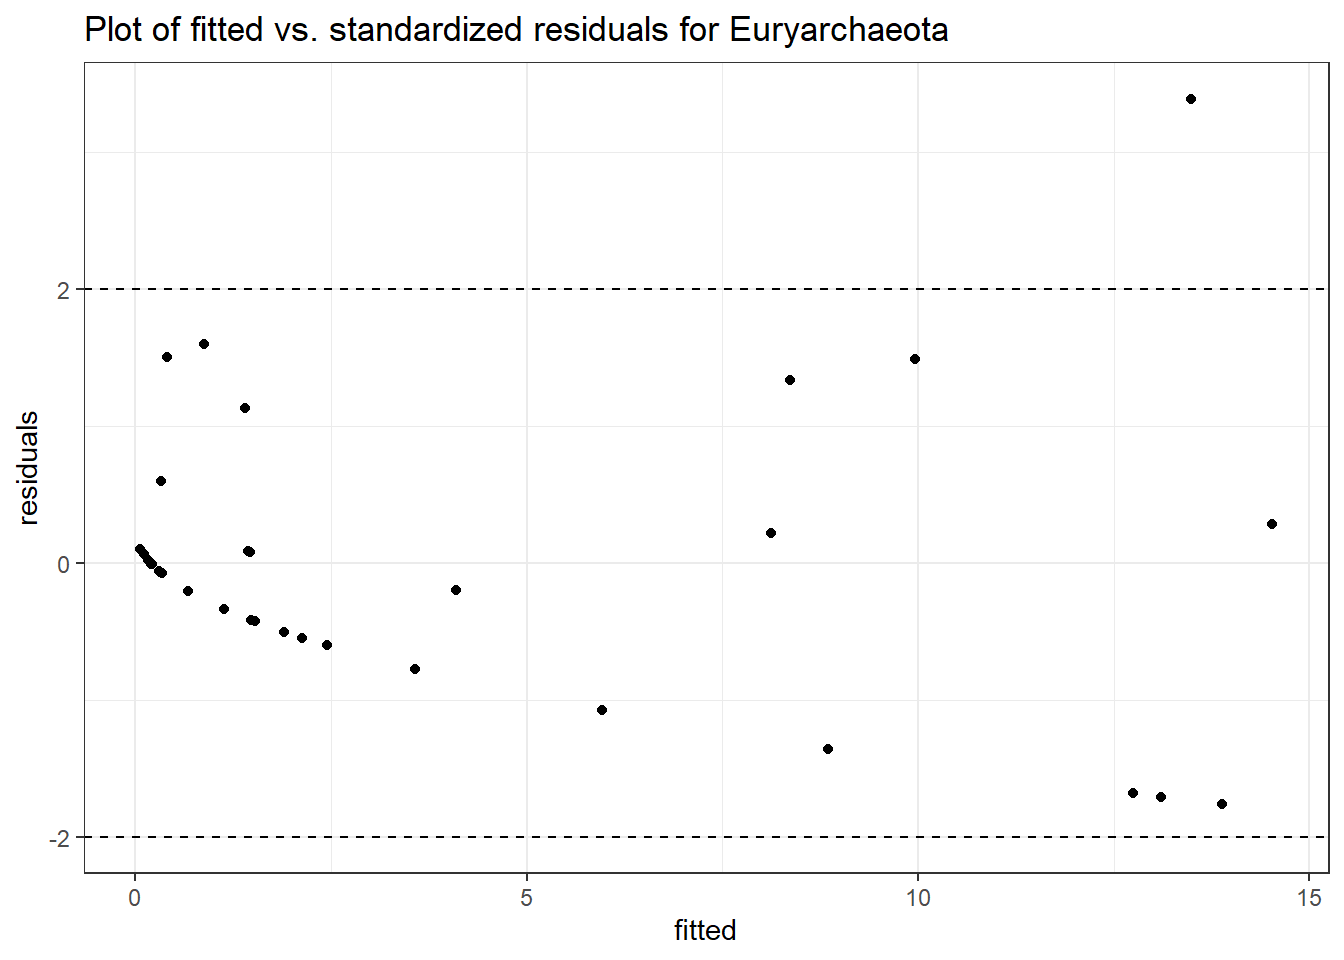
Fixed Effects (change in log)

                  Outcome Estimate Std. Error    z value Pr(>|z|)
(Intercept) Euryarchaeota -0.14217    0.00173  -82.31957        0
intB        Euryarchaeota  1.18925    0.00173  688.79114        0
time        Euryarchaeota  0.02855    0.00173   16.53565        0
intB:time   Euryarchaeota -0.54150    0.00173 -313.64265        0


Random Effects (SD on log scale)

 Groups    Name        Std.Dev.
 SubjectID (Intercept) 1.8514

Significance test not available

#########################################
#########################################
Model:  Firmicutes ~ 1 + intB + time + intB:time + (1 | SubjectID)
<environment: 0x00000000071c9878>

Link:    poisson


Intraclass Correlation (ICC):   0.08185485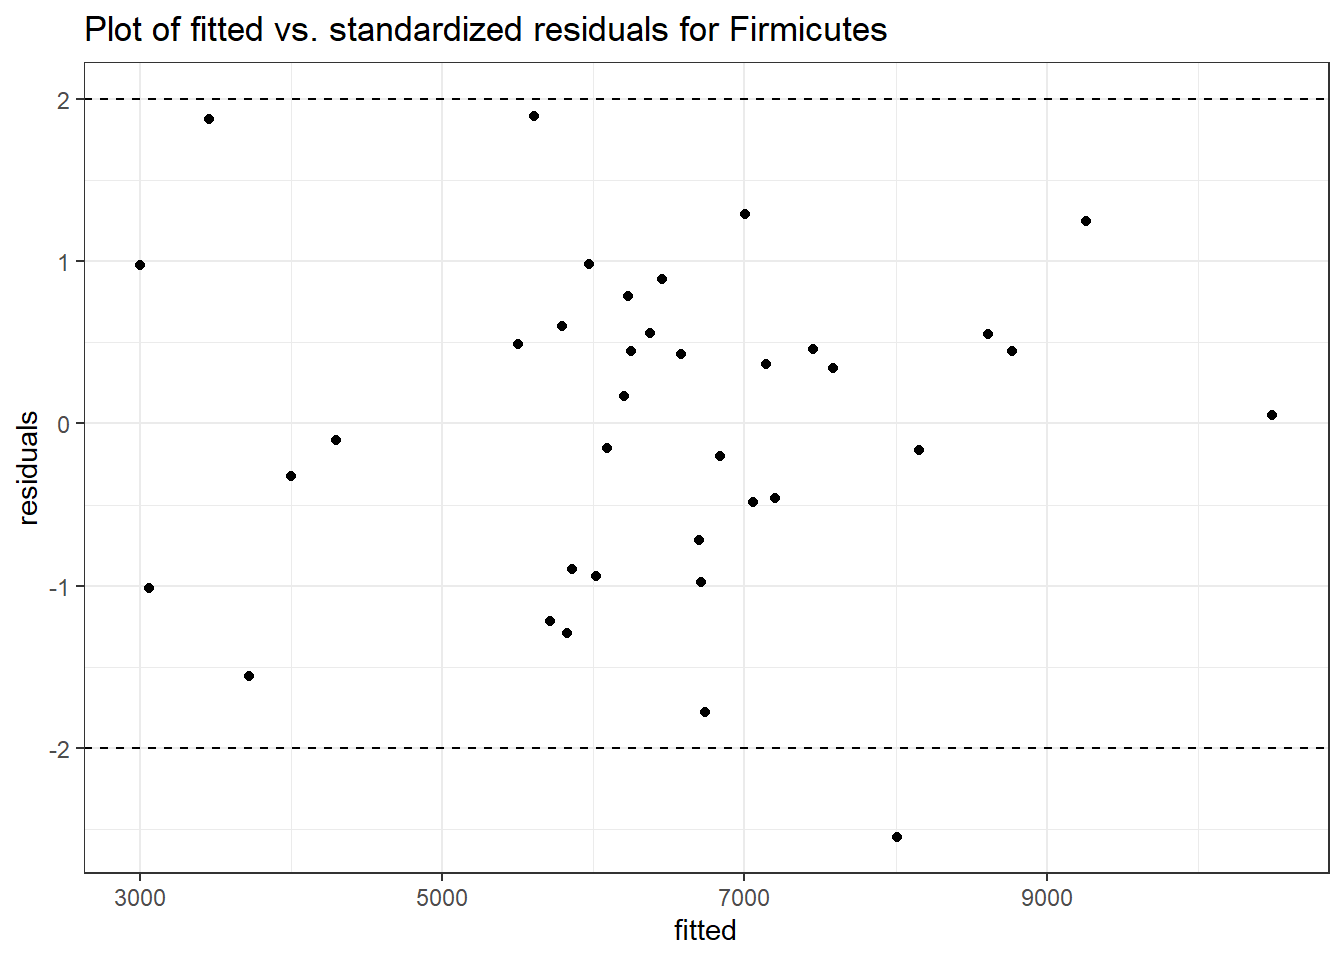
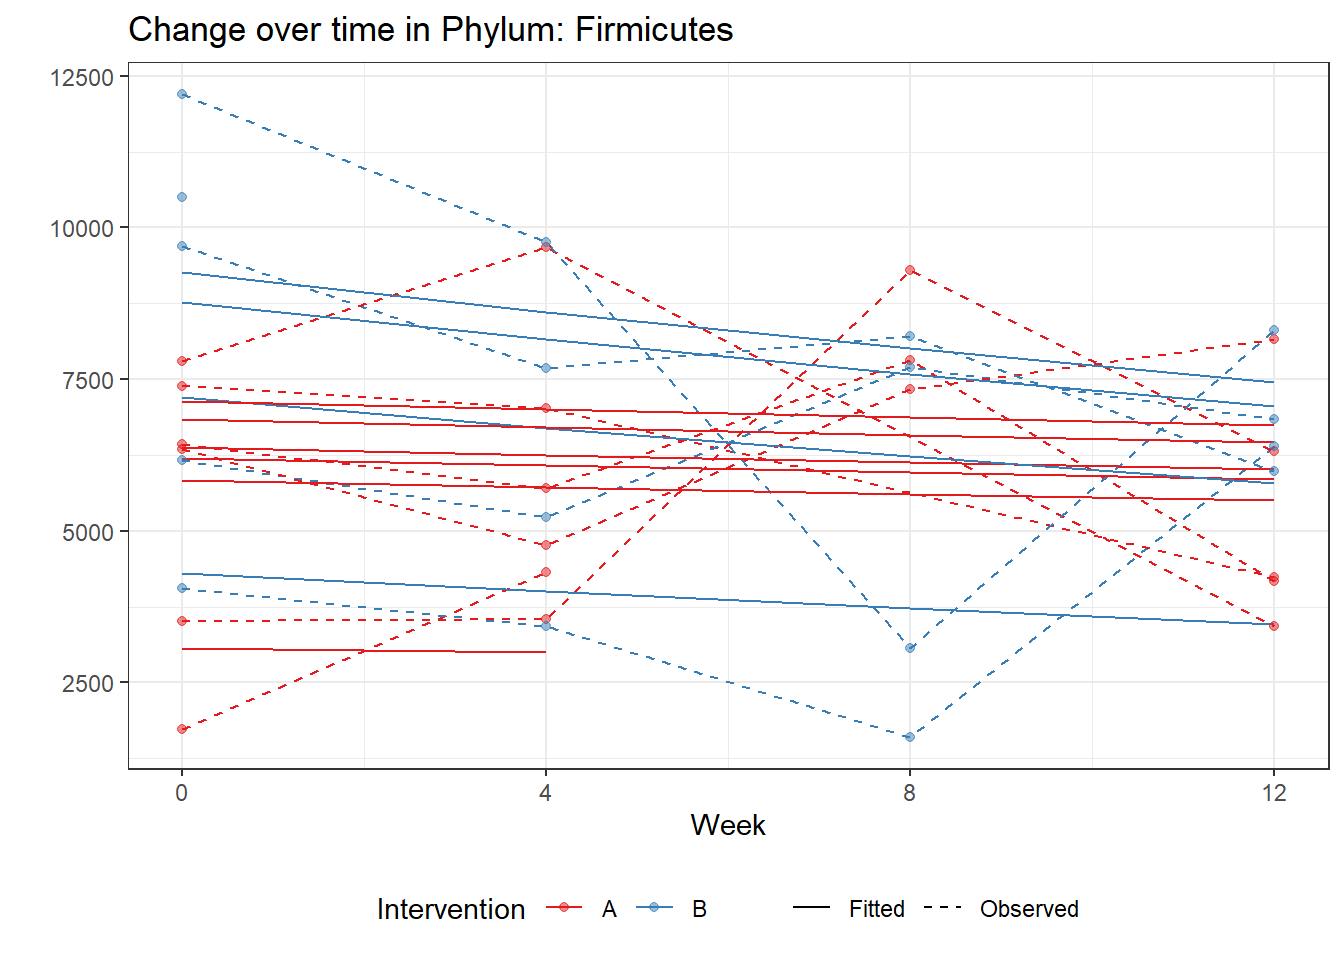
Fixed Effects (change in log)

               Outcome Estimate Std. Error   z value Pr(>|z|)
(Intercept) Firmicutes  8.64916    0.12198  70.90592  0.00000
intB        Firmicutes  0.29471    0.18091   1.62903  0.10331
time        Firmicutes -0.01928    0.00255  -7.56656  0.00000
intB:time   Firmicutes -0.05319    0.00375 -14.19120  0.00000


Random Effects (SD on log scale)

 Groups    Name        Std.Dev.
 SubjectID (Intercept) 0.29858

Significance test not available

#########################################
#########################################
Model:  Fusobacteria ~ 1 + intB + time + intB:time + (1 | SubjectID)
<environment: 0x00000000071c9878>

Link:    poisson


Intraclass Correlation (ICC):   0.8177454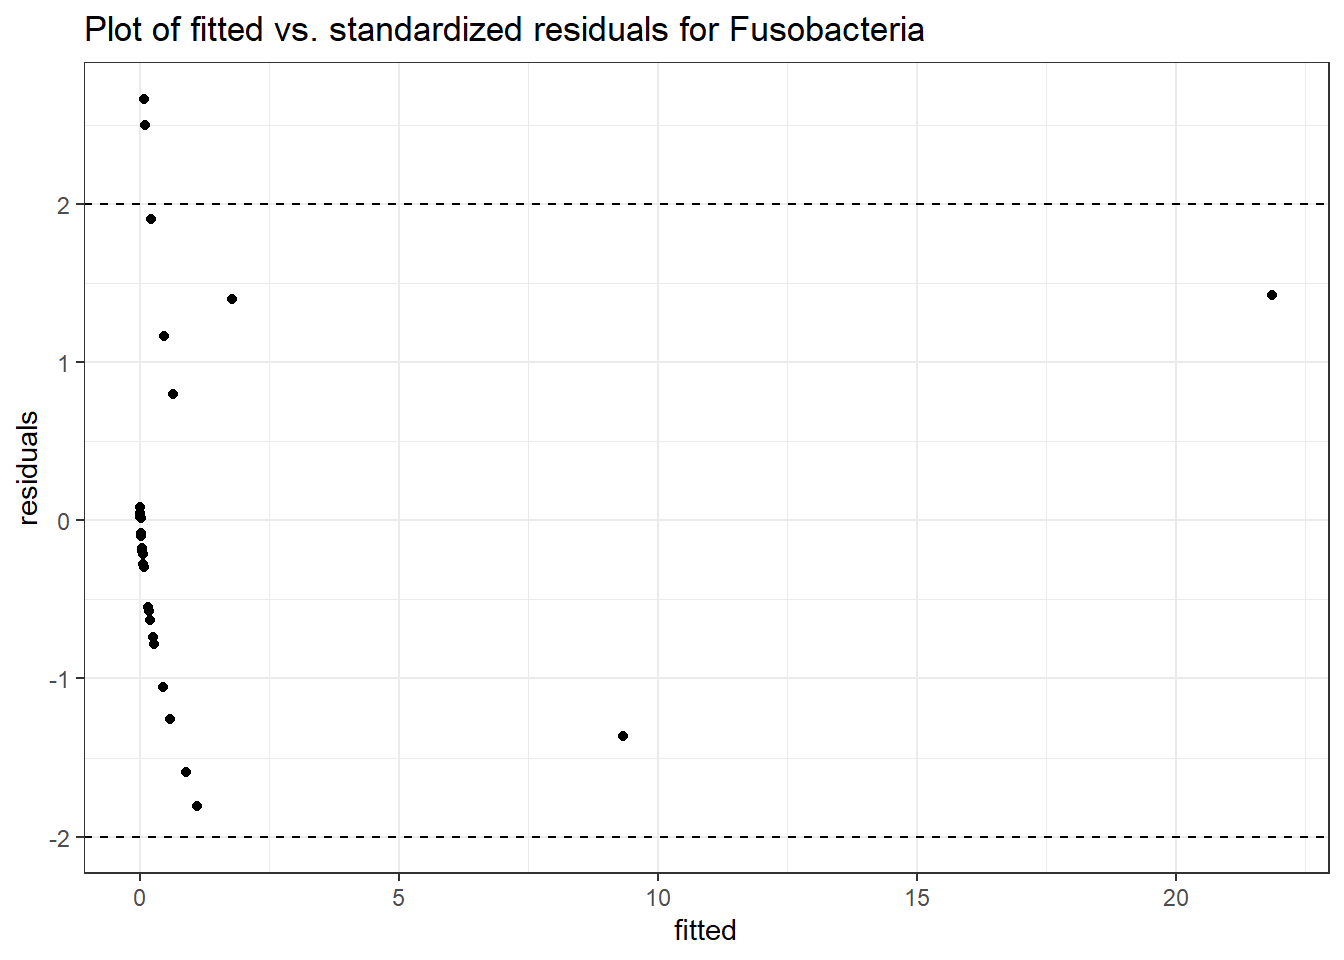
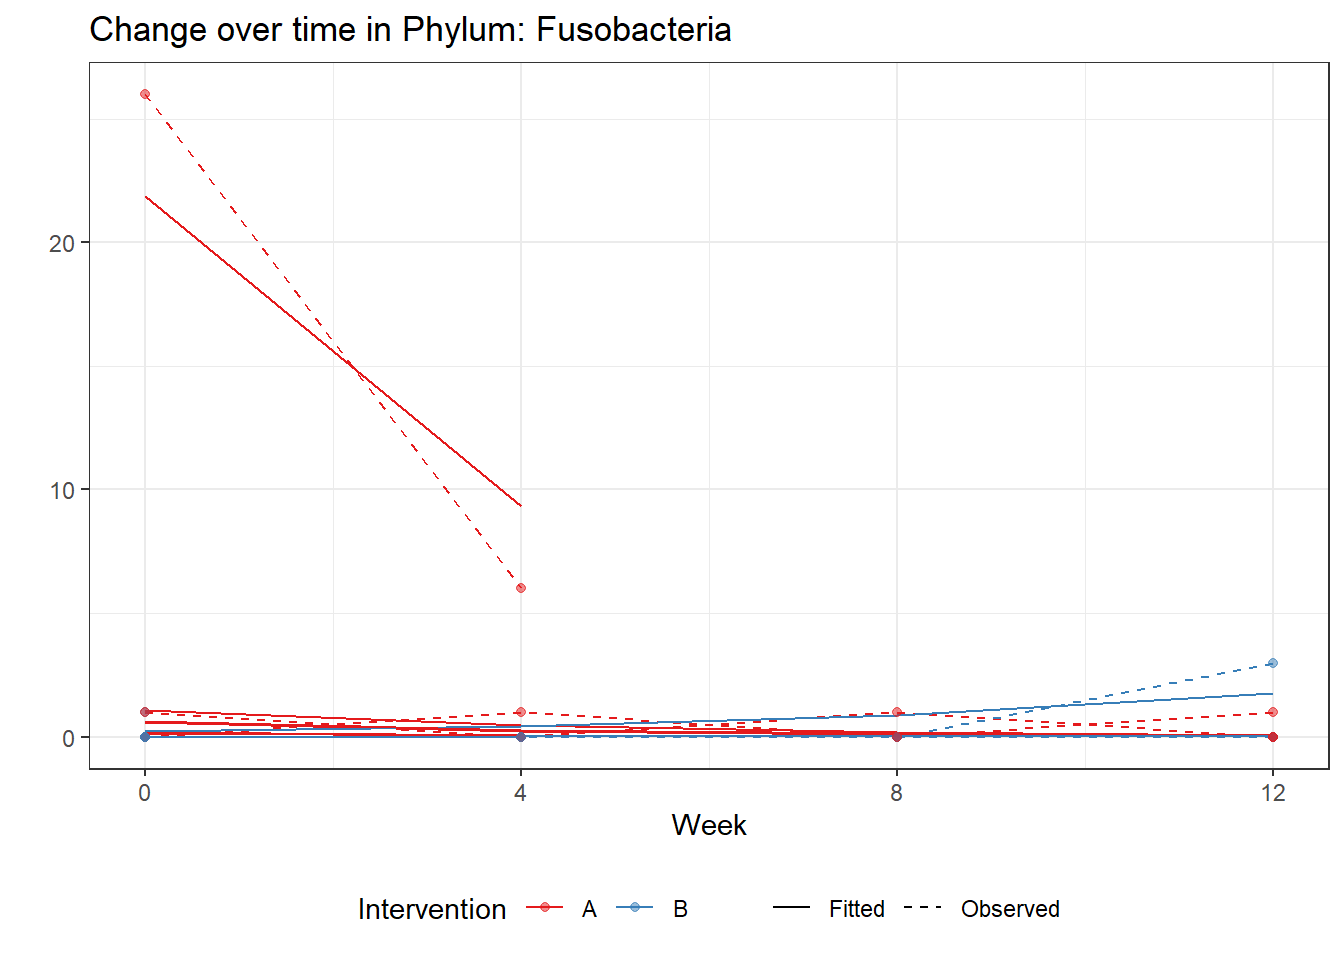
Fixed Effects (change in log)

                 Outcome Estimate Std. Error  z value Pr(>|z|)
(Intercept) Fusobacteria -0.55743    1.09231 -0.51033  0.60982
intB        Fusobacteria -4.00449    2.10974 -1.89810  0.05768
time        Fusobacteria -0.85229    0.31941 -2.66830  0.00762
intB:time   Fusobacteria  1.54615    0.61913  2.49729  0.01251


Random Effects (SD on log scale)

 Groups    Name        Std.Dev.
 SubjectID (Intercept) 2.1182

Significance test not available

#########################################
#########################################
Model:  Lentisphaerae ~ 1 + intB + time + intB:time + (1 | SubjectID)
<environment: 0x00000000071c9878>

Link:    poisson


Intraclass Correlation (ICC):   0.6737277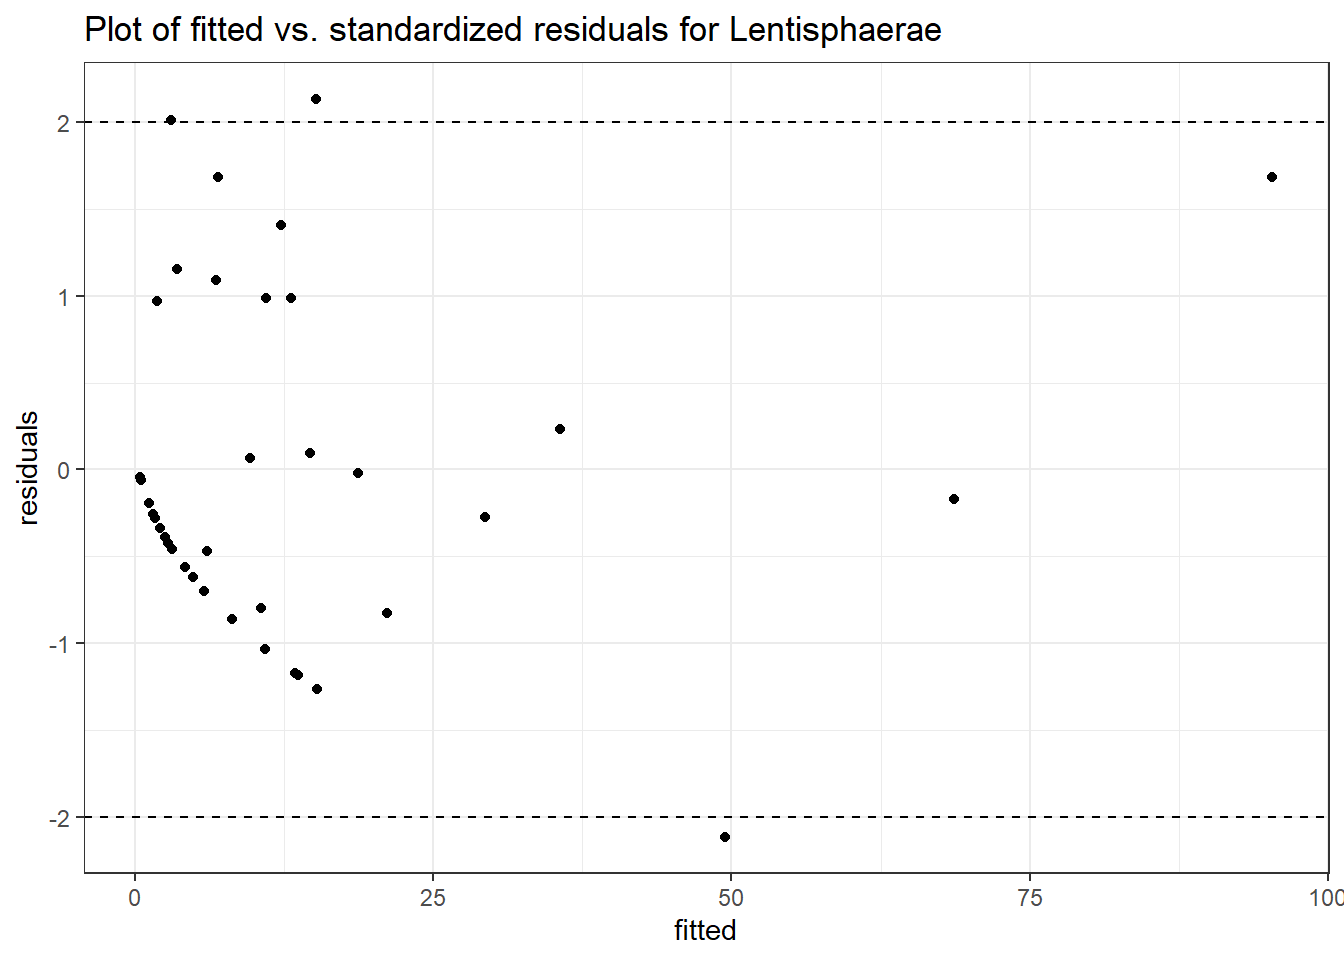
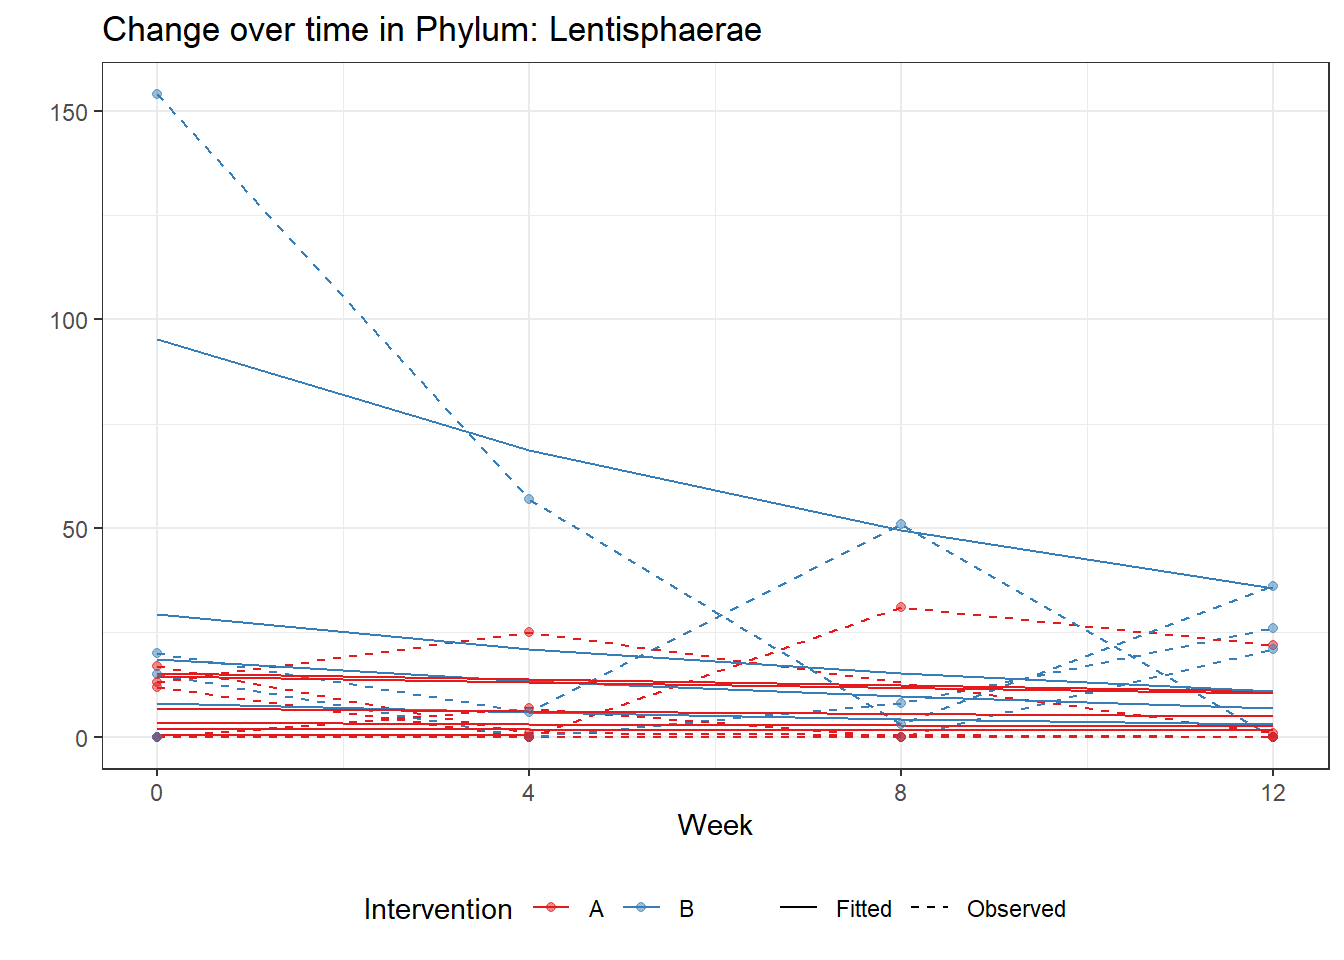
Fixed Effects (change in log)

                  Outcome Estimate Std. Error  z value Pr(>|z|)
(Intercept) Lentisphaerae  1.38710    0.62140  2.23221  0.02560
intB        Lentisphaerae  1.18566    0.90736  1.30672  0.19131
time        Lentisphaerae -0.10926    0.07580 -1.44144  0.14946
intB:time   Lentisphaerae -0.21895    0.08911 -2.45711  0.01401


Random Effects (SD on log scale)

 Groups    Name        Std.Dev.
 SubjectID (Intercept) 1.437

Significance test not available

#########################################
#########################################
Model:  Proteobacteria ~ 1 + intB + time + intB:time + (1 | SubjectID)
<environment: 0x00000000071c9878>

Link:    poisson


Intraclass Correlation (ICC):   0.09168786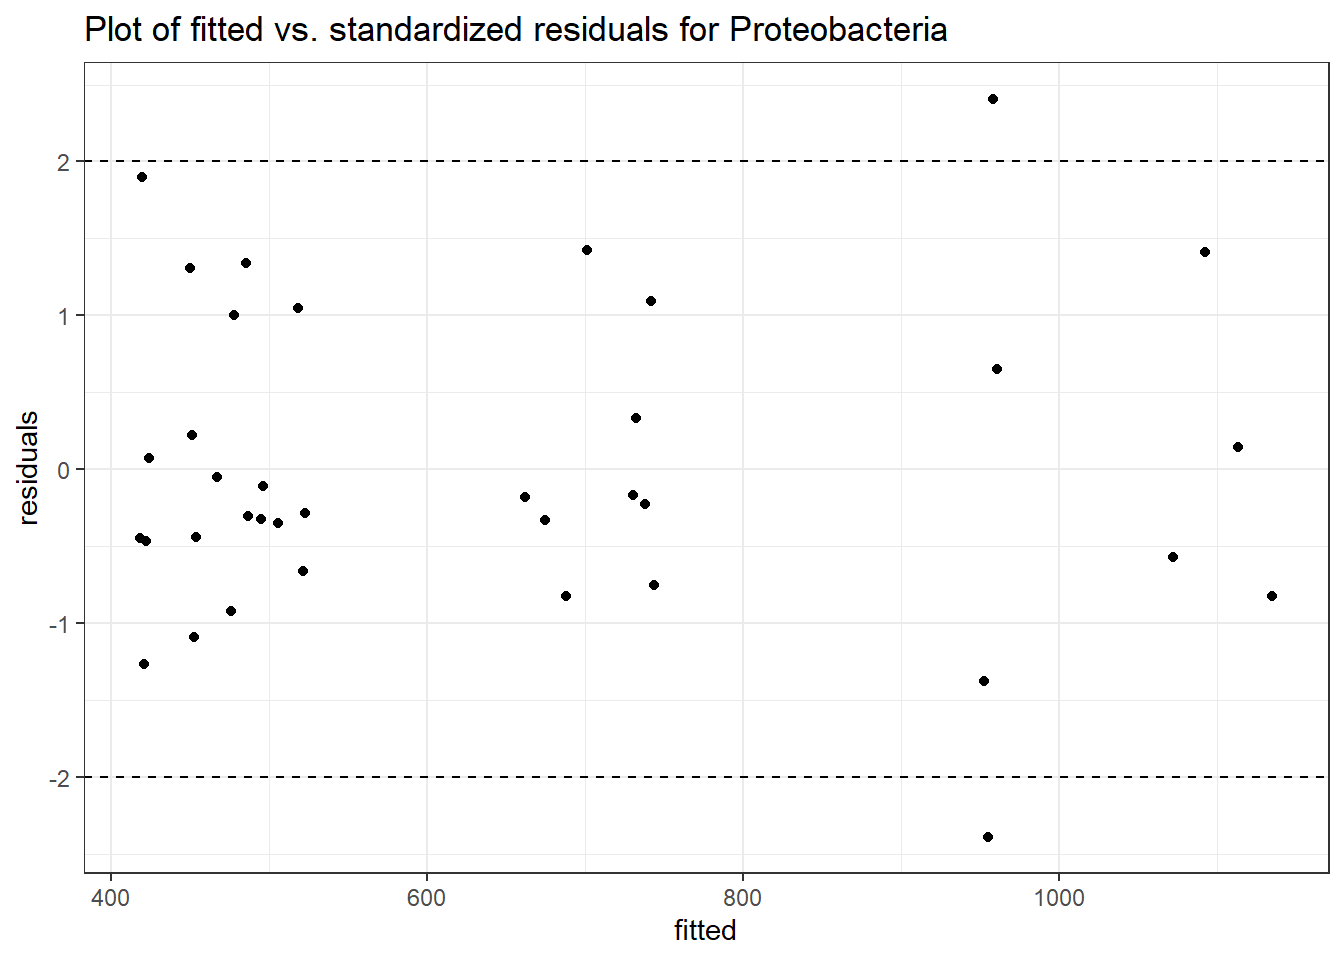
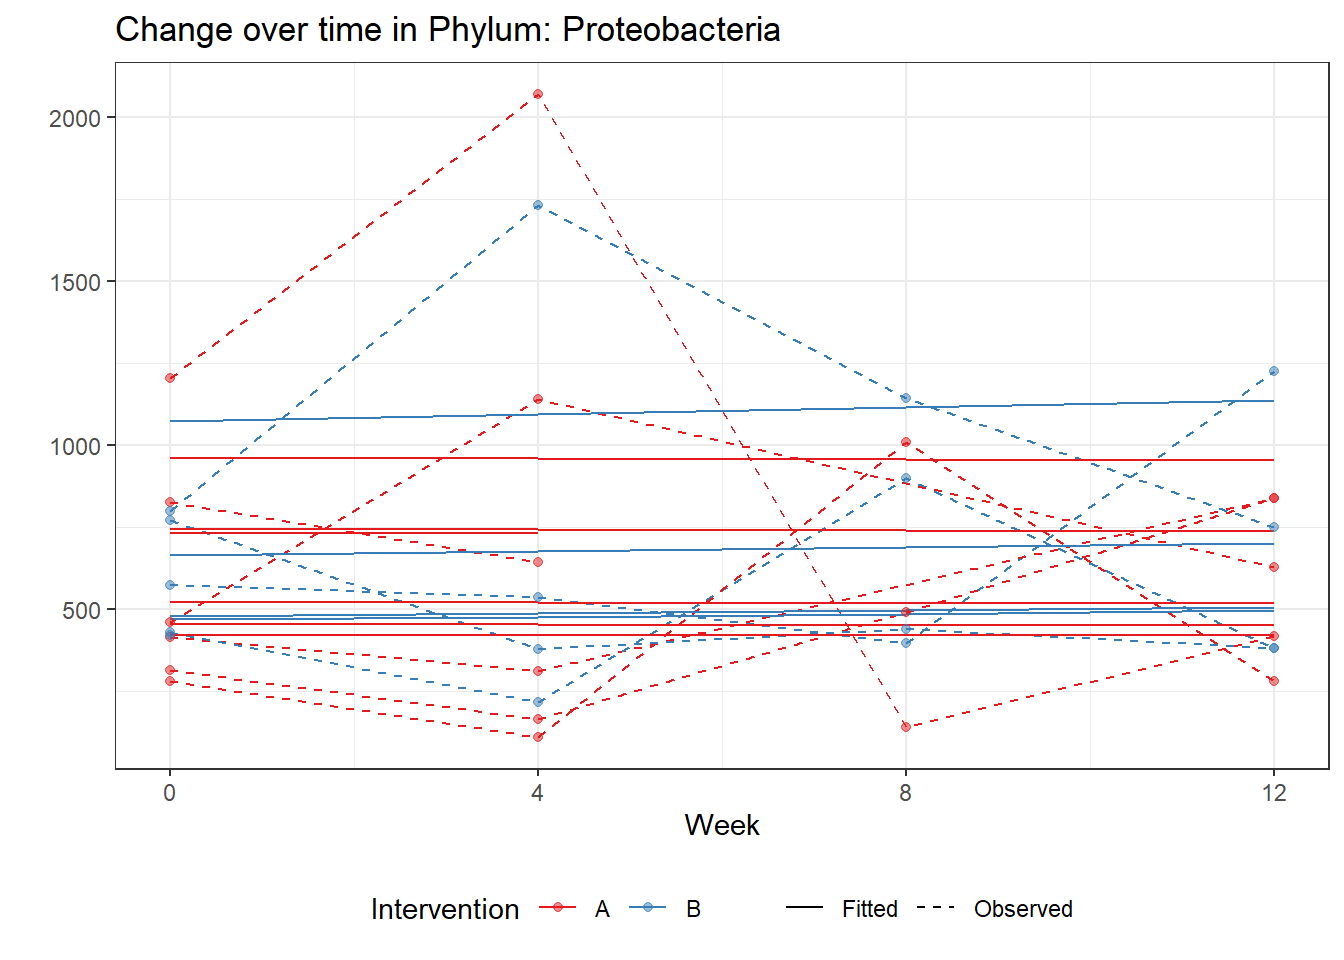
Fixed Effects (change in log)

                   Outcome Estimate Std. Error  z value Pr(>|z|)
(Intercept) Proteobacteria  6.41625    0.13045 49.18486  0.00000
intB        Proteobacteria -0.04862    0.19358 -0.25118  0.80168
time        Proteobacteria -0.00273    0.00806 -0.33866  0.73486
intB:time   Proteobacteria  0.02175    0.01172  1.85541  0.06354


Random Effects (SD on log scale)

 Groups    Name        Std.Dev.
 SubjectID (Intercept) 0.31772

Significance test not available

#########################################
#########################################
Model:  Tenericutes ~ 1 + intB + time + intB:time + (1 | SubjectID)
<environment: 0x00000000071c9878>

Link:    poisson


Intraclass Correlation (ICC):   0.9108551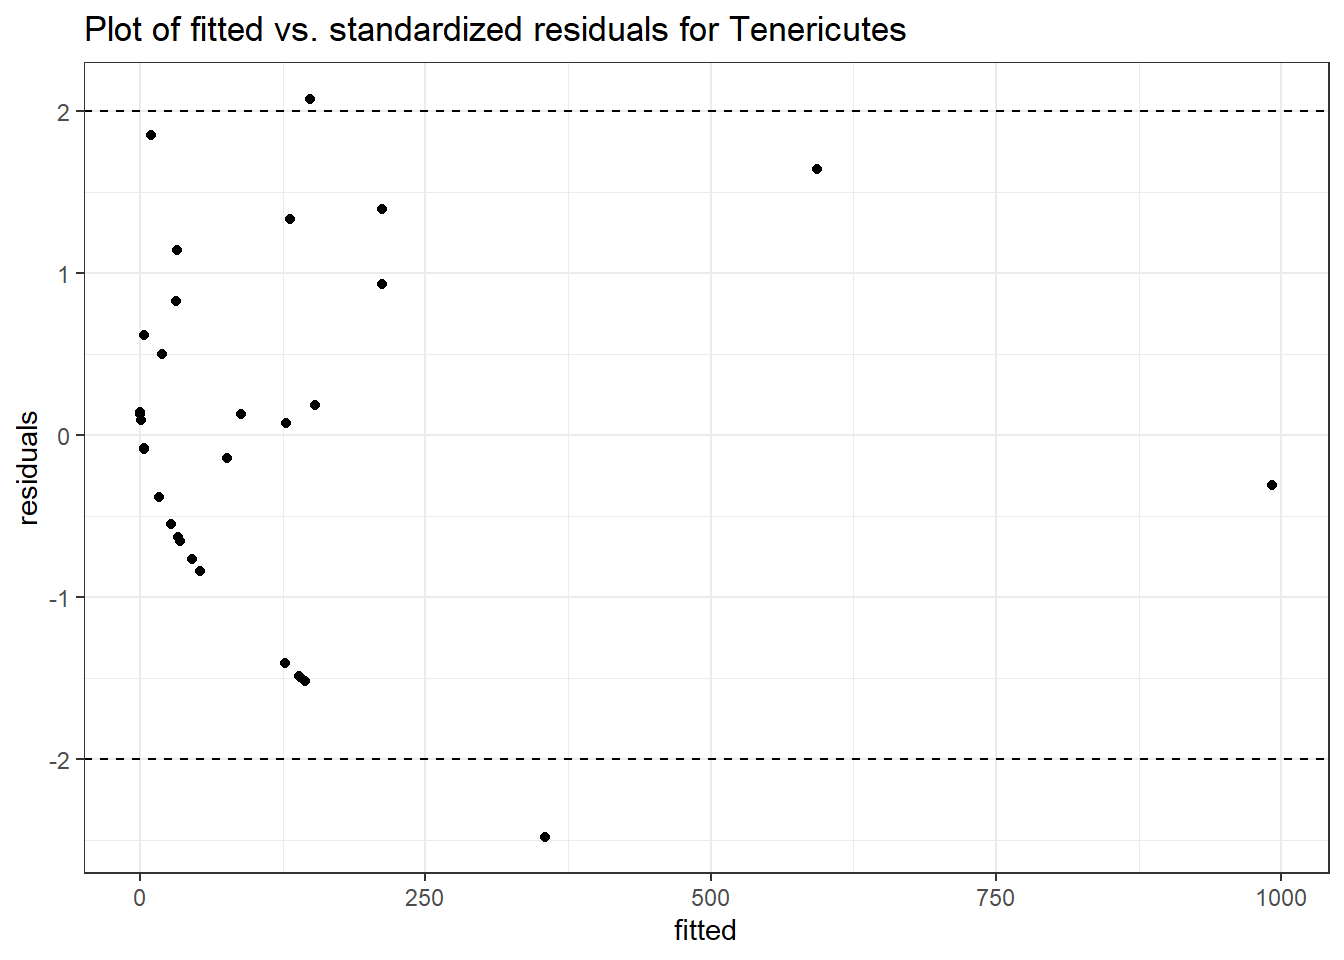
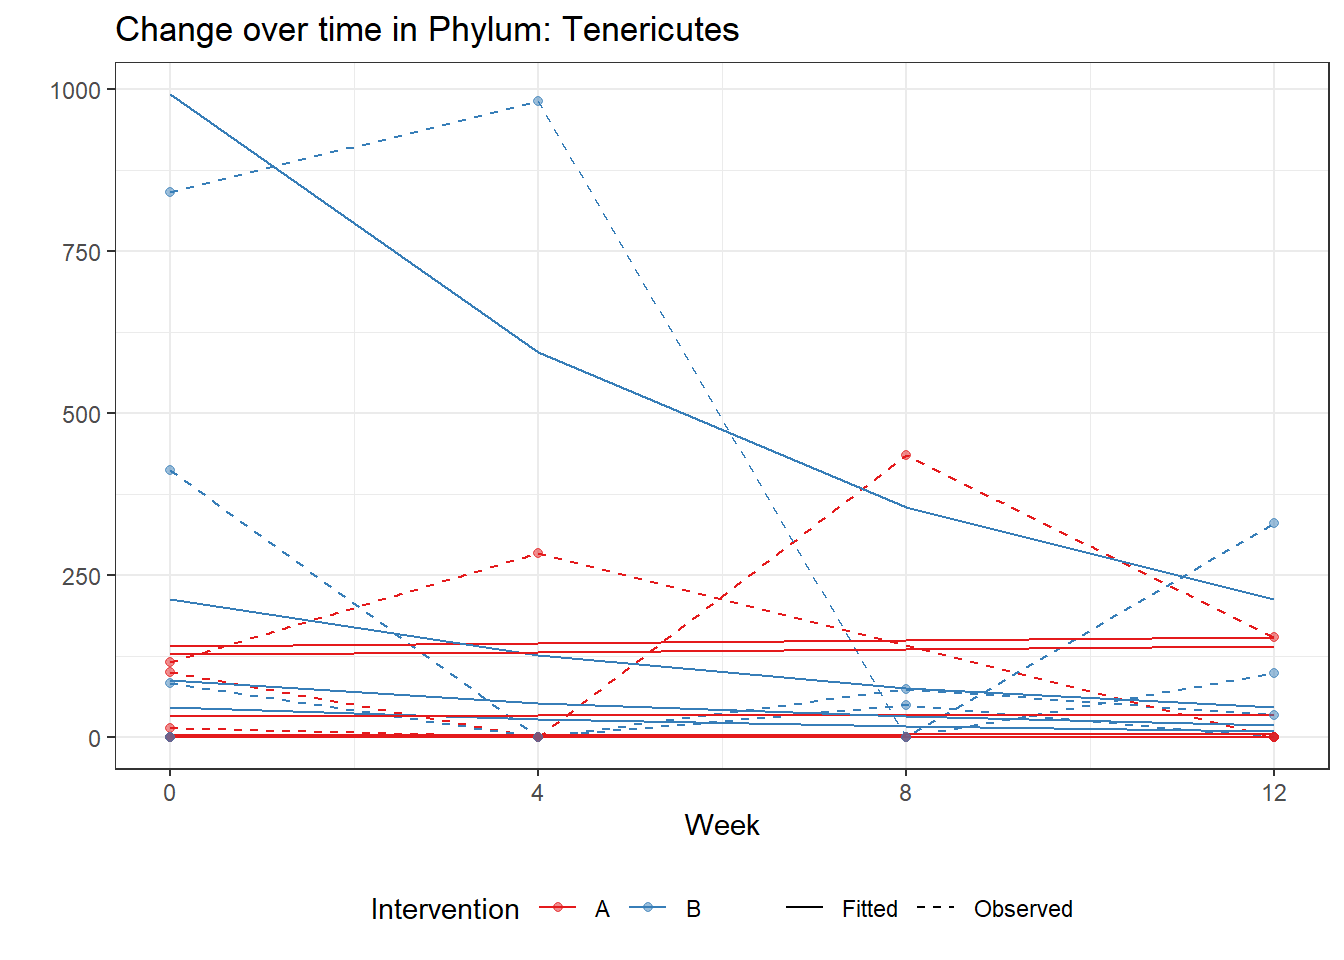
Fixed Effects (change in log)

                Outcome Estimate Std. Error   z value Pr(>|z|)
(Intercept) Tenericutes  1.41504    1.35995   1.04051  0.29810
intB        Tenericutes  2.38553    1.98298   1.20300  0.22898
time        Tenericutes  0.02999    0.02547   1.17734  0.23906
intB:time   Tenericutes -0.54430    0.03146 -17.29975  0.00000


Random Effects (SD on log scale)

 Groups    Name        Std.Dev.
 SubjectID (Intercept) 3.1965

Significance test not available

#########################################
#########################################
Model:  Verrucomicrobia ~ 1 + intB + time + intB:time + (1 | SubjectID)
<environment: 0x00000000071c9878>

Link:    poisson


Intraclass Correlation (ICC):   0.8737435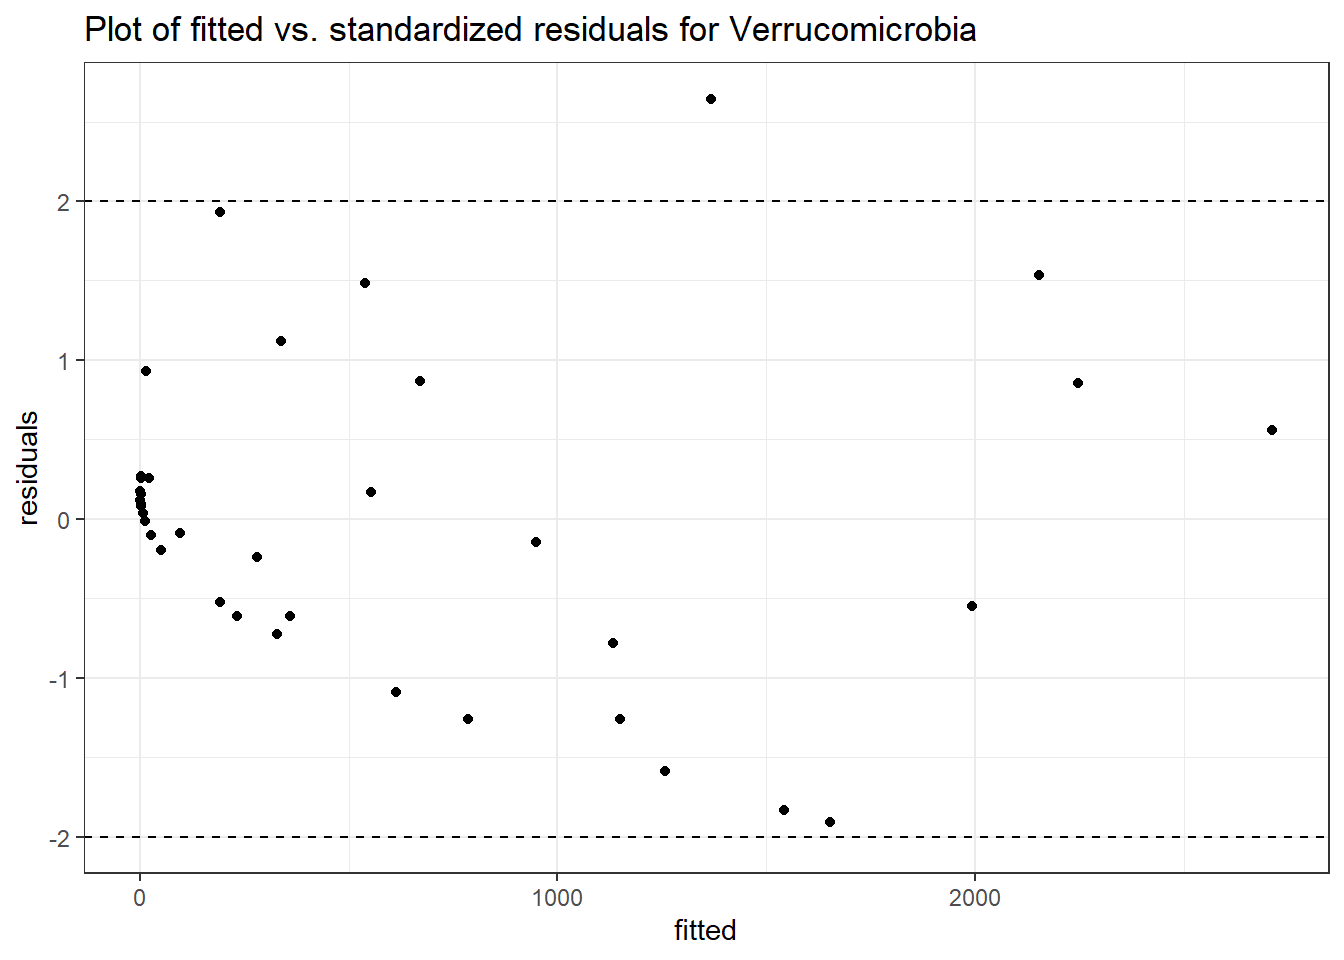
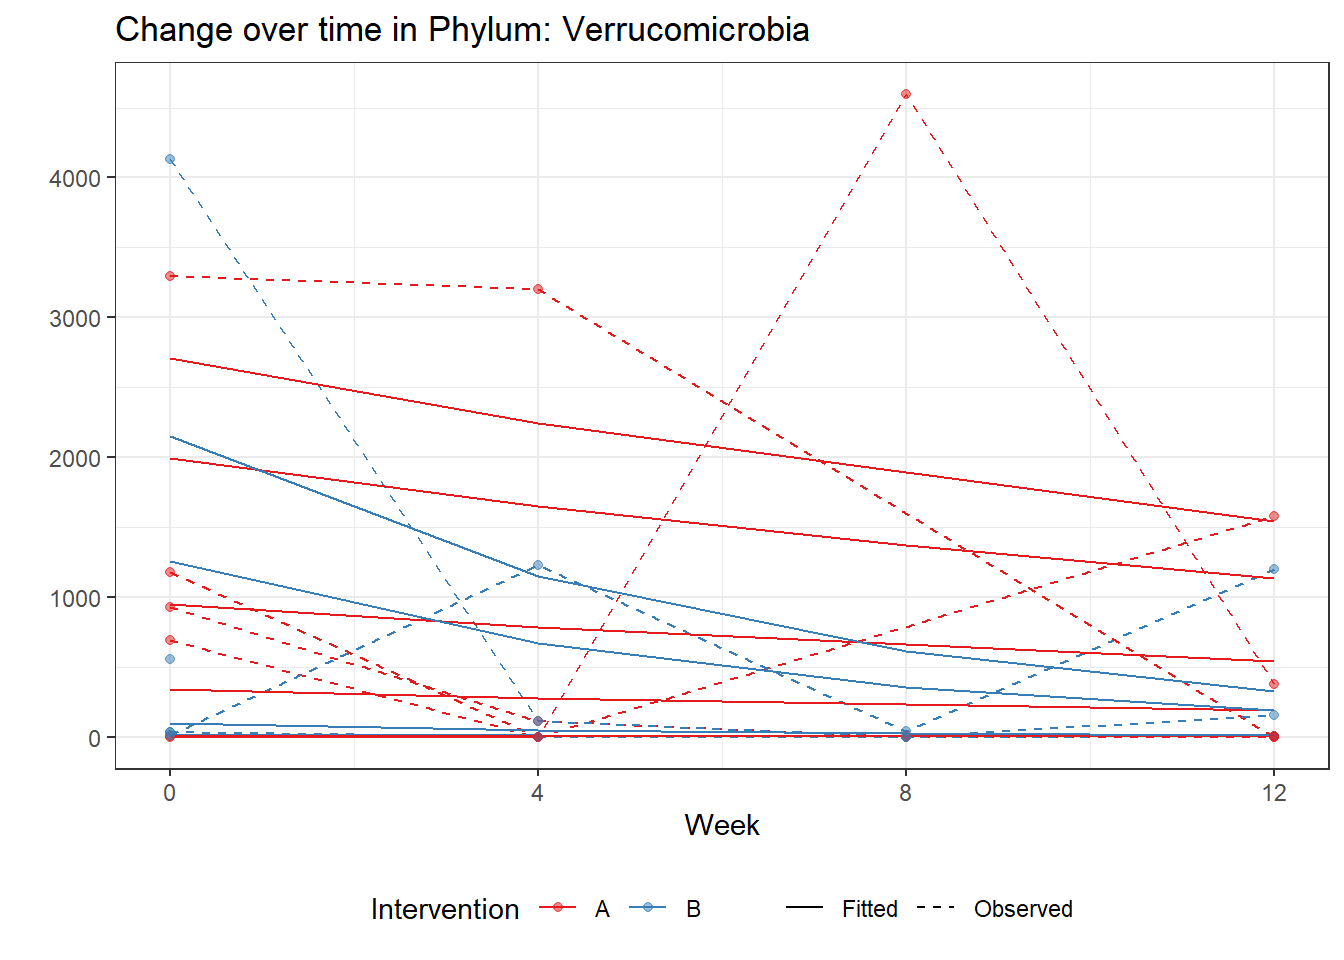
Fixed Effects (change in log)

                    Outcome Estimate Std. Error   z value Pr(>|z|)
(Intercept) Verrucomicrobia  4.85709    1.08191   4.48938  0.00001
intB        Verrucomicrobia  0.90672    1.59709   0.56773  0.57022
time        Verrucomicrobia -0.18803    0.00695 -27.05413  0.00000
intB:time   Verrucomicrobia -0.43929    0.01431 -30.69182  0.00000


Random Effects (SD on log scale)

 Groups    Name        Std.Dev.
 SubjectID (Intercept) 2.6307

Significance test not available
Covariate(s): Time by intervention interaction (only)
Only the interaction term.
\[\begin{align*} h\left(Y_{ij}\right)&=\beta_{0j} + \beta_{1j}(Week)_{ij}+ r_{ij}\\ \beta_{0j}&= \gamma_{00} + u_{0j}\\ \beta_{1j}&= \gamma_{10} + \gamma_{11}(Intervention)_{j}\\ \end{align*}\]
phylum.fit6 <- glmm_microbiome(mydata=microbiome_data,model.number=6,
                               taxa.level="Phylum", link="poisson",
                               model="1 + time + intB:time + (1|SubjectID)")
#########################################
#########################################
Model:  Actinobacteria ~ 1 + time + intB:time + (1 | SubjectID)
<environment: 0x0000000038c463e8>

Link:    poisson


Intraclass Correlation (ICC):   0.606858

Fixed Effects (change in log)

                   Outcome Estimate Std. Error   z value Pr(>|z|)
(Intercept) Actinobacteria  3.74307    0.37795   9.90364  0.00000
time        Actinobacteria  0.09388    0.03665   2.56140  0.01043
time:intB   Actinobacteria -0.55653    0.04681 -11.88910  0.00000


Random Effects (SD on log scale)

 Groups    Name        Std.Dev.
 SubjectID (Intercept) 1.2424

Significance test not available

#########################################
#########################################
Model:  Bacteroidetes ~ 1 + time + intB:time + (1 | SubjectID)
<environment: 0x0000000038c463e8>

Link:    poisson


Intraclass Correlation (ICC):   0.09943526

Fixed Effects (change in log)

                  Outcome Estimate Std. Error  z value Pr(>|z|)
(Intercept) Bacteroidetes  8.77946    0.10024 87.58375  0.00000
time        Bacteroidetes -0.02474    0.00249 -9.92886  0.00000
time:intB   Bacteroidetes -0.00156    0.00382 -0.40921  0.68238


Random Effects (SD on log scale)

 Groups    Name        Std.Dev.
 SubjectID (Intercept) 0.33229

Significance test not available

#########################################
#########################################
Model:  Cyanobacteria ~ 1 + time + intB:time + (1 | SubjectID)
<environment: 0x0000000038c463e8>

Link:    poisson


Intraclass Correlation (ICC):   0.9355782

Fixed Effects (change in log)

                  Outcome Estimate Std. Error   z value Pr(>|z|)
(Intercept) Cyanobacteria  0.86458    1.17438   0.73620  0.46161
time        Cyanobacteria -0.98789    0.03438 -28.73852  0.00000
time:intB   Cyanobacteria  2.59883    0.13098  19.84202  0.00000


Random Effects (SD on log scale)

 Groups    Name        Std.Dev.
 SubjectID (Intercept) 3.8109

Significance test not available

#########################################
#########################################
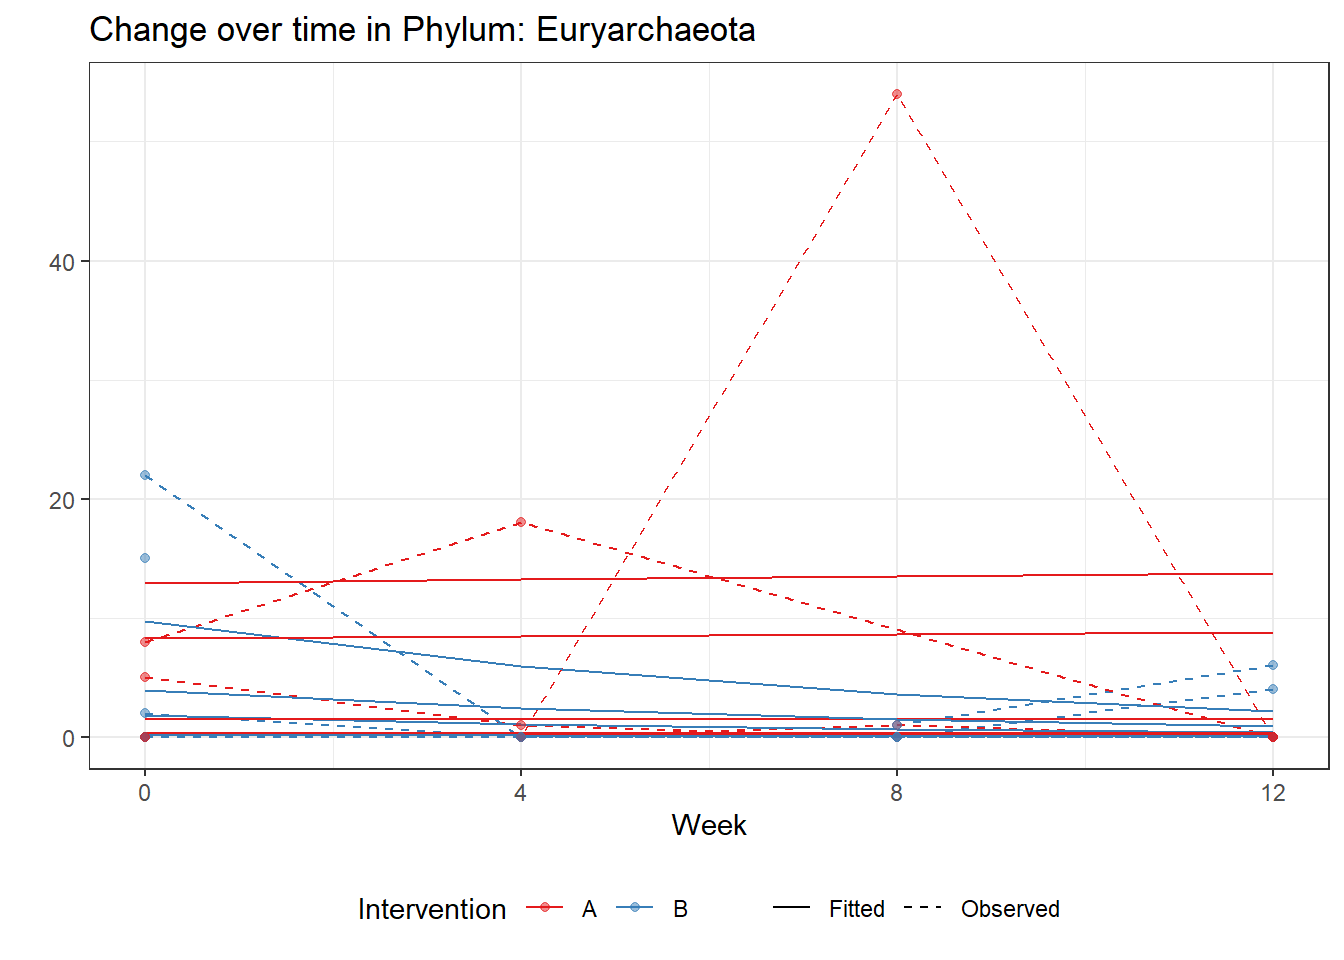
Model:  Euryarchaeota ~ 1 + time + intB:time + (1 | SubjectID)
<environment: 0x0000000038c463e8>

Link:    poisson


Intraclass Correlation (ICC):   0.7854791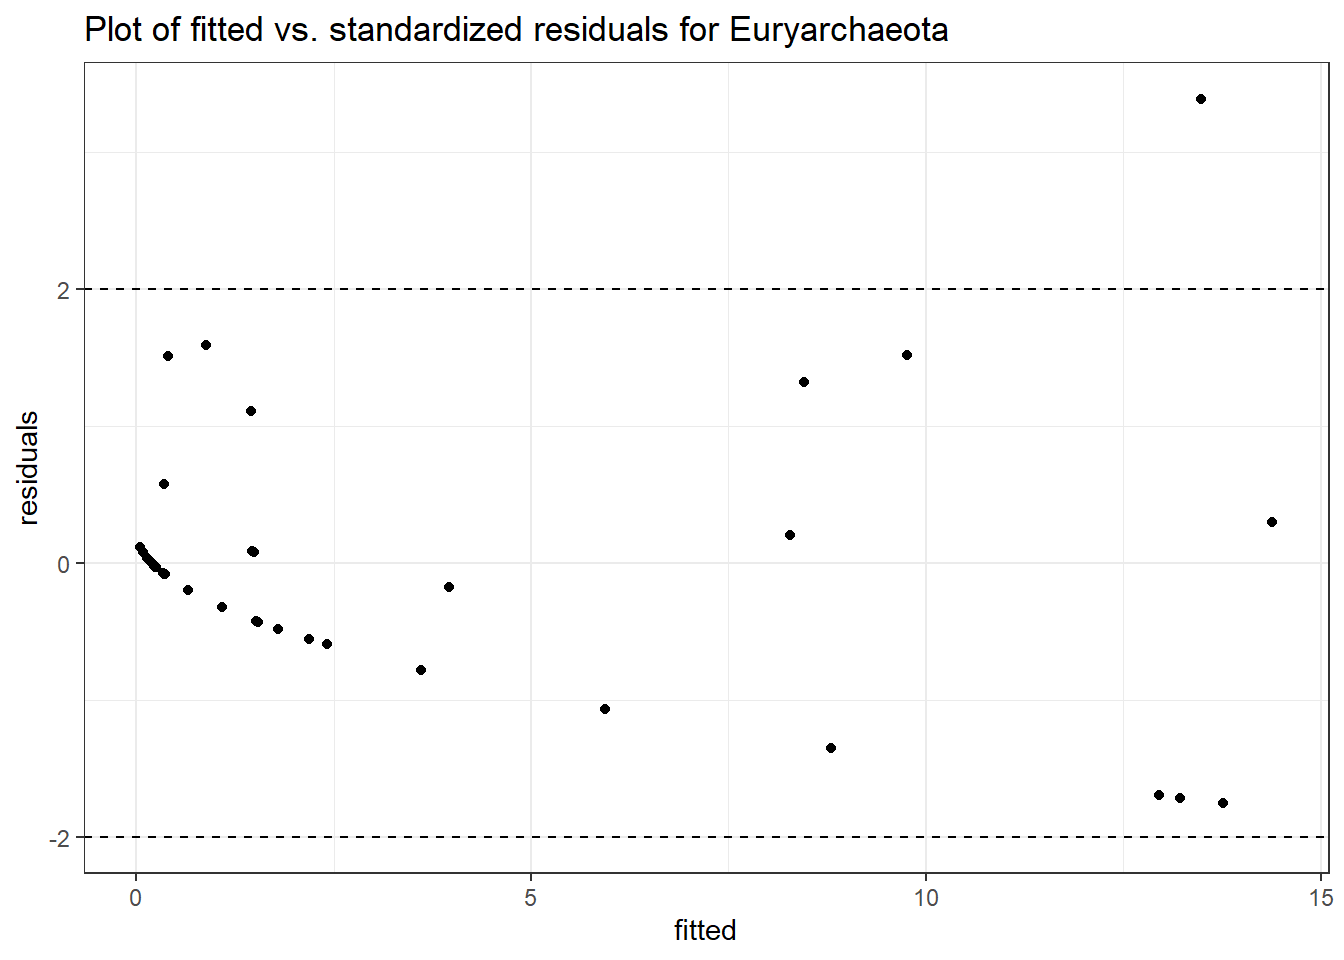
Fixed Effects (change in log)

                  Outcome Estimate Std. Error  z value Pr(>|z|)
(Intercept) Euryarchaeota  0.41699    0.63809  0.65350  0.51344
time        Euryarchaeota  0.02006    0.09071  0.22113  0.82499
time:intB   Euryarchaeota -0.51748    0.18542 -2.79082  0.00526


Random Effects (SD on log scale)

 Groups    Name        Std.Dev.
 SubjectID (Intercept) 1.9135

Significance test not available

#########################################
#########################################
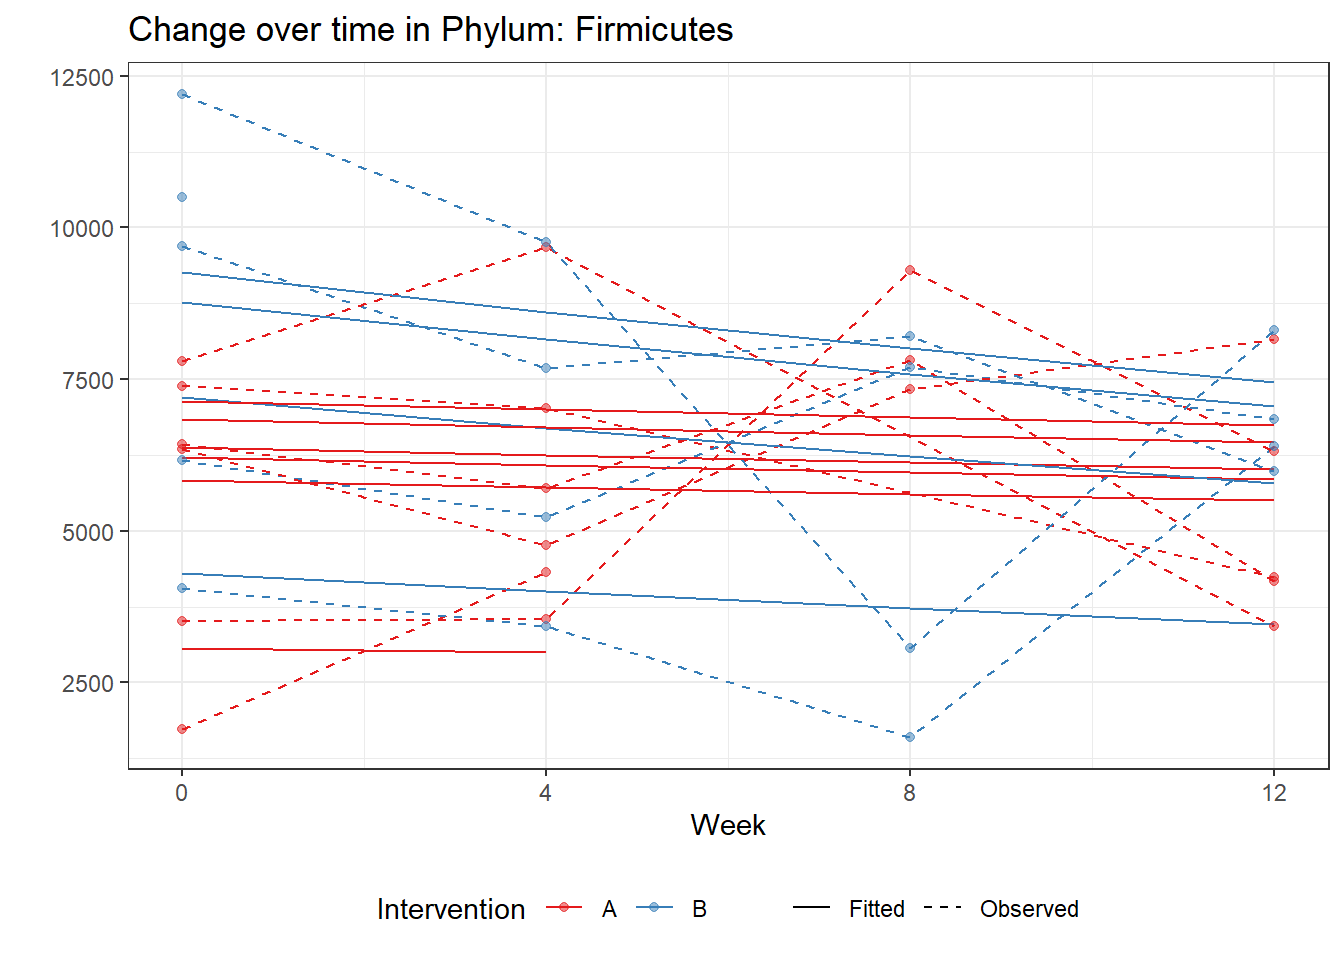
Model:  Firmicutes ~ 1 + time + intB:time + (1 | SubjectID)
<environment: 0x0000000038c463e8>

Link:    poisson


Intraclass Correlation (ICC):   0.09965168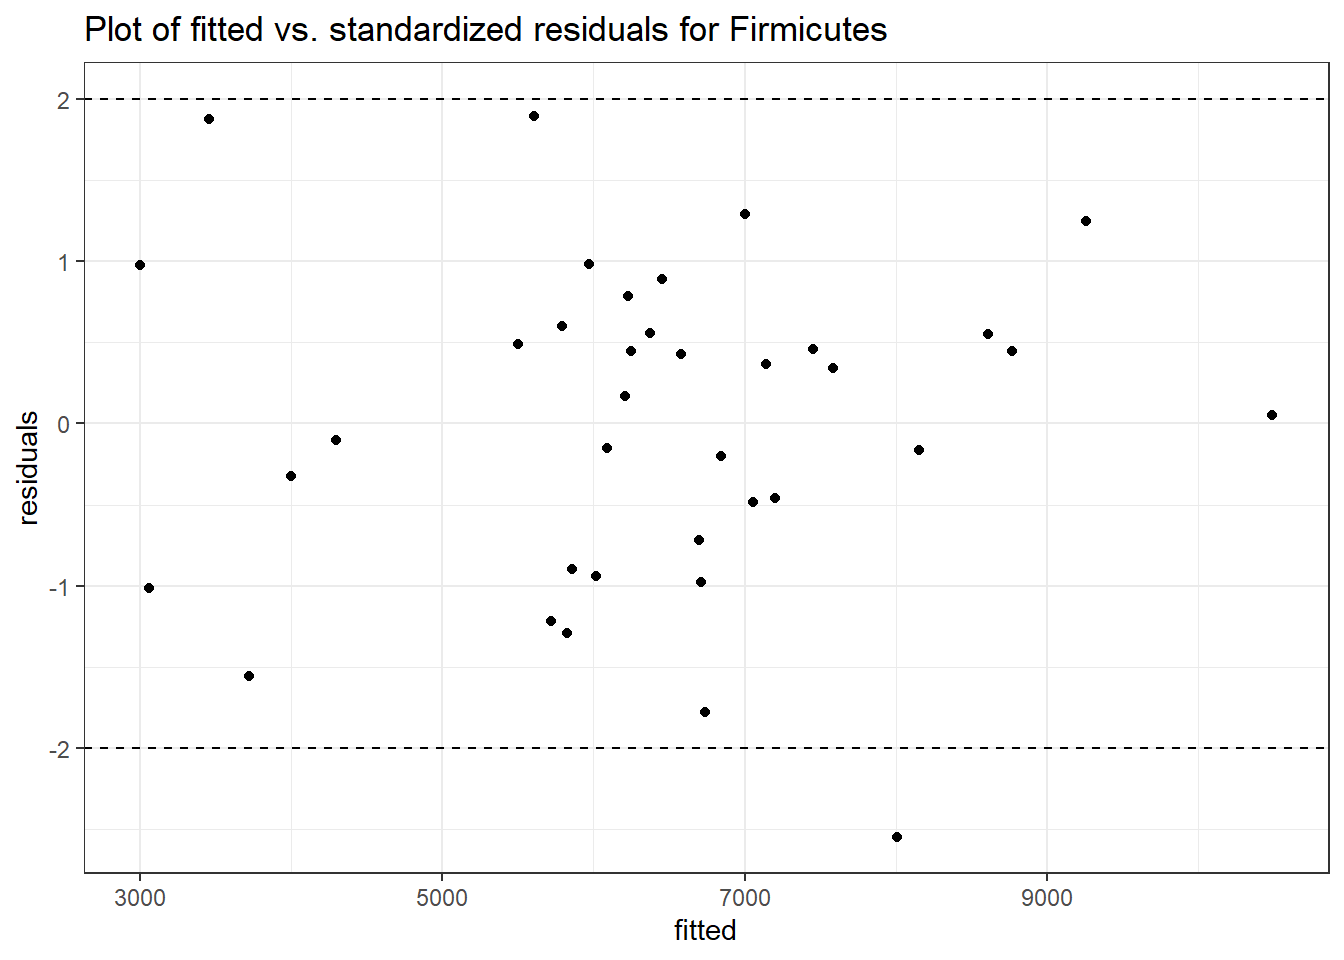
Fixed Effects (change in log)

               Outcome Estimate Std. Error   z value Pr(>|z|)
(Intercept) Firmicutes  8.78313    0.10036  87.51536        0
time        Firmicutes -0.01934    0.00255  -7.59396        0
time:intB   Firmicutes -0.05305    0.00375 -14.15847        0


Random Effects (SD on log scale)

 Groups    Name        Std.Dev.
 SubjectID (Intercept) 0.33269

Significance test not available

#########################################
#########################################
Model:  Fusobacteria ~ 1 + time + intB:time + (1 | SubjectID)
<environment: 0x0000000038c463e8>

Link:    poisson


Intraclass Correlation (ICC):   0.8757236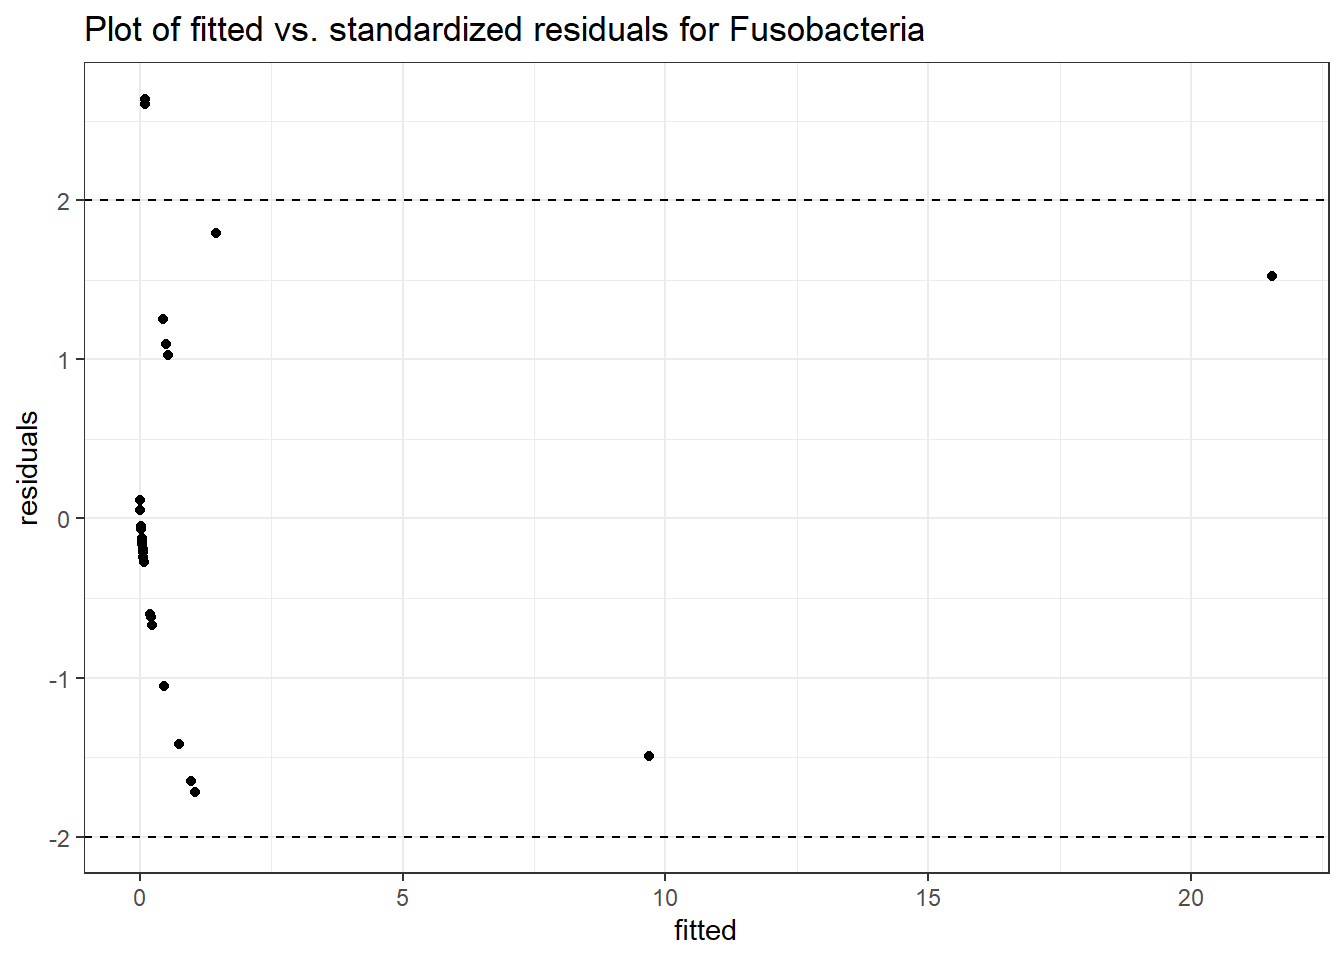
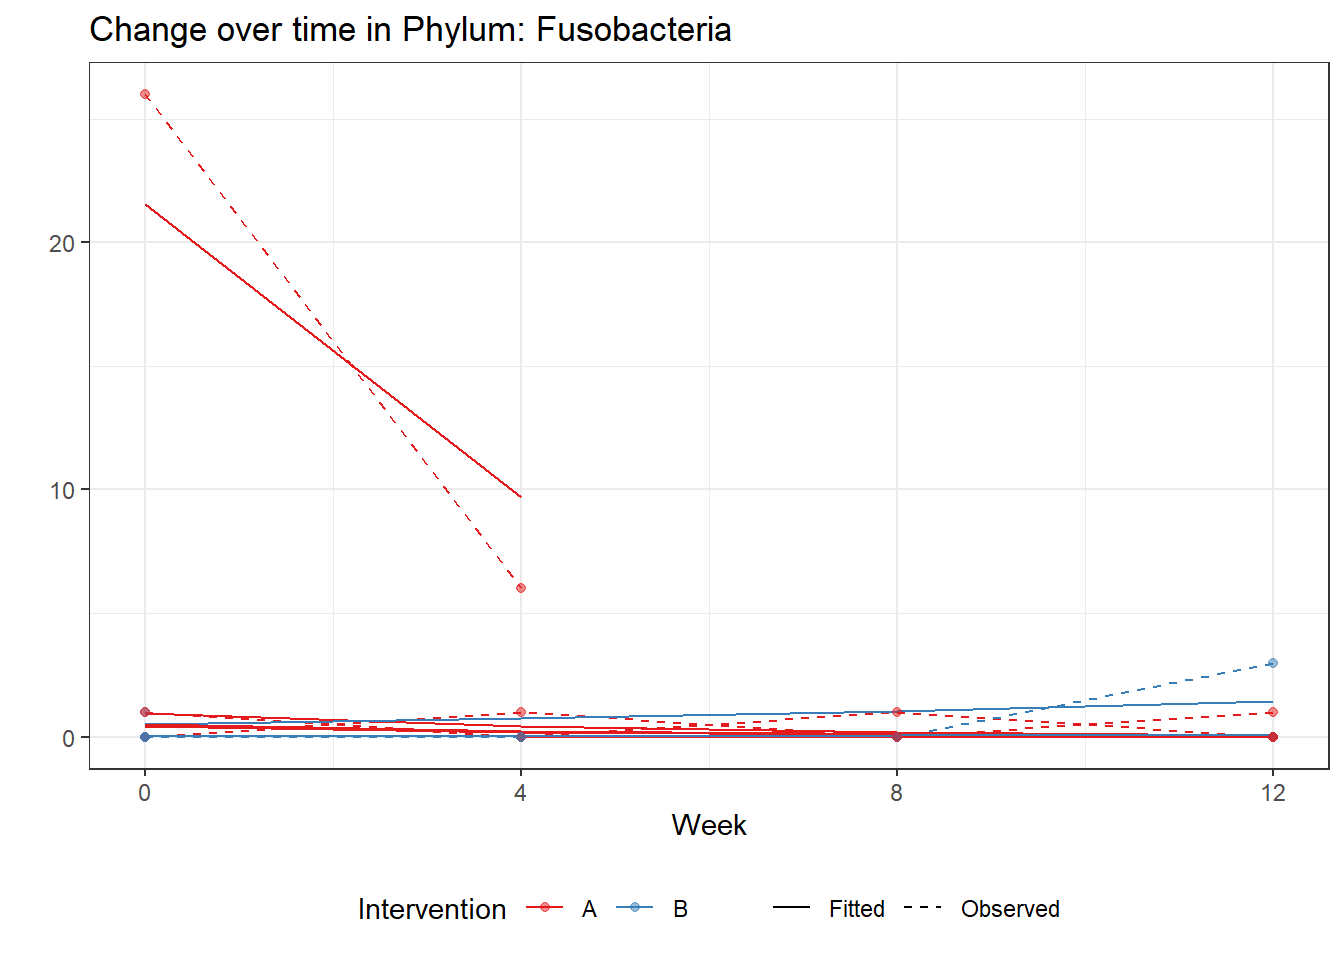
Fixed Effects (change in log)

                 Outcome Estimate Std. Error  z value Pr(>|z|)
(Intercept) Fusobacteria -2.23959    1.31770 -1.69962  0.08920
time        Fusobacteria -0.79848    0.32354 -2.46798  0.01359
time:intB   Fusobacteria  1.13030    0.52474  2.15404  0.03124


Random Effects (SD on log scale)

 Groups    Name        Std.Dev.
 SubjectID (Intercept) 2.6545

Significance test not available

#########################################
#########################################
Model:  Lentisphaerae ~ 1 + time + intB:time + (1 | SubjectID)
<environment: 0x0000000038c463e8>

Link:    poisson


Intraclass Correlation (ICC):   0.7249303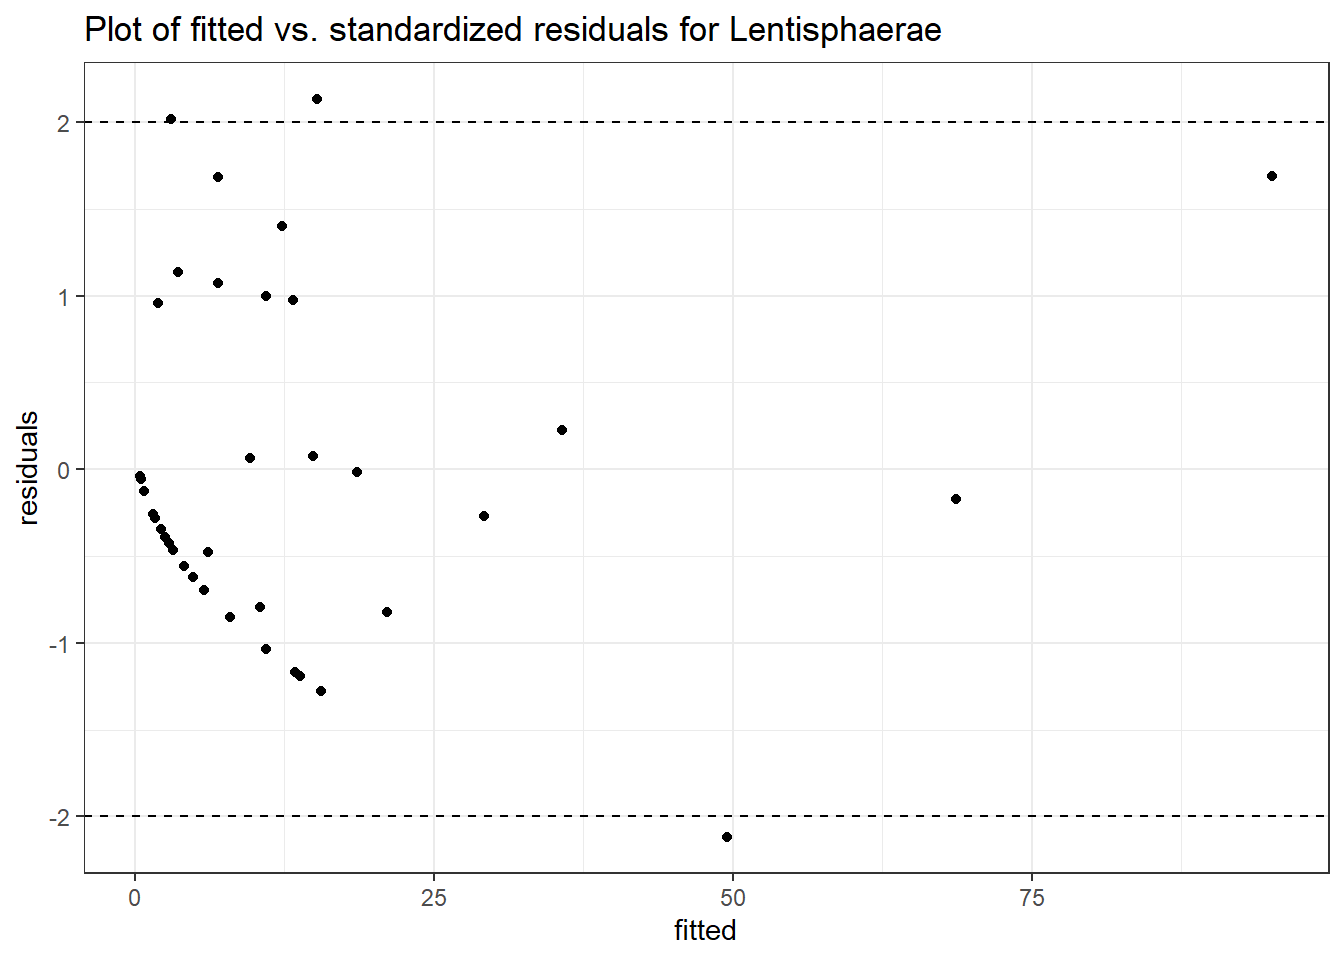
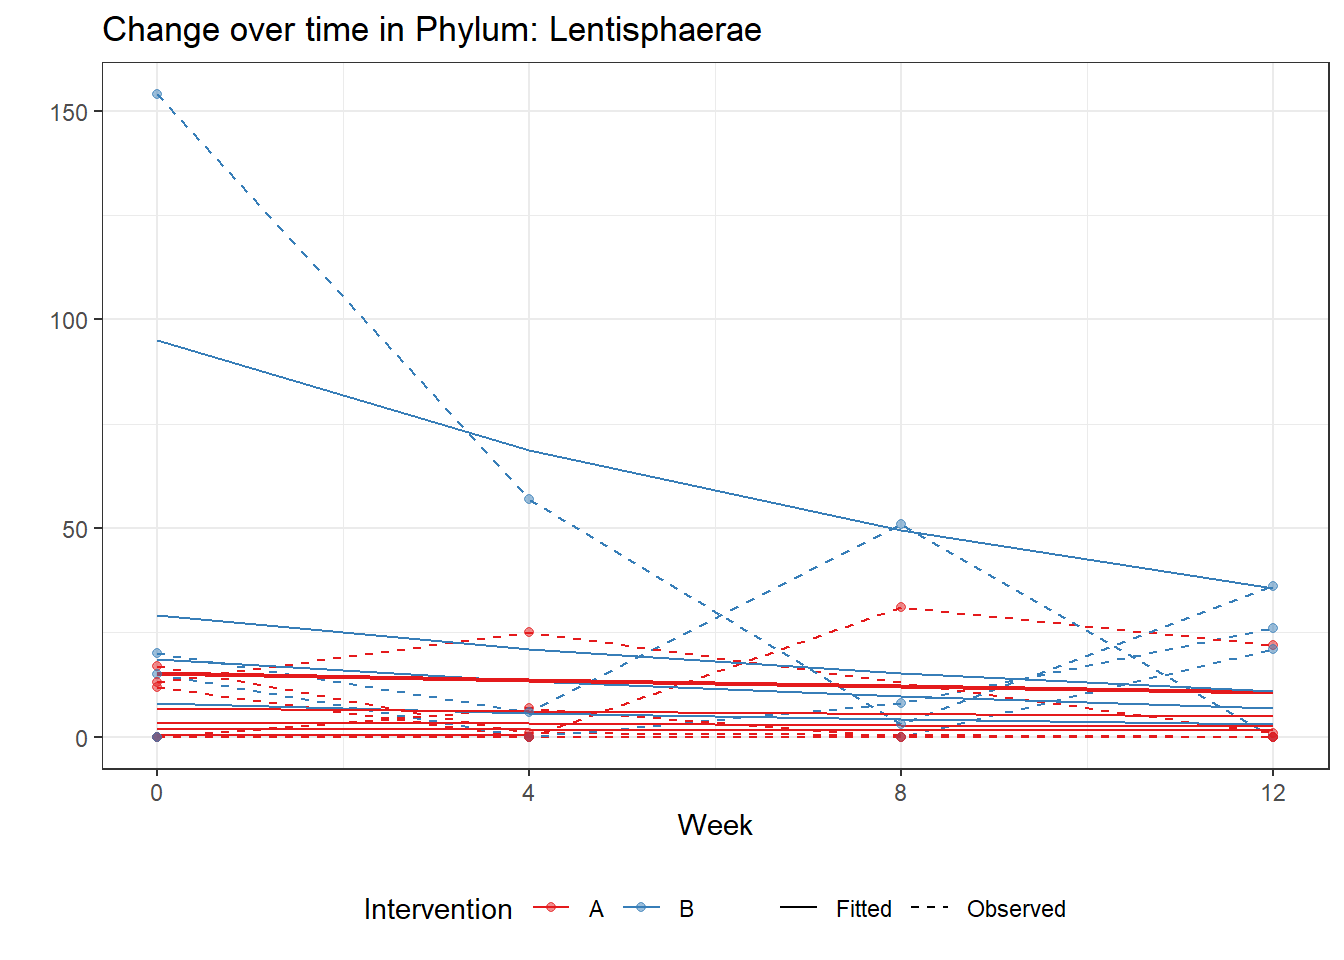
Fixed Effects (change in log)

                  Outcome Estimate Std. Error  z value Pr(>|z|)
(Intercept) Lentisphaerae  1.88736    0.51580  3.65906  0.00025
time        Lentisphaerae -0.11763    0.07535 -1.56114  0.11849
time:intB   Lentisphaerae -0.20874    0.08868 -2.35381  0.01858


Random Effects (SD on log scale)

 Groups    Name        Std.Dev.
 SubjectID (Intercept) 1.6234

Significance test not available

#########################################
#########################################
Model:  Proteobacteria ~ 1 + time + intB:time + (1 | SubjectID)
<environment: 0x0000000038c463e8>

Link:    poisson


Intraclass Correlation (ICC):   0.09214969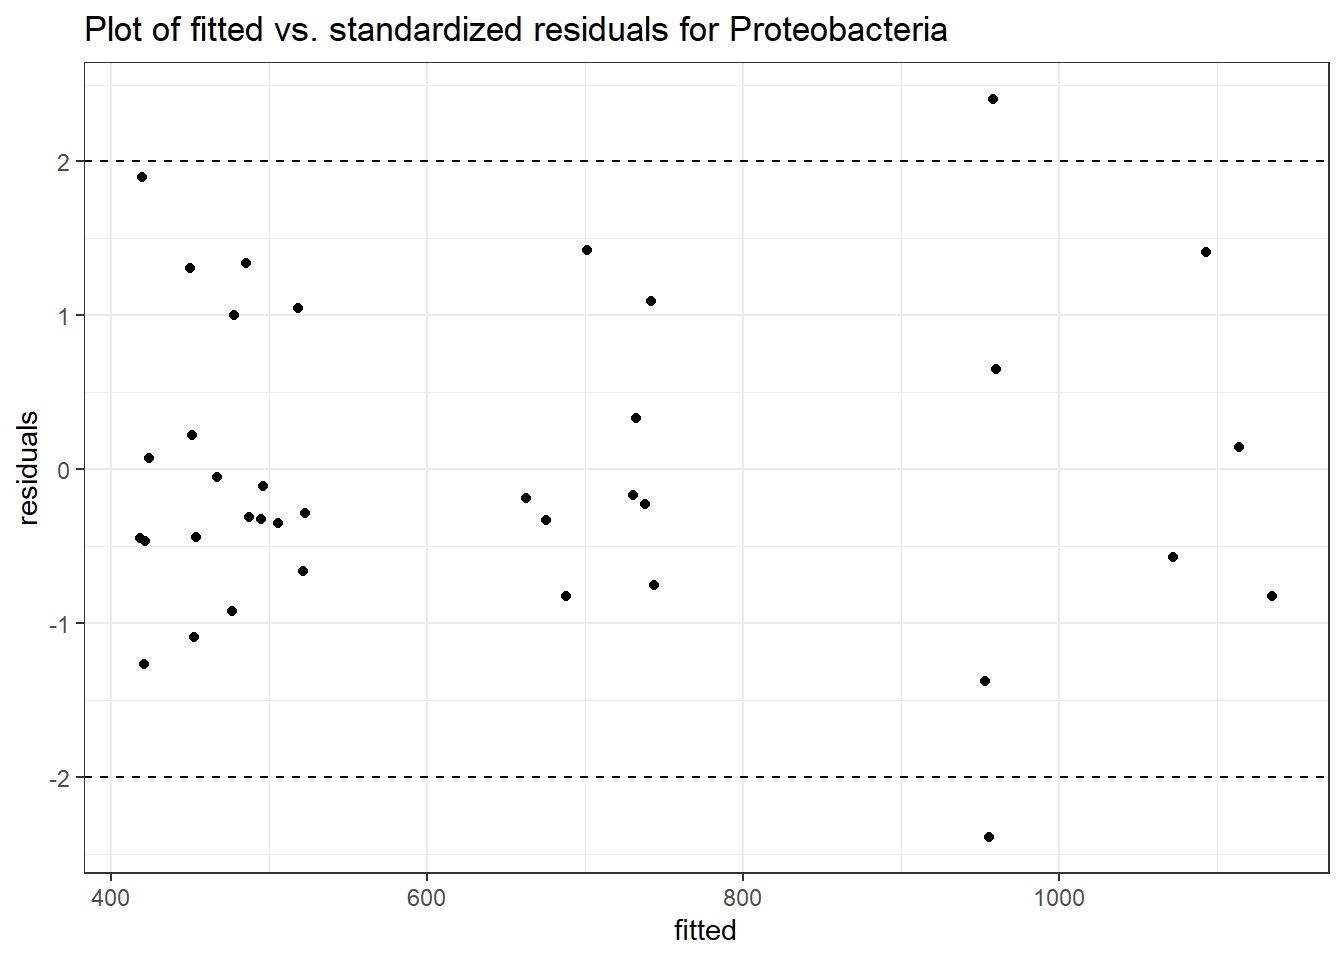
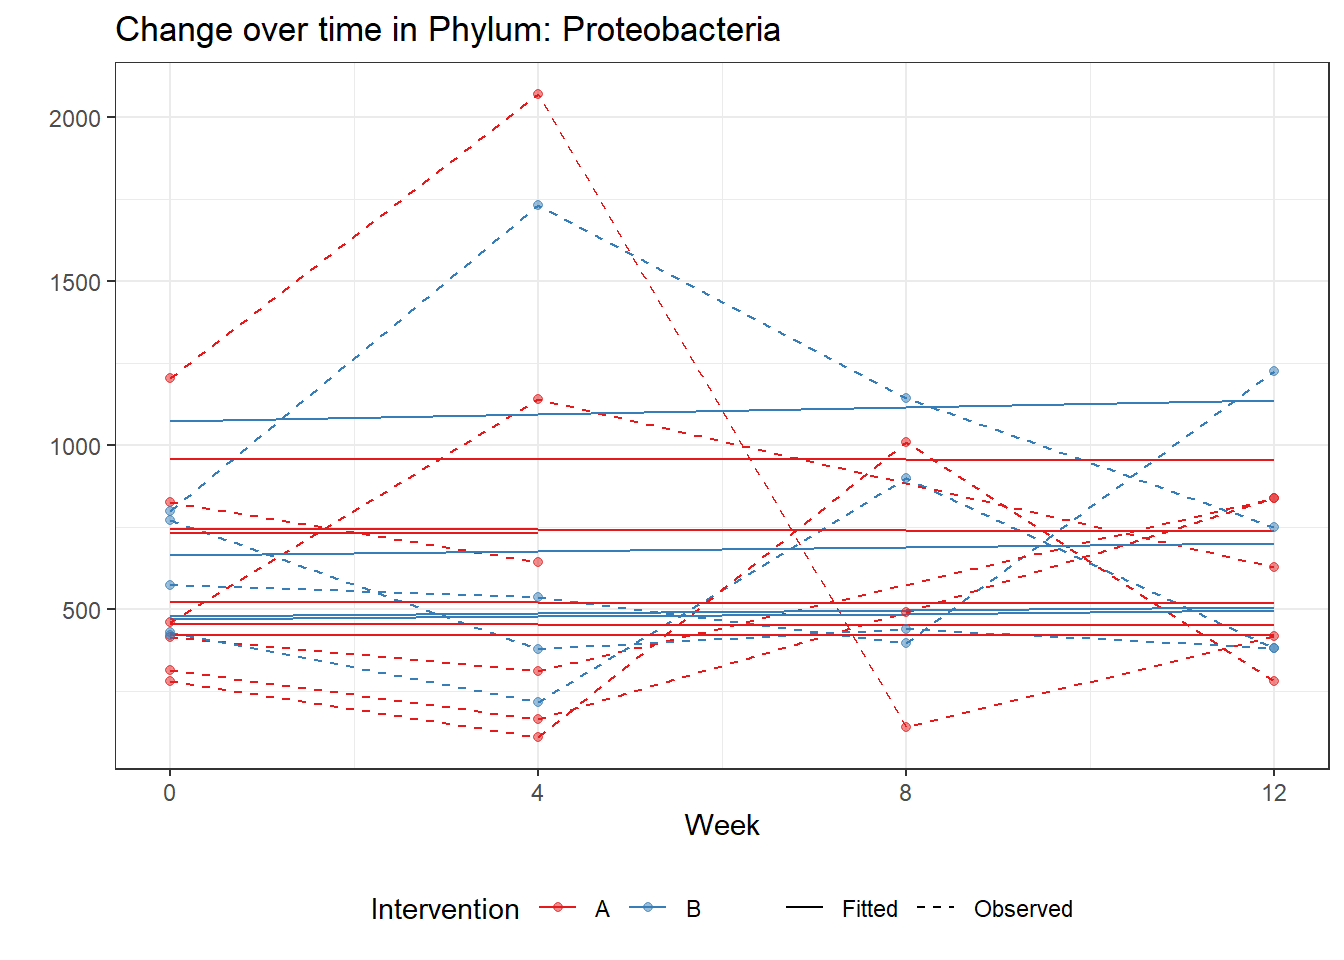
Fixed Effects (change in log)

                   Outcome Estimate Std. Error  z value Pr(>|z|)
(Intercept) Proteobacteria  6.39416    0.09665 66.16092  0.00000
time        Proteobacteria -0.00262    0.00805 -0.32575  0.74462
time:intB   Proteobacteria  0.02152    0.01169  1.84176  0.06551


Random Effects (SD on log scale)

 Groups    Name        Std.Dev.
 SubjectID (Intercept) 0.3186

Significance test not available

#########################################
#########################################
Model:  Tenericutes ~ 1 + time + intB:time + (1 | SubjectID)
<environment: 0x0000000038c463e8>

Link:    poisson


Intraclass Correlation (ICC):   0.9233551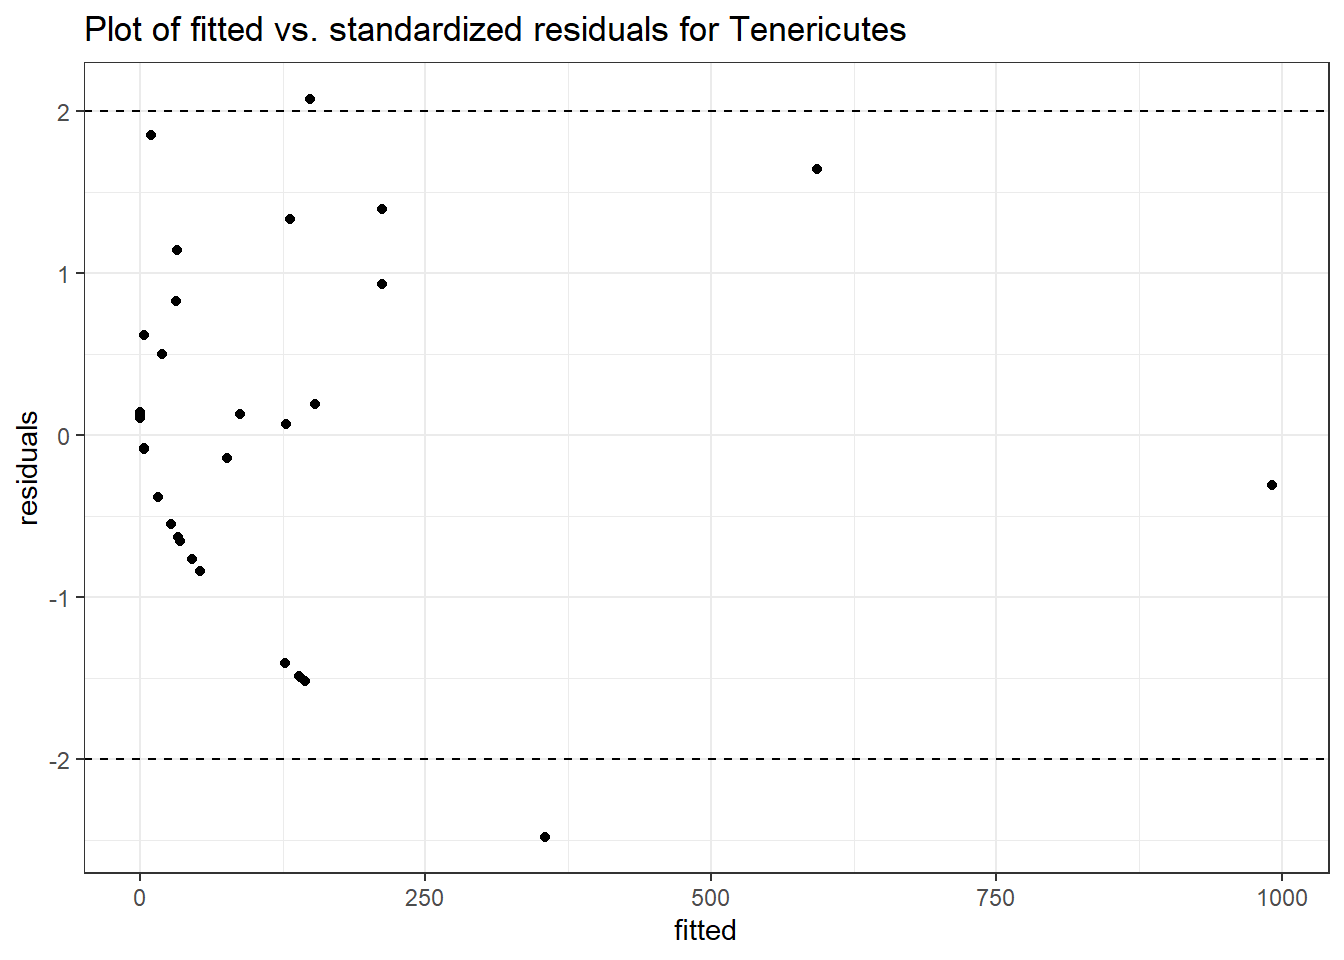
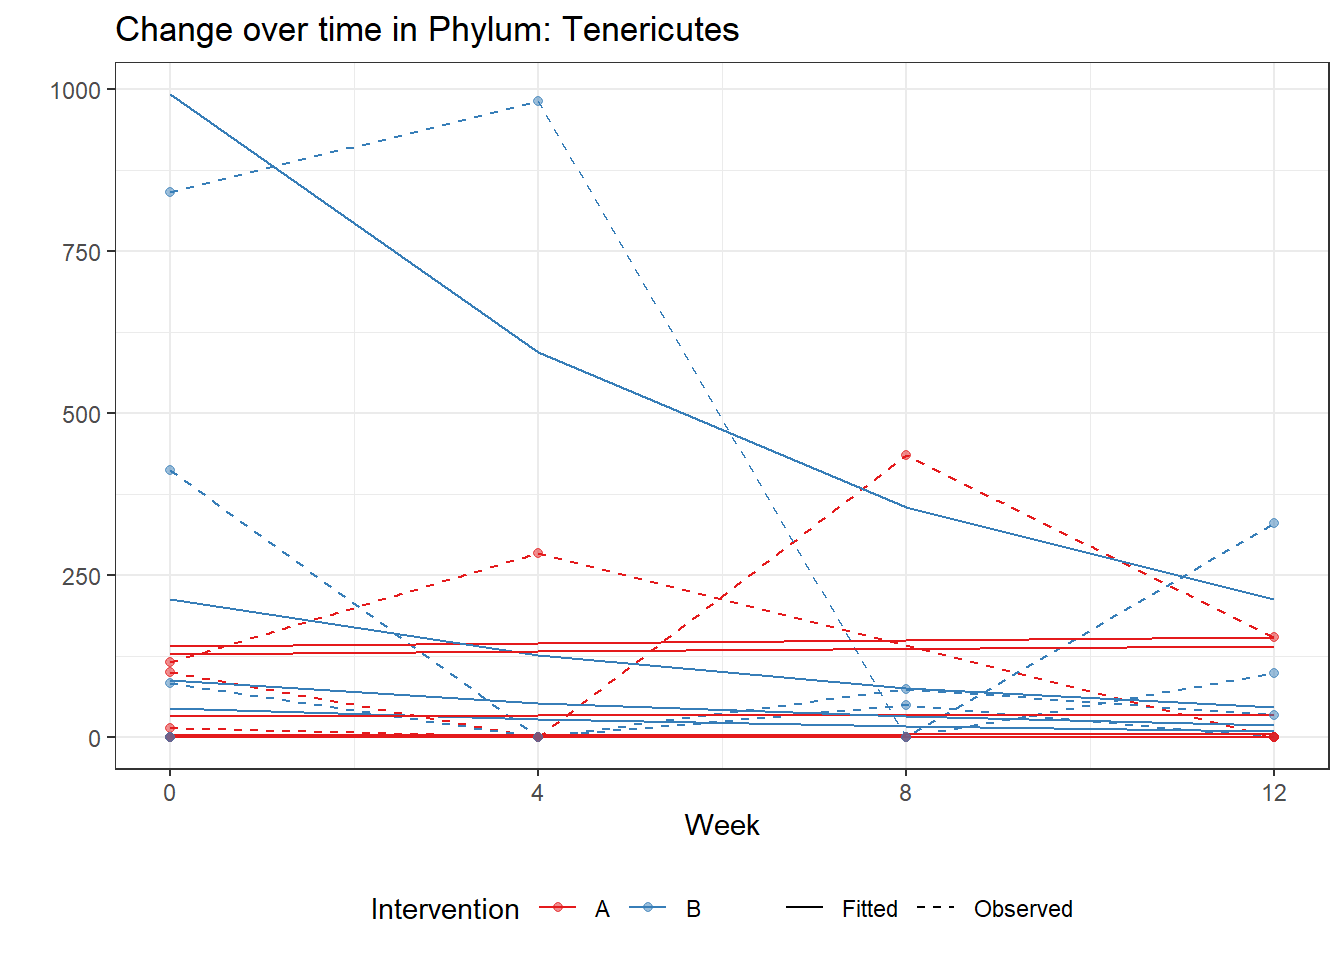
Fixed Effects (change in log)

                Outcome Estimate Std. Error   z value Pr(>|z|)
(Intercept) Tenericutes  2.45099    1.08069   2.26799  0.02333
time        Tenericutes  0.02952    0.02546   1.15933  0.24632
time:intB   Tenericutes -0.54372    0.03146 -17.28516  0.00000


Random Effects (SD on log scale)

 Groups    Name        Std.Dev.
 SubjectID (Intercept) 3.4709

Significance test not available

#########################################
#########################################
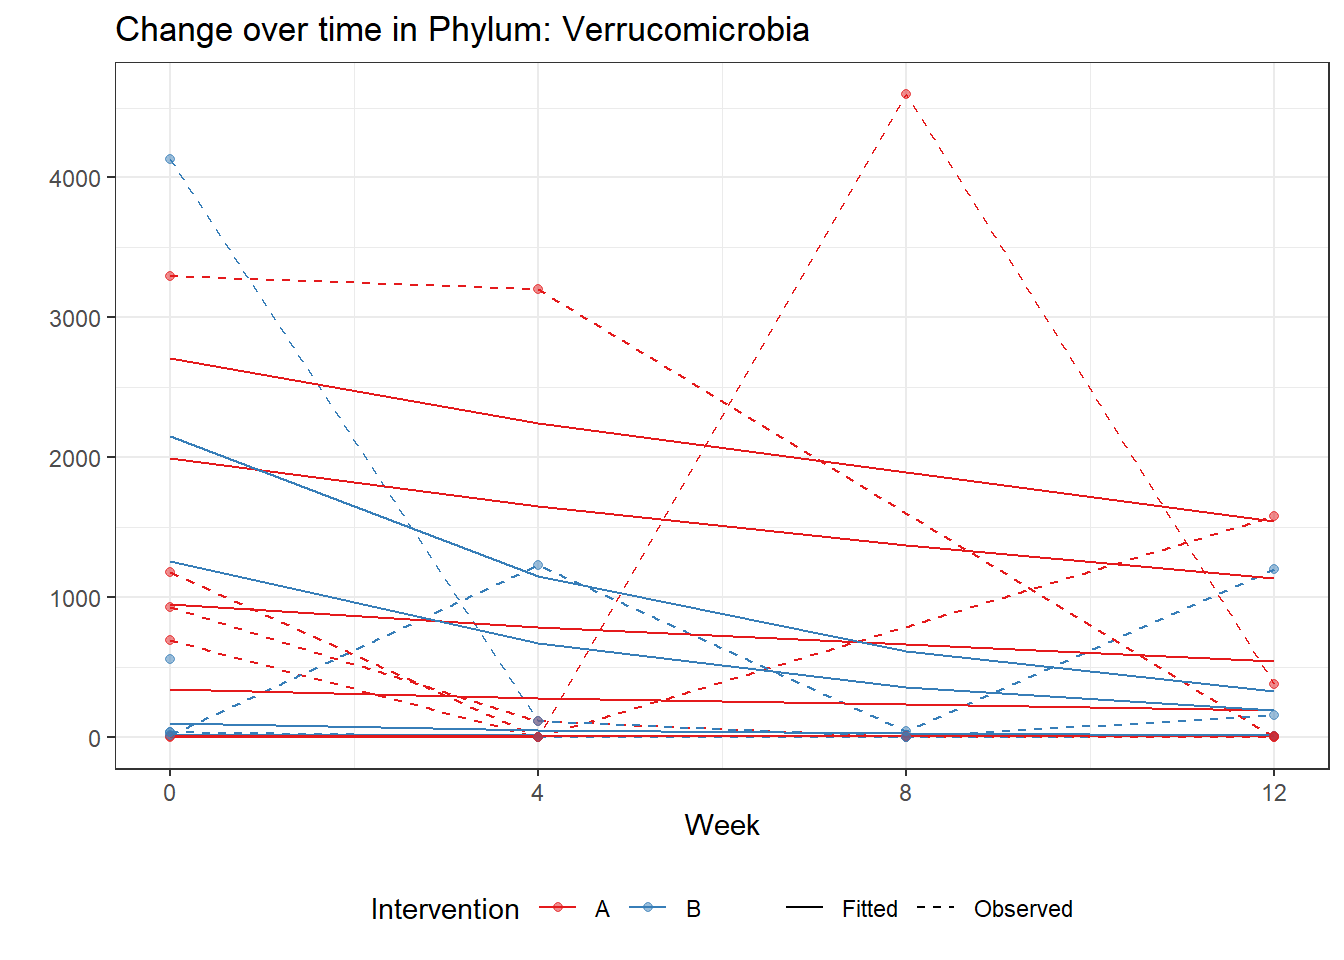
Model:  Verrucomicrobia ~ 1 + time + intB:time + (1 | SubjectID)
<environment: 0x0000000038c463e8>

Link:    poisson


Intraclass Correlation (ICC):   0.8764792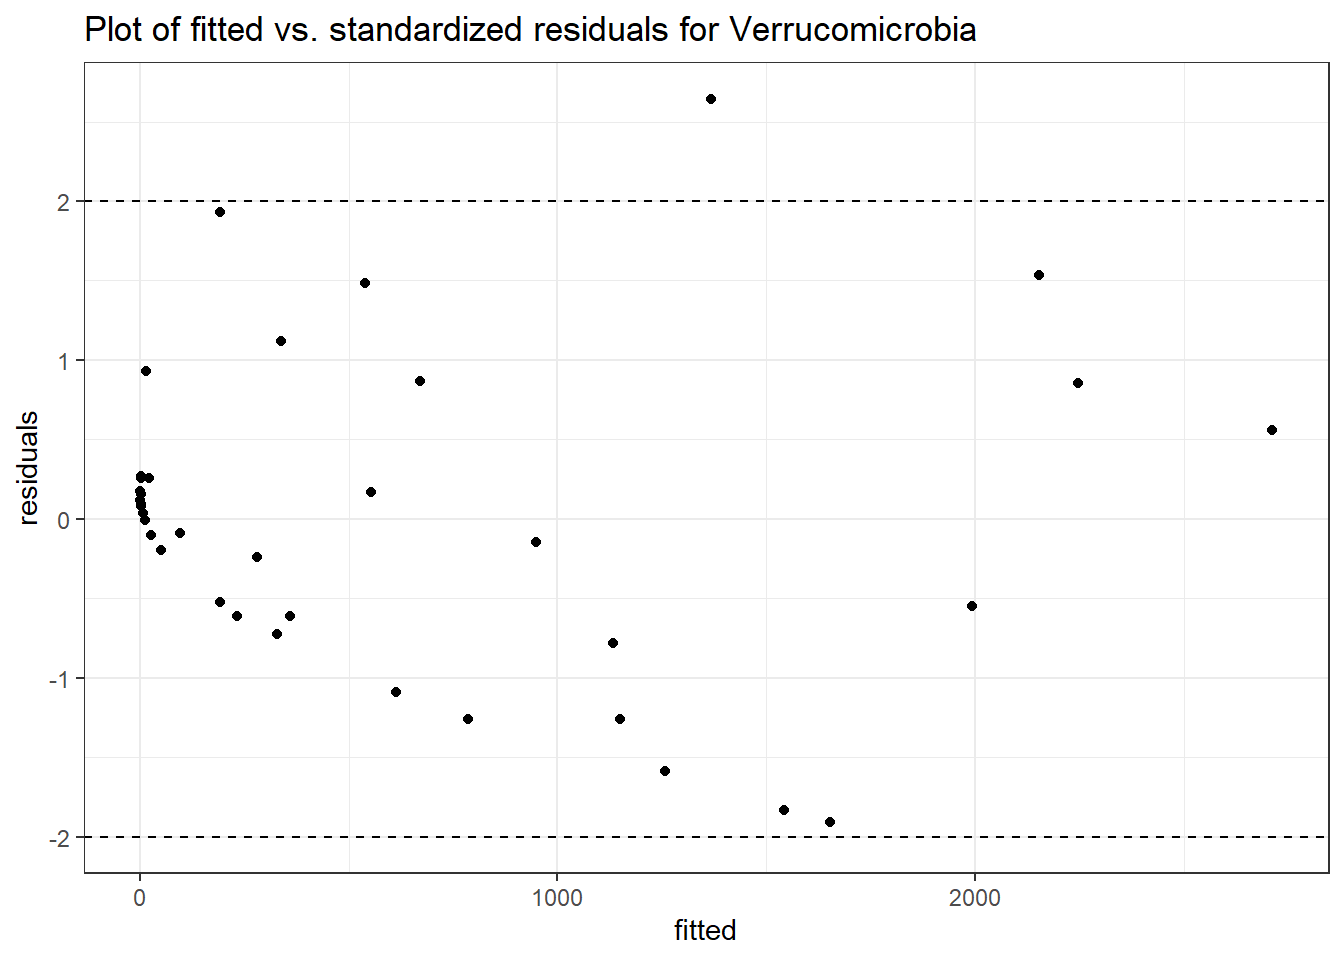
Fixed Effects (change in log)

                    Outcome Estimate Std. Error   z value Pr(>|z|)
(Intercept) Verrucomicrobia  5.27169    0.80683   6.53380        0
time        Verrucomicrobia -0.18805    0.00695 -27.05719        0
time:intB   Verrucomicrobia -0.43924    0.01431 -30.68870        0


Random Effects (SD on log scale)

 Groups    Name        Std.Dev.
 SubjectID (Intercept) 2.6638

Significance test not available
Covariate(s): Time and Gender
\[\begin{align*} h\left(Y_{ij}\right)&=\beta_{0j} + \beta_{1j}(Week)_{ij} + r_{ij}\\ \beta_{0j}&= \gamma_{00} + \gamma_{01}(Intervention)_{j} + \gamma_{02}(Gender)_{j} + u_{0j}\\ \beta_{1j}&= \gamma_{10}\\ \beta_{2j}&= \gamma_{20}\\ \end{align*}\]
phylum.fit7 <- glmm_microbiome(mydata=microbiome_data, model.number=7,
                               taxa.level="Phylum", link="poisson",
                               model="1 + intB + time + female + (1|SubjectID)")
#########################################
#########################################
Model:  Actinobacteria ~ 1 + intB + time + female + (1 | SubjectID)
<environment: 0x000000000b5e7848>

Link:    poisson


Intraclass Correlation (ICC):   0.4239553

Fixed Effects (change in log)

                   Outcome Estimate Std. Error   z value Pr(>|z|)
(Intercept) Actinobacteria  2.78265    0.51627   5.38988  0.00000
intB        Actinobacteria  0.93295    0.52659   1.77168  0.07645
time        Actinobacteria -0.26077    0.02240 -11.64121  0.00000
female      Actinobacteria  1.08413    0.54889   1.97512  0.04825


Random Effects (SD on log scale)

 Groups    Name        Std.Dev.
 SubjectID (Intercept) 0.85789

Significance test not available

#########################################
#########################################
Model:  Bacteroidetes ~ 1 + intB + time + female + (1 | SubjectID)
<environment: 0x000000000b5e7848>

Link:    poisson


Intraclass Correlation (ICC):   0.06463683

Fixed Effects (change in log)

                  Outcome Estimate Std. Error   z value Pr(>|z|)
(Intercept) Bacteroidetes  9.10955    0.15383  59.21996  0.00000
intB        Bacteroidetes -0.17097    0.15963  -1.07102  0.28416
time        Bacteroidetes -0.02542    0.00189 -13.45806  0.00000
female      Bacteroidetes -0.39664    0.16522  -2.40071  0.01636


Random Effects (SD on log scale)

 Groups    Name        Std.Dev.
 SubjectID (Intercept) 0.26288

Significance test not available

#########################################
#########################################
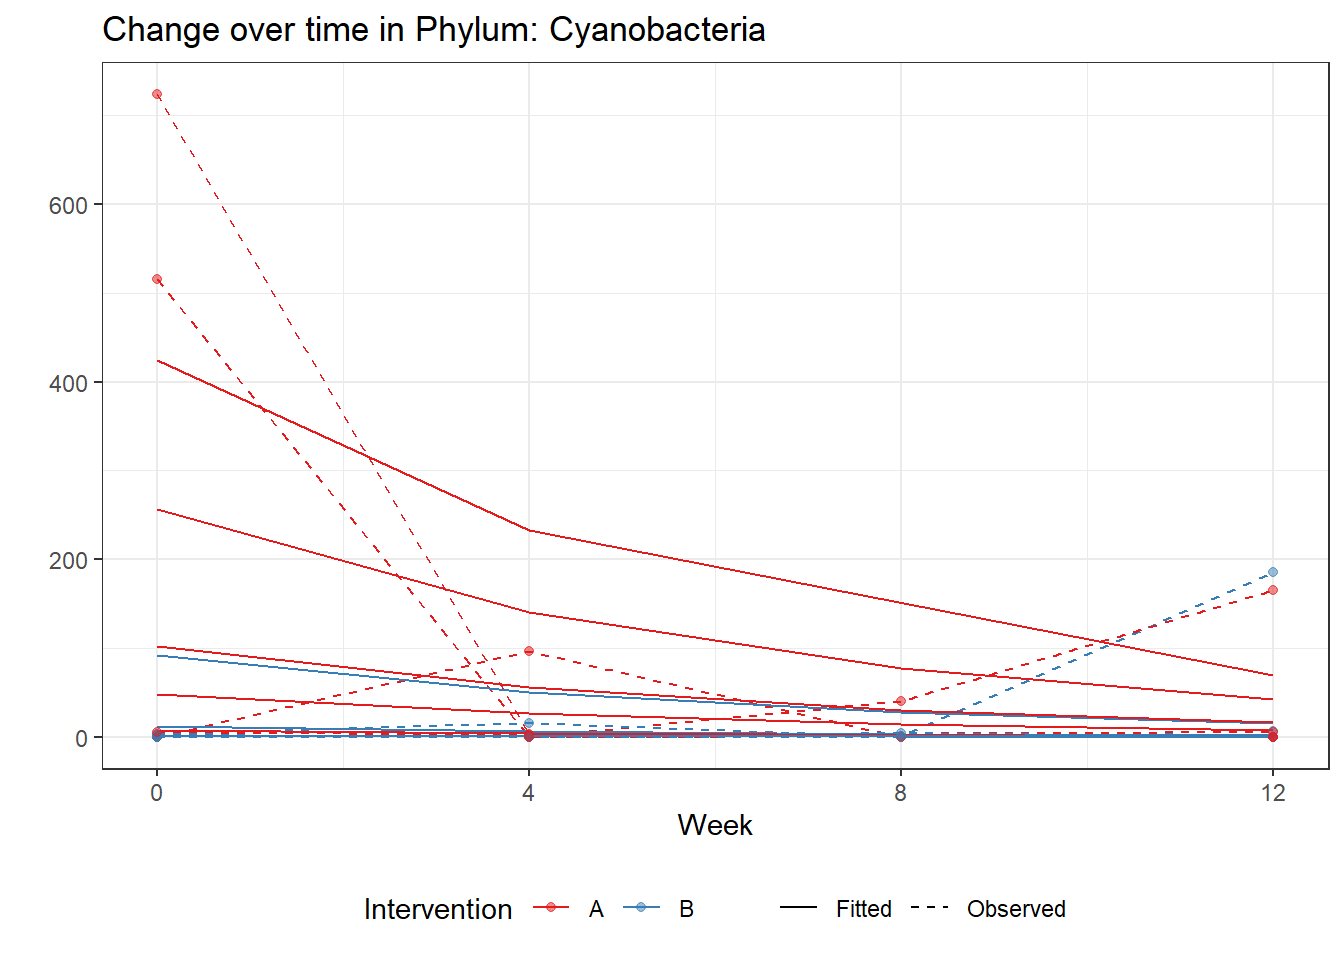
Model:  Cyanobacteria ~ 1 + intB + time + female + (1 | SubjectID)
<environment: 0x000000000b5e7848>

Link:    poisson


Intraclass Correlation (ICC):   0.8205922
Fixed Effects (change in log)

                  Outcome Estimate Std. Error   z value Pr(>|z|)
(Intercept) Cyanobacteria  3.83226    1.28717   2.97728  0.00291
intB        Cyanobacteria -2.44114    1.34246  -1.81841  0.06900
time        Cyanobacteria -0.60181    0.02518 -23.89714  0.00000
female      Cyanobacteria -0.25919    1.38186  -0.18757  0.85122


Random Effects (SD on log scale)

 Groups    Name        Std.Dev.
 SubjectID (Intercept) 2.1387

Significance test not available

#########################################
#########################################
Model:  Euryarchaeota ~ 1 + intB + time + female + (1 | SubjectID)
<environment: 0x000000000b5e7848>

Link:    poisson


Intraclass Correlation (ICC):   0.7253927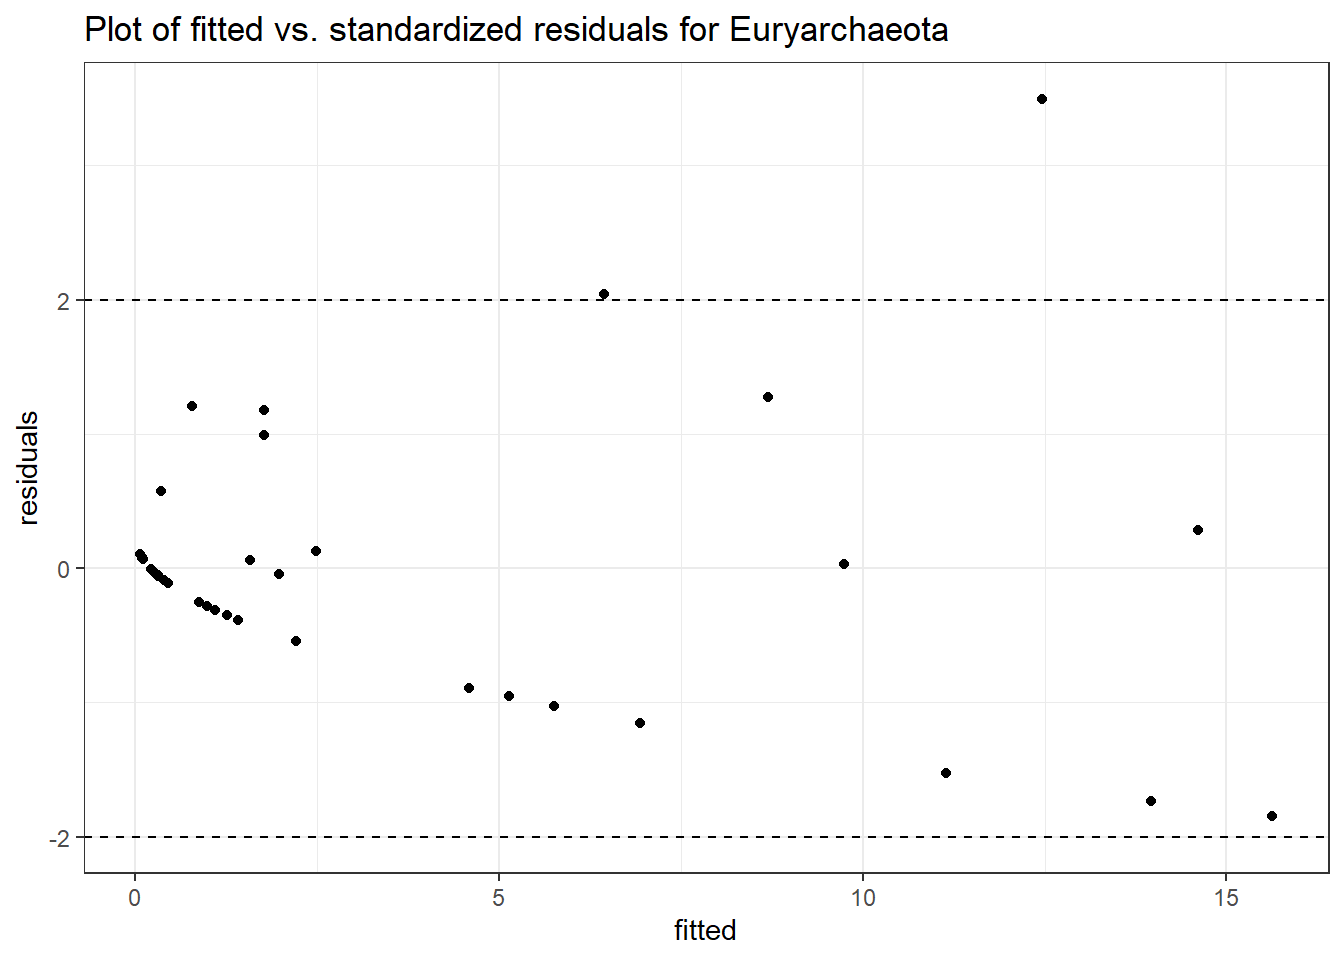
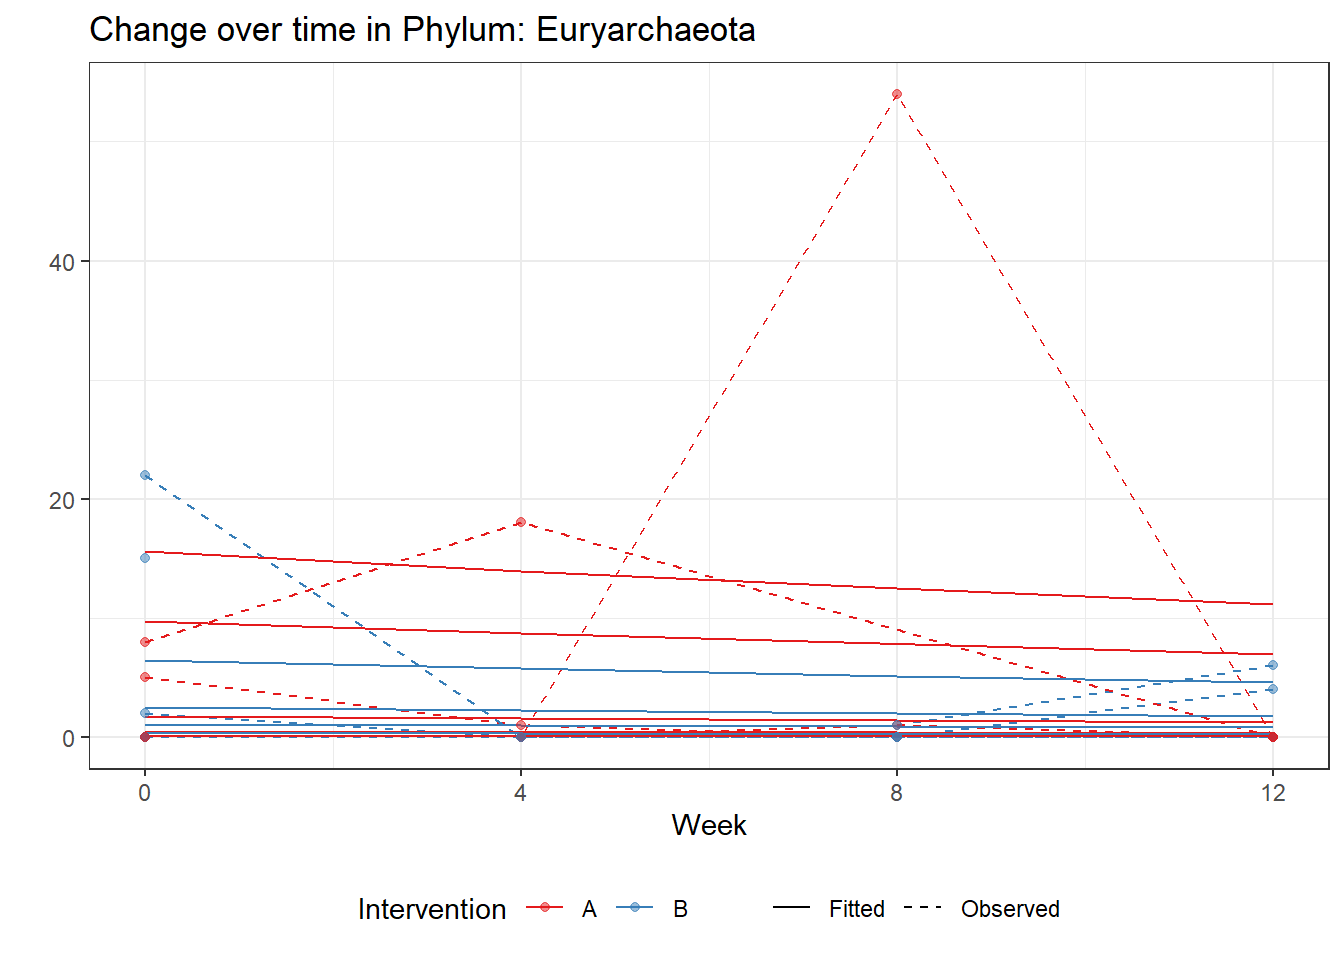
Fixed Effects (change in log)

                  Outcome Estimate Std. Error  z value Pr(>|z|)
(Intercept) Euryarchaeota -1.56218    1.32619 -1.17795  0.23882
intB        Euryarchaeota  1.02337    1.12826  0.90704  0.36439
time        Euryarchaeota -0.11287    0.07978 -1.41467  0.15717
female      Euryarchaeota  2.20529    1.23630  1.78378  0.07446


Random Effects (SD on log scale)

 Groups    Name        Std.Dev.
 SubjectID (Intercept) 1.6253

Significance test not available

#########################################
#########################################
Model:  Firmicutes ~ 1 + intB + time + female + (1 | SubjectID)
<environment: 0x000000000b5e7848>

Link:    poisson


Intraclass Correlation (ICC):   0.04187562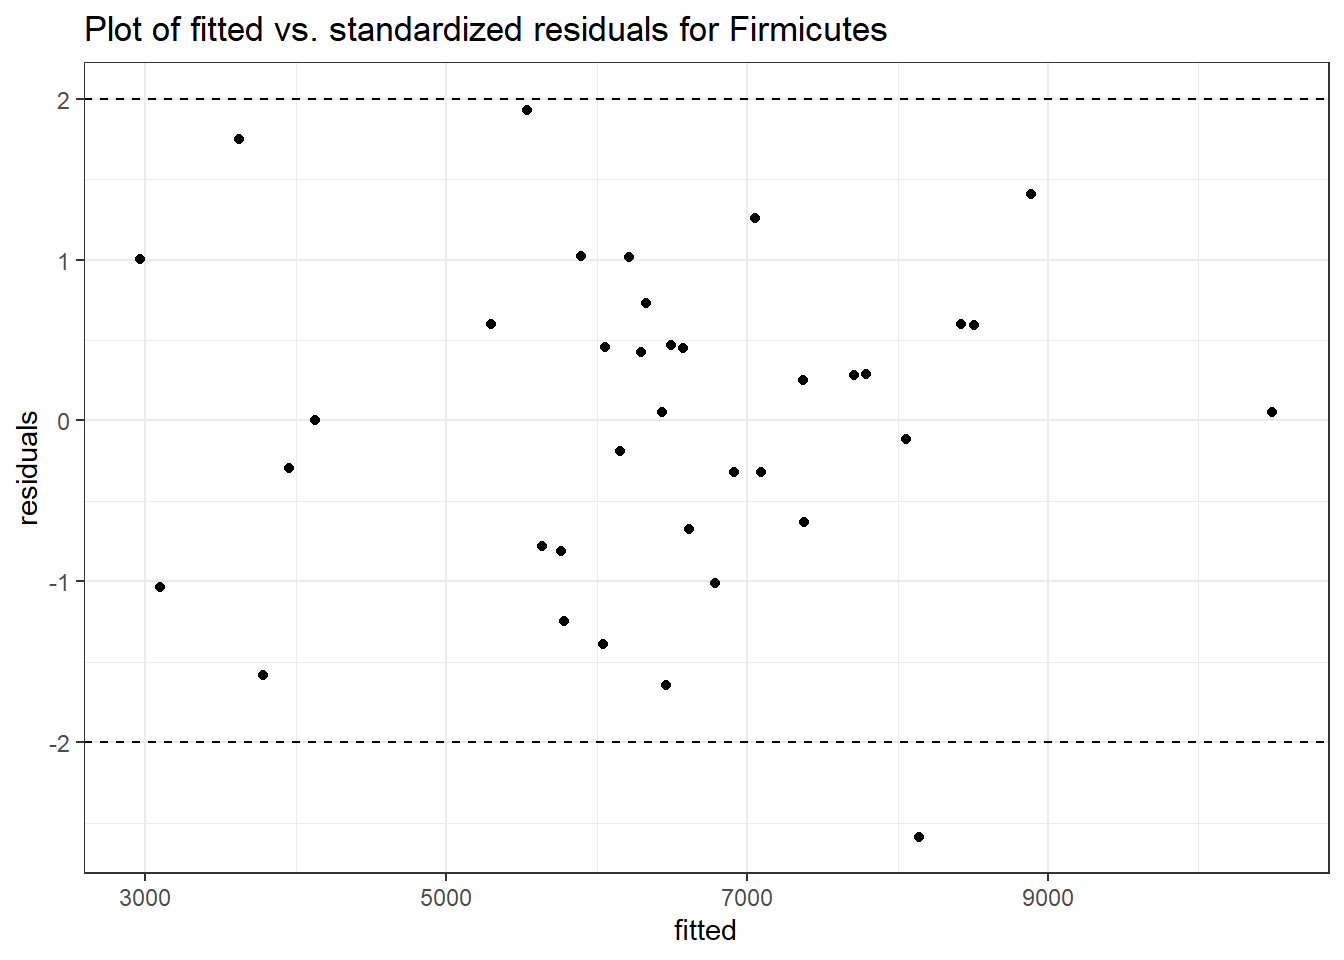
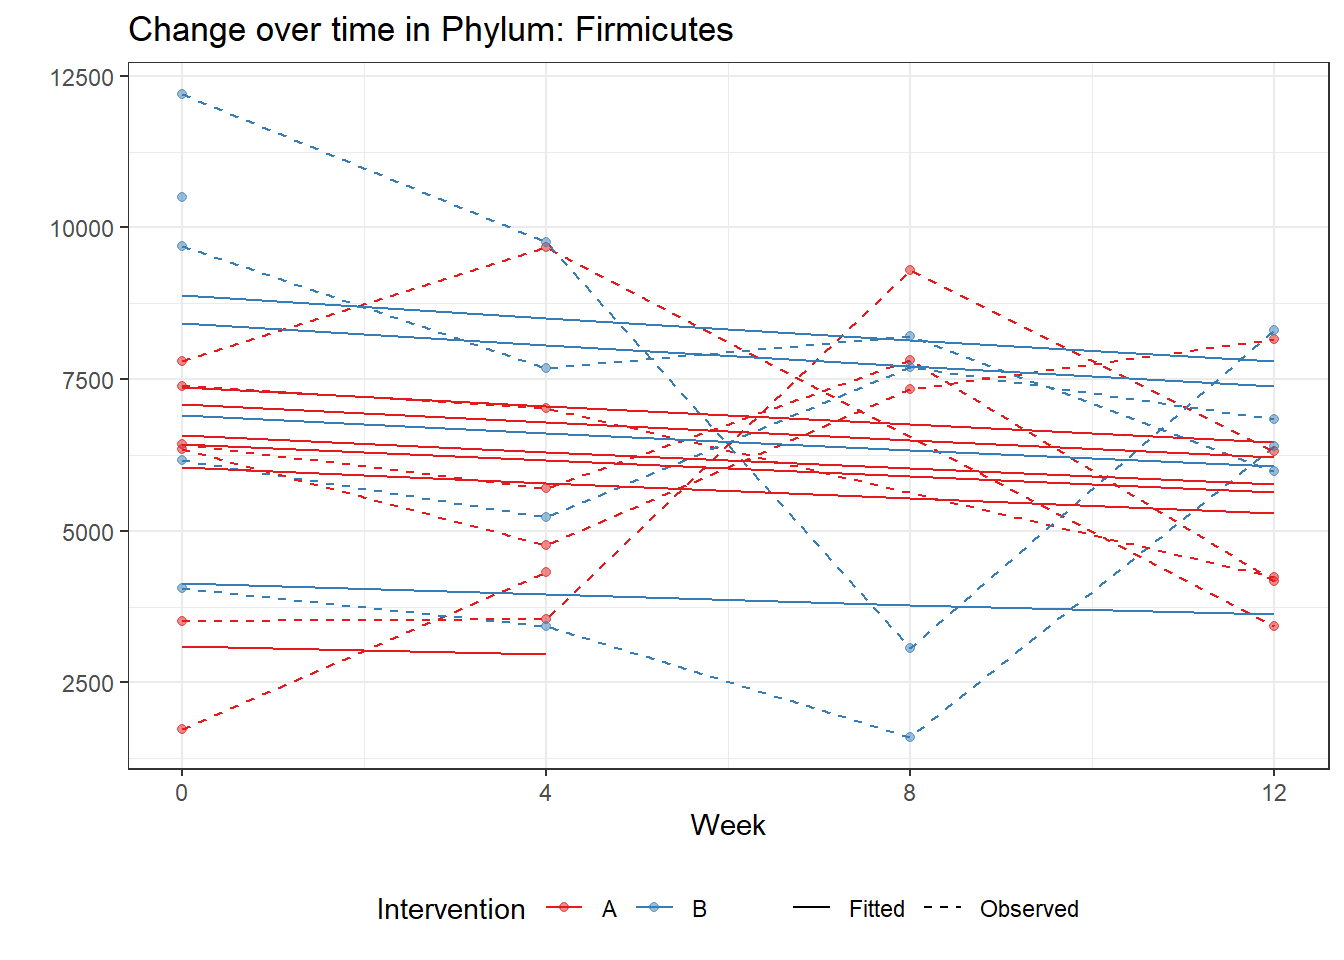
Fixed Effects (change in log)

               Outcome Estimate Std. Error   z value Pr(>|z|)
(Intercept) Firmicutes  8.36797    0.12242  68.35276  0.00000
intB        Firmicutes  0.26273    0.12698   2.06907  0.03854
time        Firmicutes -0.04391    0.00187 -23.47675  0.00000
female      Firmicutes  0.46761    0.13145   3.55723  0.00037


Random Effects (SD on log scale)

 Groups    Name        Std.Dev.
 SubjectID (Intercept) 0.20906

Significance test not available

#########################################
#########################################
Model:  Fusobacteria ~ 1 + intB + time + female + (1 | SubjectID)
<environment: 0x000000000b5e7848>

Link:    poisson


Intraclass Correlation (ICC):   0.829431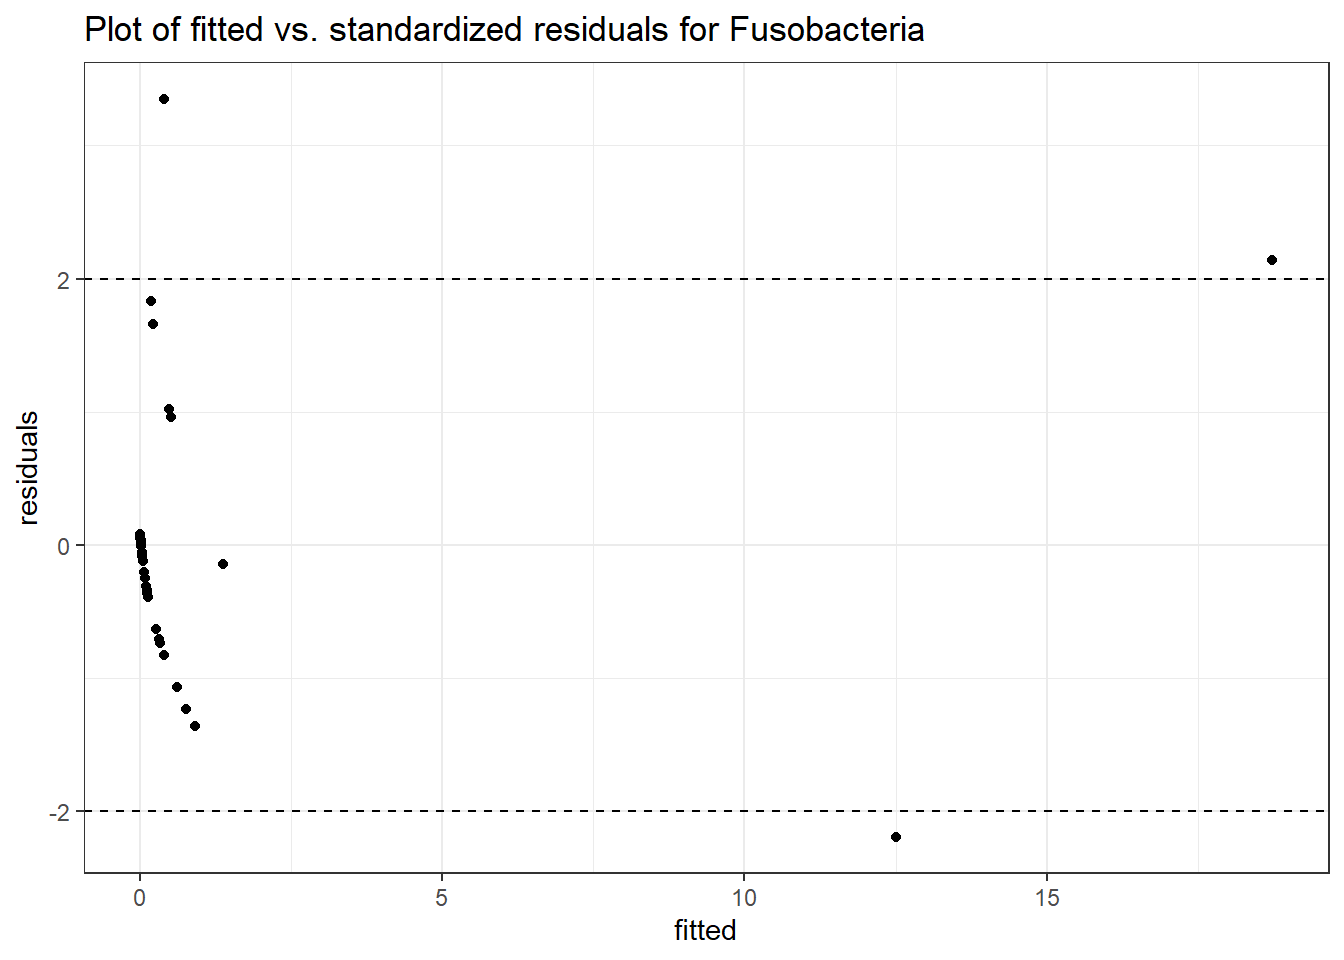
Fixed Effects (change in log)

                 Outcome Estimate Std. Error  z value Pr(>|z|)
(Intercept) Fusobacteria -0.78714    1.75543 -0.44840  0.65386
intB        Fusobacteria -2.11435    1.81618 -1.16417  0.24435
time        Fusobacteria -0.40368    0.24242 -1.66517  0.09588
female      Fusobacteria -0.15009    1.82866 -0.08208  0.93459


Random Effects (SD on log scale)

 Groups    Name        Std.Dev.
 SubjectID (Intercept) 2.2052

Significance test not available

#########################################
#########################################
Model:  Lentisphaerae ~ 1 + intB + time + female + (1 | SubjectID)
<environment: 0x000000000b5e7848>

Link:    poisson


Intraclass Correlation (ICC):   0.647492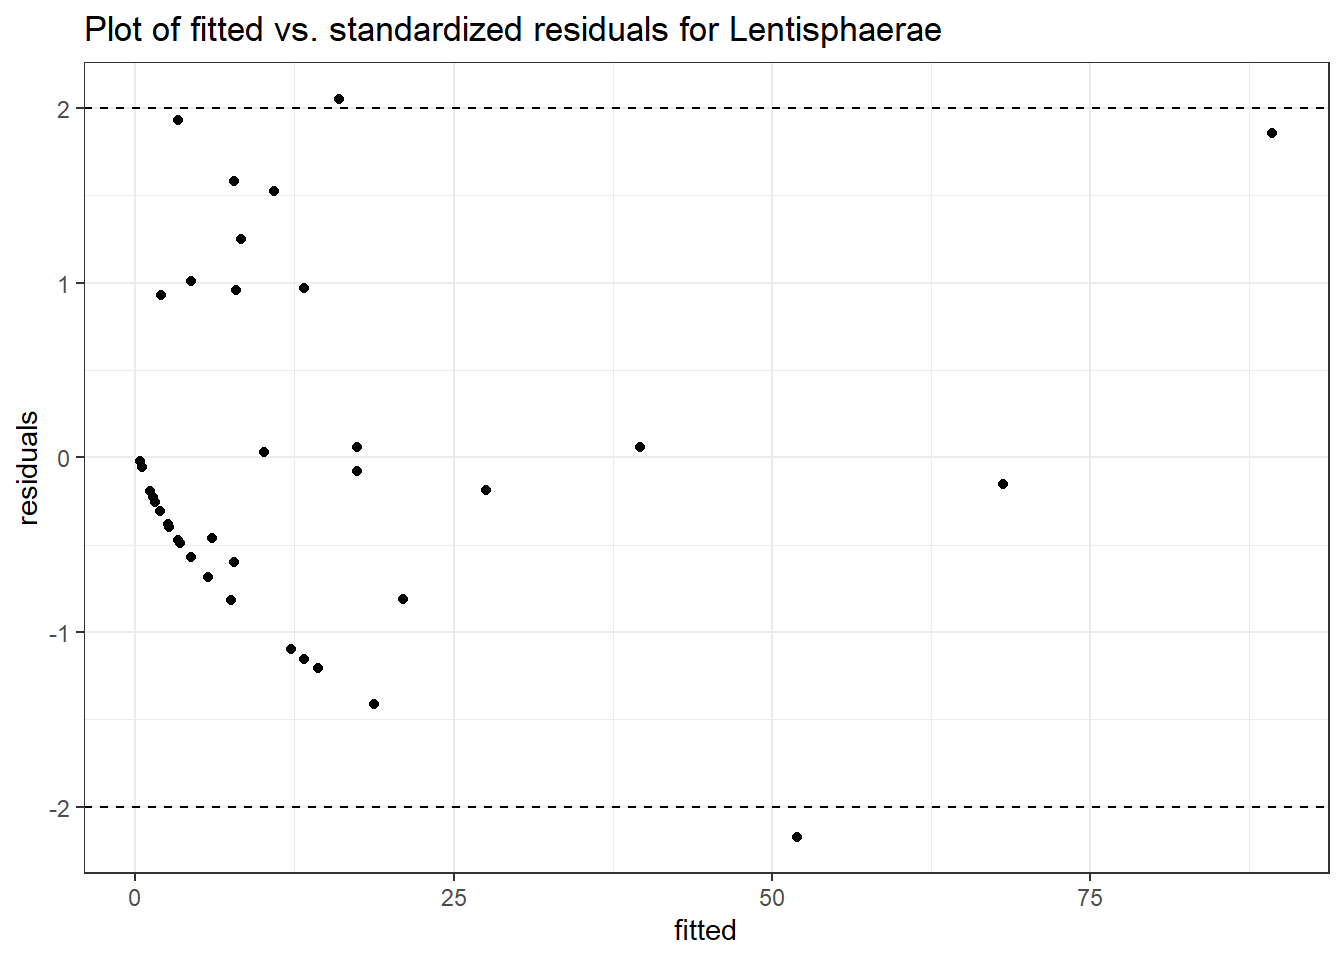
Fixed Effects (change in log)

                  Outcome Estimate Std. Error  z value Pr(>|z|)
(Intercept) Lentisphaerae  0.96215    0.86377  1.11390  0.26532
intB        Lentisphaerae  1.07069    0.85960  1.24557  0.21292
time        Lentisphaerae -0.27048    0.03999 -6.76290  0.00000
female      Lentisphaerae  0.87684    0.89764  0.97682  0.32866


Random Effects (SD on log scale)

 Groups    Name        Std.Dev.
 SubjectID (Intercept) 1.3553

Significance test not available

#########################################
#########################################
Model:  Proteobacteria ~ 1 + intB + time + female + (1 | SubjectID)
<environment: 0x000000000b5e7848>

Link:    poisson


Intraclass Correlation (ICC):   0.09272157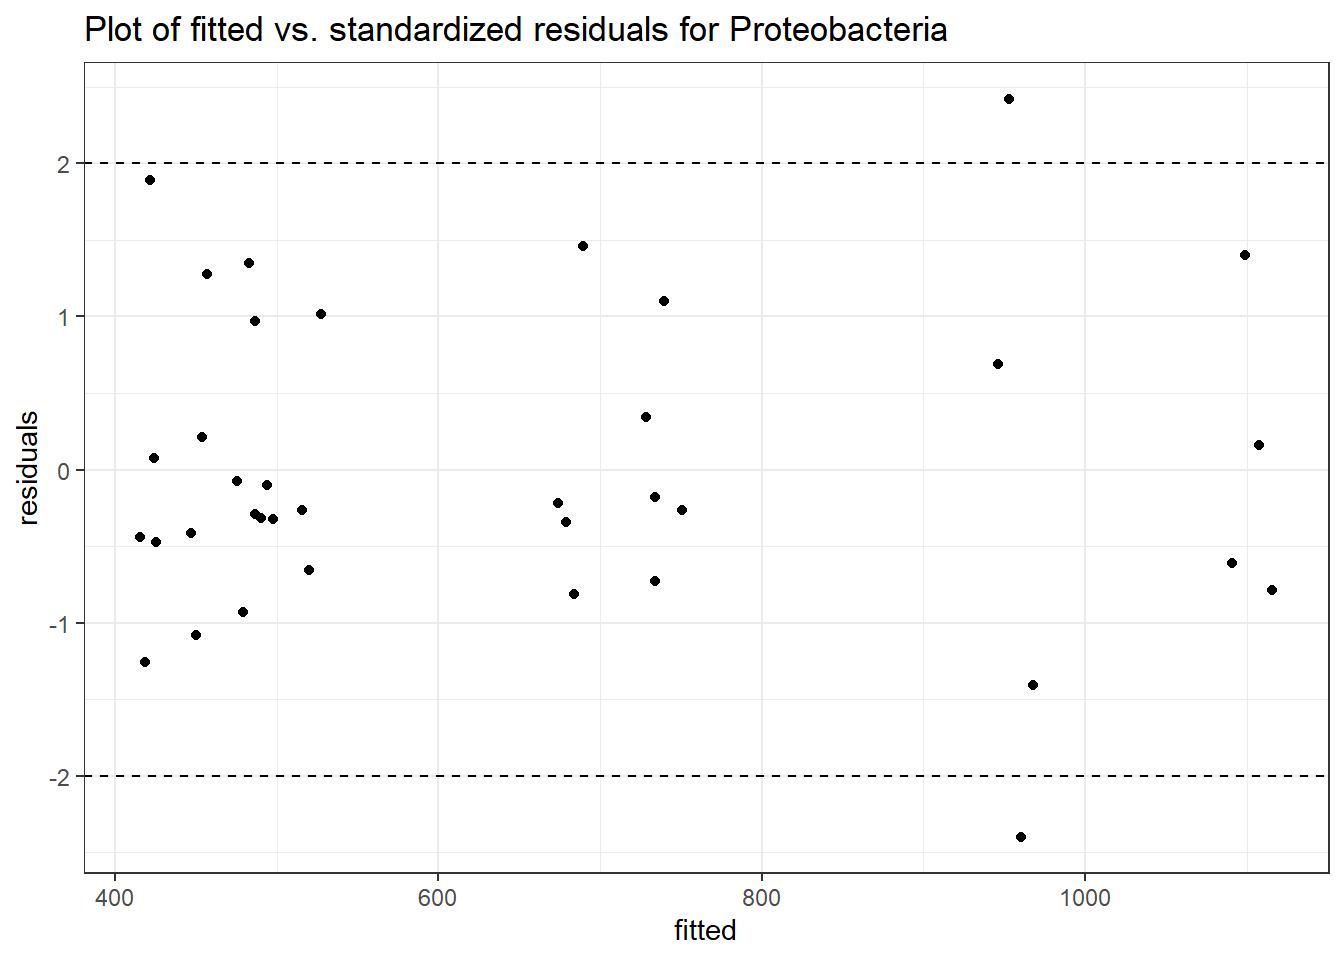
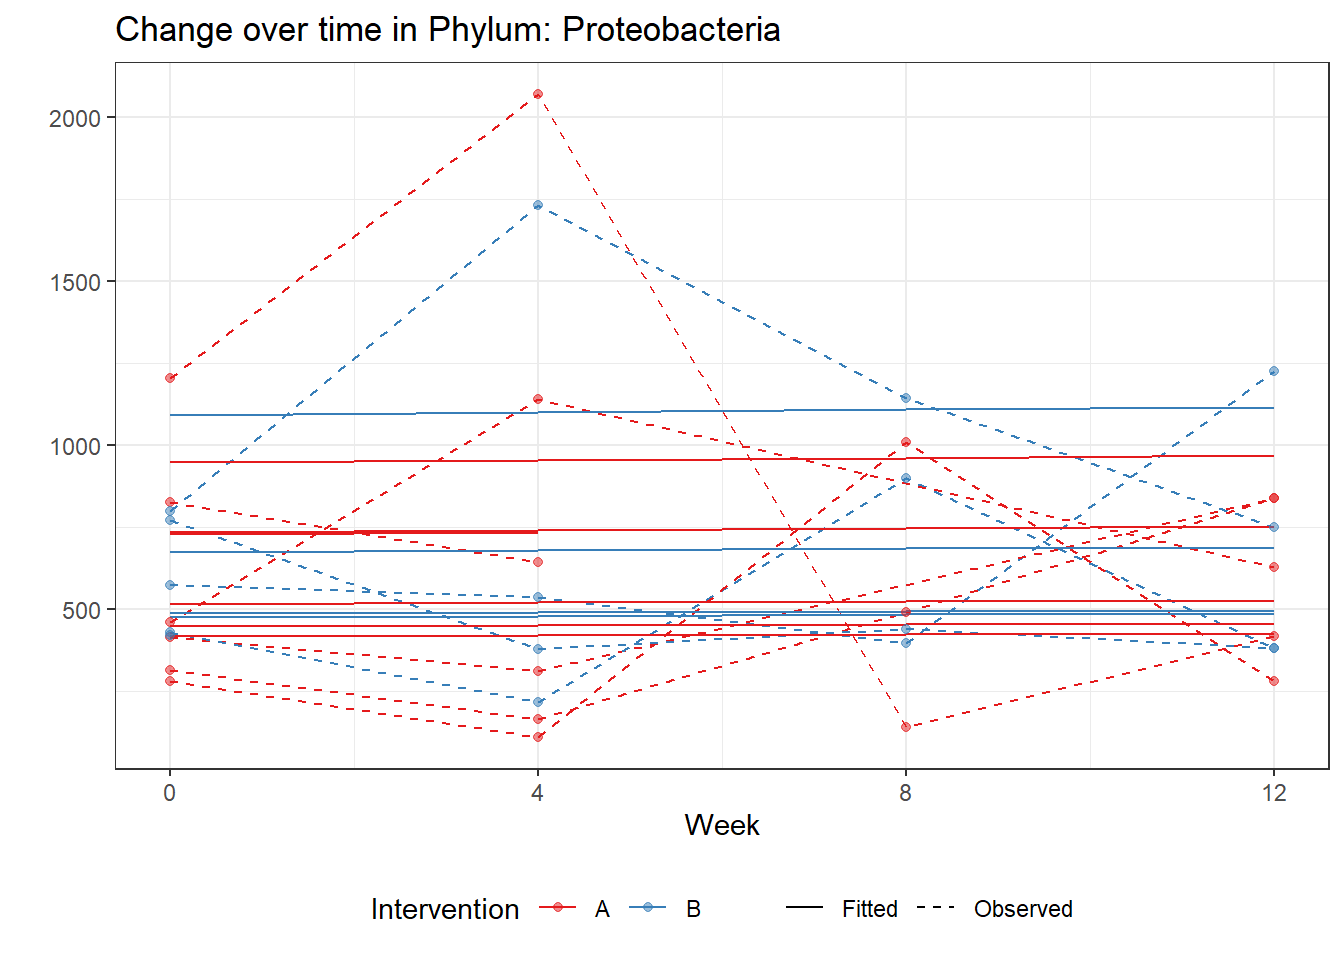
Fixed Effects (change in log)

                   Outcome Estimate Std. Error  z value Pr(>|z|)
(Intercept) Proteobacteria  6.38847    0.18772 34.03204  0.00000
intB        Proteobacteria -0.02001    0.19470 -0.10279  0.91813
time        Proteobacteria  0.00754    0.00585  1.28995  0.19707
female      Proteobacteria  0.02193    0.20147  0.10884  0.91333


Random Effects (SD on log scale)

 Groups    Name        Std.Dev.
 SubjectID (Intercept) 0.31968

Significance test not available

#########################################
#########################################
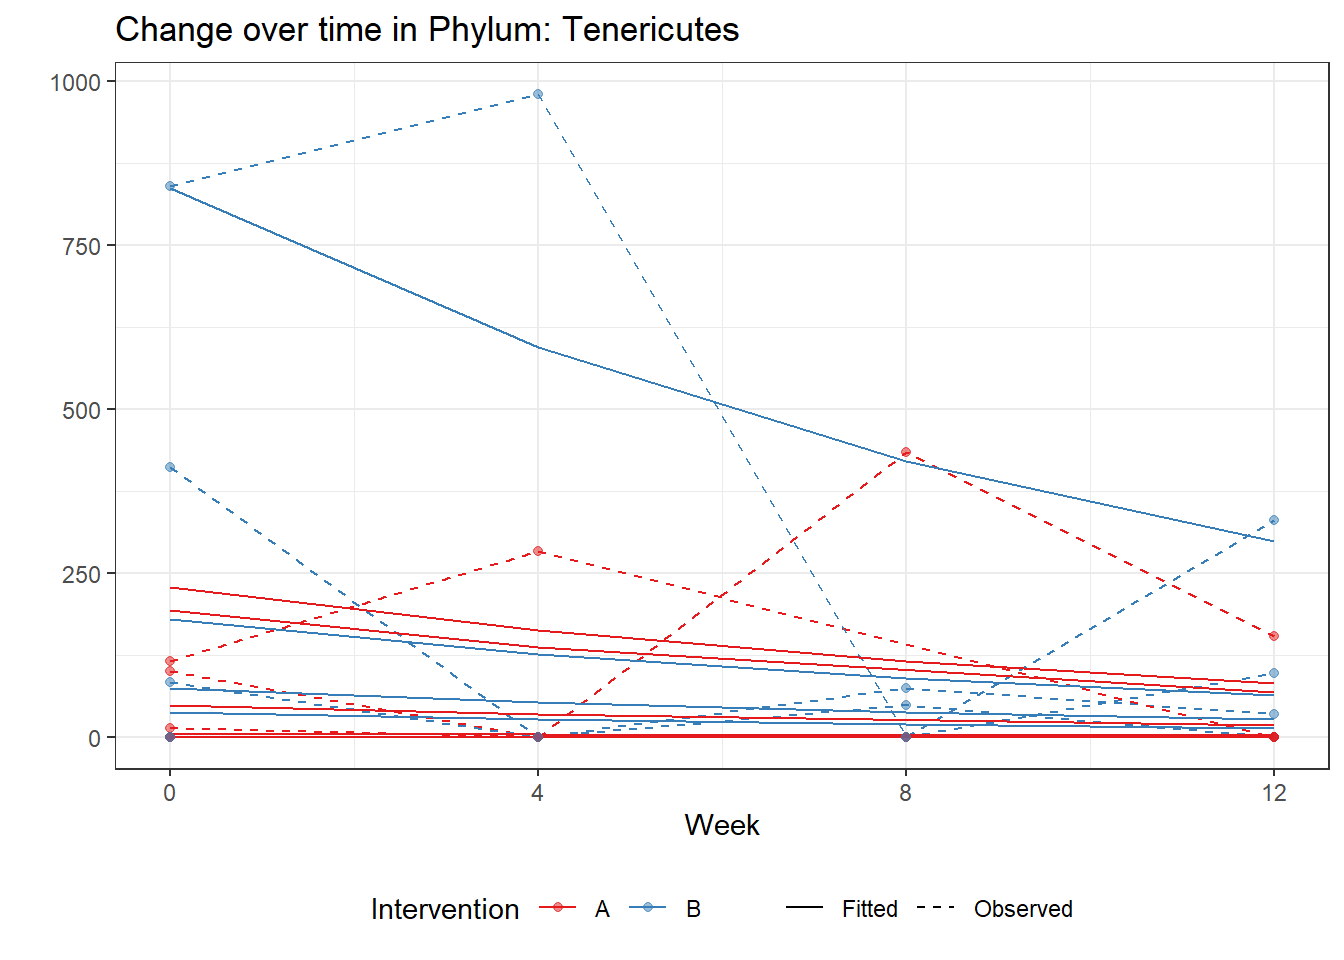
Model:  Tenericutes ~ 1 + intB + time + female + (1 | SubjectID)
<environment: 0x000000000b5e7848>

Link:    poisson


Intraclass Correlation (ICC):   0.9092078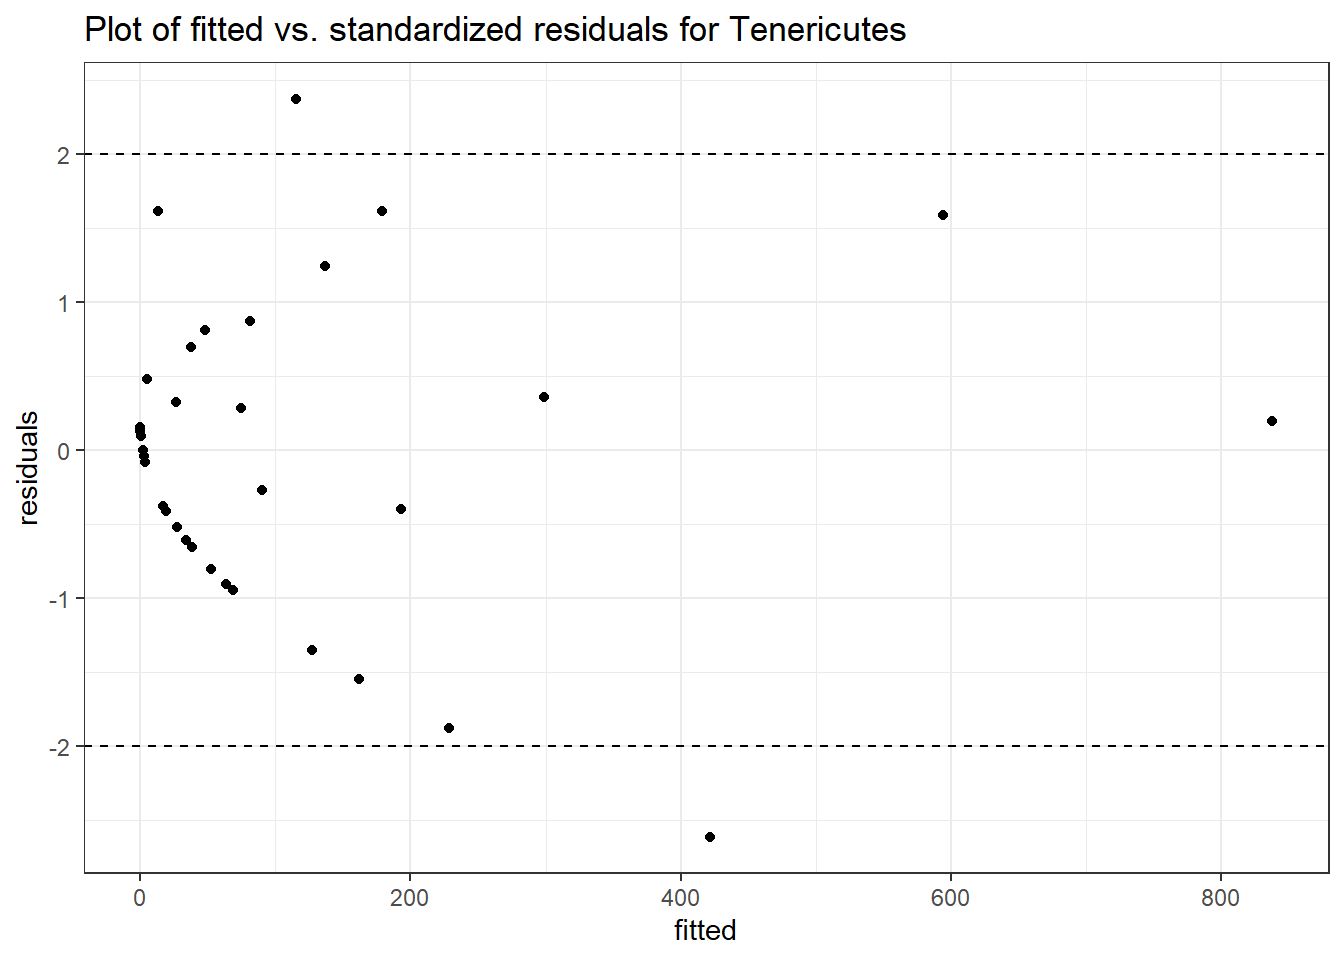
Fixed Effects (change in log)

                Outcome Estimate Std. Error   z value Pr(>|z|)
(Intercept) Tenericutes  1.35734    1.93308   0.70216  0.48258
intB        Tenericutes  1.89536    1.97158   0.96134  0.33638
time        Tenericutes -0.34364    0.01482 -23.18186  0.00000
female      Tenericutes  0.71077    2.04269   0.34796  0.72787


Random Effects (SD on log scale)

 Groups    Name        Std.Dev.
 SubjectID (Intercept) 3.1645

Significance test not available

#########################################
#########################################
Model:  Verrucomicrobia ~ 1 + intB + time + female + (1 | SubjectID)
<environment: 0x000000000b5e7848>

Link:    poisson


Intraclass Correlation (ICC):   0.8629325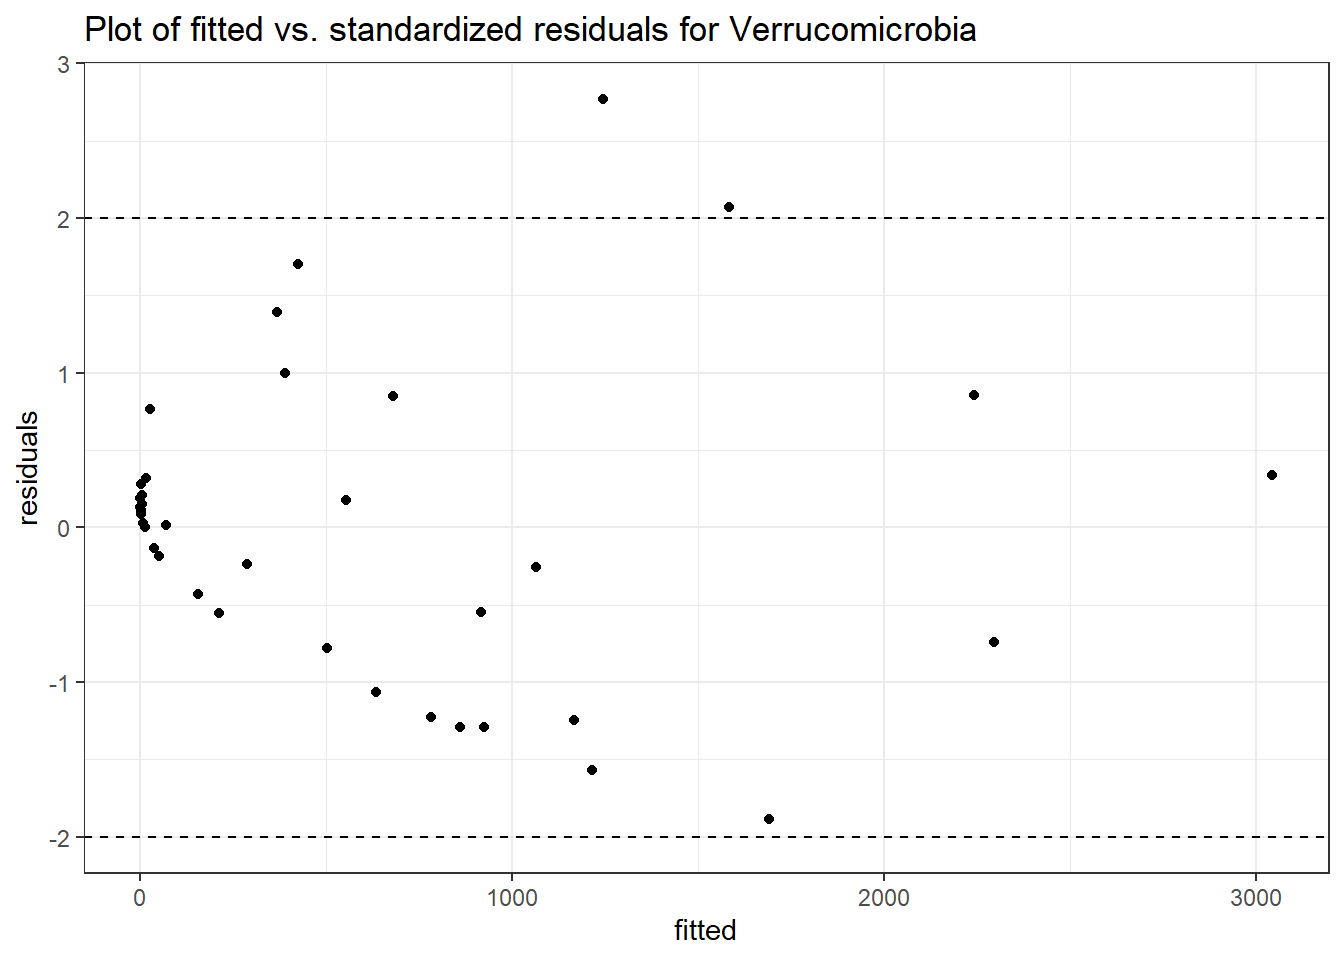
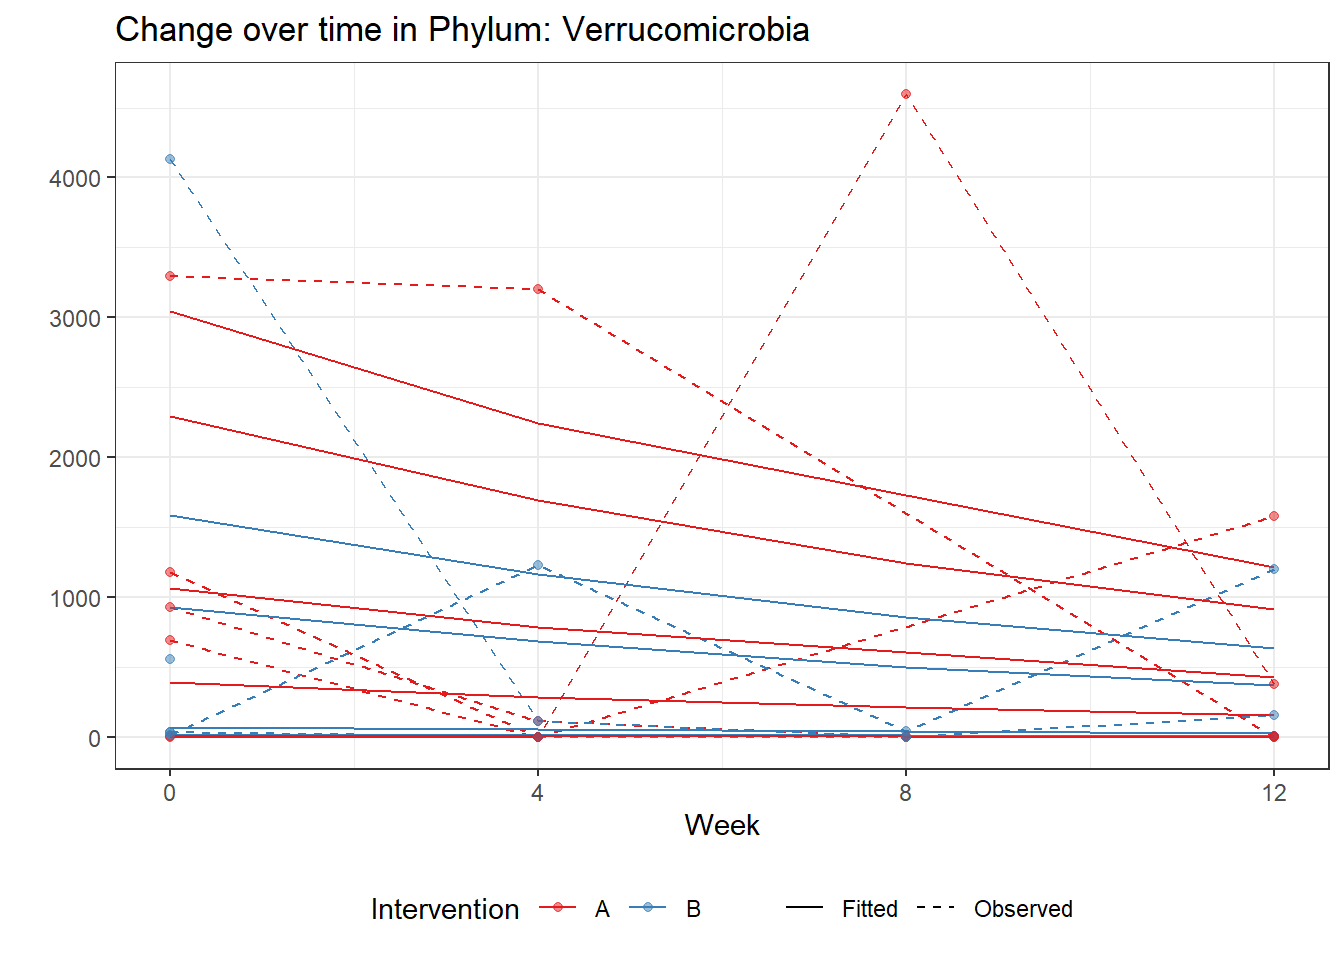
Fixed Effects (change in log)

                    Outcome Estimate Std. Error   z value Pr(>|z|)
(Intercept) Verrucomicrobia  3.73169    1.49123   2.50242  0.01233
intB        Verrucomicrobia  0.67678    1.53031   0.44225  0.65831
time        Verrucomicrobia -0.30578    0.00609 -50.22331  0.00000
female      Verrucomicrobia  1.84951    1.58984   1.16333  0.24470


Random Effects (SD on log scale)

 Groups    Name        Std.Dev.
 SubjectID (Intercept) 2.5091

Significance test not available
Microbiome Figure
mphyseq = psmelt(phylo_data)
mphyseq2 <- mphyseq %>%
  dplyr::group_by(SubjectID, Week) %>%
  dplyr::mutate(Total = sum(Abundance)) %>%
  dplyr::ungroup()%>%
  dplyr::group_by(SubjectID, Week, Phylum) %>%
  dplyr::mutate(PhylumAbund = sum(Abundance),
                RelAbund = PhylumAbund/Total)

mphyseq2 <- mphyseq2 %>% distinct(SubjectID, Week, Phylum, .keep_all = T)

keepVar <- c("SubjectID", "Week", "Intervention", "Phylum", "PhylumAbund", "RelAbund")

mphyseq2 <- mphyseq2[, keepVar]

# take out "__" at start of names
mphyseq2$Phylum <- substring(mphyseq2$Phylum, 3)

# get right number of colors for plotting
no_cols <- length(unique(mphyseq2$Phylum))

## Some Colors
colors_micro <- rev(c("grey90", rev(c("#00a2f2",  "#c91acb", "#7f5940", "#cc5200", "#00d957", "#40202d", "#e60099", "#006fa6", "#f29d3d", "#300059"))))

# Now get the intervention by time model
fe <- phylum.fit5$`Fixed Effects`$Actinobacteria
fe[,2]
[1] 3.08368 1.45591 0.09832 -0.56276get.data.with.trend <- function(data, fit){
data$Y <- 0
ph <- names(fit[[1]])
i <- 1
for(i in 1:length(ph)){
fe <- phylum.fit5[[1]][[ph[i]]][,2]
dat <- filter(data, Phylum == ph[i])
Y <- exp(fe[1] + fe[2]*as.numeric(as.factor(dat$Intervention)) + fe[3]*(as.numeric(dat$Week) - 1) + fe[4]*as.numeric(as.factor(dat$Intervention))*(as.numeric(dat$Week) - 1))
data$Y[data$Phylum == ph[i]] <- Y
}
return(data)
}
micro_data <- get.data.with.trend(mphyseq2, phylum.fit5)
micro_data$Week <- (as.numeric(micro_data$Week)-1)*4
p <- ggplot(micro_data, aes(Week, PhylumAbund))+
geom_jitter(height=0, width=0.25) +
#geom_line(data=micro_data, aes(x=Week, y=Y, group=Intervention, color=Intervention)) +
facet_wrap(.~Phylum, ncol = 5, scales = "free") +
labs(y="Phylum Abundance") +
theme(panel.grid = element_blank(),
strip.background =element_blank(),
legend.position = "bottom")
p
sessionInfo()R version 3.6.3 (2020-02-29)
Platform: x86_64-w64-mingw32/x64 (64-bit)
Running under: Windows 10 x64 (build 18362)
Matrix products: default
locale:
[1] LC_COLLATE=English_United States.1252
[2] LC_CTYPE=English_United States.1252
[3] LC_MONETARY=English_United States.1252
[4] LC_NUMERIC=C
[5] LC_TIME=English_United States.1252
attached base packages:
[1] stats graphics grDevices utils datasets methods base
other attached packages:
[1] car_3.0-7 carData_3.0-3 gvlma_1.0.0.3 patchwork_1.0.0
[5] viridis_0.5.1 viridisLite_0.3.0 gridExtra_2.3 xtable_1.8-4
[9] kableExtra_1.1.0 plyr_1.8.6 data.table_1.12.8 readxl_1.3.1
[13] forcats_0.5.0 stringr_1.4.0 dplyr_0.8.5 purrr_0.3.4
[17] readr_1.3.1 tidyr_1.0.2 tibble_3.0.1 ggplot2_3.3.0
[21] tidyverse_1.3.0 lmerTest_3.1-2 lme4_1.1-23 Matrix_1.2-18
[25] vegan_2.5-6 lattice_0.20-38 permute_0.9-5 phyloseq_1.30.0
[29] workflowr_1.6.2
loaded via a namespace (and not attached):
[1] minqa_1.2.4 colorspace_1.4-1 rio_0.5.16
[4] ellipsis_0.3.0 rprojroot_1.3-2 XVector_0.26.0
[7] fs_1.4.1 rstudioapi_0.11 farver_2.0.3
[10] fansi_0.4.1 lubridate_1.7.8 xml2_1.3.2
[13] codetools_0.2-16 splines_3.6.3 knitr_1.28
[16] ade4_1.7-15 jsonlite_1.6.1 nloptr_1.2.2.1
[19] broom_0.5.6 cluster_2.1.0 dbplyr_1.4.3
[22] compiler_3.6.3 httr_1.4.1 backports_1.1.6
[25] assertthat_0.2.1 cli_2.0.2 later_1.0.0
[28] htmltools_0.4.0 tools_3.6.3 igraph_1.2.5
[31] gtable_0.3.0 glue_1.4.0 reshape2_1.4.4
[34] Rcpp_1.0.4.6 Biobase_2.46.0 cellranger_1.1.0
[37] vctrs_0.2.4 Biostrings_2.54.0 multtest_2.42.0
[40] ape_5.3 nlme_3.1-144 iterators_1.0.12
[43] xfun_0.13 openxlsx_4.1.4 rvest_0.3.5
[46] lifecycle_0.2.0 statmod_1.4.34 zlibbioc_1.32.0
[49] MASS_7.3-51.5 scales_1.1.0 hms_0.5.3
[52] promises_1.1.0 parallel_3.6.3 biomformat_1.14.0
[55] rhdf5_2.30.1 RColorBrewer_1.1-2 curl_4.3
[58] yaml_2.2.1 stringi_1.4.6 S4Vectors_0.24.4
[61] foreach_1.5.0 BiocGenerics_0.32.0 zip_2.0.4
[64] boot_1.3-24 rlang_0.4.5 pkgconfig_2.0.3
[67] evaluate_0.14 Rhdf5lib_1.8.0 labeling_0.3
[70] tidyselect_1.0.0 magrittr_1.5 R6_2.4.1
[73] IRanges_2.20.2 generics_0.0.2 DBI_1.1.0
[76] foreign_0.8-75 pillar_1.4.4 haven_2.2.0
[79] whisker_0.4 withr_2.2.0 mgcv_1.8-31
[82] abind_1.4-5 survival_3.1-8 modelr_0.1.7
[85] crayon_1.3.4 rmarkdown_2.1 grid_3.6.3
[88] git2r_0.27.1 reprex_0.3.0 digest_0.6.25
[91] webshot_0.5.2 httpuv_1.5.2 numDeriv_2016.8-1.1
[94] stats4_3.6.3 munsell_0.5.0