k10_Explore
Last updated: 2021-07-05
Checks: 5 2
Knit directory: Embryoid_Body_Pilot_Workflowr/analysis/
This reproducible R Markdown analysis was created with workflowr (version 1.6.2). The Checks tab describes the reproducibility checks that were applied when the results were created. The Past versions tab lists the development history.
The R Markdown is untracked by Git. To know which version of the R Markdown file created these results, you'll want to first commit it to the Git repo. If you're still working on the analysis, you can ignore this warning. When you're finished, you can run wflow_publish to commit the R Markdown file and build the HTML.
Great job! The global environment was empty. Objects defined in the global environment can affect the analysis in your R Markdown file in unknown ways. For reproduciblity it's best to always run the code in an empty environment.
The command set.seed(20200804) was run prior to running the code in the R Markdown file. Setting a seed ensures that any results that rely on randomness, e.g. subsampling or permutations, are reproducible.
Great job! Recording the operating system, R version, and package versions is critical for reproducibility.
Nice! There were no cached chunks for this analysis, so you can be confident that you successfully produced the results during this run.
Using absolute paths to the files within your workflowr project makes it difficult for you and others to run your code on a different machine. Change the absolute path(s) below to the suggested relative path(s) to make your code more reproducible.
| absolute | relative |
|---|---|
| /project2/gilad/katie/Pilot_HumanEBs/Embryoid_Body_Pilot_Workflowr/output/mergedObjects/Harmony.Batchindividual.rds | ../output/mergedObjects/Harmony.Batchindividual.rds |
| /project2/gilad/katie/Pilot_HumanEBs/Embryoid_Body_Pilot_Workflowr/output/fasttopics/k10.4v7.pluripotentsubset.diff_count.Rdata | ../output/fasttopics/k10.4v7.pluripotentsubset.diff_count.Rdata |
| /project2/gilad/katie/Pilot_HumanEBs/Embryoid_Body_Pilot_Workflowr/output/TopicModelling_k10_top10drivergenes.byBeta.csv | ../output/TopicModelling_k10_top10drivergenes.byBeta.csv |
Great! You are using Git for version control. Tracking code development and connecting the code version to the results is critical for reproducibility.
The results in this page were generated with repository version c8767ac. See the Past versions tab to see a history of the changes made to the R Markdown and HTML files.
Note that you need to be careful to ensure that all relevant files for the analysis have been committed to Git prior to generating the results (you can use wflow_publish or wflow_git_commit). workflowr only checks the R Markdown file, but you know if there are other scripts or data files that it depends on. Below is the status of the Git repository when the results were generated:
Ignored files:
    Ignored:    .Rhistory
    Ignored:    .Rproj.user/
    Ignored:    analysis/.Rhistory
    Ignored:    output/.Rhistory

Untracked files:
    Untracked:  GSE122380_raw_counts.txt.gz
    Untracked:  UTF1_plots.Rmd
    Untracked:  analysis/IntegrateReference_SCTregressCaoPlusScHCL_JustEarlyEcto.Rmd
    Untracked:  analysis/IntegrateReference_SCTregressCaoPlusScHCL_JustEndo.Rmd
    Untracked:  analysis/IntegrateReference_SCTregressCaoPlusScHCL_JustMeso.Rmd
    Untracked:  analysis/IntegrateReference_SCTregressCaoPlusScHCL_JustNeuralCrest.Rmd
    Untracked:  analysis/IntegrateReference_SCTregressCaoPlusScHCL_JustNeuron.Rmd
    Untracked:  analysis/IntegrateReference_SCTregressCaoPlusScHCL_JustPluri.Rmd
    Untracked:  analysis/OLD/
    Untracked:  analysis/Pseudobulk_Limma_Harmony.BatchIndividual_ClusterRes0.8_minPCT0.2.Rmd
    Untracked:  analysis/Pseudobulk_Limma_Harmony.BatchIndividual_ClusterRes1_minPCT0.2.Rmd
    Untracked:  analysis/Pseudobulk_VariancePartition_Harmony.Batchindividual_ClusterRes0.1_byCluster.Rmd
    Untracked:  analysis/RefInt_ComparingFulltoPartialIntegrationAnnotations.Rmd
    Untracked:  analysis/ReferenceAnn_DE.Rmd
    Untracked:  analysis/SingleCell_HierarchicalClustering_NoGeneFilter.Rmd
    Untracked:  analysis/SingleCell_VariancePartitionByCluster_Harmony.Batchindividual_ClusterRes0.1_minPCT0.2.Rmd
    Untracked:  analysis/VarPartPlots_res0.1_SCT.Rmd
    Untracked:  analysis/VarPart_SC_res0.1_SCT.Rmd
    Untracked:  analysis/child/
    Untracked:  analysis/k10topics_Explore.Rmd
    Untracked:  analysis/k6topics_Explore.Rmd
    Untracked:  build_refint_scale.R
    Untracked:  build_refint_sct.R
    Untracked:  build_stuff.R
    Untracked:  build_varpart_sc.R
    Untracked:  code/.ipynb_checkpoints/
    Untracked:  code/CellRangerPreprocess.Rmd
    Untracked:  code/ConvertToDGE.Rmd
    Untracked:  code/ConvertToDGE_PseudoBulk.Rmd
    Untracked:  code/ConvertToDGE_SingleCellRes_minPCT0.2.Rmd
    Untracked:  code/EB.getHumanMetadata.Rmd
    Untracked:  code/GEO_processed_data.Rmd
    Untracked:  code/PowerAnalysis_NoiseRatio.ipynb
    Untracked:  code/Untitled.ipynb
    Untracked:  code/Untitled1.ipynb
    Untracked:  code/compile_fits.Rmd
    Untracked:  code/fit_all_models.sh
    Untracked:  code/fit_poisson_nmf.R
    Untracked:  code/fit_poisson_nmf.sbatch
    Untracked:  code/functions_for_fit_comparison.Rmd
    Untracked:  code/get_genelist_byPCTthresh.Rmd
    Untracked:  code/prefit_poisson_nmf.R
    Untracked:  code/prefit_poisson_nmf.sbatch
    Untracked:  code/prepare_data_for_fastTopics.Rmd
    Untracked:  data/HCL_Fig1_adata.h5ad
    Untracked:  data/HCL_Fig1_adata.h5seurat
    Untracked:  data/dge/
    Untracked:  data/dge_raw_data.tar.gz
    Untracked:  data/ref.expr.rda
    Untracked:  figure/
    Untracked:  output/CR_sampleQCrds/
    Untracked:  output/CaoEtAl.Obj.CellsOfAllClusters.ProteinCodingGenes.rds
    Untracked:  output/CaoEtAl.Obj.rds
    Untracked:  output/ClusterInfo_res0.1.csv
    Untracked:  output/DGELists/
    Untracked:  output/DownSampleVarPart.rds
    Untracked:  output/Frequency.MostCommonAnnotation.FiveNearestRefCells.csv
    Untracked:  output/GEOsubmissionProcessedFiles/
    Untracked:  output/GeneLists_by_minPCT/
    Untracked:  output/MostCommonAnnotation.FiveNearestRefCells.csv
    Untracked:  output/NearestReferenceCell.Cao.hESC.EuclideanDistanceinHarmonySpace.csv
    Untracked:  output/NearestReferenceCell.Cao.hESC.FrequencyofEachAnnotation.csv
    Untracked:  output/NearestReferenceCell.SCTregressRNAassay.Cao.hESC.EuclideanDistanceinHarmonySpace.csv
    Untracked:  output/NearestReferenceCell.SCTregressRNAassay.Cao.hESC.FrequencyofEachAnnotation.csv
    Untracked:  output/Pseudobulk_Limma_res0.1_OnevAllTopTables.csv
    Untracked:  output/Pseudobulk_Limma_res0.1_OnevAll_top10Upregby_adjP.csv
    Untracked:  output/Pseudobulk_Limma_res0.1_OnevAll_top10Upregby_logFC.csv
    Untracked:  output/Pseudobulk_Limma_res0.5_OnevAllTopTables.csv
    Untracked:  output/Pseudobulk_Limma_res0.8_OnevAllTopTables.csv
    Untracked:  output/Pseudobulk_Limma_res1_OnevAllTopTables.csv
    Untracked:  output/Pseudobulk_VarPart.ByCluster.Res0.1.rds
    Untracked:  output/ResidualVariances_fromDownSampAnalysis.csv
    Untracked:  output/SingleCell_VariancePartition_RNA_Res0.1_minPCT0.2.rds
    Untracked:  output/SingleCell_VariancePartition_Res0.1_minPCT0.2.rds
    Untracked:  output/SingleCell_VariancePartition_SCT_Res0.1_minPCT0.2.rds
    Untracked:  output/TopicModelling_k10_top10drivergenes.byBeta.csv
    Untracked:  output/TopicModelling_k6_top10drivergenes.byBeta.csv
    Untracked:  output/TopicModelling_k6_top15drivergenes.byZ.csv
    Untracked:  output/TranferredAnnotations_ReferenceInt_JustEarlyEcto.csv
    Untracked:  output/TranferredAnnotations_ReferenceInt_JustEndoderm.csv
    Untracked:  output/TranferredAnnotations_ReferenceInt_JustMeso.csv
    Untracked:  output/TranferredAnnotations_ReferenceInt_JustNeuralCrest.csv
    Untracked:  output/TranferredAnnotations_ReferenceInt_JustNeuron.csv
    Untracked:  output/TranferredAnnotations_ReferenceInt_JustPluripotent.csv
    Untracked:  output/VarPart.ByCluster.Res0.1.rds
    Untracked:  output/azimuth/
    Untracked:  output/downsamp_10800cells_10subreps_medianexplainedbyresiduals_varpart_PsB.rds
    Untracked:  output/downsamp_16200cells_10subreps_medianexplainedbyresiduals_varpart_PsB.rds
    Untracked:  output/downsamp_21600cells_10subreps_medianexplainedbyresiduals_varpart_PsB.rds
    Untracked:  output/downsamp_2700cells_10subreps_medianexplainedbyresiduals_varpart_PsB.rds
    Untracked:  output/downsamp_2700cells_10subreps_medianexplainedbyresiduals_varpart_scres.rds
    Untracked:  output/downsamp_5400cells_10subreps_medianexplainedbyresiduals_varpart_PsB.rds
    Untracked:  output/downsamp_7200cells_10subreps_medianexplainedbyresiduals_varpart_PsB.rds
    Untracked:  output/fasttopics/
    Untracked:  output/figs/
    Untracked:  output/merge.Cao.SCTwRegressOrigIdent.rds
    Untracked:  output/merge.all.SCTwRegressOrigIdent.Harmony.rds
    Untracked:  output/merged.SCT.counts.matrix.rds
    Untracked:  output/merged.raw.counts.matrix.rds
    Untracked:  output/mergedObjects/
    Untracked:  output/pdfs/
    Untracked:  output/sampleQCrds/
    Untracked:  output/splitgpm_gsea_results/
    Untracked:  slurm-12005914.out
    Untracked:  slurm-12005923.out

Unstaged changes:
    Deleted:    analysis/IntegrateAnalysis.afterFilter.HarmonyBatch.Rmd
    Deleted:    analysis/IntegrateAnalysis.afterFilter.HarmonyBatchSampleIDindividual.Rmd
    Modified:   analysis/IntegrateAnalysis.afterFilter.HarmonyBatchindividual.Rmd
    Deleted:    analysis/IntegrateAnalysis.afterFilter.NOHARMONYjustmerge.Rmd
    Deleted:    analysis/IntegrateAnalysis.afterFilter.SCTregressBatchIndividual.Rmd
    Deleted:    analysis/IntegrateAnalysis.afterFilter.SCTregressBatchIndividualHarmonyBatchindividual.Rmd
    Modified:   analysis/Pseudobulk_HierarchicalClustering_Harmony.Batchindividual_ClusterRes0.1_minPCT0.2.Rmd
    Modified:   analysis/Pseudobulk_HierarchicalClustering_Harmony.Batchindividual_ClusterRes0.5_minPCT0.2.Rmd
    Modified:   analysis/Pseudobulk_HierarchicalClustering_Harmony.Batchindividual_ClusterRes0.8_minPCT0.2.Rmd
    Modified:   analysis/Pseudobulk_HierarchicalClustering_Harmony.Batchindividual_ClusterRes1_minPCT0.2.Rmd
    Modified:   analysis/Pseudobulk_Limma_Harmony.BatchIndividual_ClusterRes0.1_minPCT0.2.Rmd
    Modified:   analysis/Pseudobulk_Limma_Harmony.BatchIndividual_ClusterRes0.5_minPCT0.2.Rmd
    Modified:   analysis/Pseudobulk_VariancePartition_Harmony.Batchindividual_ClusterRes0.1_minPCT0.2.Rmd
    Modified:   analysis/Pseudobulk_VariancePartition_Harmony.Batchindividual_ClusterRes0.5_minPCT0.2.Rmd
    Modified:   analysis/Pseudobulk_VariancePartition_Harmony.Batchindividual_ClusterRes0.8_minPCT0.2.Rmd
    Modified:   analysis/Pseudobulk_VariancePartition_Harmony.Batchindividual_ClusterRes1_minPCT0.2.Rmd
    Deleted:    analysis/RunscHCL_HarmonyBatchInd.Rmd
Note that any generated files, e.g. HTML, png, CSS, etc., are not included in this status report because it is ok for generated content to have uncommitted changes.
There are no past versions. Publish this analysis with wflow_publish() to start tracking its development.
library(fastTopics)
library(Matrix)
library(ggplot2)
library(Seurat)
library(cowplot)
library(dplyr)
Attaching package: 'dplyr'The following objects are masked from 'package:stats':
filter, lagThe following objects are masked from 'package:base':
intersect, setdiff, setequal, unionlibrary(tibble)load data
load("/project2/gilad/katie/Pilot_HumanEBs/fastTopics/prepared_data_YorubaOnly_genesExpressedInMoreThan10Cells.RData")merged<-readRDS("/project2/gilad/katie/Pilot_HumanEBs/Embryoid_Body_Pilot_Workflowr/output/mergedObjects/Harmony.Batchindividual.rds")#Ran this in Enrichments.Rmd
timing<- system.time(diff_count_res <- diff_count_analysis(fit, counts))load("/project2/gilad/katie/Pilot_HumanEBs/fastTopics/pathways/diff_count_res_scd-ex-k=10.RData")fit<- readRDS("/project2/gilad/katie/Pilot_HumanEBs/fastTopics/fit-scd-ex-k=10.rds")$fitsummary(fit)Model overview:
Number of data rows, n: 42488
Number of data cols, m: 17623
Rank/Number of topics, k: 10
Evaluation of fit (1500 updates performed):
Log-likelihood: -5.091346217553e+08
Deviance: +5.020738080295e+08
Max KKT residual: +2.054378e-03
Size factors:
Min 1Q Median 3Q Max
3455.00 9001.00 16712.00 34599.25 162277.00
Topic proportions:
<0.1 0.1-0.5 0.5-0.9 >0.9
k1 39705 2678 105 0
k2 41876 495 100 17
k3 19723 22759 6 0
k4 23968 17616 904 0
k5 26557 15926 5 0
k6 24081 17049 1358 0
k7 27458 15022 8 0
k8 38882 2447 1159 0
k9 11749 30682 57 0
k10 21237 20973 278 0
Topic representatives:
k1 k2 k3 k4 k5 k6 k7 k8
Batch1_Lane1_GTGTTAGCAAGACCGA 0.784 0.000 0.078 0.000 0.000 0.025 0.031 0.031
Batch2_Lane3_GTTACAGGTTTGATCG 0.000 0.998 0.000 0.000 0.001 0.000 0.001 0.000
Batch1_Lane6_AGGTGTTCAATGAGCG 0.002 0.000 0.521 0.120 0.000 0.003 0.177 0.000
Batch1_Lane8_AGCGTCGCAGAACATA 0.013 0.000 0.115 0.650 0.000 0.000 0.000 0.005
Batch1_Lane3_GTGTGGCGTGATGTAA 0.000 0.000 0.000 0.000 0.560 0.281 0.101 0.000
Batch3_Lane3_TCATGCCGTTCAATCG 0.000 0.000 0.009 0.010 0.000 0.873 0.087 0.000
Batch2_Lane1_CCTGTTGAGGATATAC 0.008 0.001 0.215 0.055 0.057 0.021 0.632 0.012
Batch3_Lane3_ACATGCACAACCGACC 0.000 0.000 0.000 0.000 0.000 0.002 0.016 0.820
Batch3_Lane4_GATCATGTCAGGTAAA 0.000 0.000 0.060 0.250 0.000 0.001 0.110 0.000
Batch1_Lane9_ACTGATGGTAACGTTC 0.009 0.000 0.055 0.005 0.014 0.152 0.025 0.040
k9 k10
Batch1_Lane1_GTGTTAGCAAGACCGA 0.000 0.051
Batch2_Lane3_GTTACAGGTTTGATCG 0.000 0.000
Batch1_Lane6_AGGTGTTCAATGAGCG 0.024 0.150
Batch1_Lane8_AGCGTCGCAGAACATA 0.085 0.132
Batch1_Lane3_GTGTGGCGTGATGTAA 0.057 0.000
Batch3_Lane3_TCATGCCGTTCAATCG 0.021 0.000
Batch2_Lane1_CCTGTTGAGGATATAC 0.000 0.000
Batch3_Lane3_ACATGCACAACCGACC 0.156 0.006
Batch3_Lane4_GATCATGTCAGGTAAA 0.571 0.008
Batch1_Lane9_ACTGATGGTAACGTTC 0.002 0.698#structure plot
clrs2<- c("#8dd3c7", "#ffffb3", "#bebada", "#fb8072", "#80b1d3", "#fdb462", "#b3de69", "#fccde5", "#d9d9d9", "#bc80bd", "#ccebc5", "#ffed6f", "#a6cee3", "#1f78b4", "midnightblue", "#33a02c", "#fb9a99", "#e31a1c", "#fdbf6f", "#ff7f00", "#cab2d6", "#6a3d9a", "#ffff99", "#b15928", "darkseagreen4", "darkorange3", "darkorchid4", "palevioletred2", "khaki3", "cornsilk3")
structure_plot(fit,topics=c("k3","k2","k1","k6","k4","k5", "k7", "k8", "k9","k10"), n=5000,num_threads=5, perplexity = 1000, colors = clrs2, verbose=F)
#grouped according to the 1-d t-SNE embedding
#
#structure plot divided by seurat clusters at various resolutions
structure_plot(fit,
grouping=factor(merged@meta.data$SCT_snn_res.0.1, c("0", "1", "2", "3", "4", "5", "6")),
topics =c("k3","k2","k1","k6","k4","k5", "k7", "k8", "k9","k10"),
gap=100,
perplexity=20,
num_threads = 4,
n=10000,
verbose = F)
#In t-SNE, perplexity balances local and global aspects of the data. It can be interpreted as the number of close neighbors associated with each point. The suggested range for perplexity is 5 to 50. Since t-SNE is probabilistic and also has the perplexity parameter, it is a very flexible method. However, this may make one a bit suspicious about the results. Note that t-SNE is not suitable for settings such as supervised learning because the resulting dimensions lack interpretability.structure_plot(fit,
grouping=factor(merged@meta.data$SCT_snn_res.0.5),
topics = c("k3","k2","k1","k6","k4","k5", "k7", "k8", "k9","k10"),
gap=100,
perplexity=20,
num_threads = 4,
n=10000,
verbose = F)
names<- paste0("k10.",colnames(fit$L))
merged<- AddMetaData(merged, poisson2multinom(fit)$L, col.name = names)
feat<- list()
for(i in 1:ncol(fit$F)){
feat[[i]]<- FeaturePlot(merged, features = paste0("k10.k",i))
}
feat[[1]]
[[2]]
[[3]]
[[4]]
[[5]]
[[6]]
[[7]]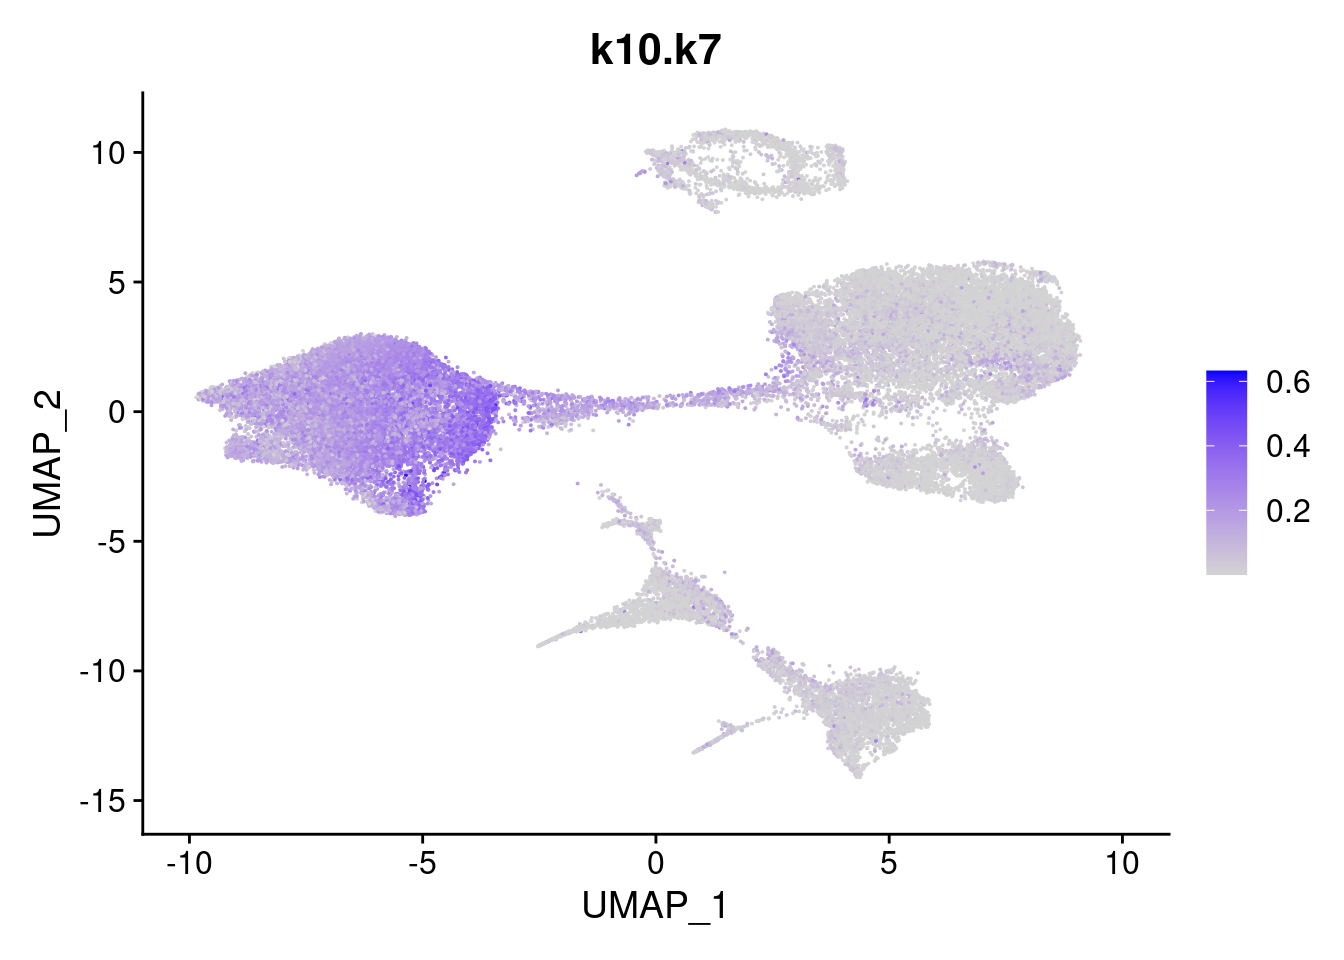
[[8]]
[[9]]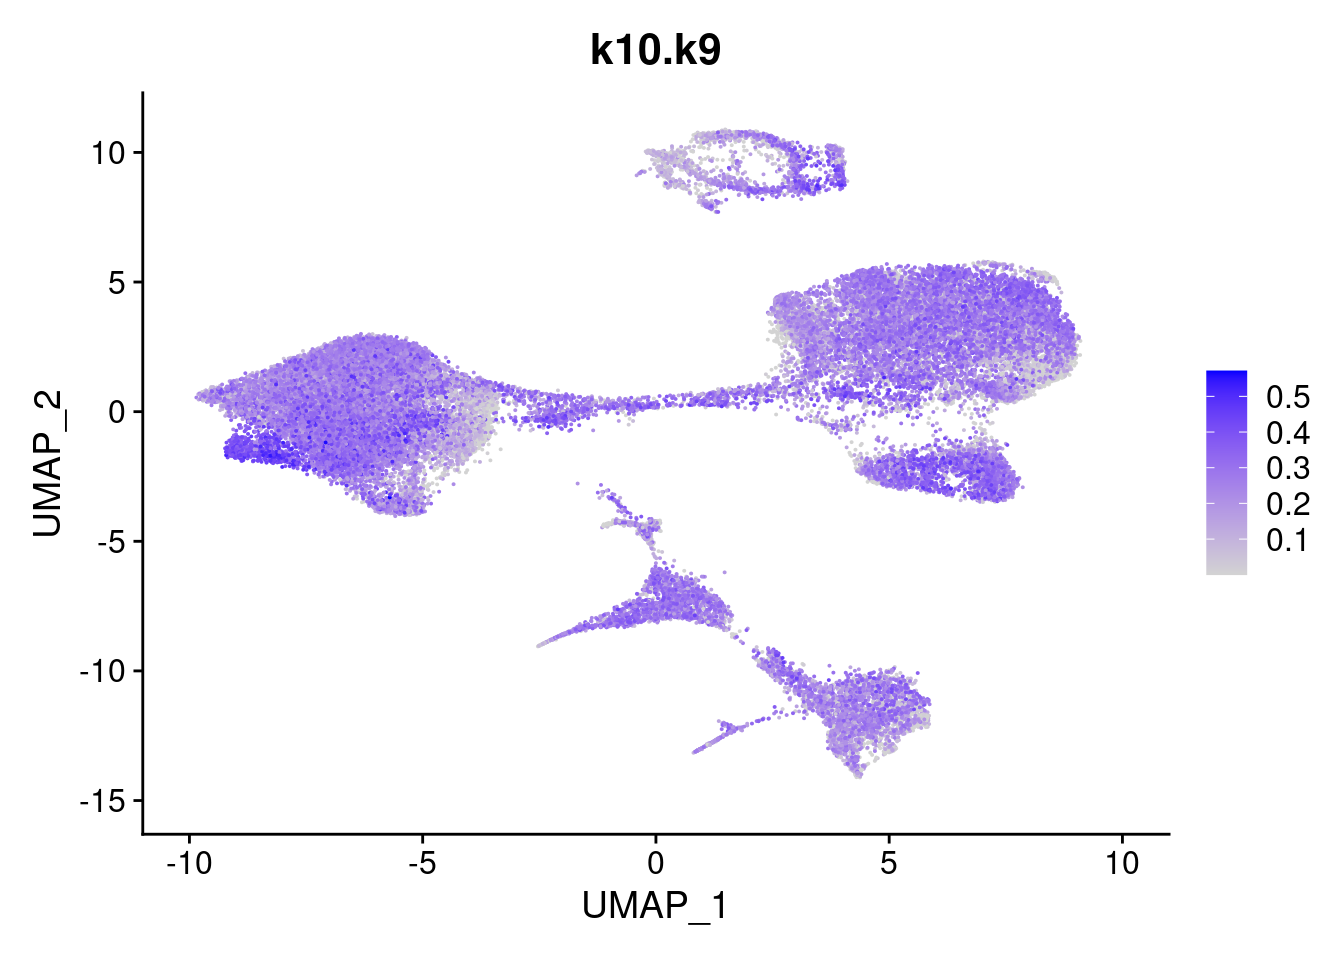
[[10]]
clust<- c("SCT_snn_res.0.1", "SCT_snn_res.0.5", "SCT_snn_res.0.8", "SCT_snn_res.1")
cres<- list()
for(i in 1:length(clust)){
  cres[[i]]<- DimPlot(merged, group.by = clust[i])
}
cres
[[1]]
[[2]]
[[3]]
[[4]]
lps<- NULL
for ( i in 1:length(clust)){
lps[[i]]<- loadings_plot(poisson2multinom(fit), as.factor(merged@meta.data[,clust[i]]))
}
lps
[[1]]
[[2]]
[[3]]
[[4]]
volcano plots for genes DE in each topic
plot.list<- list()
for (i in 1:ncol(fit$L)){
p<-volcano_plot(diff_count_res, k=i, labels=genes, label_above_quantile = 0.999)
plot.list[[i]]<-p
}

plot.list
[[1]]
[[2]]
[[3]]
[[4]]
[[5]]
[[6]]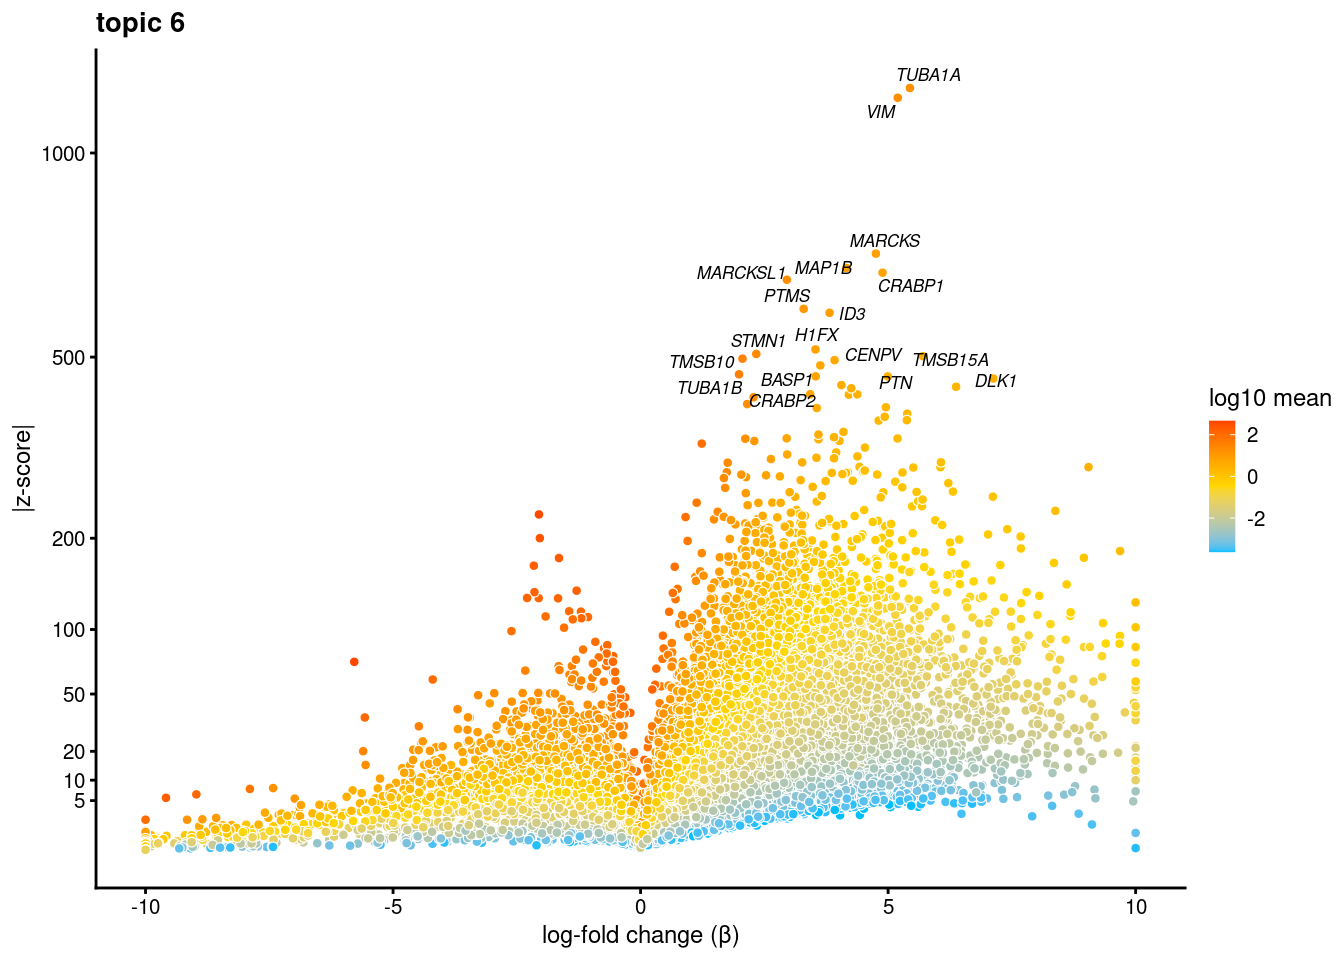
[[7]]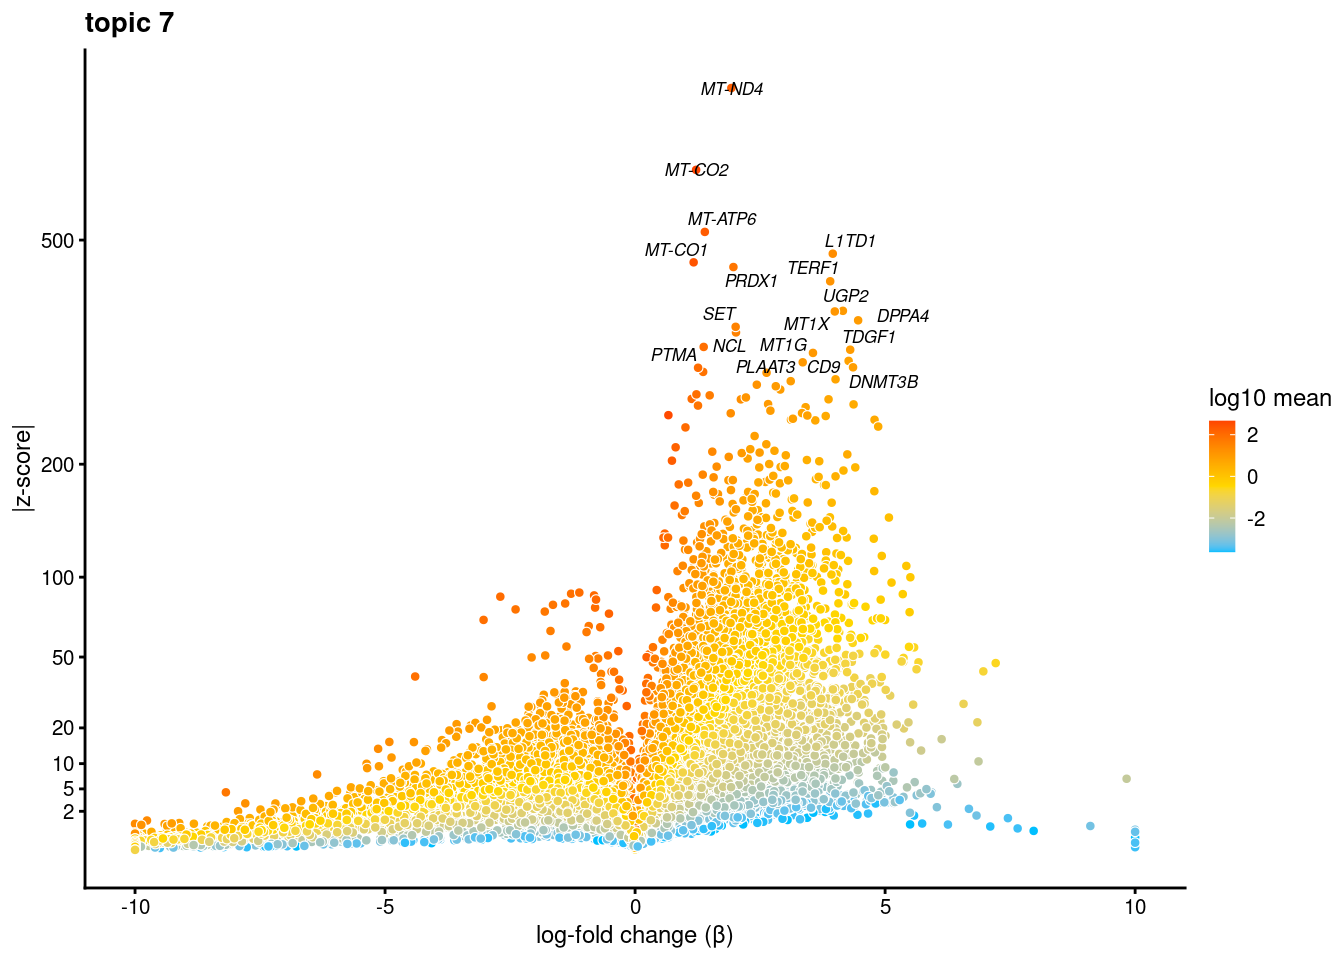
[[8]]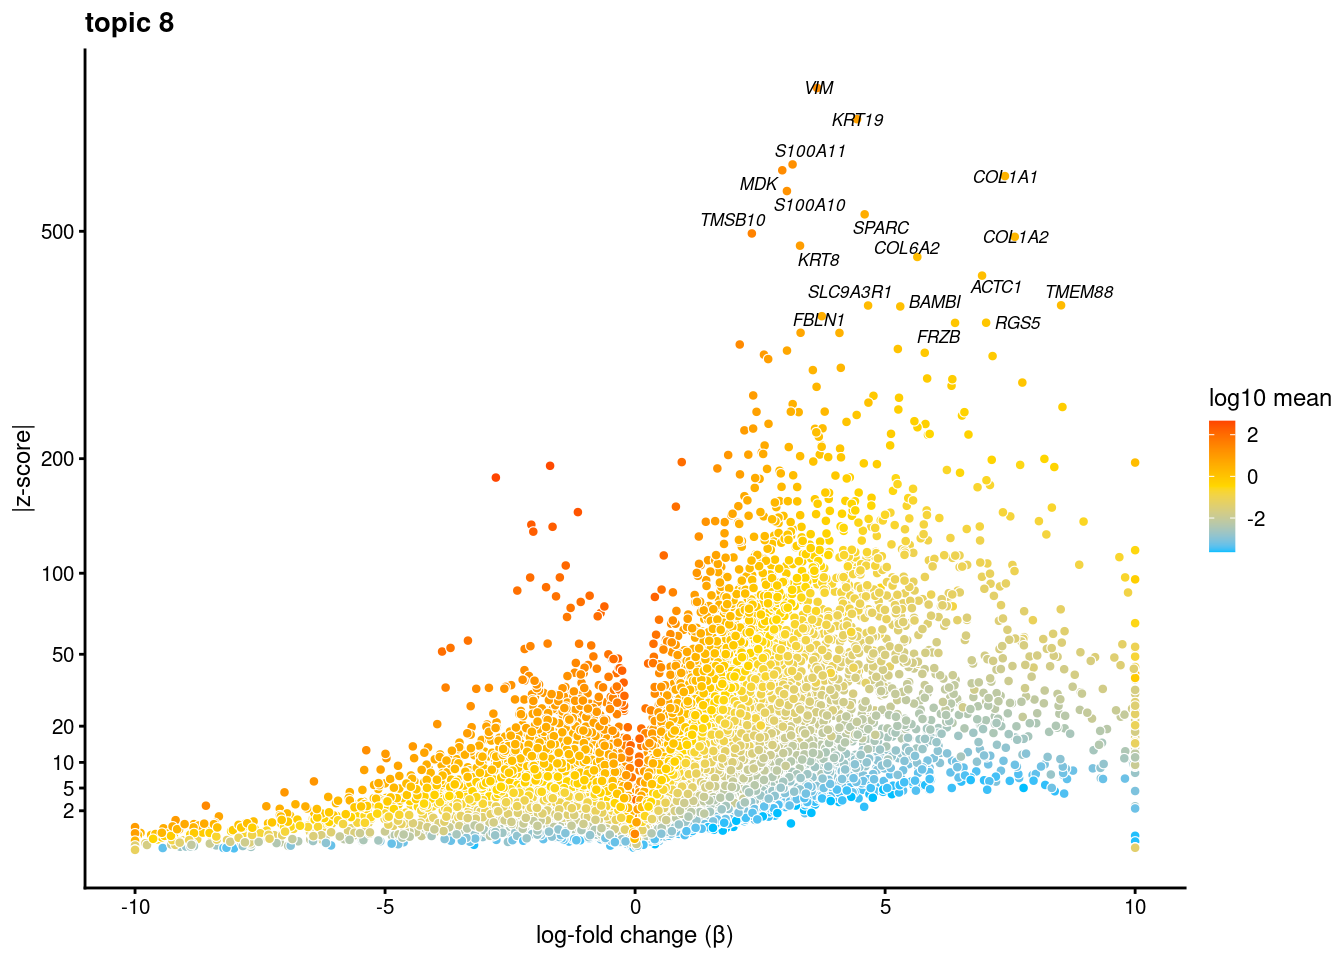
[[9]]Warning: ggrepel: 7 unlabeled data points (too many overlaps). Consider
increasing max.overlaps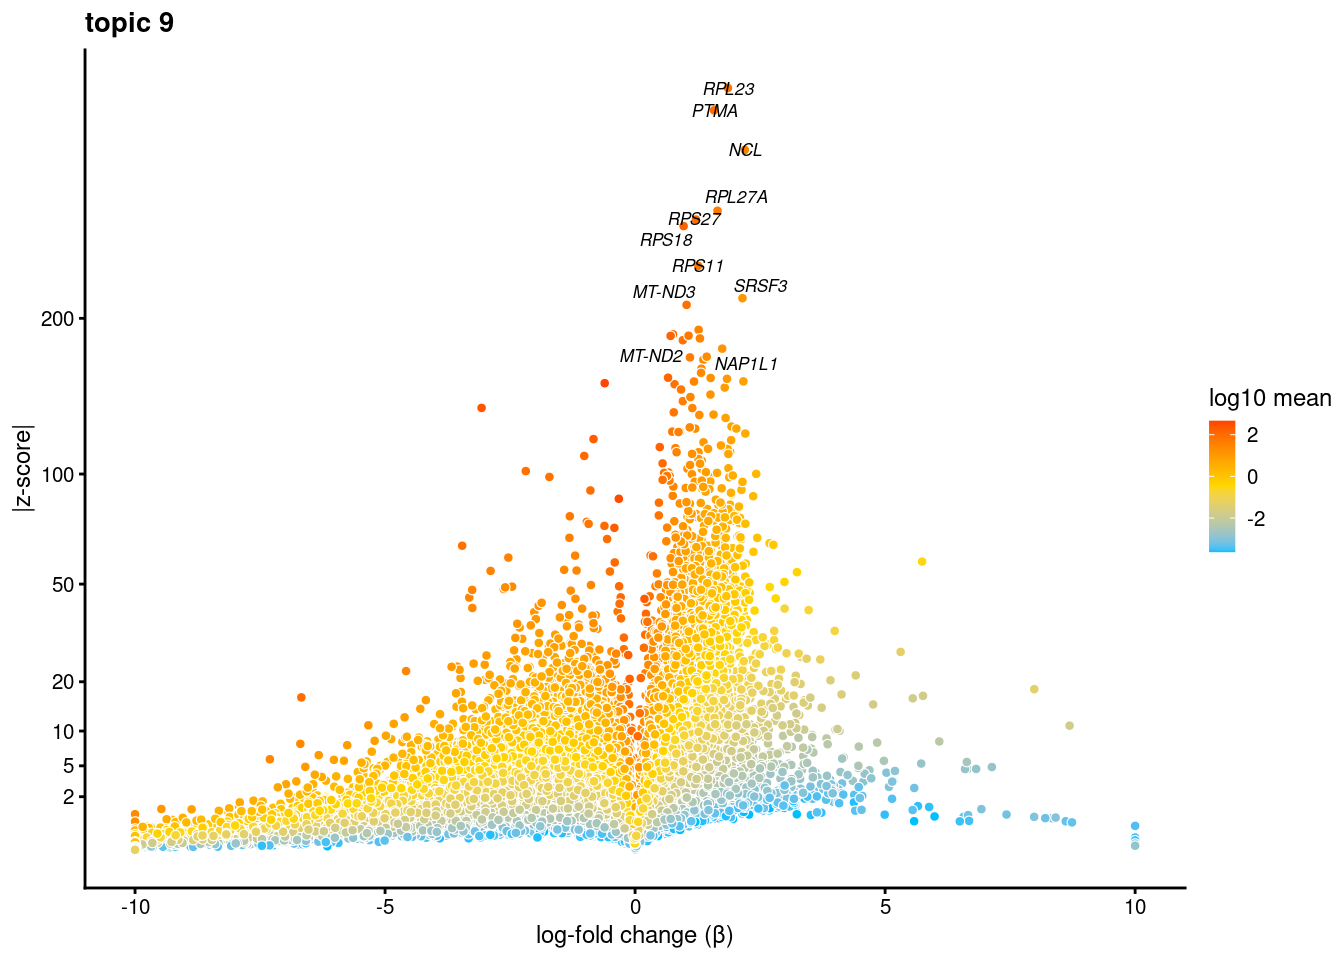
[[10]]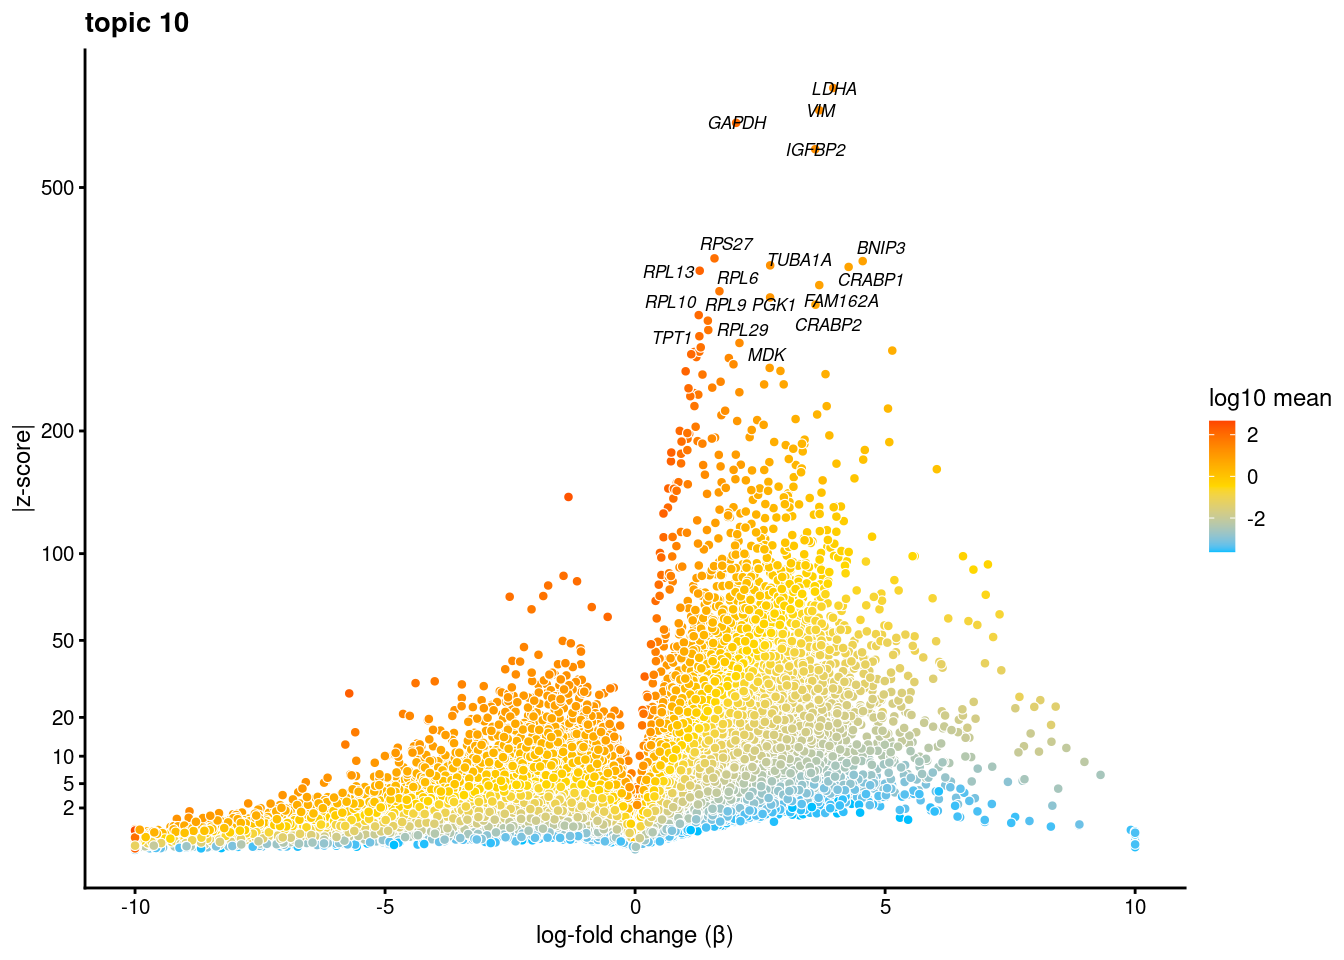
Test just topic 4 vs. 7
sub<- subset(merged, idents = "0")
fit_subset<- select(poisson2multinom(fit), loadings=colnames(sub))
ans<- diff_count_analysis(fit_subset, counts[colnames(sub),])save(ans,file='/project2/gilad/katie/Pilot_HumanEBs/Embryoid_Body_Pilot_Workflowr/output/fasttopics/k10.4v7.pluripotentsubset.diff_count.Rdata')load('/project2/gilad/katie/Pilot_HumanEBs/Embryoid_Body_Pilot_Workflowr/output/fasttopics/k10.4v7.pluripotentsubset.diff_count.Rdata')plot.list<- list()
for (i in 1:ncol(fit_subset$L)){
p<-volcano_plot(ans, k=i, labels=genes, label_above_quantile = 0.999)
plot.list[[i]]<-p
}
plot.list[[1]]
[[2]]Warning: ggrepel: 7 unlabeled data points (too many overlaps). Consider
increasing max.overlaps
[[3]]Warning: ggrepel: 1 unlabeled data points (too many overlaps). Consider
increasing max.overlaps
[[4]]
[[5]]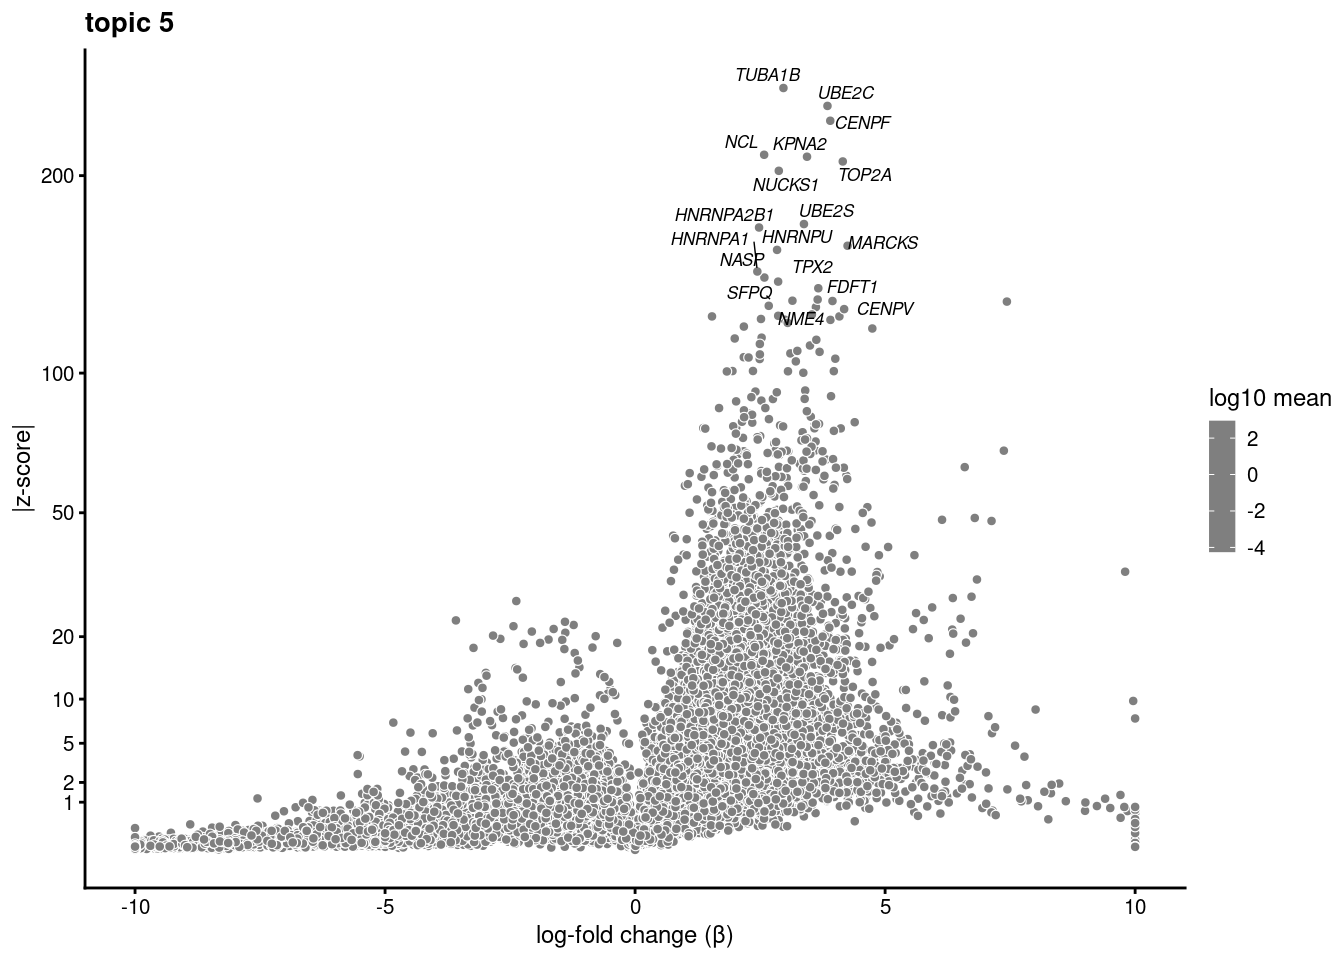
[[6]]
[[7]]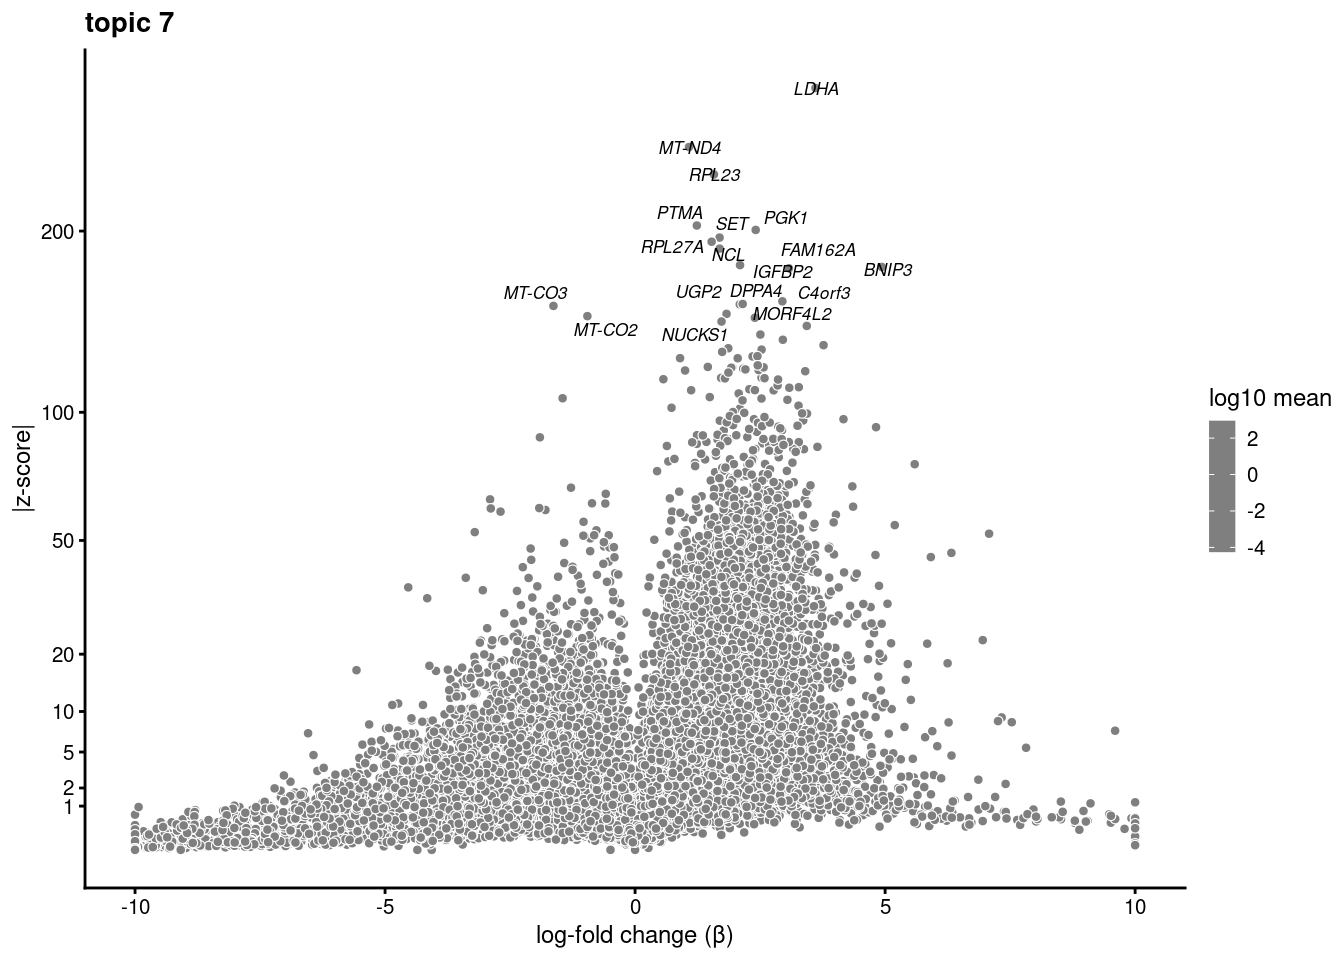
[[8]]
[[9]]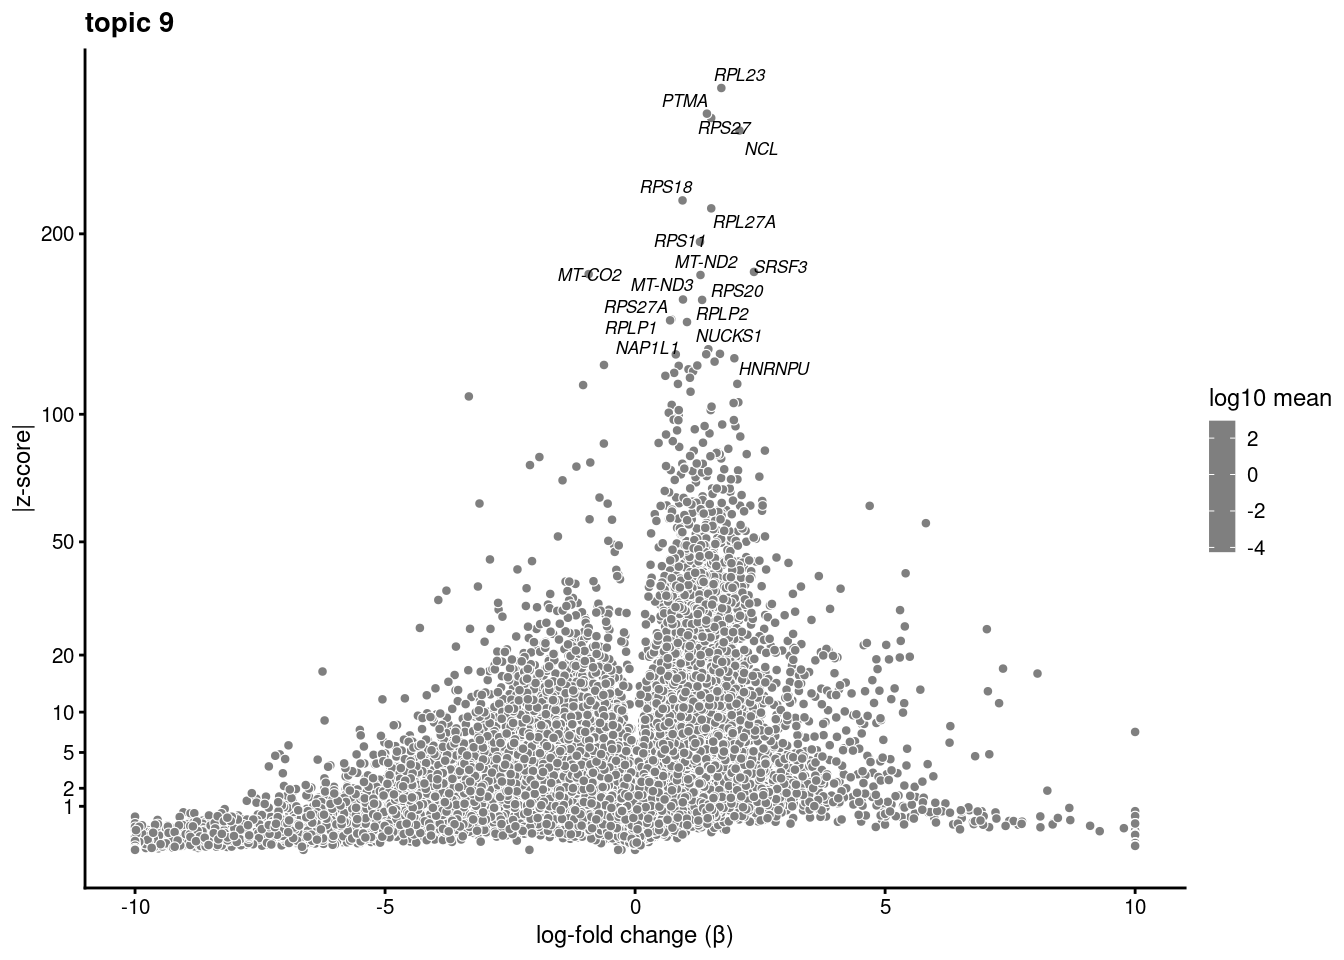
[[10]]
top10.byBeta<- NULL
for (i in 1:ncol(diff_count_res$beta)){
  topic<- diff_count_res$beta[,i]
  topic<- topic[order(topic, decreasing=T)]
  top10<- names(topic)[1:10]
  top10.byBeta<- cbind(top10.byBeta,top10)
}

colnames(top10.byBeta)<- colnames(diff_count_res$beta)
write.csv(top10.byBeta, "/project2/gilad/katie/Pilot_HumanEBs/Embryoid_Body_Pilot_Workflowr/output/TopicModelling_k10_top10drivergenes.byBeta.csv")
sessionInfo()R version 3.6.1 (2019-07-05)
Platform: x86_64-pc-linux-gnu (64-bit)
Running under: Scientific Linux 7.4 (Nitrogen)
Matrix products: default
BLAS/LAPACK: /software/openblas-0.2.19-el7-x86_64/lib/libopenblas_haswellp-r0.2.19.so
locale:
[1] C
attached base packages:
[1] stats graphics grDevices utils datasets methods base
other attached packages:
[1] tibble_3.0.4 dplyr_1.0.2 cowplot_1.1.1 Seurat_3.2.0
[5] ggplot2_3.3.3 Matrix_1.2-18 fastTopics_0.3-145 workflowr_1.6.2
loaded via a namespace (and not attached):
[1] Rtsne_0.15 colorspace_2.0-0 deldir_0.1-28
[4] ellipsis_0.3.1 ggridges_0.5.2 rprojroot_2.0.2
[7] fs_1.4.2 spatstat.data_1.4-3 farver_2.0.3
[10] leiden_0.3.3 listenv_0.8.0 npsurv_0.4-0
[13] MatrixModels_0.4-1 ggrepel_0.9.0 codetools_0.2-16
[16] splines_3.6.1 lsei_1.2-0 knitr_1.29
[19] polyclip_1.10-0 jsonlite_1.7.2 mcmc_0.9-7
[22] ica_1.0-2 cluster_2.1.0 png_0.1-7
[25] uwot_0.1.10 sctransform_0.2.1 shiny_1.5.0
[28] compiler_3.6.1 httr_1.4.2 fastmap_1.0.1
[31] lazyeval_0.2.2 later_1.1.0.1 htmltools_0.5.0
[34] quantreg_5.61 prettyunits_1.1.1 tools_3.6.1
[37] rsvd_1.0.3 igraph_1.2.6 coda_0.19-3
[40] gtable_0.3.0 glue_1.4.2 reshape2_1.4.4
[43] RANN_2.6.1 rappdirs_0.3.3 spatstat_1.64-1
[46] Rcpp_1.0.6 vctrs_0.3.6 gdata_2.18.0
[49] ape_5.4-1 nlme_3.1-140 conquer_1.0.1
[52] lmtest_0.9-37 xfun_0.16 stringr_1.4.0
[55] globals_0.12.5 mime_0.9 miniUI_0.1.1.1
[58] lifecycle_0.2.0 irlba_2.3.3 gtools_3.8.2
[61] goftest_1.2-2 future_1.18.0 MASS_7.3-51.4
[64] zoo_1.8-8 scales_1.1.1 spatstat.utils_1.17-0
[67] hms_0.5.3 promises_1.1.1 parallel_3.6.1
[70] SparseM_1.78 RColorBrewer_1.1-2 yaml_2.2.1
[73] gridExtra_2.3 reticulate_1.20 pbapply_1.4-2
[76] rpart_4.1-15 stringi_1.5.3 highr_0.8
[79] caTools_1.18.0 rlang_0.4.10 pkgconfig_2.0.3
[82] matrixStats_0.57.0 bitops_1.0-6 evaluate_0.14
[85] lattice_0.20-38 tensor_1.5 ROCR_1.0-7
[88] purrr_0.3.4 labeling_0.4.2 patchwork_1.1.1
[91] htmlwidgets_1.5.1 tidyselect_1.1.0 RcppAnnoy_0.0.18
[94] plyr_1.8.6 magrittr_2.0.1 R6_2.5.0
[97] gplots_3.0.4 generics_0.1.0 mgcv_1.8-28
[100] pillar_1.4.7 withr_2.4.2 fitdistrplus_1.0-14
[103] abind_1.4-5 survival_3.2-3 future.apply_1.6.0
[106] crayon_1.3.4 KernSmooth_2.23-15 plotly_4.9.2.1
[109] rmarkdown_2.3 progress_1.2.2 grid_3.6.1
[112] data.table_1.13.4 git2r_0.26.1 digest_0.6.27
[115] xtable_1.8-4 tidyr_1.1.0 httpuv_1.5.4
[118] MCMCpack_1.4-8 RcppParallel_5.0.2 munsell_0.5.0
[121] viridisLite_0.3.0 quadprog_1.5-8