ReferenceIntegration
Last updated: 2021-07-05
Checks: 6 1
Knit directory: Embryoid_Body_Pilot_Workflowr/analysis/
This reproducible R Markdown analysis was created with workflowr (version 1.6.2). The Checks tab describes the reproducibility checks that were applied when the results were created. The Past versions tab lists the development history.
Great! Since the R Markdown file has been committed to the Git repository, you know the exact version of the code that produced these results.
Great job! The global environment was empty. Objects defined in the global environment can affect the analysis in your R Markdown file in unknown ways. For reproduciblity it's best to always run the code in an empty environment.
The command set.seed(20200804) was run prior to running the code in the R Markdown file. Setting a seed ensures that any results that rely on randomness, e.g. subsampling or permutations, are reproducible.
Great job! Recording the operating system, R version, and package versions is critical for reproducibility.
Nice! There were no cached chunks for this analysis, so you can be confident that you successfully produced the results during this run.
Using absolute paths to the files within your workflowr project makes it difficult for you and others to run your code on a different machine. Change the absolute path(s) below to the suggested relative path(s) to make your code more reproducible.
| absolute | relative |
|---|---|
| /project2/gilad/katie/Pilot_HumanEBs/Embryoid_Body_Pilot_Workflowr/output/mergedObjects/Harmony.Batchindividual.rds | ../output/mergedObjects/Harmony.Batchindividual.rds |
| /project2/gilad/katie/Pilot_HumanEBs/Embryoid_Body_Pilot_Workflowr/data/dge/hESC1.rawdge.txt.gz | ../data/dge/hESC1.rawdge.txt.gz |
| /project2/gilad/katie/Pilot_HumanEBs/Embryoid_Body_Pilot_Workflowr/data/dge/iPS-to-EB_20Day_dge.txt.gz | ../data/dge/iPS-to-EB_20Day_dge.txt.gz |
| /project2/gilad/katie/Pilot_HumanEBs/Embryoid_Body_Pilot_Workflowr/output/CaoEtAl.Obj.CellsOfAllClusters.ProteinCodingGenes.rds | ../output/CaoEtAl.Obj.CellsOfAllClusters.ProteinCodingGenes.rds |
| /project2/gilad/katie/Pilot_HumanEBs/Embryoid_Body_Pilot_Workflowr/output/merge.all.SCTwRegressOrigIdent.Harmony.rds | ../output/merge.all.SCTwRegressOrigIdent.Harmony.rds |
| /project2/gilad/katie/Pilot_HumanEBs/Embryoid_Body_Pilot_Workflowr/output/pdfs/IntegrateReference_UMAP_MainClusterID_SCTregress.pdf | ../output/pdfs/IntegrateReference_UMAP_MainClusterID_SCTregress.pdf |
| /project2/gilad/katie/Pilot_HumanEBs/Embryoid_Body_Pilot_Workflowr/output/pdfs/IntegrateReference_UMAP_allLabels_SCTregress.pdf | ../output/pdfs/IntegrateReference_UMAP_allLabels_SCTregress.pdf |
| /project2/gilad/katie/Pilot_HumanEBs/Embryoid_Body_Pilot_Workflowr/output/pdfs/IntegrateReference_UMAP_origident_all_SCTregress.pdf | ../output/pdfs/IntegrateReference_UMAP_origident_all_SCTregress.pdf |
| /project2/gilad/katie/Pilot_HumanEBs/Embryoid_Body_Pilot_Workflowr/output/pdfs/IntegrateReference_UMAP_EBpilotAndCao_SCTregress.pdf | ../output/pdfs/IntegrateReference_UMAP_EBpilotAndCao_SCTregress.pdf |
| /project2/gilad/katie/Pilot_HumanEBs/Embryoid_Body_Pilot_Workflowr/output/pdfs/IntegrateReference_UMAP_EBpilotAndCao_groupbyMainClusterName_SCTregress.pdf | ../output/pdfs/IntegrateReference_UMAP_EBpilotAndCao_groupbyMainClusterName_SCTregress.pdf |
| /project2/gilad/katie/Pilot_HumanEBs/Embryoid_Body_Pilot_Workflowr/output/pdfs/IntegrateReference_UMAP_EBpilotAndCao_groupbySeuratClusterRes0.1_SCTregress.pdf | ../output/pdfs/IntegrateReference_UMAP_EBpilotAndCao_groupbySeuratClusterRes0.1_SCTregress.pdf |
| /project2/gilad/katie/Pilot_HumanEBs/Embryoid_Body_Pilot_Workflowr/output/NearestReferenceCell.Cao.hESC.EuclideanDistanceinHarmonySpace.csv | ../output/NearestReferenceCell.Cao.hESC.EuclideanDistanceinHarmonySpace.csv |
| /project2/gilad/katie/Pilot_HumanEBs/Embryoid_Body_Pilot_Workflowr/output/NearestReferenceCell.Cao.hESC.FrequencyofEachAnnotation.csv | ../output/NearestReferenceCell.Cao.hESC.FrequencyofEachAnnotation.csv |
| /project2/gilad/katie/Pilot_HumanEBs/Embryoid_Body_Pilot_Workflowr/output/pdfs/IntegrateReference_UMAP_EBpilot_annotationsFromReference.pdf | ../output/pdfs/IntegrateReference_UMAP_EBpilot_annotationsFromReference.pdf |
| /project2/gilad/katie/Pilot_HumanEBs/Embryoid_Body_Pilot_Workflowr/output/MostCommonAnnotation.FiveNearestRefCells.csv | ../output/MostCommonAnnotation.FiveNearestRefCells.csv |
| /project2/gilad/katie/Pilot_HumanEBs/Embryoid_Body_Pilot_Workflowr/output/Frequency.MostCommonAnnotation.FiveNearestRefCells.csv | ../output/Frequency.MostCommonAnnotation.FiveNearestRefCells.csv |
| /project2/gilad/katie/Pilot_HumanEBs/Embryoid_Body_Pilot_Workflowr/output/pdfs/IntegrateReference_UMAP_EBpilot_CommonAnnotationsFromFiveReferenceNeighbors.pdf | ../output/pdfs/IntegrateReference_UMAP_EBpilot_CommonAnnotationsFromFiveReferenceNeighbors.pdf |
Great! You are using Git for version control. Tracking code development and connecting the code version to the results is critical for reproducibility.
The results in this page were generated with repository version be8515f. See the Past versions tab to see a history of the changes made to the R Markdown and HTML files.
Note that you need to be careful to ensure that all relevant files for the analysis have been committed to Git prior to generating the results (you can use wflow_publish or wflow_git_commit). workflowr only checks the R Markdown file, but you know if there are other scripts or data files that it depends on. Below is the status of the Git repository when the results were generated:
Ignored files:
    Ignored:    .Rhistory
    Ignored:    .Rproj.user/
    Ignored:    analysis/.Rhistory
    Ignored:    output/.Rhistory

Untracked files:
    Untracked:  GSE122380_raw_counts.txt.gz
    Untracked:  UTF1_plots.Rmd
    Untracked:  analysis/OLD/
    Untracked:  analysis/child/
    Untracked:  build_refint_scale.R
    Untracked:  build_refint_sct.R
    Untracked:  build_stuff.R
    Untracked:  build_varpart_sc.R
    Untracked:  code/.ipynb_checkpoints/
    Untracked:  code/CellRangerPreprocess.Rmd
    Untracked:  code/GEO_processed_data.Rmd
    Untracked:  code/PowerAnalysis_NoiseRatio.ipynb
    Untracked:  code/Untitled.ipynb
    Untracked:  code/Untitled1.ipynb
    Untracked:  data/HCL_Fig1_adata.h5ad
    Untracked:  data/HCL_Fig1_adata.h5seurat
    Untracked:  data/dge/
    Untracked:  data/dge_raw_data.tar.gz
    Untracked:  data/ref.expr.rda
    Untracked:  figure/
    Untracked:  output/CR_sampleQCrds/
    Untracked:  output/CaoEtAl.Obj.CellsOfAllClusters.ProteinCodingGenes.rds
    Untracked:  output/CaoEtAl.Obj.rds
    Untracked:  output/ClusterInfo_res0.1.csv
    Untracked:  output/DGELists/
    Untracked:  output/DownSampleVarPart.rds
    Untracked:  output/Frequency.MostCommonAnnotation.FiveNearestRefCells.csv
    Untracked:  output/GEOsubmissionProcessedFiles/
    Untracked:  output/GeneLists_by_minPCT/
    Untracked:  output/MostCommonAnnotation.FiveNearestRefCells.csv
    Untracked:  output/NearestReferenceCell.Cao.hESC.EuclideanDistanceinHarmonySpace.csv
    Untracked:  output/NearestReferenceCell.Cao.hESC.FrequencyofEachAnnotation.csv
    Untracked:  output/NearestReferenceCell.SCTregressRNAassay.Cao.hESC.EuclideanDistanceinHarmonySpace.csv
    Untracked:  output/NearestReferenceCell.SCTregressRNAassay.Cao.hESC.FrequencyofEachAnnotation.csv
    Untracked:  output/Pseudobulk_Limma_res0.1_OnevAllTopTables.csv
    Untracked:  output/Pseudobulk_Limma_res0.1_OnevAll_top10Upregby_adjP.csv
    Untracked:  output/Pseudobulk_Limma_res0.1_OnevAll_top10Upregby_logFC.csv
    Untracked:  output/Pseudobulk_Limma_res0.5_OnevAllTopTables.csv
    Untracked:  output/Pseudobulk_Limma_res0.8_OnevAllTopTables.csv
    Untracked:  output/Pseudobulk_Limma_res1_OnevAllTopTables.csv
    Untracked:  output/Pseudobulk_VarPart.ByCluster.Res0.1.rds
    Untracked:  output/ResidualVariances_fromDownSampAnalysis.csv
    Untracked:  output/SingleCell_VariancePartition_RNA_Res0.1_minPCT0.2.rds
    Untracked:  output/SingleCell_VariancePartition_Res0.1_minPCT0.2.rds
    Untracked:  output/SingleCell_VariancePartition_SCT_Res0.1_minPCT0.2.rds
    Untracked:  output/TopicModelling_k10_top10drivergenes.byBeta.csv
    Untracked:  output/TopicModelling_k6_top10drivergenes.byBeta.csv
    Untracked:  output/TopicModelling_k6_top15drivergenes.byZ.csv
    Untracked:  output/TranferredAnnotations_ReferenceInt_JustEarlyEcto.csv
    Untracked:  output/TranferredAnnotations_ReferenceInt_JustEndoderm.csv
    Untracked:  output/TranferredAnnotations_ReferenceInt_JustMeso.csv
    Untracked:  output/TranferredAnnotations_ReferenceInt_JustNeuralCrest.csv
    Untracked:  output/TranferredAnnotations_ReferenceInt_JustNeuron.csv
    Untracked:  output/TranferredAnnotations_ReferenceInt_JustPluripotent.csv
    Untracked:  output/VarPart.ByCluster.Res0.1.rds
    Untracked:  output/azimuth/
    Untracked:  output/downsamp_10800cells_10subreps_medianexplainedbyresiduals_varpart_PsB.rds
    Untracked:  output/downsamp_16200cells_10subreps_medianexplainedbyresiduals_varpart_PsB.rds
    Untracked:  output/downsamp_21600cells_10subreps_medianexplainedbyresiduals_varpart_PsB.rds
    Untracked:  output/downsamp_2700cells_10subreps_medianexplainedbyresiduals_varpart_PsB.rds
    Untracked:  output/downsamp_2700cells_10subreps_medianexplainedbyresiduals_varpart_scres.rds
    Untracked:  output/downsamp_5400cells_10subreps_medianexplainedbyresiduals_varpart_PsB.rds
    Untracked:  output/downsamp_7200cells_10subreps_medianexplainedbyresiduals_varpart_PsB.rds
    Untracked:  output/fasttopics/
    Untracked:  output/figs/
    Untracked:  output/merge.Cao.SCTwRegressOrigIdent.rds
    Untracked:  output/merge.all.SCTwRegressOrigIdent.Harmony.rds
    Untracked:  output/merged.SCT.counts.matrix.rds
    Untracked:  output/merged.raw.counts.matrix.rds
    Untracked:  output/mergedObjects/
    Untracked:  output/pdfs/
    Untracked:  output/sampleQCrds/
    Untracked:  output/splitgpm_gsea_results/
    Untracked:  slurm-12005914.out
    Untracked:  slurm-12005923.out

Unstaged changes:
    Deleted:    analysis/IntegrateAnalysis.afterFilter.HarmonyBatch.Rmd
    Deleted:    analysis/IntegrateAnalysis.afterFilter.HarmonyBatchSampleIDindividual.Rmd
    Deleted:    analysis/IntegrateAnalysis.afterFilter.NOHARMONYjustmerge.Rmd
    Deleted:    analysis/IntegrateAnalysis.afterFilter.SCTregressBatchIndividual.Rmd
    Deleted:    analysis/IntegrateAnalysis.afterFilter.SCTregressBatchIndividualHarmonyBatchindividual.Rmd
    Deleted:    analysis/RunscHCL_HarmonyBatchInd.Rmd
Note that any generated files, e.g. HTML, png, CSS, etc., are not included in this status report because it is ok for generated content to have uncommitted changes.
These are the previous versions of the repository in which changes were made to the R Markdown (analysis/IntegrateReference_SCTregressCaoPlusScHCL.Rmd) and HTML (docs/IntegrateReference_SCTregressCaoPlusScHCL.html) files. If you've configured a remote Git repository (see ?wflow_git_remote), click on the hyperlinks in the table below to view the files as they were in that past version.
| File | Version | Author | Date | Message |
|---|---|---|---|---|
| Rmd | c8767ac | KLRhodes | 2021-07-04 | wflow_git_commit("analysis/IntegrateReference_SCTregressCaoPlusScHCL.Rmd") |
library(Seurat)
library(edgeR)
Loading required package: limmalibrary(loomR)Loading required package: R6Loading required package: hdf5rlibrary(dplyr)
Attaching package: 'dplyr'The following object is masked from 'package:loomR':
combineThe following objects are masked from 'package:stats':
filter, lagThe following objects are masked from 'package:base':
intersect, setdiff, setequal, unionlibrary(tidyr)
library(tibble)
library(purrr)
Attaching package: 'purrr'The following object is masked from 'package:hdf5r':
flatten_dflibrary(harmony)Loading required package: Rcpplibrary(ggplot2)loading data
first, my data
merged<- readRDS("/project2/gilad/katie/Pilot_HumanEBs/Embryoid_Body_Pilot_Workflowr/output/mergedObjects/Harmony.Batchindividual.rds")loading in hESC and iPS-to-EB raw dges from scHCL reference set
hESC<- read.table("/project2/gilad/katie/Pilot_HumanEBs/Embryoid_Body_Pilot_Workflowr/data/dge/hESC1.rawdge.txt.gz", header=T, row.names = 1)

iPStoEBday20<- read.table("/project2/gilad/katie/Pilot_HumanEBs/Embryoid_Body_Pilot_Workflowr/data/dge/iPS-to-EB_20Day_dge.txt.gz", header=T, row.names = 1)
Note: there is no available metadata for these iPS to EB differentiations (no cell annotations online)
make seurat objects with all of the data
hESC.obj<- CreateSeuratObject(hESC)Warning: Feature names cannot have underscores ('_'), replacing with dashes
('-')EB20.obj<- CreateSeuratObject(iPStoEBday20)Warning: Feature names cannot have underscores ('_'), replacing with dashes
('-')checking quality of cells
FeatureScatter(hESC.obj, feature1 = "nCount_RNA", feature2 = "nFeature_RNA")
#check MT%
#add %MT to metadata
hESC.obj[["percent.mt"]]<- PercentageFeatureSet(hESC.obj, pattern= "^MT-")
FeatureScatter(hESC.obj, feature1 = "nCount_RNA", feature2 = "percent.mt")
summary(hESC.obj$percent.mt) Min. 1st Qu. Median Mean 3rd Qu. Max.
1.200 4.121 4.838 4.922 5.609 11.596 #normalizing each scHCL dataset
hESC.obj<- suppressWarnings(SCTransform(hESC.obj, variable.features.n=5000,verbose=F))
EB20.obj<-suppressWarnings(SCTransform(EB20.obj, variable.features.n=5000,verbose=F))load loom file from Cao et al (fetal tissue scRNA-seq)
Cao<- connect("/project2/gilad/katie/Pilot_HumanEBs/DataFromCaoetal202/GSE156793_S3_gene_count.loom", mode="r+")

CaoCao[["matrix"]]#which genes are protein coding genes
protein<- which(Cao$row.attrs$gene_type[]=="protein_coding")
#sample genes of all main_cluster_name groups
#making a data fram of cell names and their cluster identity
cell.idents<- Cao$get.attribute.df(MARGIN = 2, col.names = "sample", attributes="Main_cluster_name")
cell.idents<- cell.idents %>% rownames_to_column("cellid")
#I'd like to sample ~500 cells from each cluster. Some clusters have fewer than 500 cells, so for those clusters I will take all cells. To do this, I make a dataframe listing the sample size of each cell type.
s.size<- table(cell.idents$Main_cluster_name)
s.size[s.size > 500]<- 500
#reorder
s.size<- s.size[unique(cell.idents$Main_cluster_name)]
#sample from each cluster
#make nested df
nest<- cell.idents %>% group_by(Main_cluster_name) %>% nest() %>% ungroup() %>% mutate(n = s.size)
sampled_nest<- nest %>% mutate(samp= map2(data, n, sample_n))
cells.keep<- sampled_nest %>% select(-data) %>% unnest(samp)
cells.keep<- cells.keep$cellid
cells<- which(cell.idents$cellid %in% cells.keep)#get metrix for cells and genes of interest
Cao.matrix<- Cao[["matrix"]][cells,protein]#get metadata
attrs<- c("Assay", "Batch", "Experiment_batch", "Main_cluster_name", "Fetus_id", "Sex")
attr.df<-Cao$get.attribute.df(MARGIN = 2, col.names = "sample", attributes=attrs)
#subset the attr.df to just the subset of cells
attr.df<- attr.df[cells,]#name matrix rows and columns
rownames(Cao.matrix)<- rownames(attr.df)
colnames(Cao.matrix)<- Cao[["row_attrs/gene_short_name"]][protein]
#seems like there are some non-unique gene names, which is expected but annoying
dups<- which(duplicated(colnames(Cao.matrix)))
length(dups)#sum the counts for duplicate gene names
Cao.matrix.test<- (t(Cao.matrix))
rowname<- rownames(Cao.matrix.test)
Cao.matrix.test<- cbind(rowname, as.data.frame(Cao.matrix.test))
rownames(Cao.matrix.test)<- NULL
Cao.agg.dups<- aggregate(.~rowname, Cao.matrix.test, sum)
anyDuplicated(Cao.agg.dups$rowname)#rename rows
rownames(Cao.agg.dups)<- Cao.agg.dups$rowname
#remove rowname column
Cao.agg.dups<- Cao.agg.dups[, 2:ncol(Cao.agg.dups)]
colnames(Cao.agg.dups)<- rownames(attr.df)Now, Convert to Seurat Object. Major question: is this raw data? or are these counts normalized?
Cao.obj<- CreateSeuratObject(Cao.agg.dups, meta.data= attr.df)Normalize the fetal reference set
#first normalizing with SCTransform
Cao.obj<- SCTransform(Cao.obj, variable.features.n=5000,verbose=F)
saveRDS(Cao.obj,"/project2/gilad/katie/Pilot_HumanEBs/Embryoid_Body_Pilot_Workflowr/output/CaoEtAl.Obj.CellsOfAllClusters.ProteinCodingGenes.rds" )Cao.obj<-readRDS("/project2/gilad/katie/Pilot_HumanEBs/Embryoid_Body_Pilot_Workflowr/output/CaoEtAl.Obj.CellsOfAllClusters.ProteinCodingGenes.rds")#check features, QC between batches/individuals
#Cao data has no MT genes
FeatureScatter(Cao.obj, feature1 = "nCount_RNA", feature2 = "nFeature_RNA", group.by = "Fetus_id")
FeatureScatter(Cao.obj, feature1 = "nCount_RNA", feature2 = "nFeature_RNA", group.by = "Batch")
FeatureScatter(Cao.obj, feature1 = "nCount_RNA", feature2 = "nFeature_RNA", group.by = "Experiment_batch")
summary(Cao.obj@meta.data$nCount_RNA) Min. 1st Qu. Median Mean 3rd Qu. Max.
139.0 319.0 467.0 763.5 808.0 59044.0 summary(Cao.obj@meta.data$nFeature_RNA) Min. 1st Qu. Median Mean 3rd Qu. Max.
103.0 255.0 358.0 494.6 573.0 8627.0 Cao.obj[["percent.mt"]]<- PercentageFeatureSet(Cao.obj, pattern= "^MT-")summary(Cao.obj@meta.data$percent.mt) Min. 1st Qu. Median Mean 3rd Qu. Max.
0 0 0 0 0 0 Cao.obj<- RunPCA(Cao.obj, npcs= 100, verbose = F)DimPlot(Cao.obj, reduction = "pca")
DimPlot(Cao.obj, reduction = "pca", group.by = "Fetus_id")
DimPlot(Cao.obj, reduction = "pca", group.by = "Experiment_batch")
DimPlot(Cao.obj, reduction = "pca", group.by = "Batch")
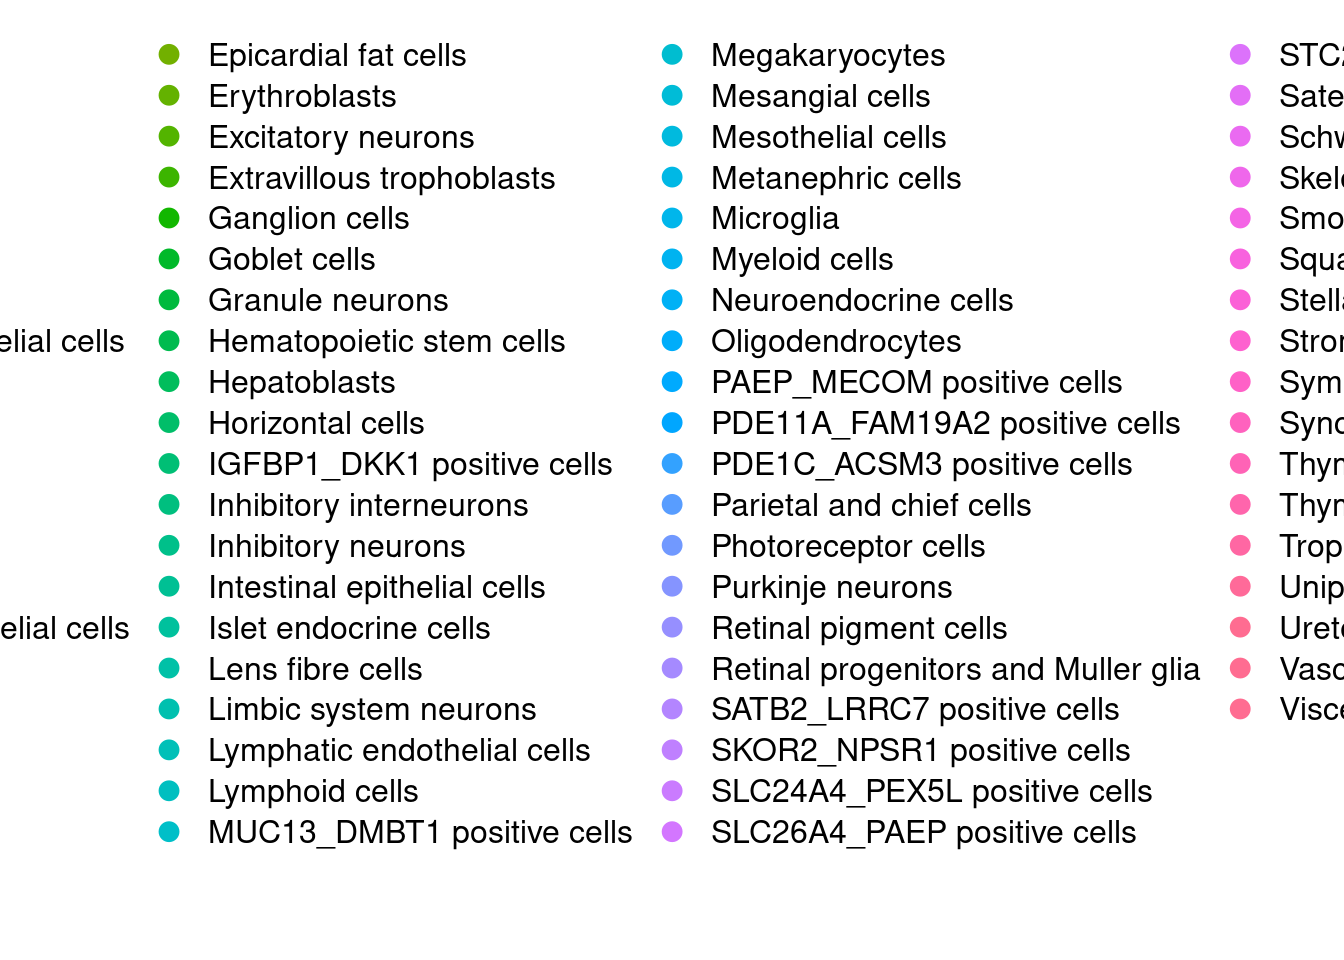
DimPlot(Cao.obj, reduction = "pca", group.by = "Main_cluster_name")
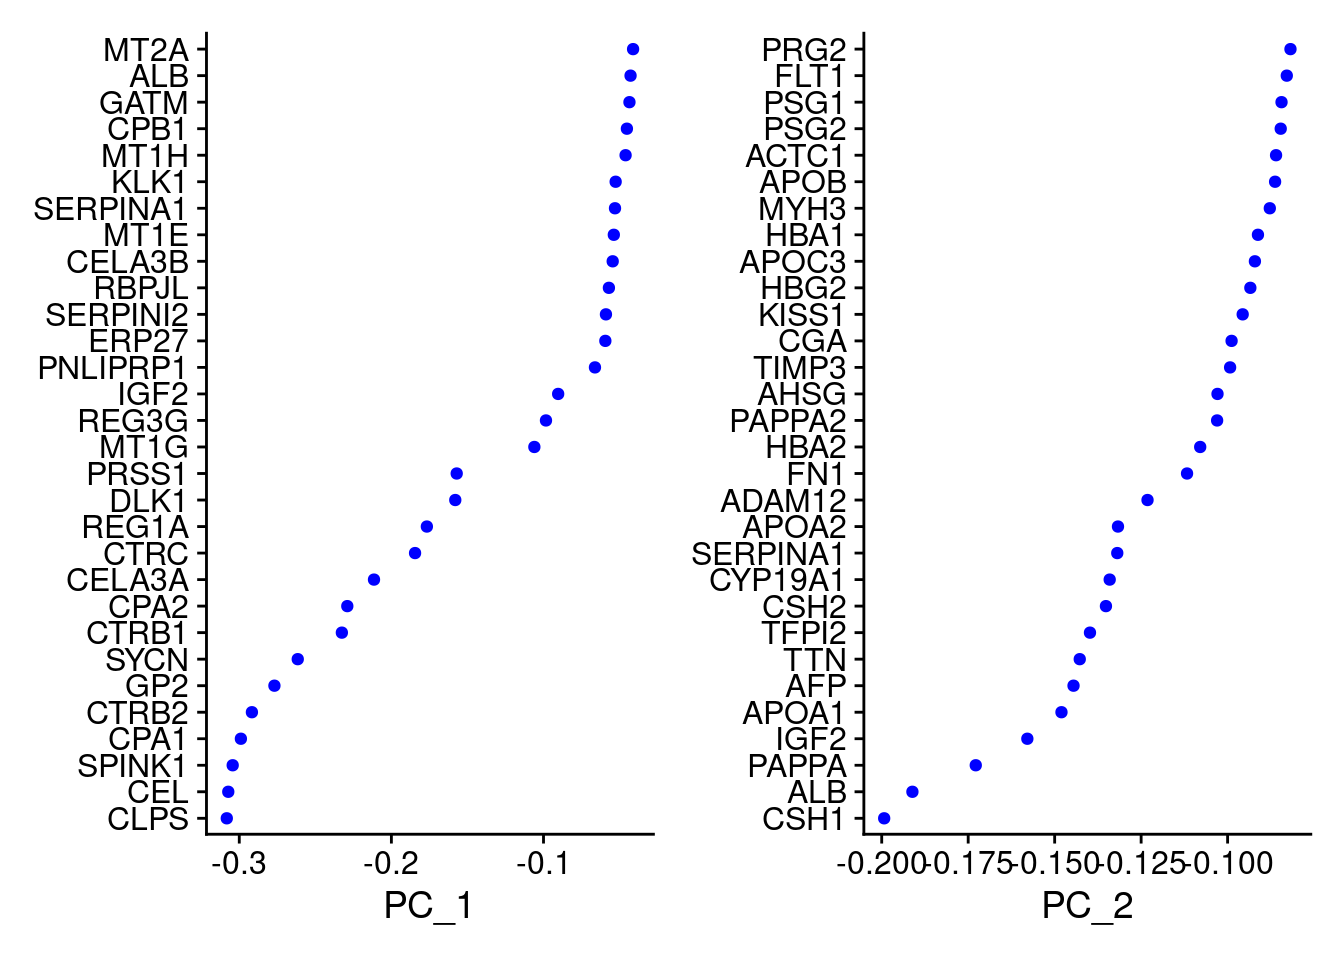
VizDimLoadings(Cao.obj, dims = 1:2, reduction = "pca")
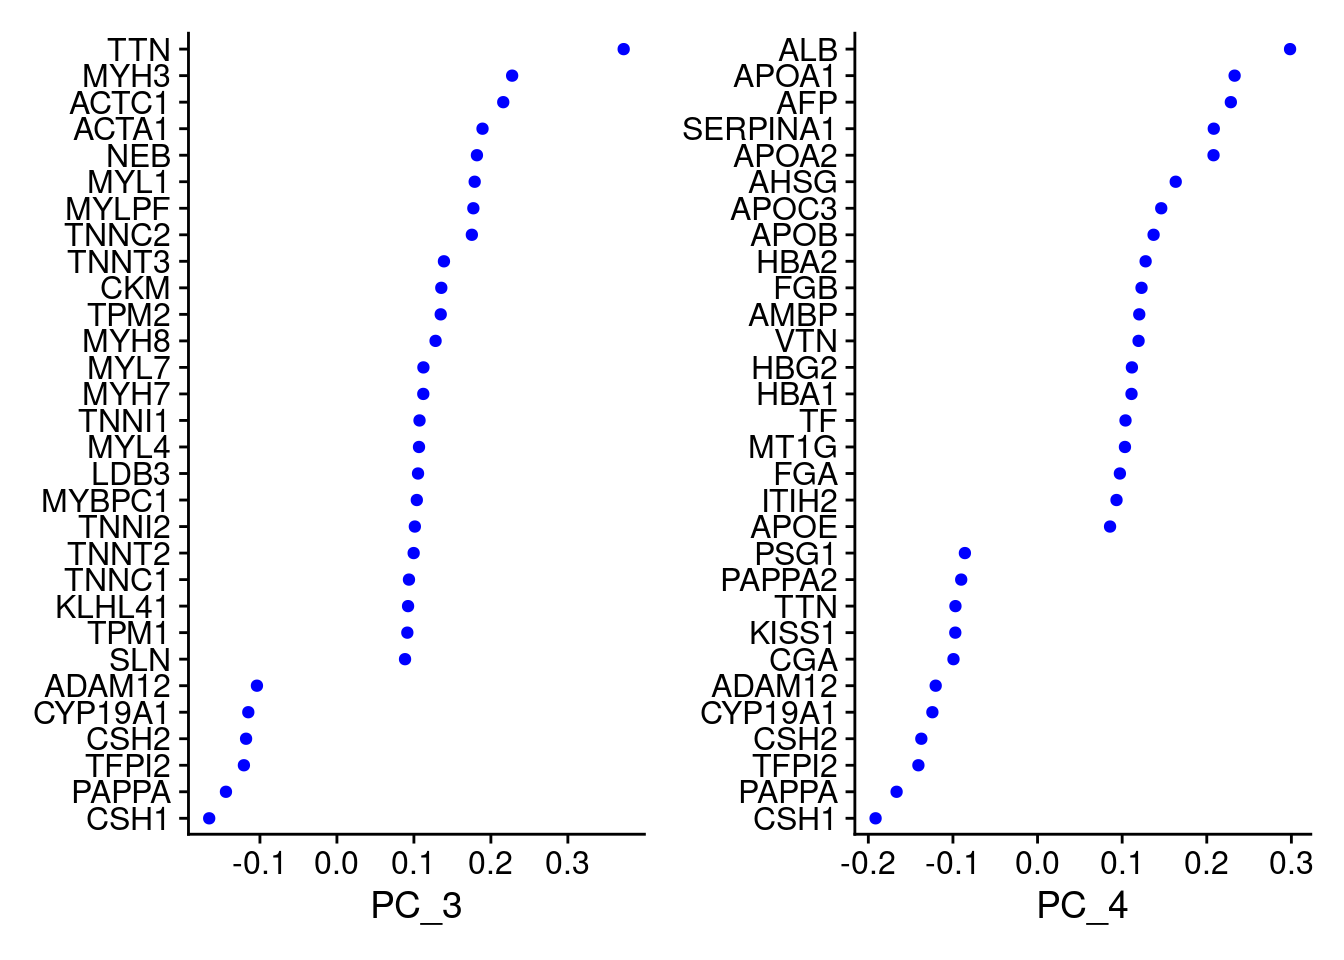
VizDimLoadings(Cao.obj, dims = 3:4, reduction = "pca")
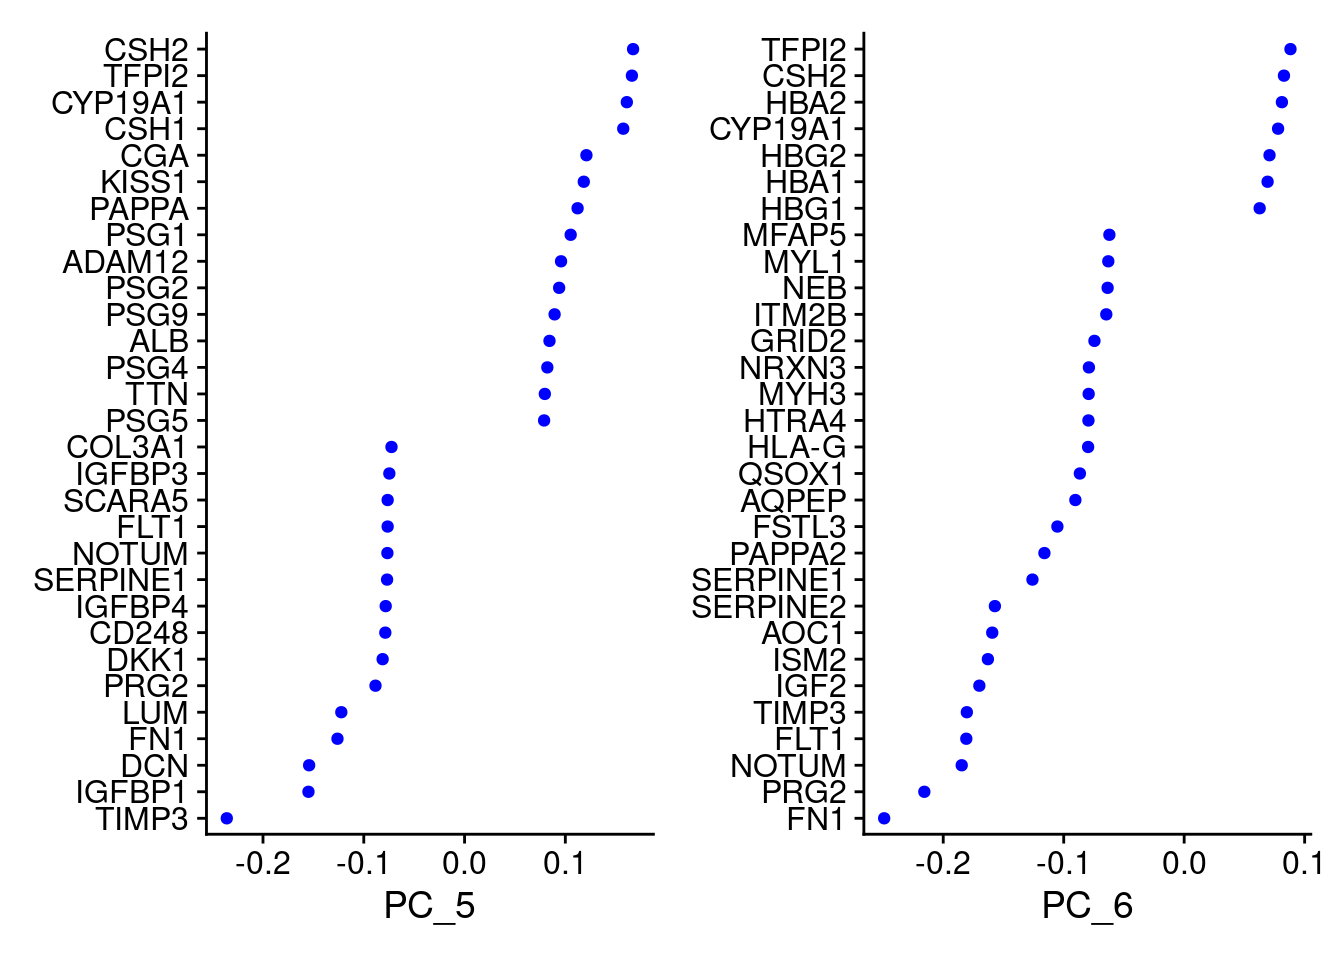
VizDimLoadings(Cao.obj, dims = 5:6, reduction = "pca")
Cao.obj<- FindNeighbors(Cao.obj, dims = 1:30, verbose = F)
Cao.obj<- RunUMAP(Cao.obj, dims=1:30, verbose = F)
Warning: The default method for RunUMAP has changed from calling Python UMAP via reticulate to the R-native UWOT using the cosine metric
To use Python UMAP via reticulate, set umap.method to 'umap-learn' and metric to 'correlation'
This message will be shown once per sessionDimPlot(Cao.obj, group.by = "Main_cluster_name", label = T, label.size = 2) + NoLegend()Warning: Using `as.character()` on a quosure is deprecated as of rlang 0.3.0.
Please use `as_label()` or `as_name()` instead.
This warning is displayed once per session.
DimPlot(Cao.obj, group.by = "Fetus_id")
DimPlot(Cao.obj, group.by = "Experiment_batch")
#rename Cao metadata so none match with EB object (just need to replace Batch)
colnames(Cao.obj@meta.data)
[1] "orig.ident" "nCount_RNA" "nFeature_RNA"
[4] "Assay" "Batch" "Experiment_batch"
[7] "Main_cluster_name" "Fetus_id" "Sex"
[10] "nCount_SCT" "nFeature_SCT" "percent.mt" colnames(Cao.obj@meta.data)[5]<-"Batch_week"#rename orig.idents
hESC.obj$orig.ident<- "scHCL.hESC"
EB20.obj$orig.ident<- "scHCL.EB20"
merged$orig.ident<- "EB.Pilot"
Cao.obj$orig.ident<- "Cao.EtAl"#merge objects
obj.list<- list(Cao.obj, merged, hESC.obj, EB20.obj)
merge.all<- merge(x=obj.list[[1]], y=c(obj.list[[2]], obj.list[[3]], obj.list[[4]]), merge.data=T)merge.all<- SCTransform(merge.all, variable.features.n = 5000, vars.to.regress = c("orig.ident"), assay= "SCT")all.genes= rownames(merge.all)
merge.all<-FindVariableFeatures(merge.all,selection.method="vst", nfeatures = 5000)
merge.all<- ScaleData(merge.all, features = all.genes, assay = "SCT")
merge.all<-RunPCA(merge.all, npcs = 100, verbose=F, Assay="SCT")merge.all<- RunHarmony(merge.all, c("orig.ident", "individual", "Batch"), theta = c(3,1,1), plot_convergence = T, assay.use = "SCT")merge.all<- RunUMAP(merge.all,dims=1:100, reduction="harmony")saveRDS(merge.all,"/project2/gilad/katie/Pilot_HumanEBs/Embryoid_Body_Pilot_Workflowr/output/merge.all.SCTwRegressOrigIdent.Harmony.rds" )merge.all<- readRDS("/project2/gilad/katie/Pilot_HumanEBs/Embryoid_Body_Pilot_Workflowr/output/merge.all.SCTwRegressOrigIdent.Harmony.rds")V<- DimPlot(merge.all, group.by = "Main_cluster_name", label = T, label.size = 2.5, repel = T)+NoLegend()
VWarning: ggrepel: 9 unlabeled data points (too many overlaps). Consider
increasing max.overlaps
pdf(file = "/project2/gilad/katie/Pilot_HumanEBs/Embryoid_Body_Pilot_Workflowr/output/pdfs/IntegrateReference_UMAP_MainClusterID_SCTregress.pdf")

V

dev.off()
Add new metadata to include Main_cluster_name as well as cluster labels from EB Pilot DE results, and orig ident of the HCL data
merge.all<- AddMetaData(merge.all, col.name = "all.labels", metadata = merge.all@meta.data$Main_cluster_name)

#for cells with NA for main_cluster_name, replace label from SCT_snn_res 0.1
for (i in (1:nrow(merge.all@meta.data))){
if (is.na(merge.all@meta.data$all.labels[i]) == T){
  merge.all@meta.data$all.labels[i]<- merge.all@meta.data$SCT_snn_res.0.1[i]
}
}

#and now replace remaining NAs with orig.ident
for (i in (1:nrow(merge.all@meta.data))){
if (is.na(merge.all@meta.data$all.labels[i]) == T){
  merge.all@meta.data$all.labels[i]<- merge.all@meta.data$orig.ident[i]
}
}
V<- DimPlot(merge.all, group.by = "all.labels", label = T, label.size = 2.5, repel = T)+NoLegend()
VWarning: ggrepel: 11 unlabeled data points (too many overlaps). Consider
increasing max.overlaps
pdf(file = "/project2/gilad/katie/Pilot_HumanEBs/Embryoid_Body_Pilot_Workflowr/output/pdfs/IntegrateReference_UMAP_allLabels_SCTregress.pdf")

V

dev.off()
V<- DimPlot(merge.all, group.by = "orig.ident", label = F, order= c("scHCL.hESC","scHCL.EB20", "EB.Pilot","Cao.EtAl"))
V
pdf(file = "/project2/gilad/katie/Pilot_HumanEBs/Embryoid_Body_Pilot_Workflowr/output/pdfs/IntegrateReference_UMAP_origident_all_SCTregress.pdf")

V

dev.off()
DimPlot(merge.all, split.by = "orig.ident", label = F, order= c("scHCL.hESC","scHCL.EB20", "EB.Pilot","Cao.EtAl"))
options(ggrepel.max.overlaps = Inf)#subset object to just my data and Cao reference, plot UMAP
Idents(merge.all)<- "orig.ident"
sub<- subset(merge.all, idents= c("Cao.EtAl", "EB.Pilot"))
V<- DimPlot(sub, group.by = "all.labels", label = T, repel = T, label.size = 2.5)+NoLegend()
V
pdf(file = "/project2/gilad/katie/Pilot_HumanEBs/Embryoid_Body_Pilot_Workflowr/output/pdfs/IntegrateReference_UMAP_EBpilotAndCao_SCTregress.pdf")

V

dev.off()
V<- DimPlot(sub, group.by = "Main_cluster_name", label = T, repel = T, label.size = 2.5)+NoLegend()
V
pdf(file = "/project2/gilad/katie/Pilot_HumanEBs/Embryoid_Body_Pilot_Workflowr/output/pdfs/IntegrateReference_UMAP_EBpilotAndCao_groupbyMainClusterName_SCTregress.pdf")

V

dev.off()
V<- DimPlot(sub, group.by = "SCT_snn_res.0.1", label = T, repel = T, label.size = 2.5)+NoLegend()
V
pdf(file = "/project2/gilad/katie/Pilot_HumanEBs/Embryoid_Body_Pilot_Workflowr/output/pdfs/IntegrateReference_UMAP_EBpilotAndCao_groupbySeuratClusterRes0.1_SCTregress.pdf")

V

dev.off()
DimPlot(sub, group.by = "orig.ident")
DimPlot(sub, group.by = "orig.ident", order="Cao.EtAl")
#Subset object to just my data and HCL references, plot UMAP
sub<- subset(merge.all, idents= c("scHCL.EB20", "EB.Pilot"))
V<- DimPlot(sub, group.by = "orig.ident", label = F)
V
sub<- subset(merge.all, idents= c("scHCL.EB20", "EB.Pilot", "Cao.EtAl"))
DimPlot(sub, group.by="orig.ident", pt.size = 0.2, label=F) 
FeaturePlot(merge.all, split.by = "orig.ident", features = c("TERF1", "POU5F1", "DPPA3"), slot = "data", pt.size = 0.1)Warning in FeaturePlot(merge.all, split.by = "orig.ident", features =
c("TERF1", : All cells have the same value (0) of POU5F1.Warning in FeaturePlot(merge.all, split.by = "orig.ident", features =
c("TERF1", : All cells have the same value (0) of DPPA3.
Warning in FeaturePlot(merge.all, split.by = "orig.ident", features =
c("TERF1", : All cells have the same value (0) of DPPA3.
DimPlot(merge.all, split.by="orig.ident",group.by = "all.labels", pt.size = 0.2, label=F) +NoLegend()
Now, will transfer labels for Cao Et Al and hESC onto my data.
#subset to remove scHCL.EB20
sub<- subset(merge.all, idents= c("Cao.EtAl", "EB.Pilot", "scHCL.hESC"))
#compute distance matrix based on harmony embeddings, dims 1:100
har_embeds<- sub@reductions$harmony@cell.embeddings

har_distmat<- as.matrix(dist(har_embeds, method="euclidean", upper=TRUE))
#vectors with cell ids from Cao.EtAl, EB.pilot, and scHCL.hESC
EB.pilot.ids<-rownames(merge.all@meta.data[merge.all@meta.data$orig.ident == "EB.Pilot",])
#subset rows to only cells in EB.pilot
sub_har_distmat<- har_distmat[rownames(har_distmat) %in% EB.pilot.ids,]
#subset cols to only cells not in EB.pilot
'%notin%'<- Negate('%in%')
sub_har_distmat<- sub_har_distmat[,colnames(sub_har_distmat) %notin% EB.pilot.ids]nearest.ref.cell.id<- NULL
nearest.ref.cell.dist<- NULL
#for loop, loop through each row
for (i in 1:nrow(sub_har_distmat)){
nearest.ref.cell.dist[i]<- min(sub_har_distmat[i,])
nearest.ref.cell.id[i]<- names(which.min(sub_har_distmat[i,]))
}
nearest.ref.table<- cbind(rownames(sub_har_distmat), nearest.ref.cell.id,nearest.ref.cell.dist)
colnames(nearest.ref.table)<- c("EB.cell.id", "nearest.ref.cell.id", "harmony.dist.to.nearest.ref.cell")#add annotation
ann<- as.data.frame(merge.all@meta.data$all.labels)
ann<- cbind(rownames(merge.all@meta.data), ann)
colnames(ann)<- c("nearest.ref.cell.id", "annotation")
nearest.ref.table<- as.data.frame(nearest.ref.table)
nearest.ann<- left_join(nearest.ref.table, ann, by=c("nearest.ref.cell.id"))
write.csv(nearest.ann, "/project2/gilad/katie/Pilot_HumanEBs/Embryoid_Body_Pilot_Workflowr/output/NearestReferenceCell.Cao.hESC.EuclideanDistanceinHarmonySpace.csv")nearest.ann<- read.csv("/project2/gilad/katie/Pilot_HumanEBs/Embryoid_Body_Pilot_Workflowr/output/NearestReferenceCell.Cao.hESC.EuclideanDistanceinHarmonySpace.csv", header=T, row.names = 1)a<- as.data.frame(table(nearest.ann$annotation))
a<- a[a$Var1 != "scHCL.EB20",]
a<- a[a$Var1 != "0",]
a<- a[a$Var1 != "1",]
a<- a[a$Var1 != "2",]
a<- a[a$Var1 != "3",]
a<- a[a$Var1 != "4",]
a<- a[a$Var1 != "5",]
a<- a[a$Var1 != "6",]
a<- a[a$Var1 != "7",]
colnames(a)<- c("reference.cell.type", "Frequency")
write.csv(a, "/project2/gilad/katie/Pilot_HumanEBs/Embryoid_Body_Pilot_Workflowr/output/NearestReferenceCell.Cao.hESC.FrequencyofEachAnnotation.csv")a<- read.csv("/project2/gilad/katie/Pilot_HumanEBs/Embryoid_Body_Pilot_Workflowr/output/NearestReferenceCell.Cao.hESC.FrequencyofEachAnnotation.csv", header=T, row.names = 1)sub<- subset(merge.all, idents= c("EB.Pilot"))
EB.cell.id<- rownames(sub@meta.data)
sub@meta.data<- cbind(sub@meta.data, EB.cell.id)
sub@meta.data<- full_join(sub@meta.data, nearest.ann, by= c("EB.cell.id"))
rownames(sub@meta.data)<- EB.cell.id
V<- DimPlot(sub, group.by="annotation", pt.size = 0.2, label.size = 2.5,label=T, repel=T) +NoLegend()
V
pdf(file = "/project2/gilad/katie/Pilot_HumanEBs/Embryoid_Body_Pilot_Workflowr/output/pdfs/IntegrateReference_UMAP_EBpilot_annotationsFromReference.pdf")

V

dev.off()
Instead of matching to just one nearest cell, we get a more robust annotation if we check a group of nearest neighbors for common annotations
mostcommon.ann<- NULL
maxann.FIVEnearest<- NULL

#for loop, loop through each row
for (i in 1:nrow(sub_har_distmat)){
  cell<- sub_har_distmat[i,]
  cell<- cell[order(cell)]
  topfive<- names(cell[1:5])

  #get the annotations of the nearest 5 reference cells
  topfiveann<- merge.all@meta.data$all.labels[rownames(merge.all@meta.data) %in% topfive]

  #if/else at least 3/5 match annotations
  maxann<- max(table(topfiveann))
  finalann<- names(which.max(table(topfiveann)))

  maxann.FIVEnearest[i]<- maxann

  if(maxann >= 3){
    mostcommon.ann[i]<- finalann
  } else {
    mostcommon.ann[i]<- "uncertain"
  }

}

CommonAnnDF<- as.data.frame(cbind(rownames(sub_har_distmat), mostcommon.ann, maxann.FIVEnearest))
colnames(CommonAnnDF)<- c("EB.cell.id", "Annotation", "NoutofFIVErefneighborsWithSameAnnotation")
write.csv(CommonAnnDF, "/project2/gilad/katie/Pilot_HumanEBs/Embryoid_Body_Pilot_Workflowr/output/MostCommonAnnotation.FiveNearestRefCells.csv")CommonAnnDF<- read.csv("/project2/gilad/katie/Pilot_HumanEBs/Embryoid_Body_Pilot_Workflowr/output/MostCommonAnnotation.FiveNearestRefCells.csv", header=T, row.names = 1)b<- table(CommonAnnDF$Annotation)
write.csv(b, "/project2/gilad/katie/Pilot_HumanEBs/Embryoid_Body_Pilot_Workflowr/output/Frequency.MostCommonAnnotation.FiveNearestRefCells.csv")b<- read.csv("/project2/gilad/katie/Pilot_HumanEBs/Embryoid_Body_Pilot_Workflowr/output/Frequency.MostCommonAnnotation.FiveNearestRefCells.csv", header=T, row.names = 1)#print fetal celltypes not present in EB data
'%notin%'<- Negate('%in%')
unique(merge.all@meta.data$Main_cluster_name)[unique(merge.all@meta.data$Main_cluster_name) %notin% b$Var1] [1] "Lymphoid cells"
[2] "Sympathoblasts"
[3] "SLC26A4_PAEP positive cells"
[4] "CSH1_CSH2 positive cells"
[5] "SATB2_LRRC7 positive cells"
[6] "Bronchiolar and alveolar epithelial cells"
[7] "Satellite cells"
[8] "Extravillous trophoblasts"
[9] "PAEP_MECOM positive cells"
[10] "STC2_TLX1 positive cells"
[11] "PDE1C_ACSM3 positive cells"
[12] NA sub<- subset(merge.all, idents= c("EB.Pilot"))
EB.cell.id<- rownames(sub@meta.data)
sub@meta.data<- cbind(sub@meta.data, EB.cell.id)
sub@meta.data<- full_join(sub@meta.data, CommonAnnDF, by= c("EB.cell.id"))
rownames(sub@meta.data)<- EB.cell.id
V<- DimPlot(sub, group.by="Annotation", pt.size = 0.2, label.size = 2.5,label=T, repel=T) +NoLegend()
V
pdf(file = "/project2/gilad/katie/Pilot_HumanEBs/Embryoid_Body_Pilot_Workflowr/output/pdfs/IntegrateReference_UMAP_EBpilot_CommonAnnotationsFromFiveReferenceNeighbors.pdf")

V

dev.off()sessionInfo()R version 3.6.1 (2019-07-05)
Platform: x86_64-pc-linux-gnu (64-bit)
Running under: Scientific Linux 7.4 (Nitrogen)
Matrix products: default
BLAS/LAPACK: /software/openblas-0.2.19-el7-x86_64/lib/libopenblas_haswellp-r0.2.19.so
locale:
[1] C
attached base packages:
[1] stats graphics grDevices utils datasets methods base
other attached packages:
[1] ggplot2_3.3.3 harmony_1.0 Rcpp_1.0.6 purrr_0.3.4
[5] tibble_3.0.4 tidyr_1.1.0 dplyr_1.0.2 loomR_0.2.1.9000
[9] hdf5r_1.3.1 R6_2.5.0 edgeR_3.28.1 limma_3.42.2
[13] Seurat_3.2.0 workflowr_1.6.2
loaded via a namespace (and not attached):
[1] Rtsne_0.15 colorspace_2.0-0 deldir_0.1-28
[4] ellipsis_0.3.1 ggridges_0.5.2 rprojroot_2.0.2
[7] fs_1.4.2 spatstat.data_1.4-3 farver_2.0.3
[10] leiden_0.3.3 listenv_0.8.0 npsurv_0.4-0
[13] bit64_4.0.5 ggrepel_0.9.0 RSpectra_0.16-0
[16] codetools_0.2-16 splines_3.6.1 lsei_1.2-0
[19] knitr_1.29 polyclip_1.10-0 jsonlite_1.7.2
[22] ica_1.0-2 cluster_2.1.0 png_0.1-7
[25] uwot_0.1.10 shiny_1.5.0 sctransform_0.2.1
[28] compiler_3.6.1 httr_1.4.2 Matrix_1.2-18
[31] fastmap_1.0.1 lazyeval_0.2.2 later_1.1.0.1
[34] htmltools_0.5.0 tools_3.6.1 rsvd_1.0.3
[37] igraph_1.2.6 gtable_0.3.0 glue_1.4.2
[40] RANN_2.6.1 reshape2_1.4.4 rappdirs_0.3.3
[43] spatstat_1.64-1 vctrs_0.3.6 gdata_2.18.0
[46] ape_5.4-1 nlme_3.1-140 lmtest_0.9-37
[49] xfun_0.16 stringr_1.4.0 globals_0.12.5
[52] mime_0.9 miniUI_0.1.1.1 lifecycle_0.2.0
[55] irlba_2.3.3 gtools_3.8.2 goftest_1.2-2
[58] future_1.18.0 MASS_7.3-51.4 zoo_1.8-8
[61] scales_1.1.1 promises_1.1.1 spatstat.utils_1.17-0
[64] parallel_3.6.1 RColorBrewer_1.1-2 yaml_2.2.1
[67] reticulate_1.20 pbapply_1.4-2 gridExtra_2.3
[70] rpart_4.1-15 stringi_1.5.3 highr_0.8
[73] caTools_1.18.0 rlang_0.4.10 pkgconfig_2.0.3
[76] bitops_1.0-6 evaluate_0.14 lattice_0.20-38
[79] ROCR_1.0-7 tensor_1.5 labeling_0.4.2
[82] patchwork_1.1.1 htmlwidgets_1.5.1 bit_4.0.4
[85] cowplot_1.1.1 tidyselect_1.1.0 RcppAnnoy_0.0.18
[88] plyr_1.8.6 magrittr_2.0.1 gplots_3.0.4
[91] generics_0.1.0 withr_2.4.2 pillar_1.4.7
[94] whisker_0.4 mgcv_1.8-28 fitdistrplus_1.0-14
[97] survival_3.2-3 abind_1.4-5 future.apply_1.6.0
[100] crayon_1.3.4 KernSmooth_2.23-15 plotly_4.9.2.1
[103] rmarkdown_2.3 locfit_1.5-9.4 grid_3.6.1
[106] data.table_1.13.4 git2r_0.26.1 digest_0.6.27
[109] xtable_1.8-4 httpuv_1.5.4 munsell_0.5.0
[112] viridisLite_0.3.0
sessionInfo()R version 3.6.1 (2019-07-05)
Platform: x86_64-pc-linux-gnu (64-bit)
Running under: Scientific Linux 7.4 (Nitrogen)
Matrix products: default
BLAS/LAPACK: /software/openblas-0.2.19-el7-x86_64/lib/libopenblas_haswellp-r0.2.19.so
locale:
[1] C
attached base packages:
[1] stats graphics grDevices utils datasets methods base
other attached packages:
[1] ggplot2_3.3.3 harmony_1.0 Rcpp_1.0.6 purrr_0.3.4
[5] tibble_3.0.4 tidyr_1.1.0 dplyr_1.0.2 loomR_0.2.1.9000
[9] hdf5r_1.3.1 R6_2.5.0 edgeR_3.28.1 limma_3.42.2
[13] Seurat_3.2.0 workflowr_1.6.2
loaded via a namespace (and not attached):
[1] Rtsne_0.15 colorspace_2.0-0 deldir_0.1-28
[4] ellipsis_0.3.1 ggridges_0.5.2 rprojroot_2.0.2
[7] fs_1.4.2 spatstat.data_1.4-3 farver_2.0.3
[10] leiden_0.3.3 listenv_0.8.0 npsurv_0.4-0
[13] bit64_4.0.5 ggrepel_0.9.0 RSpectra_0.16-0
[16] codetools_0.2-16 splines_3.6.1 lsei_1.2-0
[19] knitr_1.29 polyclip_1.10-0 jsonlite_1.7.2
[22] ica_1.0-2 cluster_2.1.0 png_0.1-7
[25] uwot_0.1.10 shiny_1.5.0 sctransform_0.2.1
[28] compiler_3.6.1 httr_1.4.2 Matrix_1.2-18
[31] fastmap_1.0.1 lazyeval_0.2.2 later_1.1.0.1
[34] htmltools_0.5.0 tools_3.6.1 rsvd_1.0.3
[37] igraph_1.2.6 gtable_0.3.0 glue_1.4.2
[40] RANN_2.6.1 reshape2_1.4.4 rappdirs_0.3.3
[43] spatstat_1.64-1 vctrs_0.3.6 gdata_2.18.0
[46] ape_5.4-1 nlme_3.1-140 lmtest_0.9-37
[49] xfun_0.16 stringr_1.4.0 globals_0.12.5
[52] mime_0.9 miniUI_0.1.1.1 lifecycle_0.2.0
[55] irlba_2.3.3 gtools_3.8.2 goftest_1.2-2
[58] future_1.18.0 MASS_7.3-51.4 zoo_1.8-8
[61] scales_1.1.1 promises_1.1.1 spatstat.utils_1.17-0
[64] parallel_3.6.1 RColorBrewer_1.1-2 yaml_2.2.1
[67] reticulate_1.20 pbapply_1.4-2 gridExtra_2.3
[70] rpart_4.1-15 stringi_1.5.3 highr_0.8
[73] caTools_1.18.0 rlang_0.4.10 pkgconfig_2.0.3
[76] bitops_1.0-6 evaluate_0.14 lattice_0.20-38
[79] ROCR_1.0-7 tensor_1.5 labeling_0.4.2
[82] patchwork_1.1.1 htmlwidgets_1.5.1 bit_4.0.4
[85] cowplot_1.1.1 tidyselect_1.1.0 RcppAnnoy_0.0.18
[88] plyr_1.8.6 magrittr_2.0.1 gplots_3.0.4
[91] generics_0.1.0 withr_2.4.2 pillar_1.4.7
[94] whisker_0.4 mgcv_1.8-28 fitdistrplus_1.0-14
[97] survival_3.2-3 abind_1.4-5 future.apply_1.6.0
[100] crayon_1.3.4 KernSmooth_2.23-15 plotly_4.9.2.1
[103] rmarkdown_2.3 locfit_1.5-9.4 grid_3.6.1
[106] data.table_1.13.4 git2r_0.26.1 digest_0.6.27
[109] xtable_1.8-4 httpuv_1.5.4 munsell_0.5.0
[112] viridisLite_0.3.0