Great job! Recording the operating system, R version, and package versions is critical for reproducibility.
Nice! There were no cached chunks for this analysis, so you can be confident that you successfully produced the results during this run.
Great job! Using relative paths to the files within your workflowr project makes it easier to run your code on other machines.
Great! You are using Git for version control. Tracking code development and connecting the code version to the results is critical for reproducibility.
The results in this page were generated with repository version e89306d. See the Past versions tab to see a history of the changes made to the R Markdown and HTML files.
Note that you need to be careful to ensure that all relevant files for the analysis have been committed to Git prior to generating the results (you can use wflow_publish or wflow_git_commit). workflowr only checks the R Markdown file, but you know if there are other scripts or data files that it depends on. Below is the status of the Git repository when the results were generated:
Ignored files:
    Ignored:    .DS_Store
    Ignored:    .Rhistory
    Ignored:    .Rproj.user/

Unstaged changes:
    Modified:   analysis/PCA_DAPC.Rmd
Note that any generated files, e.g. HTML, png, CSS, etc., are not included in this status report because it is ok for generated content to have uncommitted changes.
These are the previous versions of the repository in which changes were made to the R Markdown (analysis/PCA_DAPC.Rmd) and HTML (docs/PCA_DAPC.html) files. If you’ve configured a remote Git repository (see ?wflow_git_remote), click on the hyperlinks in the table below to view the files as they were in that past version.
| File | Version | Author | Date | Message |
|---|---|---|---|---|
| Rmd | e89306d | LucianoRogerio | 2021-11-09 | DAPC Analysis finished |
| html | e89306d | LucianoRogerio | 2021-11-09 | DAPC Analysis finished |
| Rmd | 97d638d | LucianoRogerio | 2021-11-02 | Update of html links |
| html | 97d638d | LucianoRogerio | 2021-11-02 | Update of html links |
suppressMessages(library(tidyverse))
suppressMessages(library(adegenet))
library(here)
here() starts at /Users/lbd54/Documents/GitHub/HenriqueDGenBLUPS <- readRDS(here::here("output", "BLUPsDisease.RDS"))
### Analise de Componentes Principais
BLUPS[ , 2:6] <- scale(BLUPS[ , 2:6], center = T, scale = T)
BLUPS[is.na(BLUPS)] <- 0
PCA <- prcomp(BLUPS[,-1])
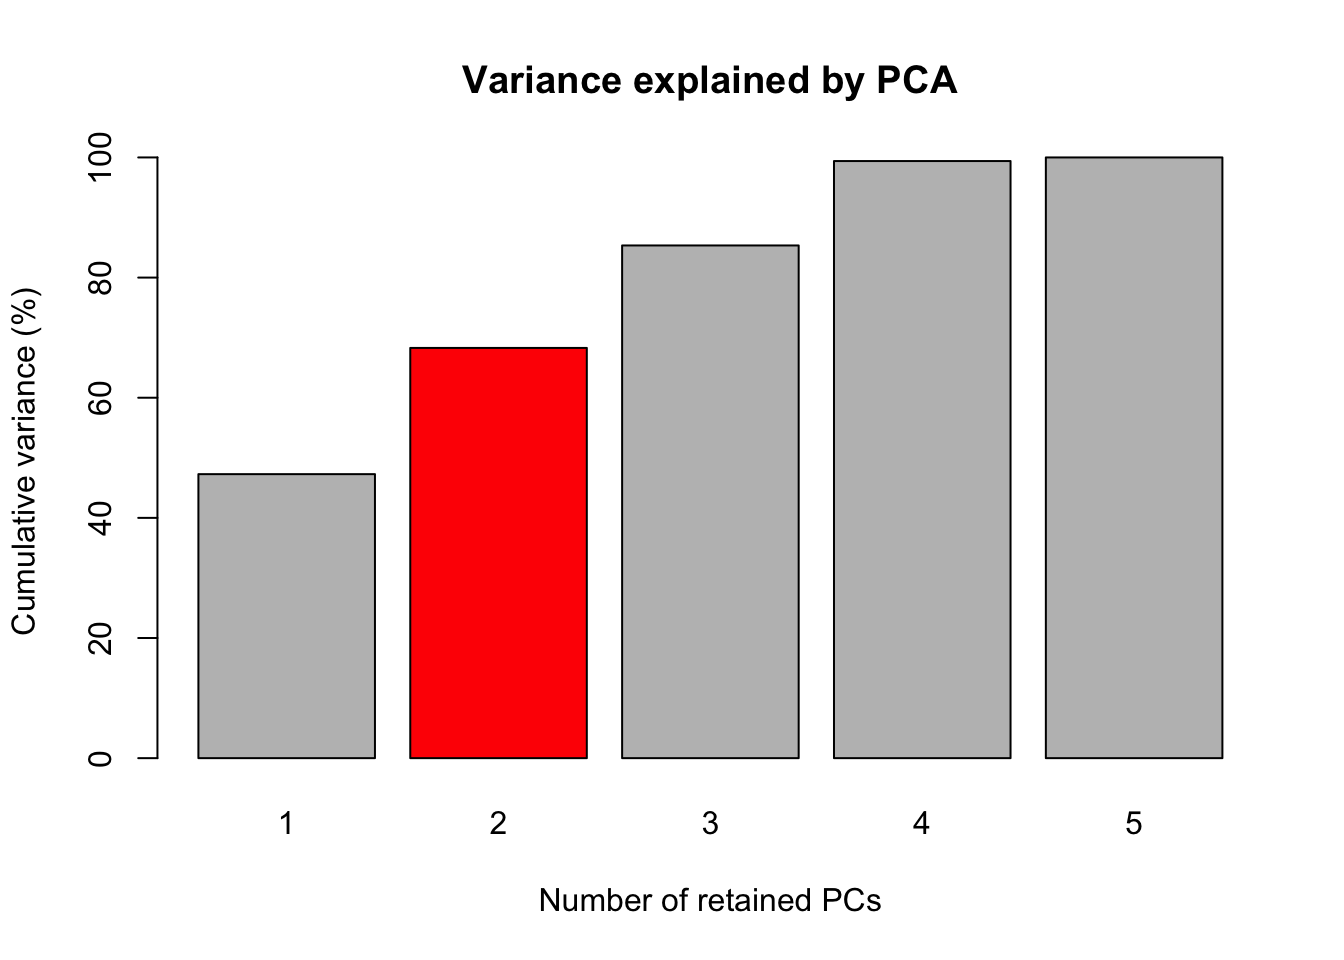
Perc <- 100*PCA$sdev^2/sum(PCA$sdev^2)
Perc[1] 47.2776653 21.0120007 17.0577803 14.0511752 0.6013786PercAc <- as.vector(rep(NA, times = length(Perc)))
for(i in 1:length(Perc)) {
PercAc[i] <- sum(Perc[1:i])
names(PercAc)[i] <- i
}
# Fig 1. Grafico de Barras das variancias acumuladas dos componentes principais para tolerancia as doencas foliares.
barplot(PercAc, main = "Variance explained by PCA",
ylab = "Cumulative variance (%)", xlab = "Number of retained PCs",
col = c("gray", "red", "gray", "gray", "gray"))
| Version | Author | Date |
|---|---|---|
| 97d638d | LucianoRogerio | 2021-11-02 |
##

PointPCA1 <- as.data.frame(PCA$x)
ArrowPCA1 <- as.data.frame(PCA$rotation)
LabelsPCA1 <- 3*ArrowPCA1
LabelsPCA1$PC2[1] <- 3
LabelsPCA1[2, 1:2] <- c(1.1, -1.1)
LabelsPCA1[3, 1:2] <- c(2.5, 0.45)
LabelsPCA1[4, 1:2] <- c(2.5, 0.15)
LabelsPCA1[5, 1:2] <- c(0.8, 0.6)

ggplot(data = PointPCA1, aes(x = PC1, y = PC2)) +
  geom_point(na.rm = T, colour = "gray") + geom_rug(col = "steelblue", alpha = 0.2, size = 1.5) +
  geom_segment(mapping = aes(x = 0, xend = 3*PC1, y = 0, yend = 3*PC2),
               colour = "red",
               data = ArrowPCA1, arrow = arrow(type = "closed",
                                               length = unit(0.2,units = "cm"))) +
  geom_text(mapping = aes(x = PC1, y = PC2, label = rownames(ArrowPCA1)),
            data = LabelsPCA1, colour = "black") +
  theme_bw() +
  xlab("PC1 - 47.28%") + ylab("PC2 - 21.01%")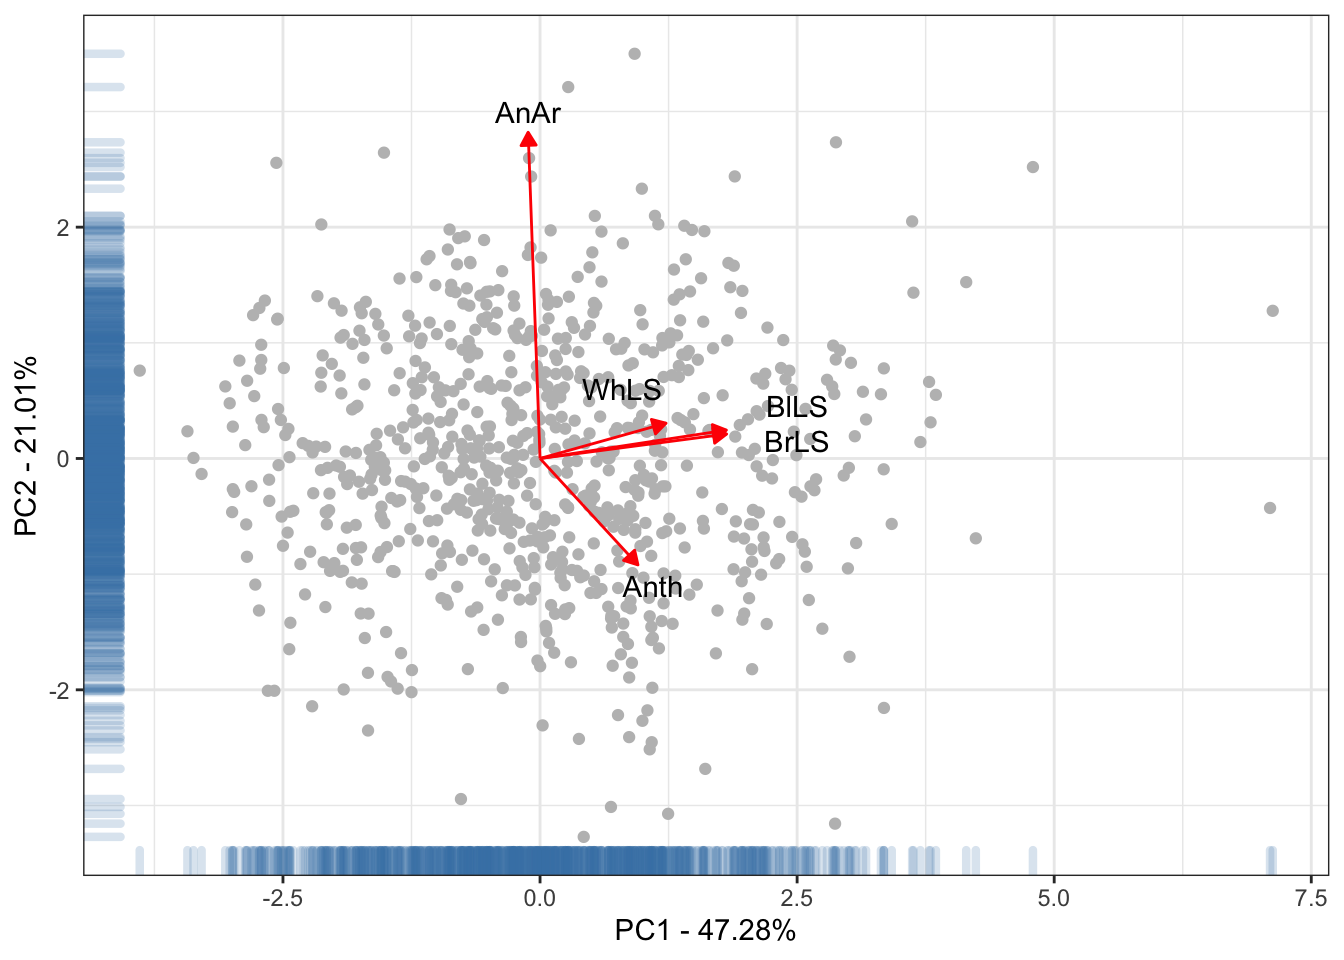
### Análise Discriminante de Componentes Principais

library(adegenet); library(ggplot2)

BLUPS <- readRDS(here::here("output", "BLUPsDisease.RDS"))
BLUPS[ , 2:6] <- scale(BLUPS[ , 2:6], center = T, scale = T)
BLUPS[is.na(BLUPS)] <- 0
rownames(BLUPS) <- BLUPS$CLONE
BLUPS$CLONE <- NULL

set.seed(1)
DAPCHen <- find.clusters(BLUPS, n.pca = 2, max.n.clust = 20, choose.n.clust = FALSE, criterion = "diffNgroup")
ClassDAPCHen <- DAPCHen$grp
DAPCHenGraph <- dapc(BLUPS, grp = ClassDAPCHen, n.pca = 2, n.da = 2)

DAPCIndPoint <- data.frame(DAPCHenGraph$ind.coord, grp = DAPCHenGraph$grp)
DAPCGrpEllip <- data.frame(DAPCHenGraph$grp.coord, grp = as.character(1:4))
ArrowDAPC <- as.data.frame(DAPCHenGraph$var.contr)
LabelsDAPC <- data.frame(Trait = rownames(ArrowDAPC), ArrowDAPC*5)
LabelsDAPC[1,3]   <- 4.7
LabelsDAPC[2,2:3] <- c(0.7, 0.8)
LabelsDAPC[3,2:3] <- c(2.5, 0.45)
LabelsDAPC[4,2:3] <- c(2.5, -0.35)
LabelsDAPC[5,2:3] <- c(0.3, -0.35)

ggplot(data = DAPCIndPoint, aes(x = LD1, y = LD2, color = grp)) +
  geom_point(na.rm = T) + geom_rug(col = "steelblue", alpha = 0.2, size = 1.5) +
  theme_bw() +
  scale_color_viridis_d() +
  stat_ellipse(geom="polygon", aes(fill = grp),
               alpha = 0.2,
               show.legend = FALSE,
               level = 0.95) + guides(color = "none") +
  geom_label(data = DAPCGrpEllip, mapping = aes(x = LD1, y = LD2, label = grp)) +
  geom_segment(mapping = aes(x = 0, xend = 5*LD1, y = 0, yend = 5*LD2),
               colour = "red",
               data = ArrowDAPC, arrow = arrow(type = "closed",
                                               length = unit(0.2,units = "cm"))) +
    geom_text(mapping = aes(x = LD1, y = LD2, label = Trait),
            data = LabelsDAPC, colour = "black") +
  xlab("LD1 - 56.54%") + ylab("LD2 - 11.75%")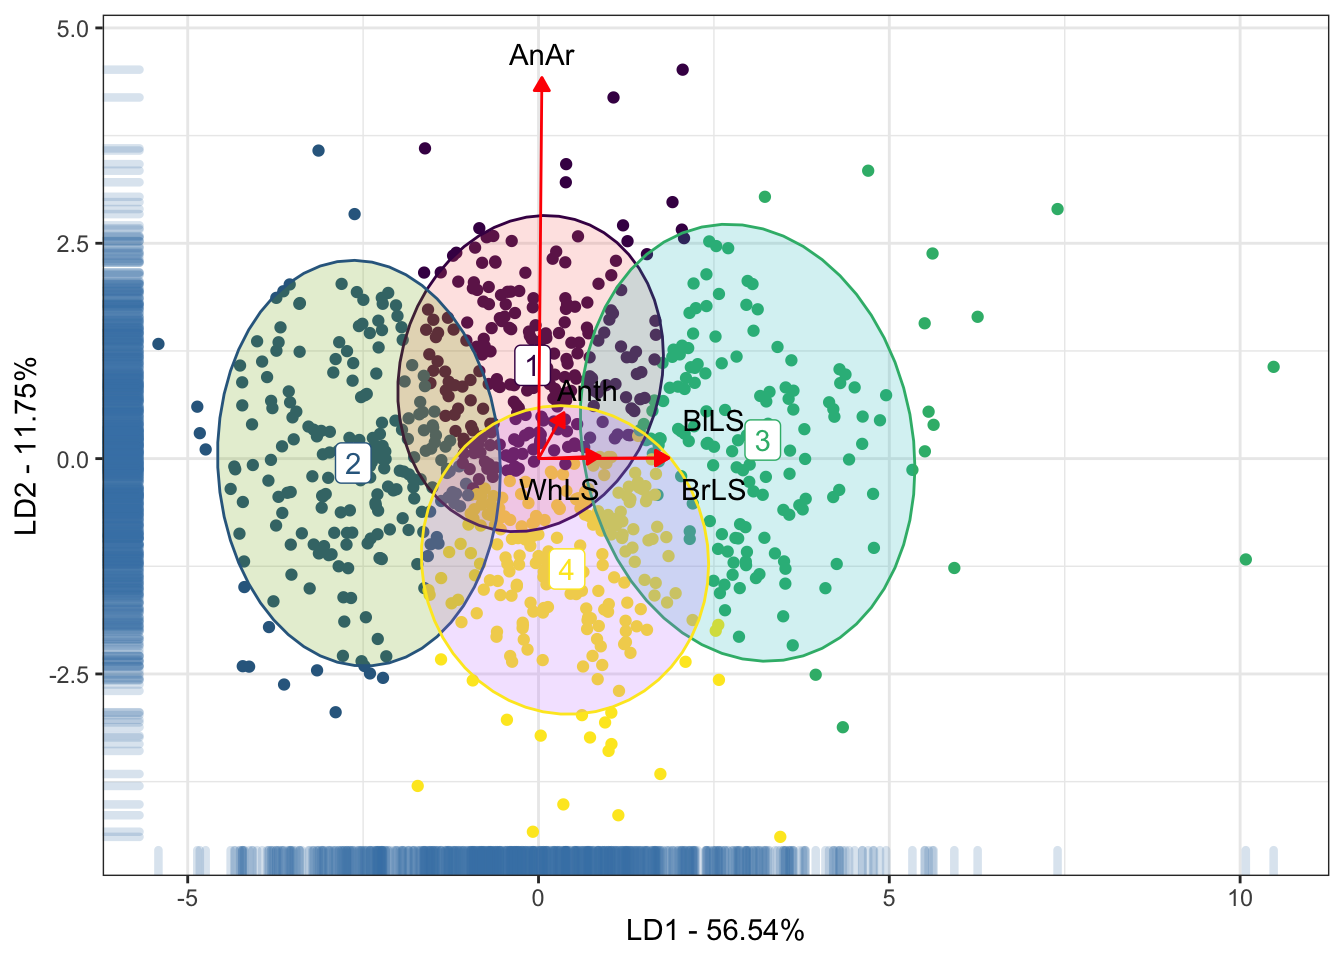
| Version | Author | Date |
|---|---|---|
| e89306d | LucianoRogerio | 2021-11-09 |
library(reshape2)
Attaching package: 'reshape2'The following object is masked from 'package:tidyr':
smithsBLUPS$CLONE <- rownames(BLUPS)
BLUPS$Grp <- DAPCHenGraph$grp
BLUPSBoxplot <- melt(BLUPS, variable.name = "Trait", value.name = "Y", id.vars = c("CLONE", "Grp"))
ggplot(data = BLUPSBoxplot, mapping = aes(x = Grp, y = Y, fill = Grp)) + ylim(-3,4) +
geom_boxplot(outlier.shape = NA) + facet_wrap(facets = ~ Trait, ncol = 3) +
scale_fill_viridis_d() + guides(fill = "none") + ylab("BLUPs") + xlab("DACP Group")Warning: Removed 6 rows containing non-finite values (stat_boxplot).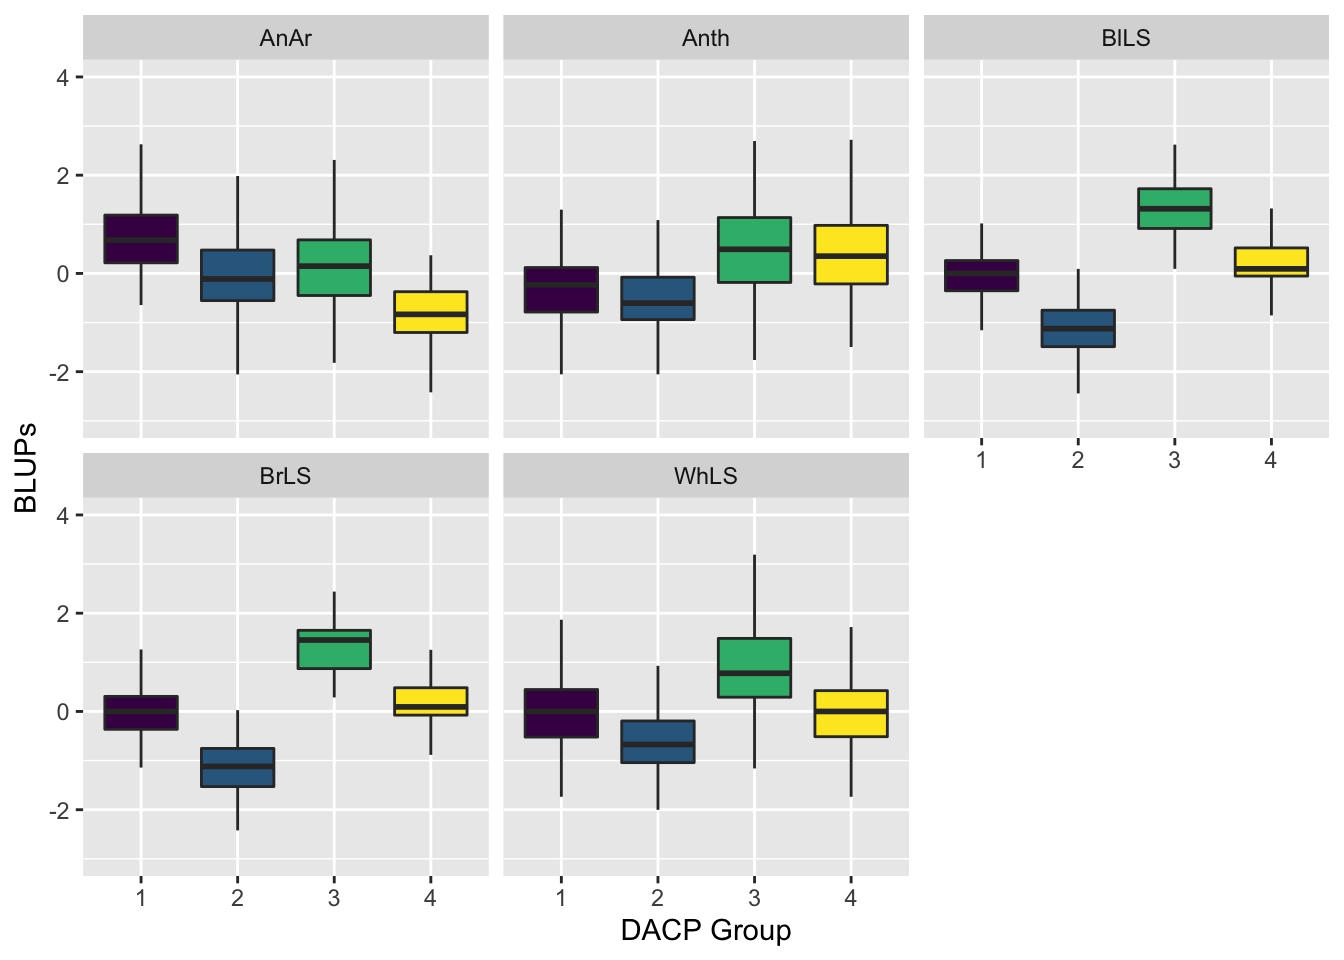
| Version | Author | Date |
|---|---|---|
| e89306d | LucianoRogerio | 2021-11-09 |
Next page Last page Back to home
sessionInfo()R version 4.1.1 (2021-08-10)
Platform: aarch64-apple-darwin20 (64-bit)
Running under: macOS Big Sur 11.6.1
Matrix products: default
BLAS: /Library/Frameworks/R.framework/Versions/4.1-arm64/Resources/lib/libRblas.0.dylib
LAPACK: /Library/Frameworks/R.framework/Versions/4.1-arm64/Resources/lib/libRlapack.dylib
locale:
[1] en_US.UTF-8/en_US.UTF-8/en_US.UTF-8/C/en_US.UTF-8/en_US.UTF-8
attached base packages:
[1] stats graphics grDevices utils datasets methods base
other attached packages:
[1] reshape2_1.4.4 here_1.0.1 adegenet_2.1.5 ade4_1.7-18
[5] forcats_0.5.1 stringr_1.4.0 dplyr_1.0.7 purrr_0.3.4
[9] readr_2.0.2 tidyr_1.1.4 tibble_3.1.5 ggplot2_3.3.5
[13] tidyverse_1.3.1
loaded via a namespace (and not attached):
[1] nlme_3.1-152 fs_1.5.0 lubridate_1.8.0 httr_1.4.2
[5] rprojroot_2.0.2 tools_4.1.1 backports_1.2.1 bslib_0.3.1
[9] utf8_1.2.2 R6_2.5.1 vegan_2.5-7 DBI_1.1.1
[13] mgcv_1.8-36 colorspace_2.0-2 permute_0.9-5 withr_2.4.2
[17] tidyselect_1.1.1 compiler_4.1.1 git2r_0.28.0 cli_3.1.0
[21] rvest_1.0.2 xml2_1.3.2 labeling_0.4.2 sass_0.4.0
[25] scales_1.1.1 digest_0.6.28 rmarkdown_2.11 pkgconfig_2.0.3
[29] htmltools_0.5.2 highr_0.9 dbplyr_2.1.1 fastmap_1.1.0
[33] rlang_0.4.12 readxl_1.3.1 rstudioapi_0.13 shiny_1.7.1
[37] farver_2.1.0 jquerylib_0.1.4 generics_0.1.1 jsonlite_1.7.2
[41] magrittr_2.0.1 Matrix_1.3-4 Rcpp_1.0.7 munsell_0.5.0
[45] fansi_0.5.0 ape_5.5 lifecycle_1.0.1 stringi_1.7.5
[49] whisker_0.4 yaml_2.2.1 MASS_7.3-54 plyr_1.8.6
[53] grid_4.1.1 parallel_4.1.1 promises_1.2.0.1 crayon_1.4.2
[57] lattice_0.20-44 haven_2.4.3 splines_4.1.1 hms_1.1.1
[61] knitr_1.36 pillar_1.6.4 igraph_1.2.7 seqinr_4.2-8
[65] reprex_2.0.1 glue_1.4.2 evaluate_0.14 modelr_0.1.8
[69] vctrs_0.3.8 tzdb_0.1.2 httpuv_1.6.3 cellranger_1.1.0
[73] gtable_0.3.0 assertthat_0.2.1 xfun_0.27 mime_0.12
[77] xtable_1.8-4 broom_0.7.9 later_1.3.0 viridisLite_0.4.0
[81] workflowr_1.6.2 cluster_2.1.2 ellipsis_0.3.2