Annotate Macrophage clusters
Jovana Maksimovic
May 20, 2024
Last updated: 2024-05-20
Checks: 7 0
Knit directory: paed-inflammation-CITEseq/
This reproducible R Markdown analysis was created with workflowr (version 1.7.1). The Checks tab describes the reproducibility checks that were applied when the results were created. The Past versions tab lists the development history.
Great! Since the R Markdown file has been committed to the Git repository, you know the exact version of the code that produced these results.
Great job! The global environment was empty. Objects defined in the global environment can affect the analysis in your R Markdown file in unknown ways. For reproduciblity it’s best to always run the code in an empty environment.
The command set.seed(20240216) was run prior to running
the code in the R Markdown file. Setting a seed ensures that any results
that rely on randomness, e.g. subsampling or permutations, are
reproducible.
Great job! Recording the operating system, R version, and package versions is critical for reproducibility.
Nice! There were no cached chunks for this analysis, so you can be confident that you successfully produced the results during this run.
Great job! Using relative paths to the files within your workflowr project makes it easier to run your code on other machines.
Great! You are using Git for version control. Tracking code development and connecting the code version to the results is critical for reproducibility.
The results in this page were generated with repository version 5fef905. See the Past versions tab to see a history of the changes made to the R Markdown and HTML files.
Note that you need to be careful to ensure that all relevant files for
the analysis have been committed to Git prior to generating the results
(you can use wflow_publish or
wflow_git_commit). workflowr only checks the R Markdown
file, but you know if there are other scripts or data files that it
depends on. Below is the status of the Git repository when the results
were generated:
Ignored files:
    Ignored:    .Rhistory
    Ignored:    .Rproj.user/
    Ignored:    data/C133_Neeland_batch1/
    Ignored:    data/C133_Neeland_merged/
    Ignored:    renv/library/
    Ignored:    renv/staging/
Note that any generated files, e.g. HTML, png, CSS, etc., are not included in this status report because it is ok for generated content to have uncommitted changes.
These are the previous versions of the repository in which changes were
made to the R Markdown
(analysis/10.0_manual_annotations_macro_cells_decontx.Rmd)
and HTML
(docs/10.0_manual_annotations_macro_cells_decontx.html)
files. If you’ve configured a remote Git repository (see
?wflow_git_remote), click on the hyperlinks in the table
below to view the files as they were in that past version.
| File | Version | Author | Date | Message |
|---|---|---|---|---|
| Rmd | 5fef905 | Jovana Maksimovic | 2024-05-20 | wflow_publish("analysis/10.0_manual_annotations_macro_cells_decontx.Rmd") |
| Rmd | 9873b3d | Jovana Maksimovic | 2024-05-20 | Add macrophage cluster annotations and annotation analysis |
Load libraries
Load Data
ambient <- "_decontx"
out <- here("data",
            "C133_Neeland_merged",
            glue("C133_Neeland_full_clean{ambient}_integrated_clustered_macrophages.SEU.rds"))
seuInt <- readRDS(file = out)

seuInt
An object of class Seurat
41688 features across 141121 samples within 5 assays
Active assay: integrated (3000 features, 3000 variable features)
4 other assays present: RNA, ADT, ADT.dsb, SCT
2 dimensional reductions calculated: pca, umapUpdate group labels
seuInt@meta.data %>%
  data.frame %>%
  mutate(Status = ifelse(str_detect(Treatment, "ivacaftor"),
                         "CF ivacaftor",
                         ifelse(str_detect(Treatment, "orkambi"),
                                "CF lumacaftor-ivacaftor",
                                ifelse(Treatment == "untreated",
                                       "CF no-modulator",
                                       "non-CF control"))),
         Status_sub = ifelse(str_detect(Treatment, "ivacaftor"),
                         "CF.IVA",
                         ifelse(str_detect(Treatment, "orkambi"),
                                "CF.LUMA_IVA",
                                ifelse(Treatment == "untreated",
                                       "CF.NO_MOD",
                                       "NON_CF.CTRL"))),
         Group = ifelse(!Status_sub %in% "NON_CF.CTRL",
                        paste(Status_sub,
                              toupper(substr(Severity, 1, 1)),
                              sep = "."),
                        Status_sub),
         Severity = tolower(Severity),
         Participant = strsplit2(sample.id, ".", fixed = TRUE)[,1]) -> seuInt@meta.data
Sub-cluster labelling
Load manual annotations
labels <- read_excel(here("data",
                          "cluster_annotations",
                          "macrophages_ambientRNAremoval_01.05.24.xlsx"))

# set selected cluster resolution
grp <- "integrated_snn_res.0.6"
seuInt@meta.data %>%
  rownames_to_column(var = "cell") %>%
  left_join(labels %>%
              mutate(Cluster = as.factor(Cluster),
                     Annotation = as.factor(Annotation),
                     Broad = as.factor(Broad)),
            by = c("integrated_snn_res.0.6" = "Cluster")) %>%
  column_to_rownames(var = "cell") -> seuInt@meta.data

seuInt$Annotation <- fct_drop(seuInt$Annotation)
seuInt$Broad <- fct_drop(seuInt$Broad)
seuInt
An object of class Seurat
41688 features across 141121 samples within 5 assays
Active assay: integrated (3000 features, 3000 variable features)
4 other assays present: RNA, ADT, ADT.dsb, SCT
2 dimensional reductions calculated: pca, umapVisualise annotations
options(ggrepel.max.overlaps = Inf)
DimPlot(seuInt, reduction = 'umap', label = TRUE, repel = TRUE,
        label.size = 3, group.by = "integrated_snn_res.0.6") +
  NoLegend() -> p1

DimPlot(seuInt, reduction = 'umap', label = FALSE, group.by = "Annotation") +
  scale_color_paletteer_d("miscpalettes::pastel") +
  theme(text = element_text(size = 9),
        axis.text = element_blank(),
        axis.ticks = element_blank()) +
  NoLegend() -> p2

DimPlot(seuInt, reduction = 'umap', label = FALSE, group.by = "Broad") +
  NoLegend() +
  scale_color_paletteer_d("miscpalettes::pastel") +
  theme(text = element_text(size = 9),
        axis.text = element_blank(),
        axis.ticks = element_blank()) -> p3

p1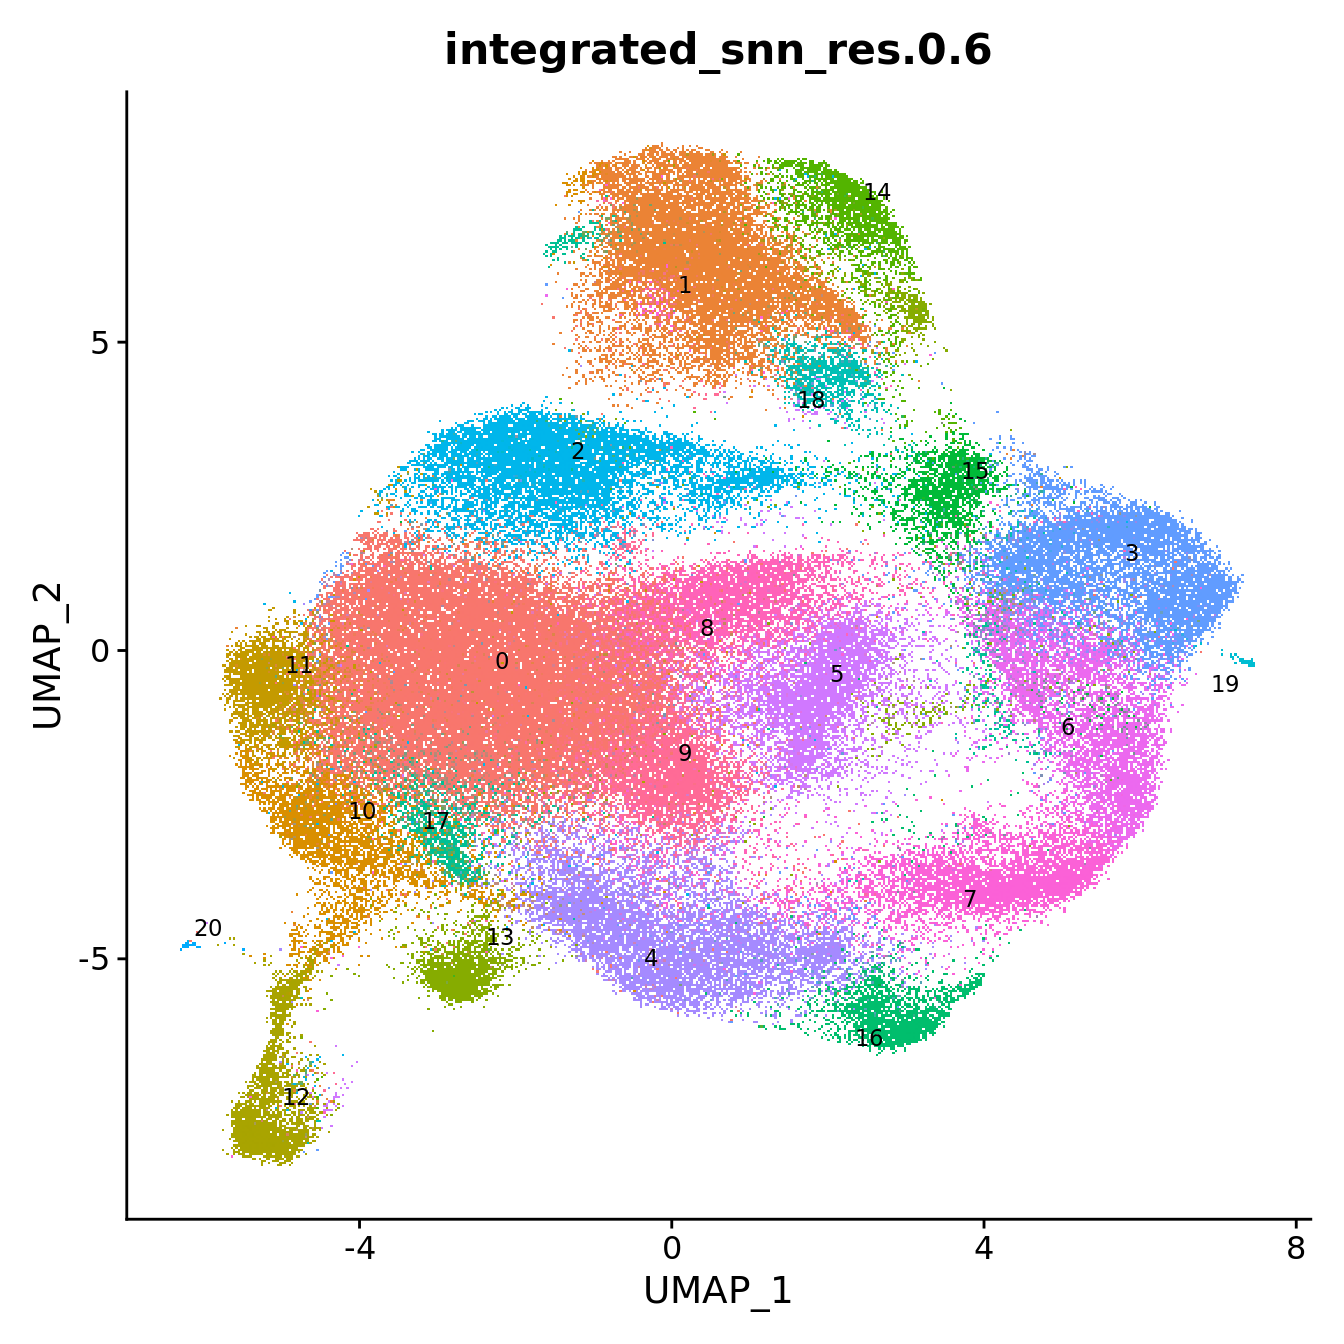
LabelClusters(p2, id = "Annotation", fontface = "bold", repel = TRUE, size = 3.5)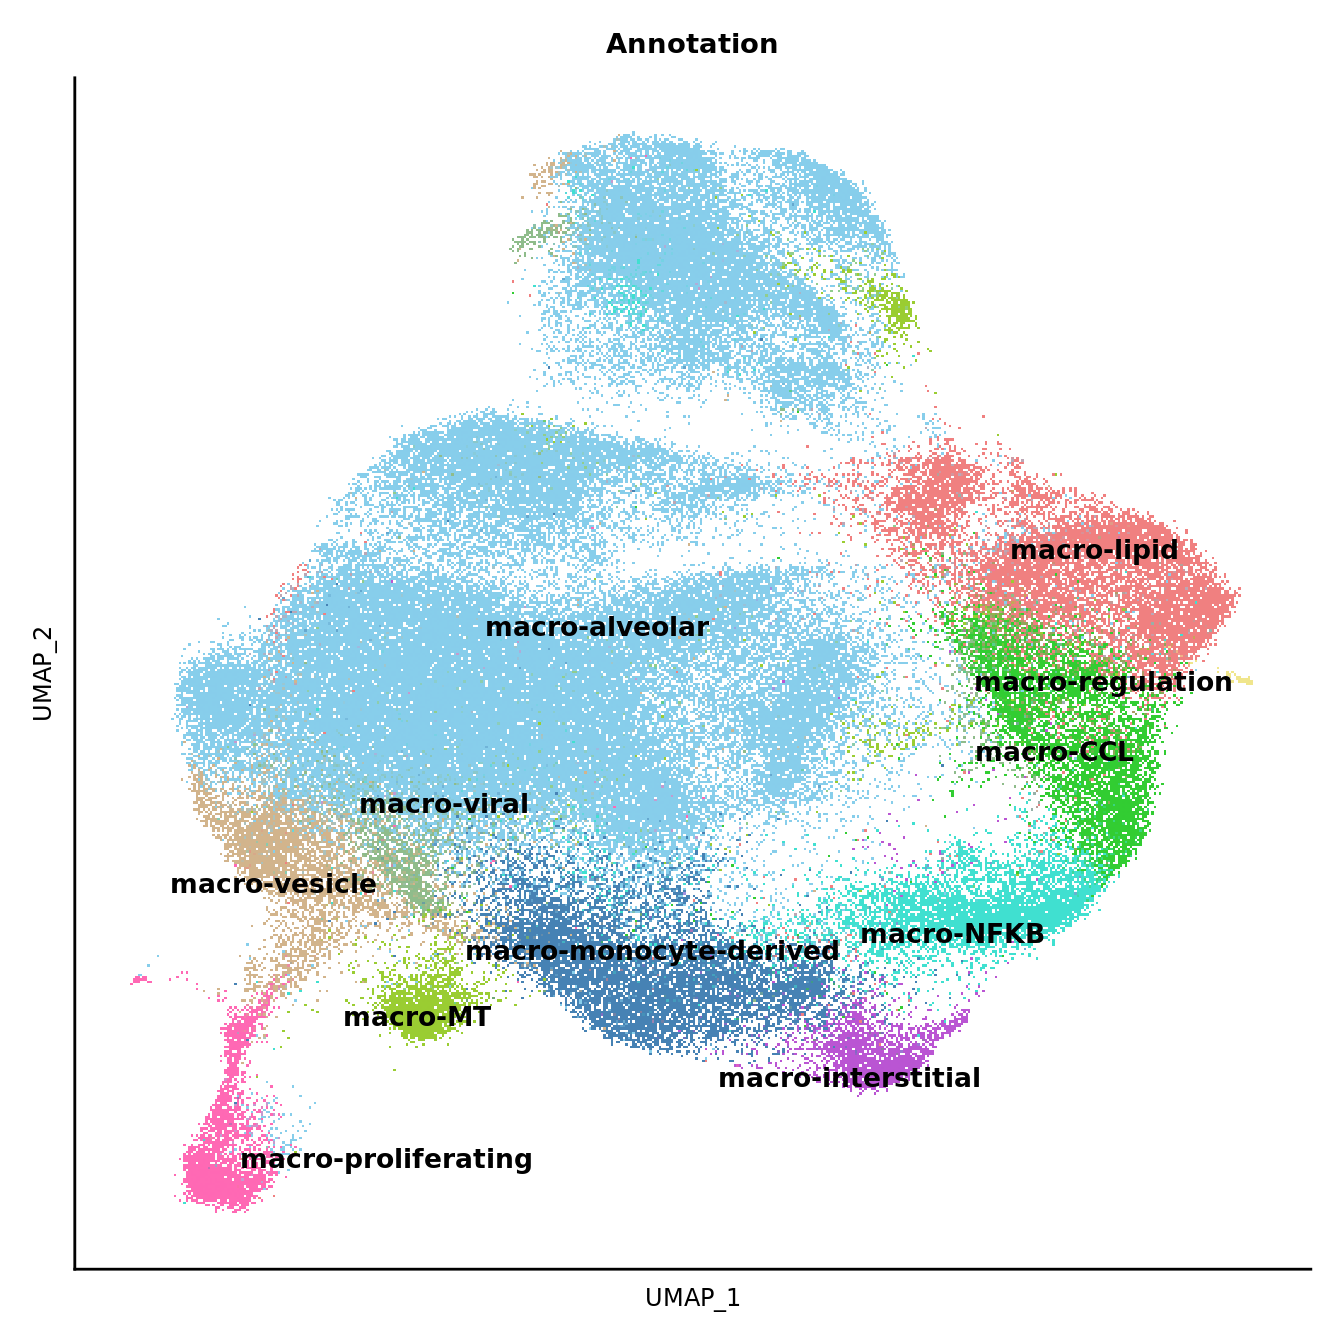
LabelClusters(p3, id = "Broad", fontface = "bold", repel = TRUE, size = 3.5)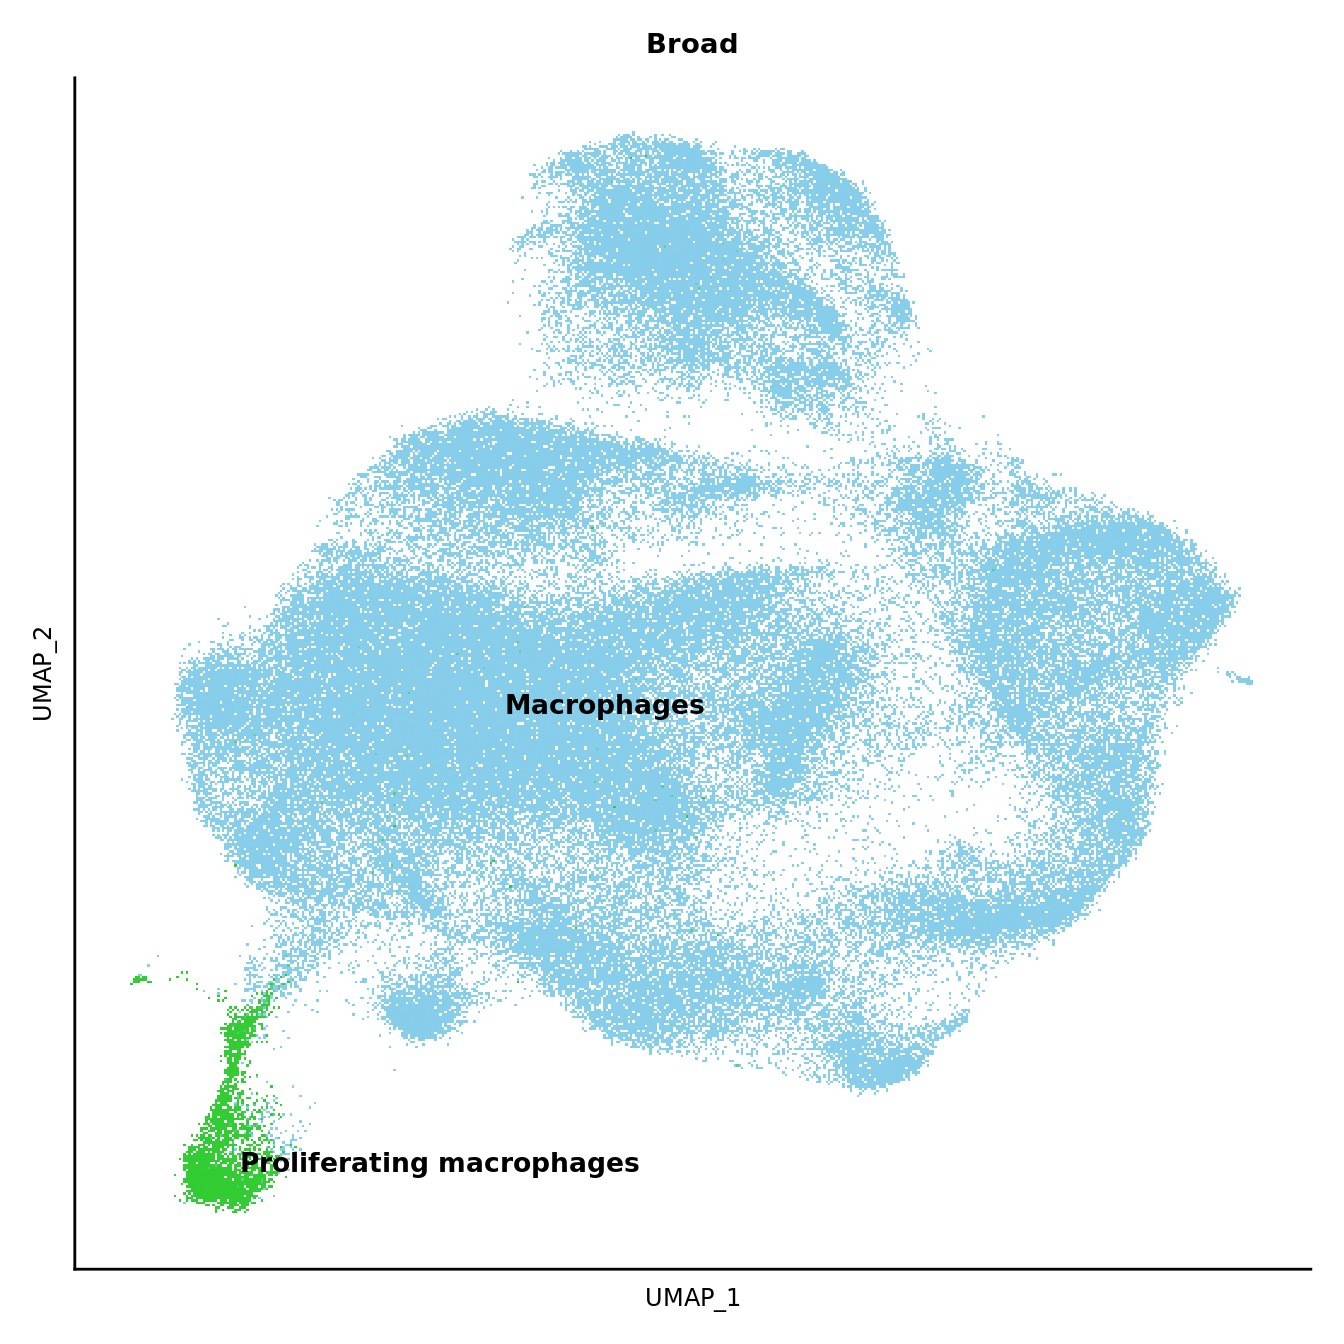
No. cells per cluster
seuInt@meta.data %>%
  ggplot(aes(x = Annotation, fill = Annotation)) +
  geom_bar() +
  geom_text(aes(label = after_stat(count)), stat = "count",
            vjust = -0.5, colour = "black", size = 2) +
  theme(axis.text.x = element_text(angle = 90, vjust = 0.5, hjust = 1)) +
  NoLegend() +
  scale_fill_paletteer_d("miscpalettes::pastel")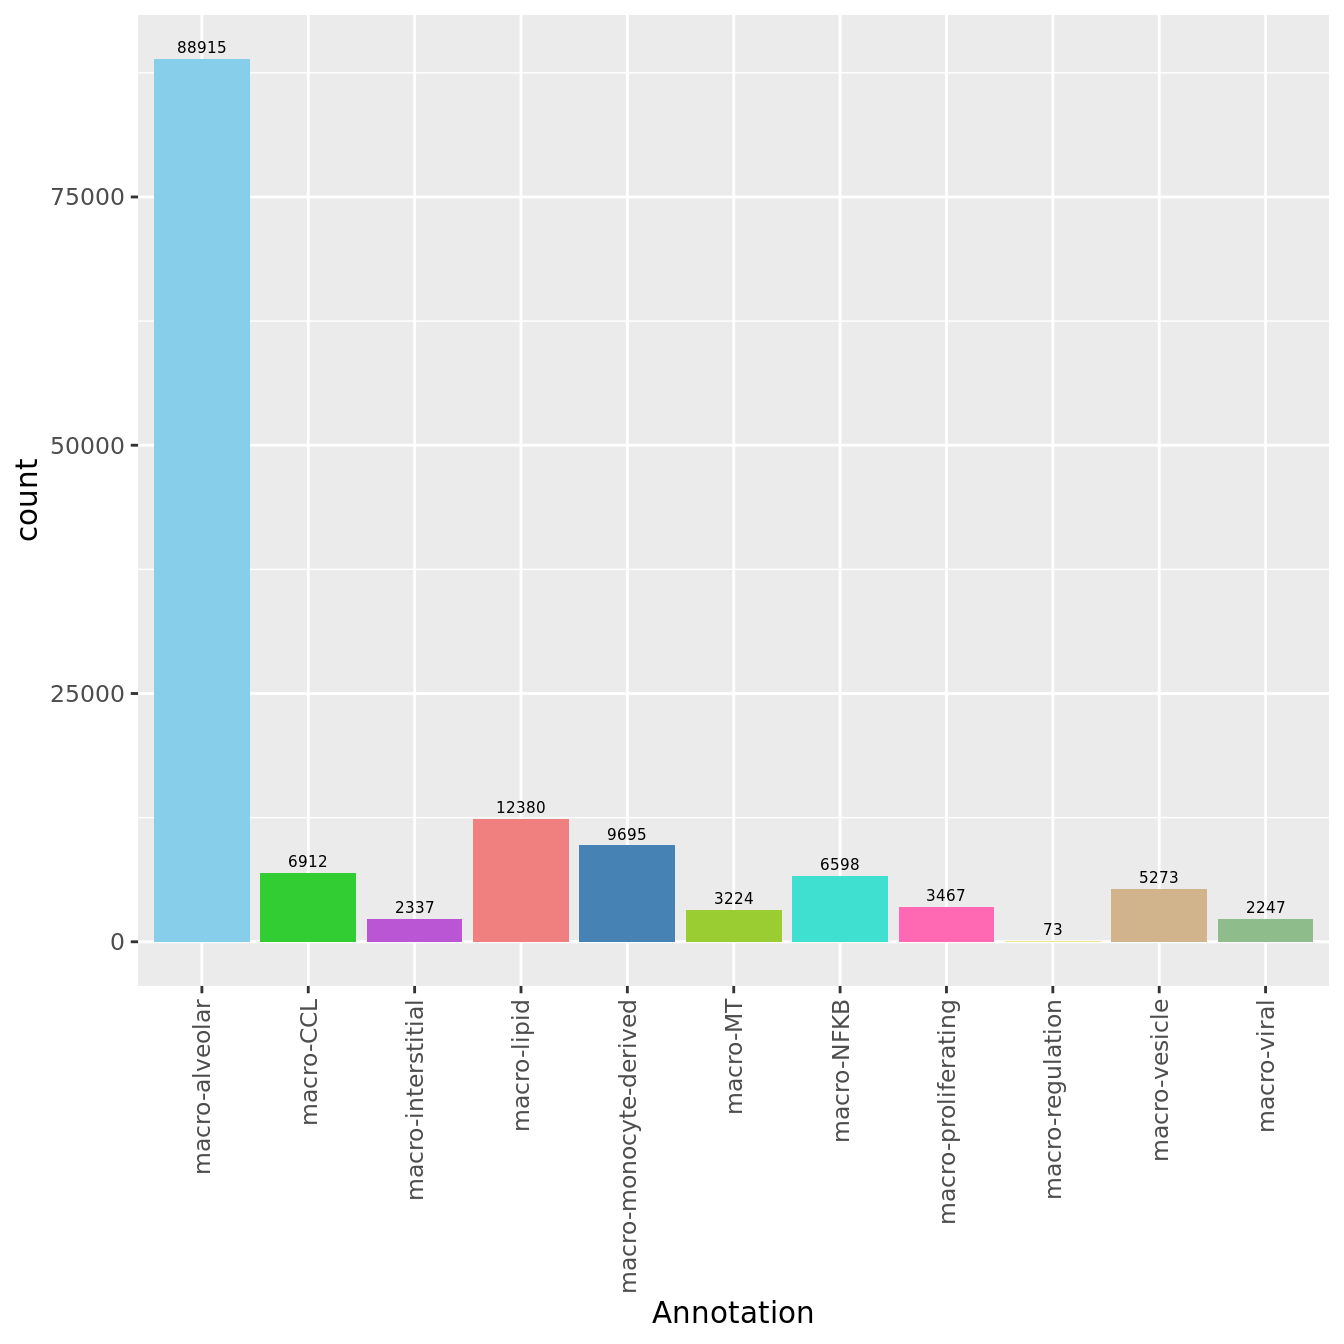
No. cells per cluster by disease
seuInt@meta.data %>%
  ggplot(aes(x = Annotation, fill = Status_sub)) +
  geom_bar(position = "dodge") +
  geom_text(aes(label = ..count..), stat = "count",
            vjust = -0.5, colour = "black", size = 2,
            position=position_dodge(width=0.9)) +
  theme(axis.text.x = element_text(angle = 90, vjust = 0.5, hjust = 1),
        legend.position = "bottom")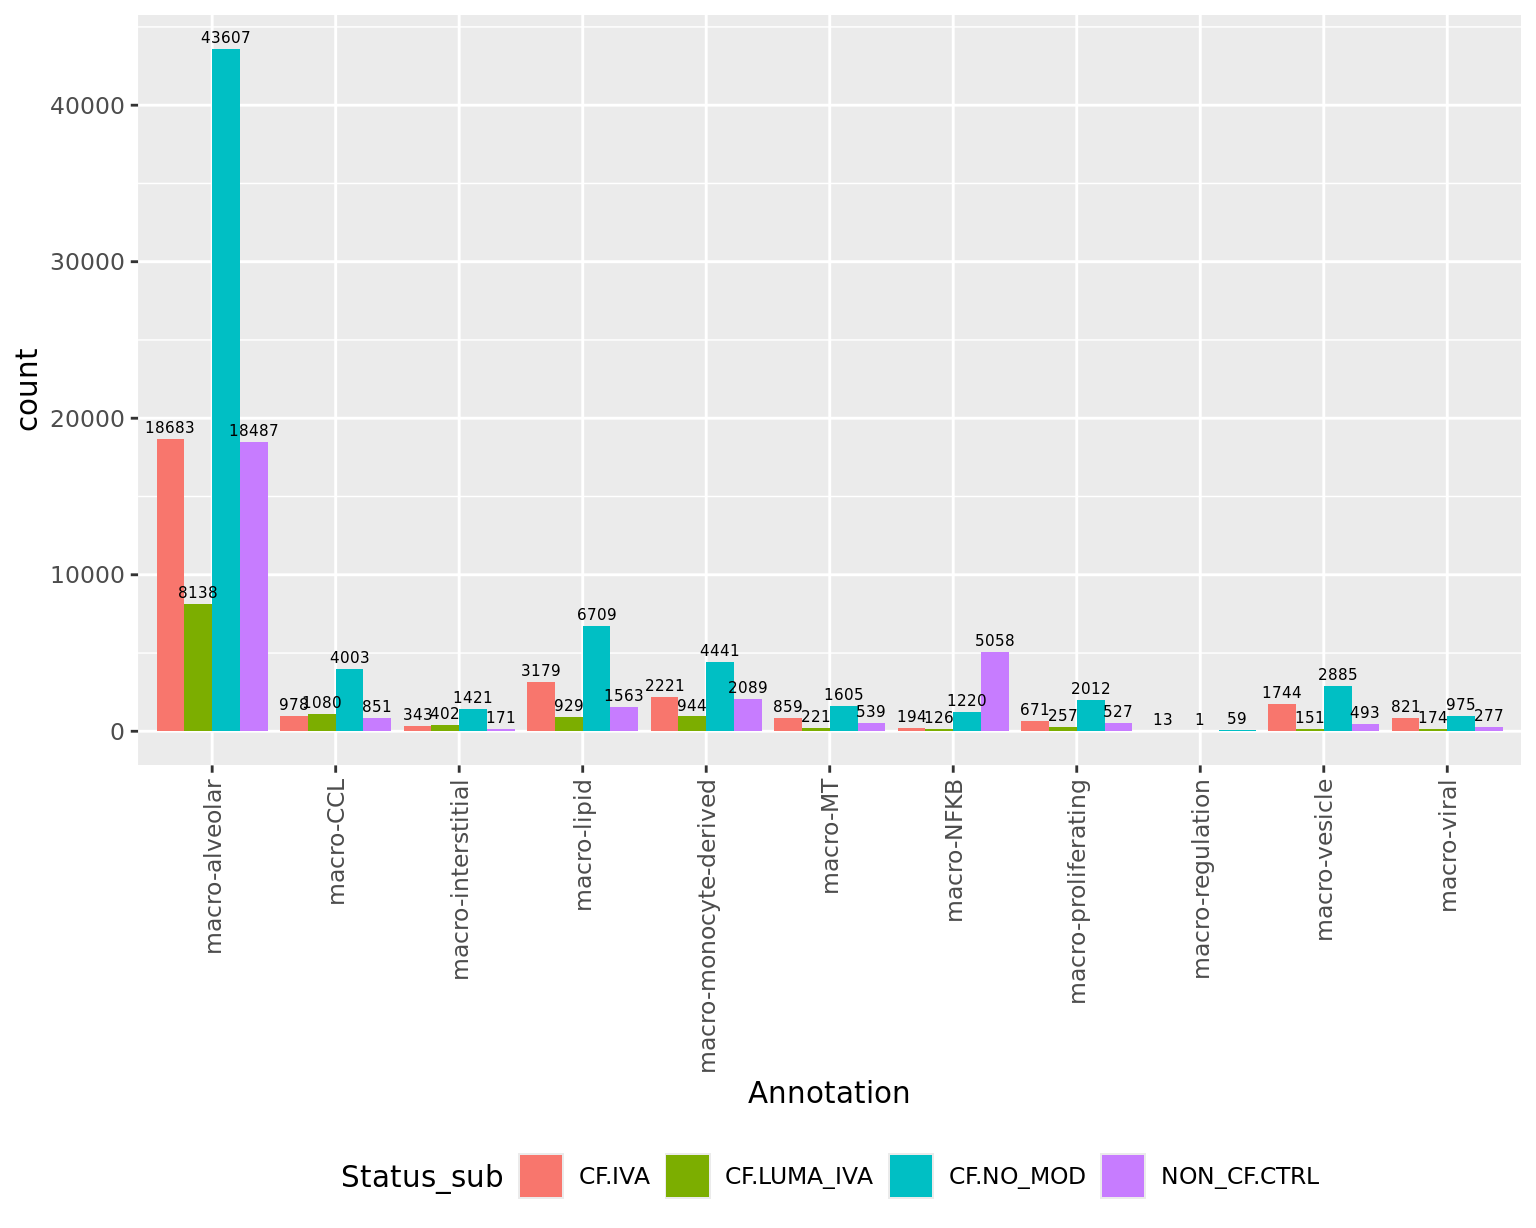
seuInt@meta.data %>%
  count(Annotation) %>%
  mutate(perc = round(n/sum(n)*100, 1)) %>%
  dplyr::rename(`Cell Label` = "Annotation",
                `No. Cells` = n,
                `% Cells` = perc) %>%
knitr::kable()| Cell Label | No. Cells | % Cells |
|---|---|---|
| macro-alveolar | 88915 | 63.0 |
| macro-CCL | 6912 | 4.9 |
| macro-interstitial | 2337 | 1.7 |
| macro-lipid | 12380 | 8.8 |
| macro-monocyte-derived | 9695 | 6.9 |
| macro-MT | 3224 | 2.3 |
| macro-NFKB | 6598 | 4.7 |
| macro-proliferating | 3467 | 2.5 |
| macro-regulation | 73 | 0.1 |
| macro-vesicle | 5273 | 3.7 |
| macro-viral | 2247 | 1.6 |
RNA marker gene analysis
Adapted from Dr. Belinda Phipson’s work for [@Sim2021-cg].
Test for marker genes using limma
# limma-trend for DE
Idents(seuInt) <- "Annotation"

logcounts <- normCounts(DGEList(as.matrix(seuInt[["RNA"]]@counts)),
                        log = TRUE, prior.count = 0.5)
entrez <- AnnotationDbi::mapIds(org.Hs.eg.db,
                                keys = rownames(logcounts),
                                column = c("ENTREZID"),
                                keytype = "SYMBOL",
                                multiVals = "first")
# remove genes without entrez IDs as these are difficult to interpret biologically
logcounts <- logcounts[!is.na(entrez),]
# remove confounding genes from counts table e.g. mitochondrial, ribosomal etc.
# remove HLA, immunoglobulin, RNA, MT, and RP genes from marker gene analysis
var_regex = '^HLA-|^IG[HJKL]|^RNA|^MT-|^RP'
logcounts <- logcounts[!str_detect(rownames(logcounts), var_regex),]

maxclust <- length(levels(Idents(seuInt))) - 1

clustgrp <- seuInt$Annotation
clustgrp <- factor(clustgrp)
donor <- factor(seuInt$sample.id)
batch <- factor(seuInt$Batch)

design <- model.matrix(~ 0 + clustgrp + donor)
colnames(design)[1:(length(levels(clustgrp)))] <- levels(clustgrp)

# Create contrast matrix
mycont <- matrix(NA, ncol = length(levels(clustgrp)),
                 nrow = length(levels(clustgrp)))
rownames(mycont) <- colnames(mycont) <- levels(clustgrp)
diag(mycont) <- 1
mycont[upper.tri(mycont)] <- -1/(length(levels(factor(clustgrp))) - 1)
mycont[lower.tri(mycont)] <- -1/(length(levels(factor(clustgrp))) - 1)

# Fill out remaining rows with 0s
zero.rows <- matrix(0, ncol = length(levels(clustgrp)),
                    nrow = (ncol(design) - length(levels(clustgrp))))
fullcont <- rbind(mycont, zero.rows)
rownames(fullcont) <- colnames(design)

fit <- lmFit(logcounts, design)

fit.cont <- contrasts.fit(fit, contrasts = fullcont)
fit.cont <- eBayes(fit.cont, trend = TRUE, robust = TRUE)

summary(decideTests(fit.cont))
macro-alveolar macro-CCL macro-interstitial macro-lipid
Down 5429 5266 5365 5631
NotSig 6722 8237 6586 7614
Up 3471 2119 3671 2377
macro-monocyte-derived macro-MT macro-NFKB macro-proliferating
Down 4538 4128 5052 3151
NotSig 7296 8553 9659 6165
Up 3788 2941 911 6306
macro-regulation macro-vesicle macro-viral
Down 3209 5778 2760
NotSig 9098 8273 8989
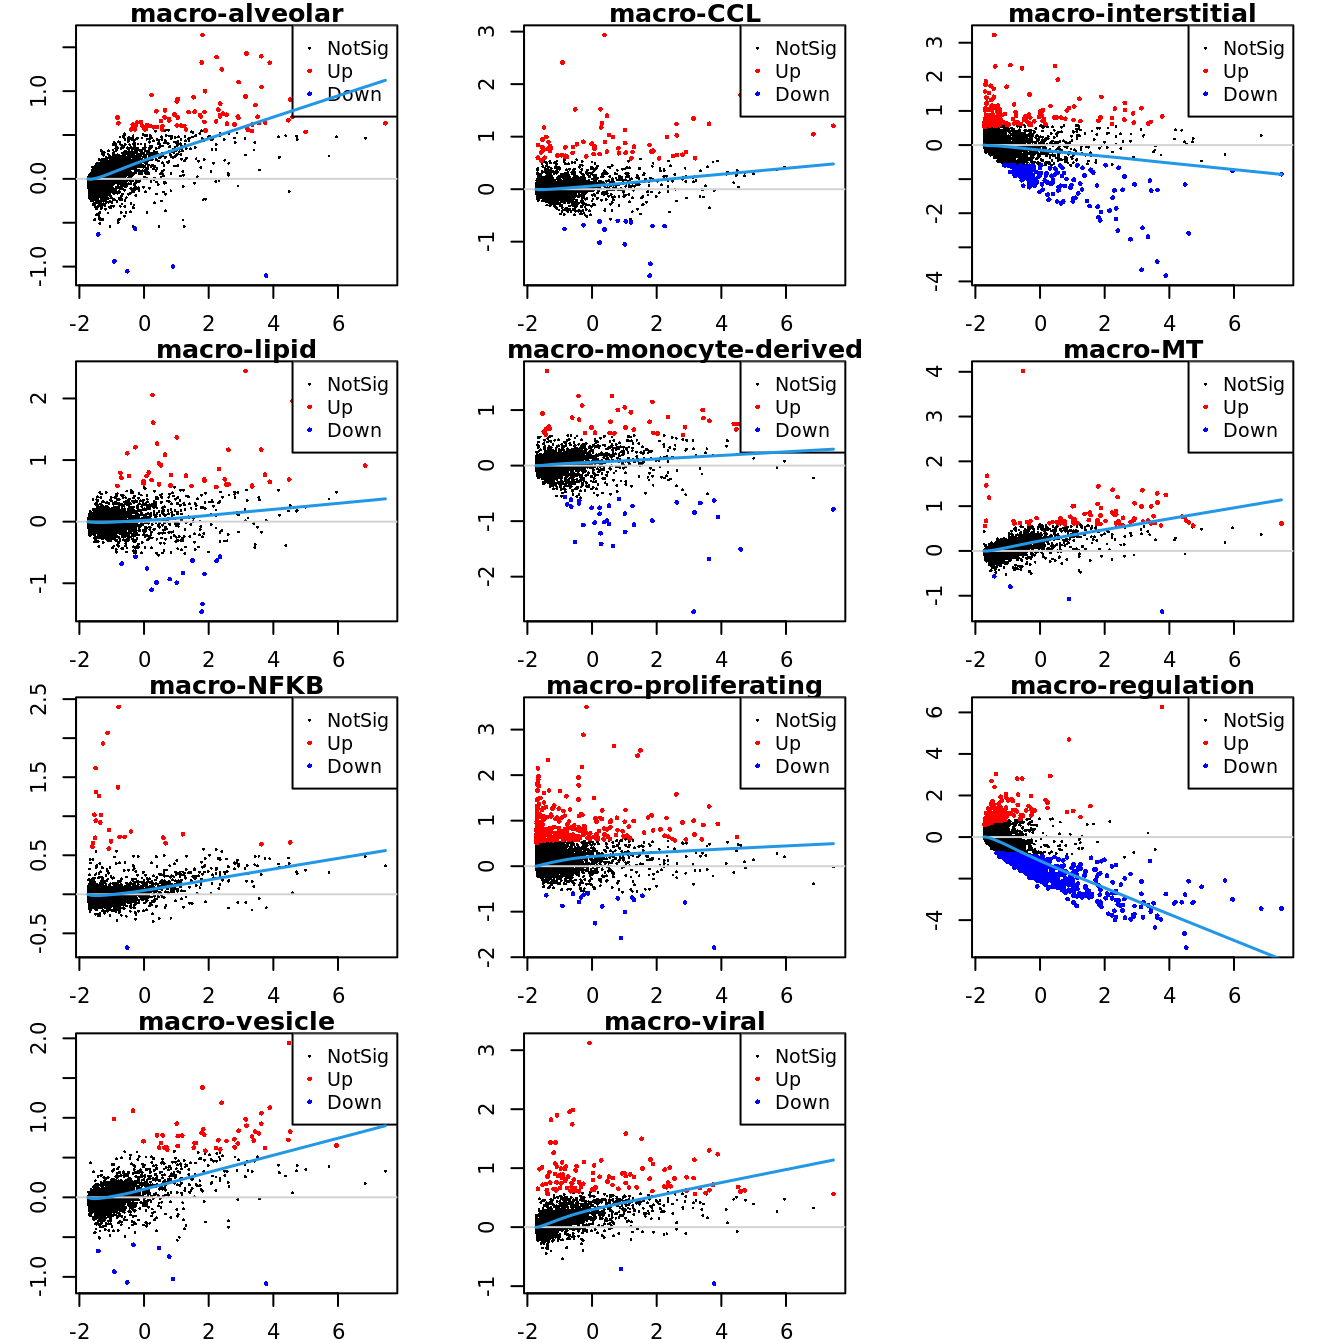
Up 3315 1571 3873Test relative to a threshold (TREAT).
tr <- treat(fit.cont, lfc = 0.5)
dt <- decideTests(tr)
summary(dt)
macro-alveolar macro-CCL macro-interstitial macro-lipid
Down 6 13 167 14
NotSig 15539 15540 15301 15567
Up 77 69 154 41
macro-monocyte-derived macro-MT macro-NFKB macro-proliferating
Down 34 4 1 17
NotSig 15551 15539 15596 15307
Up 37 79 25 298
macro-regulation macro-vesicle macro-viral
Down 732 8 2
NotSig 14694 15569 15508
Up 196 45 112Mean-difference (MD) plots per cluster.
par(mfrow=c(4,3))
par(mar=c(2,3,1,2))

for(i in 1:ncol(mycont)){
  plotMD(tr, coef = i, status = dt[,i], hl.cex = 0.5)
  abline(h = 0, col = "lightgrey")
  lines(lowess(tr$Amean, tr$coefficients[,i]), lwd = 1.5, col = 4)
}
limma marker gene dotplot
DefaultAssay(seuInt) <- "RNA"
contnames <- colnames(mycont)
top_markers <- NULL
n_markers <- 5

for(i in 1:ncol(mycont)){
  top <- topTreat(tr, coef = i, n = Inf)
  top <- top[top$logFC > 0, ]
  top_markers <- c(top_markers,
                   setNames(rownames(top)[1:n_markers],
                            rep(contnames[i], n_markers)))
}

top_markers <- top_markers[!is.na(top_markers)]
top_markers <- top_markers[!duplicated(top_markers)]
cols <- paletteer_d("miscpalettes::pastel")[factor(names(top_markers))]

DotPlot(seuInt,
        features = unname(top_markers),
        group.by = "Annotation",
        cols = c("azure1", "blueviolet"),
        dot.scale = 2.5,
        assay = "SCT") +
    RotatedAxis() +
    FontSize(x.text = 8, y.text = 8) +
    labs(y = element_blank(), x = element_blank()) +
    theme(axis.text.x = element_text(color = cols,
                                   angle = 90,
                                   hjust = 1,
                                   vjust = 0.5,
                                   face = "bold"),
        legend.text = element_text(size = 8),
        legend.title = element_text(size = 10))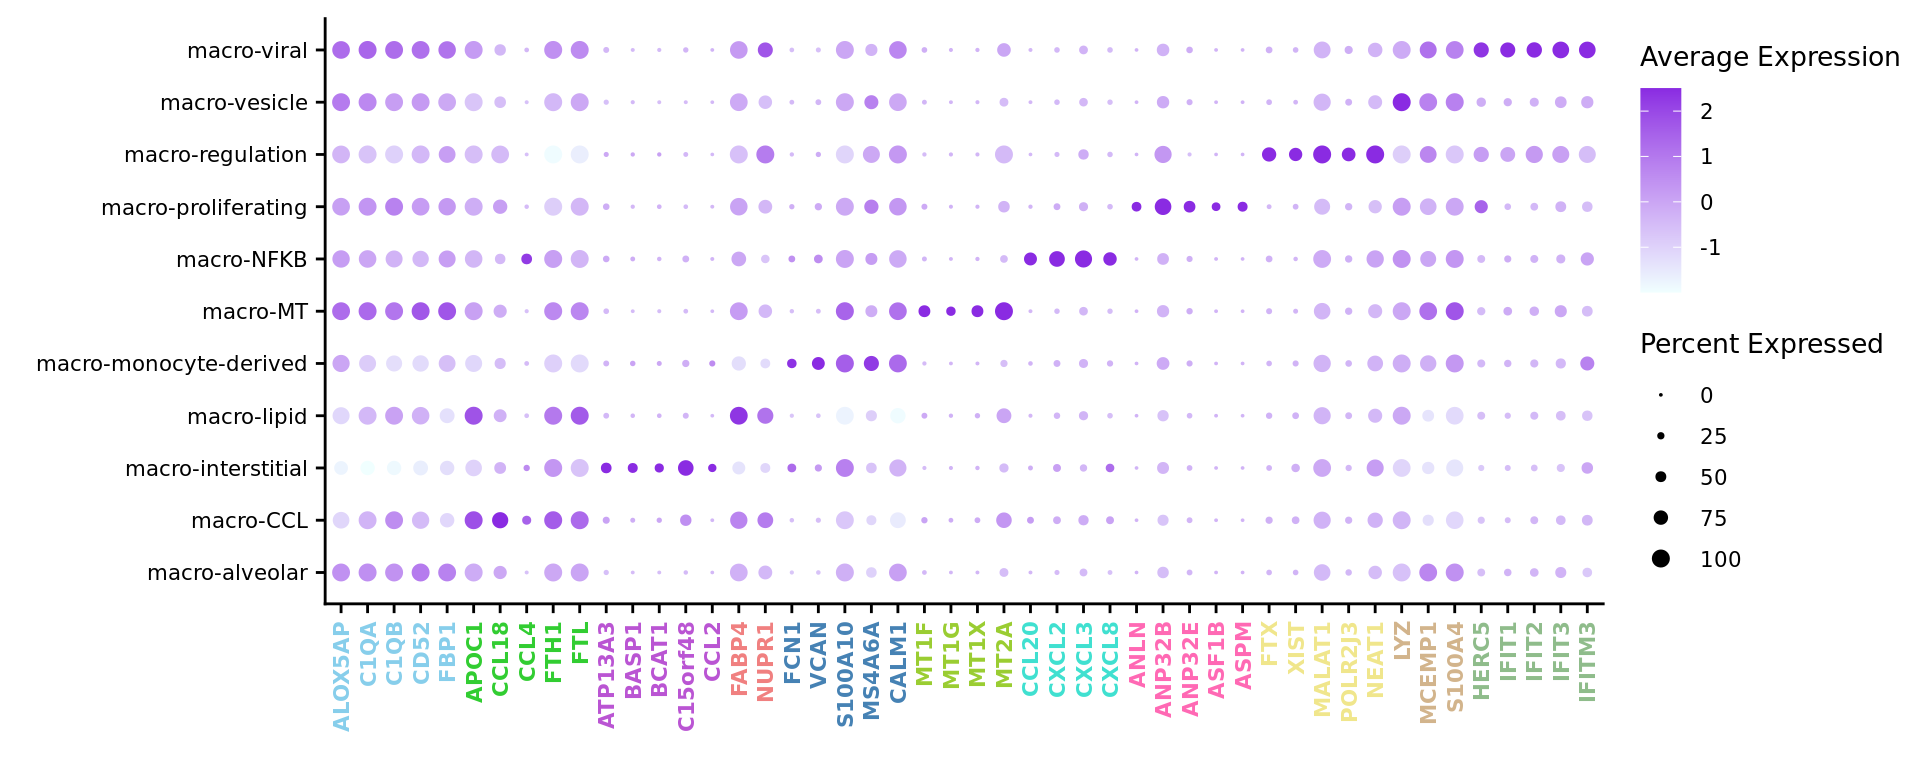
Test for marker genes using Seurat
DefaultAssay(seuInt) <- "RNA"
Idents(seuInt) <- "Annotation"

out <- here("data/cluster_annotations/seurat_markers_macrophages.rds")

if(!file.exists(out)){
  # restrict genes to same set as for limma analysis
  markers <- FindAllMarkers(seuInt, only.pos = TRUE,
                            features = rownames(logcounts))
  saveRDS(markers, file = out)

} else {
  markers <- readRDS(out)

}

head(markers) %>% knitr::kable()| p_val | avg_log2FC | pct.1 | pct.2 | p_val_adj | cluster | gene | |
|---|---|---|---|---|---|---|---|
| MCEMP1 | 0 | 0.7374759 | 0.975 | 0.668 | 0 | macro-alveolar | MCEMP1 |
| FBP1 | 0 | 0.6248554 | 0.977 | 0.814 | 0 | macro-alveolar | FBP1 |
| MRC1 | 0 | 0.5883707 | 0.962 | 0.716 | 0 | macro-alveolar | MRC1 |
| CD52 | 0 | 0.5708416 | 0.992 | 0.863 | 0 | macro-alveolar | CD52 |
| CRIP1 | 0 | 0.5541694 | 0.985 | 0.958 | 0 | macro-alveolar | CRIP1 |
| IGF1 | 0 | 0.5127465 | 0.201 | 0.075 | 0 | macro-alveolar | IGF1 |
Seurat marker gene dotplot
DefaultAssay(seuInt) <- "RNA"

maxGenes <- 5
markers %>%
    group_by(cluster) %>%
    top_n(n = maxGenes, wt = avg_log2FC) -> top5

sig <- top5$gene
geneCols <- paletteer_d("miscpalettes::pastel")[top5$cluster][!duplicated(sig)]

pal <- paletteer::paletteer_d("vapoRwave::cool")
DotPlot(seuInt,
        features = sig[!duplicated(sig)],
        group.by = "Annotation",
        cols = c("azure1", "blueviolet"),
        dot.scale = 2.5,
        assay = "SCT") +
    FontSize(x.text = 8, y.text = 8) +
    labs(y = element_blank(), x = element_blank()) +
    theme(axis.text.x = element_text(color = cols,
                                   angle = 90,
                                   hjust = 1,
                                   vjust = 0.5,
                                   face = "bold"),
        legend.text = element_text(size = 8),
        legend.title = element_text(size = 10))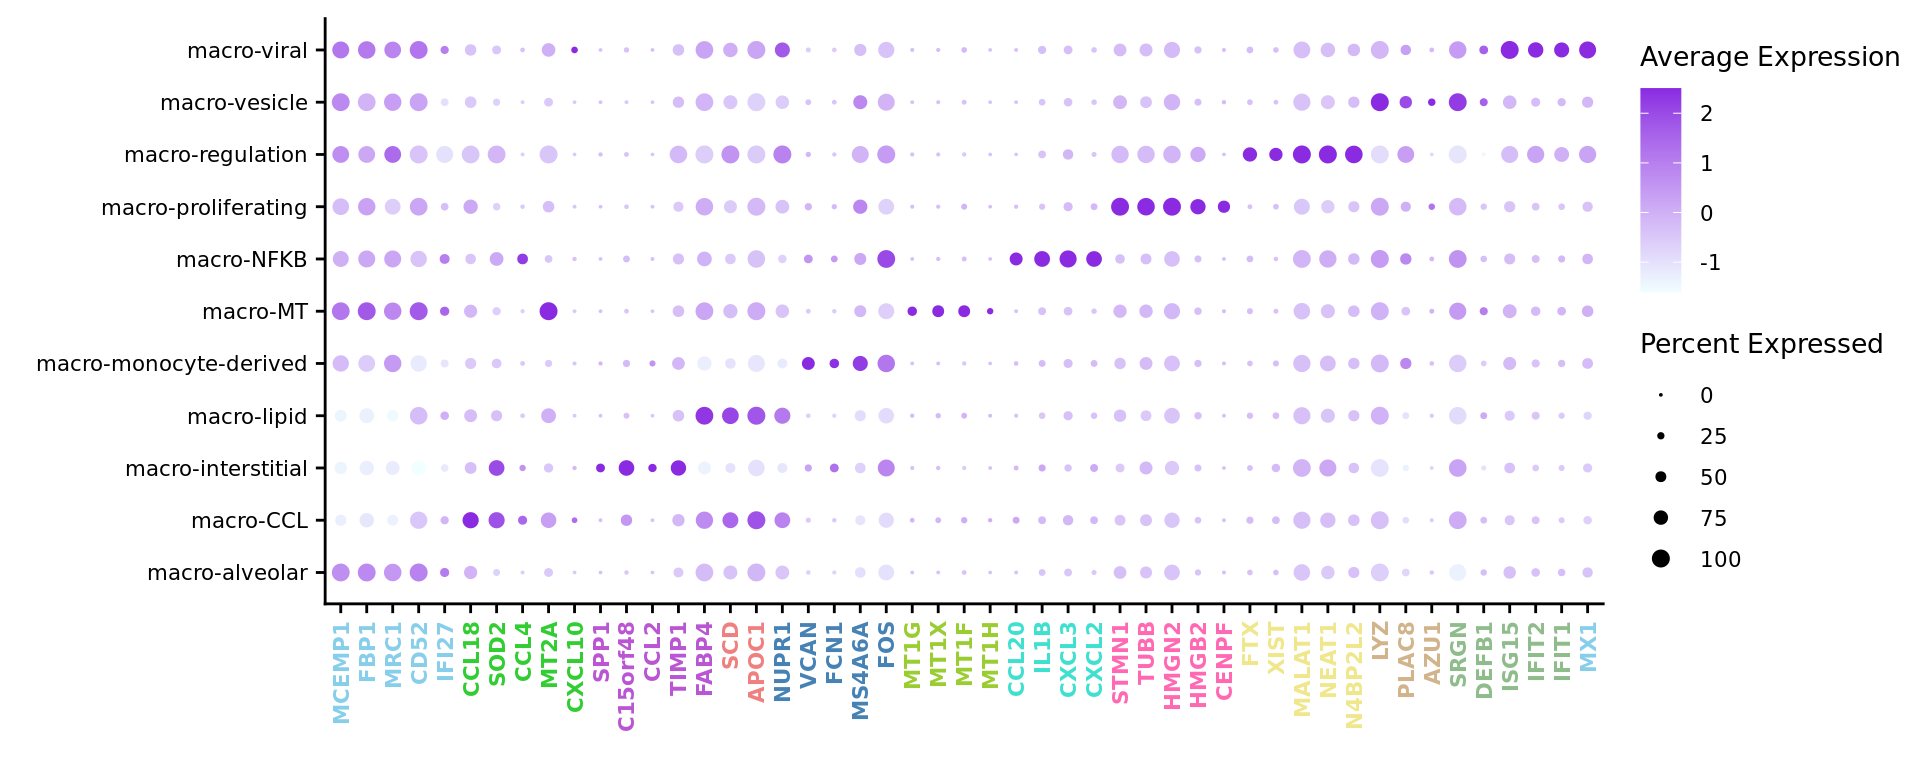
–> –>
Save data
out <- here("data",
            "C133_Neeland_merged",
            glue("C133_Neeland_full_clean{ambient}_macrophages_annotated_diet.SEU.rds"))
if(!file.exists(out)){
  DefaultAssay(seuInt) <- "RNA"
  saveRDS(DietSeurat(seuInt, assays = "RNA"), out)
}

out <- here("data",
            "C133_Neeland_merged",
            glue("C133_Neeland_full_clean{ambient}_macrophages_annotated_full.SEU.rds"))
if(!file.exists(out)){
  DefaultAssay(seuInt) <- "RNA"
  saveRDS(seuInt, out)
}
Session info
sessionInfo()R version 4.3.3 (2024-02-29)
Platform: x86_64-pc-linux-gnu (64-bit)
Running under: Ubuntu 22.04.1 LTS
Matrix products: default
BLAS: /usr/lib/x86_64-linux-gnu/openblas-pthread/libblas.so.3
LAPACK: /usr/lib/x86_64-linux-gnu/openblas-pthread/libopenblasp-r0.3.20.so; LAPACK version 3.10.0
locale:
[1] LC_CTYPE=en_AU.UTF-8 LC_NUMERIC=C
[3] LC_TIME=en_AU.UTF-8 LC_COLLATE=en_AU.UTF-8
[5] LC_MONETARY=en_AU.UTF-8 LC_MESSAGES=en_AU.UTF-8
[7] LC_PAPER=en_AU.UTF-8 LC_NAME=C
[9] LC_ADDRESS=C LC_TELEPHONE=C
[11] LC_MEASUREMENT=en_AU.UTF-8 LC_IDENTIFICATION=C
time zone: Etc/UTC
tzcode source: system (glibc)
attached base packages:
[1] stats4 stats graphics grDevices datasets utils methods
[8] base
other attached packages:
[1] speckle_1.2.0 org.Hs.eg.db_3.18.0
[3] AnnotationDbi_1.64.1 readxl_1.4.3
[5] tidyHeatmap_1.8.1 paletteer_1.6.0
[7] patchwork_1.2.0 glue_1.7.0
[9] here_1.0.1 dittoSeq_1.14.2
[11] SeuratObject_4.1.4 Seurat_4.4.0
[13] lubridate_1.9.3 forcats_1.0.0
[15] stringr_1.5.1 dplyr_1.1.4
[17] purrr_1.0.2 readr_2.1.5
[19] tidyr_1.3.1 tibble_3.2.1
[21] ggplot2_3.5.0 tidyverse_2.0.0
[23] edgeR_4.0.15 limma_3.58.1
[25] SingleCellExperiment_1.24.0 SummarizedExperiment_1.32.0
[27] Biobase_2.62.0 GenomicRanges_1.54.1
[29] GenomeInfoDb_1.38.6 IRanges_2.36.0
[31] S4Vectors_0.40.2 BiocGenerics_0.48.1
[33] MatrixGenerics_1.14.0 matrixStats_1.2.0
[35] workflowr_1.7.1
loaded via a namespace (and not attached):
[1] RcppAnnoy_0.0.22 splines_4.3.3 later_1.3.2
[4] prismatic_1.1.1 bitops_1.0-7 cellranger_1.1.0
[7] polyclip_1.10-6 lifecycle_1.0.4 doParallel_1.0.17
[10] rprojroot_2.0.4 globals_0.16.2 processx_3.8.3
[13] lattice_0.22-5 MASS_7.3-60.0.1 dendextend_1.17.1
[16] magrittr_2.0.3 plotly_4.10.4 sass_0.4.8
[19] rmarkdown_2.25 jquerylib_0.1.4 yaml_2.3.8
[22] httpuv_1.6.14 sctransform_0.4.1 sp_2.1-3
[25] spatstat.sparse_3.0-3 reticulate_1.35.0 DBI_1.2.1
[28] cowplot_1.1.3 pbapply_1.7-2 RColorBrewer_1.1-3
[31] abind_1.4-5 zlibbioc_1.48.0 Rtsne_0.17
[34] RCurl_1.98-1.14 git2r_0.33.0 circlize_0.4.15
[37] GenomeInfoDbData_1.2.11 ggrepel_0.9.5 irlba_2.3.5.1
[40] listenv_0.9.1 spatstat.utils_3.0-4 pheatmap_1.0.12
[43] goftest_1.2-3 spatstat.random_3.2-2 fitdistrplus_1.1-11
[46] parallelly_1.37.0 leiden_0.4.3.1 codetools_0.2-19
[49] DelayedArray_0.28.0 shape_1.4.6 tidyselect_1.2.0
[52] farver_2.1.1 viridis_0.6.5 spatstat.explore_3.2-6
[55] jsonlite_1.8.8 GetoptLong_1.0.5 ellipsis_0.3.2
[58] progressr_0.14.0 iterators_1.0.14 ggridges_0.5.6
[61] survival_3.5-8 foreach_1.5.2 tools_4.3.3
[64] ica_1.0-3 Rcpp_1.0.12 gridExtra_2.3
[67] SparseArray_1.2.4 xfun_0.42 withr_3.0.0
[70] BiocManager_1.30.22 fastmap_1.1.1 fansi_1.0.6
[73] callr_3.7.3 digest_0.6.34 timechange_0.3.0
[76] R6_2.5.1 mime_0.12 colorspace_2.1-0
[79] scattermore_1.2 tensor_1.5 RSQLite_2.3.5
[82] spatstat.data_3.0-4 utf8_1.2.4 generics_0.1.3
[85] renv_1.0.3 data.table_1.15.0 httr_1.4.7
[88] htmlwidgets_1.6.4 S4Arrays_1.2.0 whisker_0.4.1
[91] uwot_0.1.16 pkgconfig_2.0.3 gtable_0.3.4
[94] blob_1.2.4 ComplexHeatmap_2.18.0 lmtest_0.9-40
[97] XVector_0.42.0 htmltools_0.5.7 clue_0.3-65
[100] scales_1.3.0 png_0.1-8 knitr_1.45
[103] rstudioapi_0.15.0 rjson_0.2.21 tzdb_0.4.0
[106] reshape2_1.4.4 nlme_3.1-164 GlobalOptions_0.1.2
[109] cachem_1.0.8 zoo_1.8-12 KernSmooth_2.23-22
[112] parallel_4.3.3 miniUI_0.1.1.1 pillar_1.9.0
[115] grid_4.3.3 vctrs_0.6.5 RANN_2.6.1
[118] promises_1.2.1 xtable_1.8-4 cluster_2.1.6
[121] evaluate_0.23 cli_3.6.2 locfit_1.5-9.8
[124] compiler_4.3.3 rlang_1.1.3 crayon_1.5.2
[127] future.apply_1.11.1 labeling_0.4.3 rematch2_2.1.2
[130] ps_1.7.6 getPass_0.2-4 plyr_1.8.9
[133] fs_1.6.3 stringi_1.8.3 viridisLite_0.4.2
[136] deldir_2.0-2 Biostrings_2.70.2 munsell_0.5.0
[139] lazyeval_0.2.2 spatstat.geom_3.2-8 Matrix_1.6-5
[142] hms_1.1.3 bit64_4.0.5 future_1.33.1
[145] KEGGREST_1.42.0 statmod_1.5.0 shiny_1.8.0
[148] highr_0.10 ROCR_1.0-11 memoise_2.0.1
[151] igraph_2.0.1.1 bslib_0.6.1 bit_4.0.5