Random plots
Last updated: 2022-11-01
Checks: 6 1
Knit directory: ChromatinSplicingQTLs/analysis/
This reproducible R Markdown analysis was created with workflowr (version 1.6.2). The Checks tab describes the reproducibility checks that were applied when the results were created. The Past versions tab lists the development history.
The R Markdown file has unstaged changes. To know which version of the R Markdown file created these results, you’ll want to first commit it to the Git repo. If you’re still working on the analysis, you can ignore this warning. When you’re finished, you can run wflow_publish to commit the R Markdown file and build the HTML.
Great job! The global environment was empty. Objects defined in the global environment can affect the analysis in your R Markdown file in unknown ways. For reproduciblity it’s best to always run the code in an empty environment.
The command set.seed(20191126) was run prior to running the code in the R Markdown file. Setting a seed ensures that any results that rely on randomness, e.g. subsampling or permutations, are reproducible.
Great job! Recording the operating system, R version, and package versions is critical for reproducibility.
Nice! There were no cached chunks for this analysis, so you can be confident that you successfully produced the results during this run.
Great job! Using relative paths to the files within your workflowr project makes it easier to run your code on other machines.
Great! You are using Git for version control. Tracking code development and connecting the code version to the results is critical for reproducibility.
The results in this page were generated with repository version 277dfd1. See the Past versions tab to see a history of the changes made to the R Markdown and HTML files.
Note that you need to be careful to ensure that all relevant files for the analysis have been committed to Git prior to generating the results (you can use wflow_publish or wflow_git_commit). workflowr only checks the R Markdown file, but you know if there are other scripts or data files that it depends on. Below is the status of the Git repository when the results were generated:
Ignored files:
    Ignored:    .DS_Store
    Ignored:    .Rhistory
    Ignored:    .Rproj.user/
    Ignored:    analysis/.Rhistory
    Ignored:    analysis/figure/
    Ignored:    code/.DS_Store
    Ignored:    code/.RData
    Ignored:    code/._.DS_Store
    Ignored:    code/._README.md
    Ignored:    code/._report.html
    Ignored:    code/.ipynb_checkpoints/
    Ignored:    code/.snakemake/
    Ignored:    code/APA_Processing/
    Ignored:    code/Alignments/
    Ignored:    code/ChromHMM/
    Ignored:    code/ENCODE/
    Ignored:    code/ExpressionAnalysis/
    Ignored:    code/FastqFastp/
    Ignored:    code/FastqFastpSE/
    Ignored:    code/Genotypes/
    Ignored:    code/H3K36me3_CutAndTag.pdf
    Ignored:    code/IntronSlopes/
    Ignored:    code/Metaplots/
    Ignored:    code/Misc/
    Ignored:    code/MiscCountTables/
    Ignored:    code/Multiqc/
    Ignored:    code/Multiqc_chRNA/
    Ignored:    code/NonCodingRNA/
    Ignored:    code/NonCodingRNA_annotation/
    Ignored:    code/PeakCalling/
    Ignored:    code/Phenotypes/
    Ignored:    code/PlotGruberQTLs/
    Ignored:    code/PlotQTLs/
    Ignored:    code/ProCapAnalysis/
    Ignored:    code/QC/
    Ignored:    code/QTL_SNP_Enrichment/
    Ignored:    code/QTLs/
    Ignored:    code/RPKM_tables/
    Ignored:    code/ReferenceGenome/
    Ignored:    code/Rplots.pdf
    Ignored:    code/Session.vim
    Ignored:    code/SplicingAnalysis/
    Ignored:    code/TODO
    Ignored:    code/Tehranchi/
    Ignored:    code/bigwigs/
    Ignored:    code/bigwigs_FromNonWASPFilteredReads/
    Ignored:    code/config/.DS_Store
    Ignored:    code/config/._.DS_Store
    Ignored:    code/config/.ipynb_checkpoints/
    Ignored:    code/dag.pdf
    Ignored:    code/dag.png
    Ignored:    code/dag.svg
    Ignored:    code/debug.ipynb
    Ignored:    code/debug_python.ipynb
    Ignored:    code/deepTools/
    Ignored:    code/featureCounts/
    Ignored:    code/gwas_summary_stats/
    Ignored:    code/hyprcoloc/
    Ignored:    code/igv_session.xml
    Ignored:    code/log
    Ignored:    code/logs/
    Ignored:    code/notebooks/.ipynb_checkpoints/
    Ignored:    code/pi1/
    Ignored:    code/rules/.QTLTools.smk.swp
    Ignored:    code/rules/.ipynb_checkpoints/
    Ignored:    code/rules/OldRules/
    Ignored:    code/rules/notebooks/
    Ignored:    code/scratch/
    Ignored:    code/scripts/.ipynb_checkpoints/
    Ignored:    code/scripts/GTFtools_0.8.0/
    Ignored:    code/scripts/__pycache__/
    Ignored:    code/scripts/liftOverBedpe/liftOverBedpe.py
    Ignored:    code/snakemake.dryrun.log
    Ignored:    code/snakemake.log
    Ignored:    code/snakemake.sbatch.log
    Ignored:    code/test.introns.bed
    Ignored:    code/test.introns2.bed
    Ignored:    data/.DS_Store
    Ignored:    data/._.DS_Store
    Ignored:    data/._20220414203249_JASPAR2022_combined_matrices_25818_jaspar.txt
    Ignored:    data/GWAS_catalog_summary_stats_sources/._list_gwas_summary_statistics_6_Apr_2022-10.csv
    Ignored:    data/GWAS_catalog_summary_stats_sources/._list_gwas_summary_statistics_6_Apr_2022-11.csv
    Ignored:    data/GWAS_catalog_summary_stats_sources/._list_gwas_summary_statistics_6_Apr_2022-2.csv
    Ignored:    data/GWAS_catalog_summary_stats_sources/._list_gwas_summary_statistics_6_Apr_2022-3.csv
    Ignored:    data/GWAS_catalog_summary_stats_sources/._list_gwas_summary_statistics_6_Apr_2022-4.csv
    Ignored:    data/GWAS_catalog_summary_stats_sources/._list_gwas_summary_statistics_6_Apr_2022-5.csv
    Ignored:    data/GWAS_catalog_summary_stats_sources/._list_gwas_summary_statistics_6_Apr_2022-6.csv
    Ignored:    data/GWAS_catalog_summary_stats_sources/._list_gwas_summary_statistics_6_Apr_2022-7.csv
    Ignored:    data/GWAS_catalog_summary_stats_sources/._list_gwas_summary_statistics_6_Apr_2022-8.csv
    Ignored:    data/GWAS_catalog_summary_stats_sources/._list_gwas_summary_statistics_6_Apr_2022.csv

Untracked files:
    Untracked:  code/snakemake_profiles/slurm/__pycache__/

Unstaged changes:
    Modified:   analysis/20221030_PlotsForLabMeeting.Rmd
    Modified:   code/scripts/GenometracksByGenotype
Note that any generated files, e.g. HTML, png, CSS, etc., are not included in this status report because it is ok for generated content to have uncommitted changes.
These are the previous versions of the repository in which changes were made to the R Markdown (analysis/20221030_PlotsForLabMeeting.Rmd) and HTML (docs/20221030_PlotsForLabMeeting.html) files. If you’ve configured a remote Git repository (see ?wflow_git_remote), click on the hyperlinks in the table below to view the files as they were in that past version.
| File | Version | Author | Date | Message |
|---|---|---|---|---|
| Rmd | 277dfd1 | Benjmain Fair | 2022-11-01 | update makebigwigs |
Intro
Here I will plot a bunch of somewhat unrelated stuff that for lab meeting or that might just generally be interesting…
Repreoduce Carlos’ “poly-A-specific eQTLs more likely to be sQTLs”
library(tidyverse)
library(data.table)
library(RColorBrewer)


GenewiseTests <- fread("../code/pi1/PairwisePi1Traits.P.all.txt.gz")

PeaksToTSS <- Sys.glob("../code/Misc/PeaksClosestToTSS/*_assigned.tsv.gz") %>%
  setNames(str_replace(., "../code/Misc/PeaksClosestToTSS/(.+?)_assigned.tsv.gz", "\\1")) %>%
  lapply(read_tsv) %>%
  bind_rows(.id="ChromatinMark") %>%
  mutate(GenePeakPair = paste(gene, peak, sep = ";")) %>%
  distinct(ChromatinMark, peak, gene, .keep_all=T)
Get eGenes that are not H3K27AC promoter QTLs, or chRNA eQTLs
display.brewer.pal(n=6, name="Paired")
brewer.pal(n=6, name="Paired")[1] "#A6CEE3" "#1F78B4" "#B2DF8A" "#33A02C" "#FB9A99" "#E31A1C"ColorKey <- c("chRNA.Expression.Splicing TRUE"="#1F78B4",
"chRNA.Expression.Splicing FALSE"="#A6CEE3",
"H3K36ME3 TRUE"="#33A02C",
"H3K36ME3 FALSE"="#B2DF8A",
"H3K27AC TRUE"="#E31A1C",
"H3K27AC FALSE"="#FB9A99")
LabelKey <- c("chRNA.Expression.Splicing"="chRNA",
"H3K36ME3"="H3K36ME3",
"H3K27AC"="H3K27AC@TSS")
Dat.to.plot <- GenewiseTests %>%
filter(
PC1 == "Expression.Splicing.Subset_YRI" &
PC2 %in% c("H3K27AC", "chRNA.Expression.Splicing", "H3K36ME3")
) %>%
filter(
PC2 %in% c("chRNA.Expression.Splicing", "H3K36ME3") |
paste(P1, P2, sep=";") %in% PeaksToTSS$GenePeakPair
) %>%
group_by(GeneLocus, PC2) %>%
arrange(FDR.y) %>%
distinct(PC2, .keep_all=T) %>%
ungroup() %>%
# mutate(Is_xQTL = FDR.y<0.05) %>%
mutate(Is_xQTL = p_permutation.y<0.05) %>%
mutate(FacetLabel = recode(PC2, !!!LabelKey)) %>%
mutate(Group = paste(PC2, Is_xQTL)) %>%
add_count(Group, FacetLabel)
Dat.to.plot %>%
ggplot(aes(x=-log10(p_permutation.x), y=-log10(p_permutation.y), color=Group)) +
geom_label(
data = . %>%
distinct(Group, FacetLabel, n) %>%
group_by(FacetLabel) %>%
mutate(rn = row_number()),
aes(label=paste0("n=", n), vjust=rn+1, color=Group),
x=-Inf, y=Inf, hjust=-0.5) +
geom_point(alpha=0.1) +
scale_color_manual(values=ColorKey) +
facet_wrap(~FacetLabel) +
theme_bw() +
theme(legend.position = "none") +
labs(caption="Number of eGenes that are xQTLs, 10% FDR", x="-log10(q) (eQTL)", y="-log10(q) (xQTL)")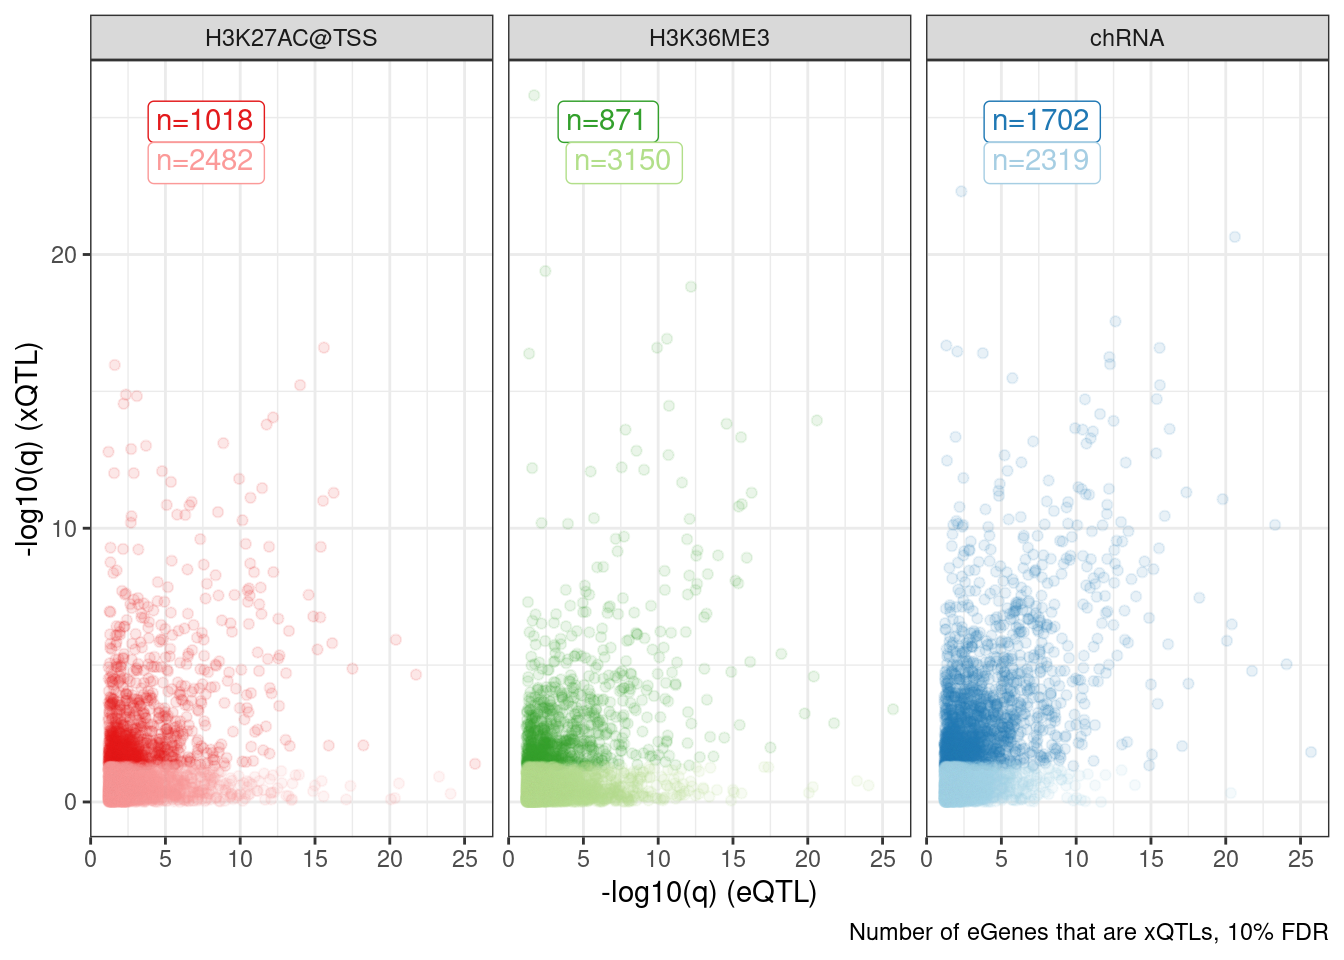
test.SNPs <- paste0("../code/QTLs/QTLTools/", c("polyA.Splicing.Subset_YRI", "chRNA.Splicing"), "/NominalPassForColoc.RandomSamplePvals.txt.gz") %>%
  setNames(str_replace(., "../code/QTLs/QTLTools/(.+?)/NominalPassForColoc.RandomSamplePvals.txt.gz", "\\1")) %>%
  lapply(read_tsv, col_names=c("trait.x.p.in.y")) %>%
  bind_rows(.id="PC2") %>%
  mutate(Group = "TestSNPs") %>%
  group_by(PC2) %>%
  sample_n(5000) %>%
  ungroup()

test.SNPs %>%
  ggplot(aes(x=trait.x.p.in.y)) +
  geom_histogram() +
  facet_wrap(~PC2)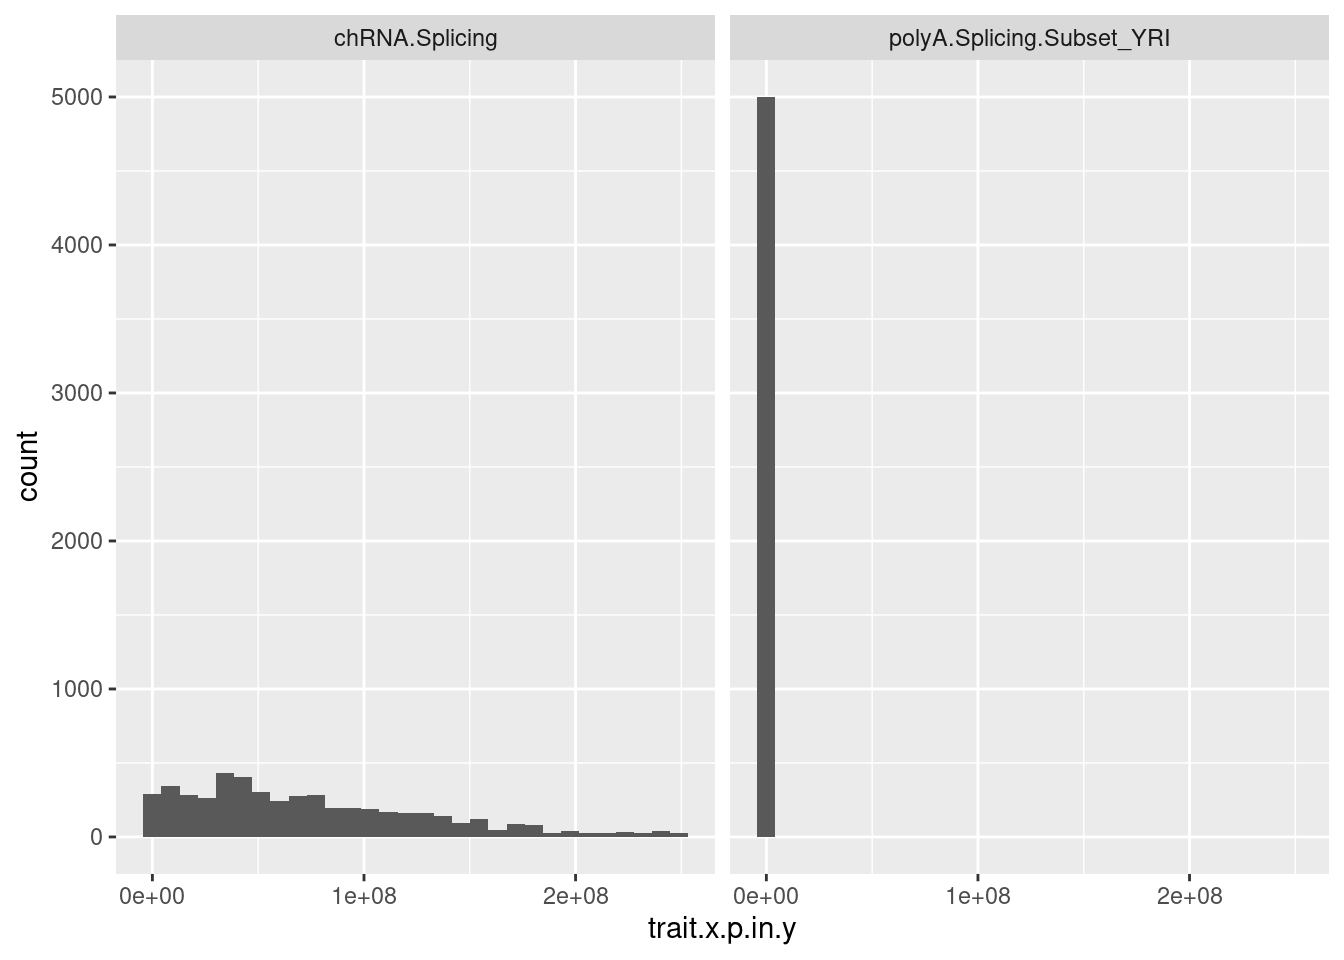
GenewiseTests %>%
filter(
PC1 == "Expression.Splicing.Subset_YRI" &
PC2 %in% c("polyA.Splicing.Subset_YRI", "chRNA.Splicing")
) %>%
inner_join(
Dat.to.plot %>%
dplyr::select(Group,Is_xQTL,GeneLocus, FacetLabel)
) %>%
bind_rows(
bind_rows(list("H3K27AC@TSS"=test.SNPs, "H3K36ME3"=test.SNPs, "chRNA"=test.SNPs), .id="FacetLabel")
) %>%
#Becayse of a known bug for now don't even include test SNPs for chRNA
filter(!(PC2 == "chRNA.Splicing" & str_detect(Group, "TestSNPs"))) %>%
# group_by(PC2, Group, GeneLocus, FacetLabel) %>%
# arrange(trait.x.p.in.y) %>%
# distinct(Group, GeneLocus, trait.x.p.in.y, FacetLabel ) %>%
# ungroup() %>%
group_by(PC2, Group, FacetLabel) %>%
mutate(ExpectedP = percent_rank(trait.x.p.in.y)) %>%
ungroup() %>%
ggplot(aes(x=-log10(ExpectedP), y=-log10(trait.x.p.in.y), color=Group)) +
geom_abline() +
geom_point() +
scale_color_manual(values=c(ColorKey, "TestSNPs"="gray")) +
facet_grid(PC2 ~ FacetLabel) +
theme_bw() +
theme(legend.position = "none") +
labs(title="QQ plot of sQTL P-values", color="xQTL SNP", y="Observed -log10(P)", x="Theoretical -log10(P)", caption=str_wrap("", 30))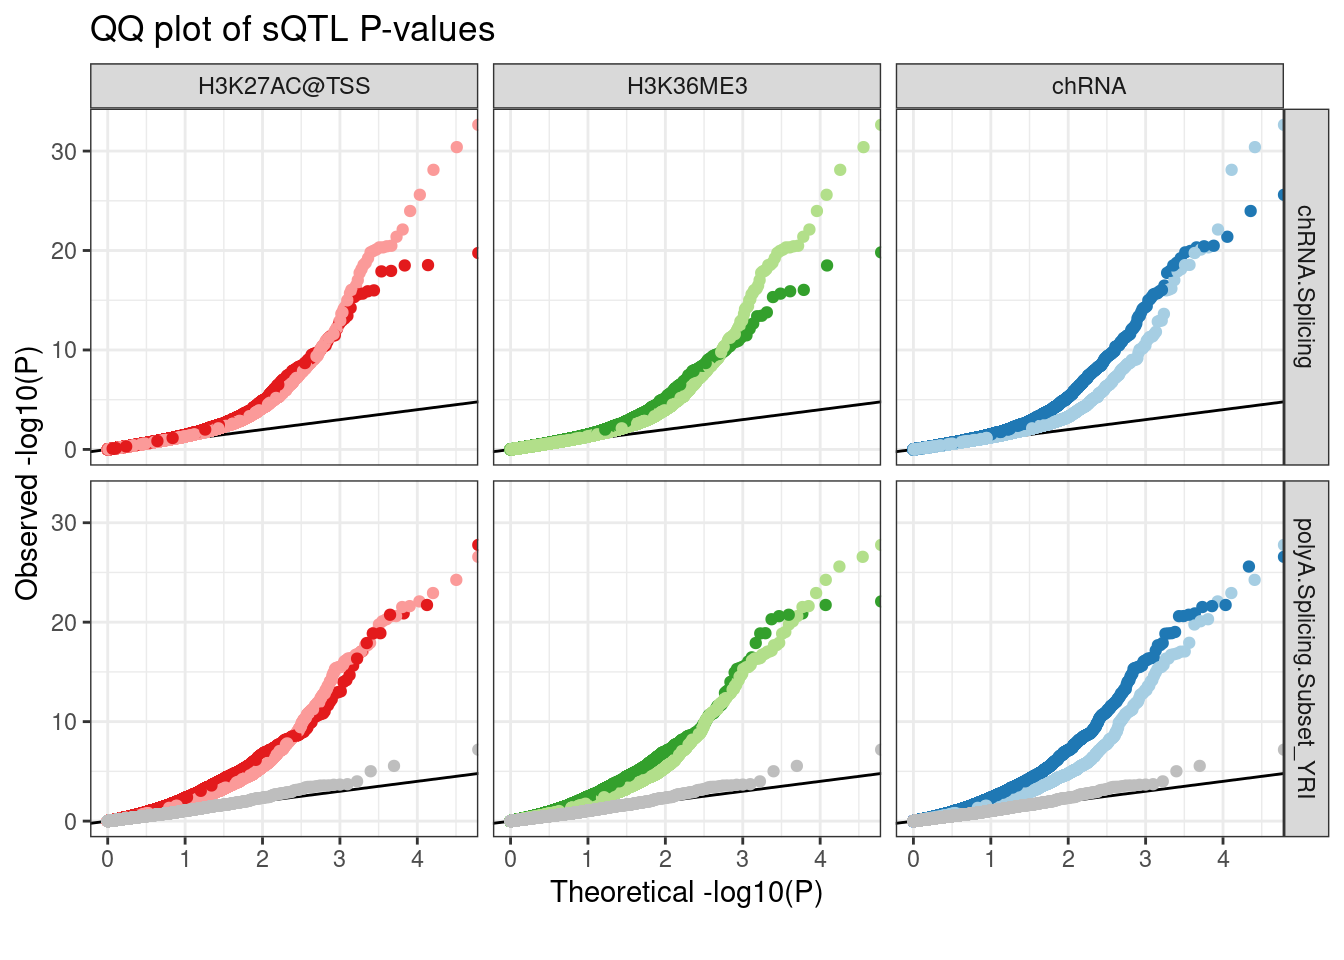 The test SNPs are messed up for chRNA for reasons I understand… It’s a bug in my code I will fix later. In any case, i still can’t reproduce Carlos’ observation that the polyA eQTLs that aren’t chRNA eQTLs or chromatin QTLs are more likely to be sQTLs.
Also, to verify there isn’t some other bug, let’s plot something similar…
Dat.to.plot <- GenewiseTests %>%
  filter(
    PC1 == "Expression.Splicing.Subset_YRI" &
      PC2 %in% c("chRNA.Expression.Splicing", "H3K36ME3")
    ) %>%
  group_by(GeneLocus, PC2) %>%
  arrange(FDR.y) %>%
  distinct(PC2, .keep_all=T) %>%
  ungroup() %>%
  # mutate(Is_xQTL = FDR.y<0.05) %>%
  mutate(Is_xQTL = p_permutation.y<0.05) %>%
  mutate(FacetLabel = recode(PC2, !!!LabelKey)) %>%
  mutate(Group = paste(PC2, Is_xQTL)) %>%
  add_count(Group, FacetLabel)

Dat.to.plot %>%
  ggplot(aes(x=-log10(p_permutation.x), y=-log10(p_permutation.y), color=Group)) +
  geom_label(
    data = . %>%
      distinct(Group, FacetLabel, n) %>%
      group_by(FacetLabel) %>%
      mutate(rn = row_number()),
    aes(label=paste0("n=", n), vjust=rn+1, color=Group),
    x=-Inf, y=Inf, hjust=-0.5) +
  geom_point(alpha=0.1) +
  scale_color_manual(values=ColorKey) +
  facet_wrap(~FacetLabel) +
  theme_bw() +
  theme(legend.position = "none") +
  labs(caption="Number of eGenes that are xQTLs, 10% FDR",  x="-log10(q) (eQTL)", y="-log10(q) (xQTL)")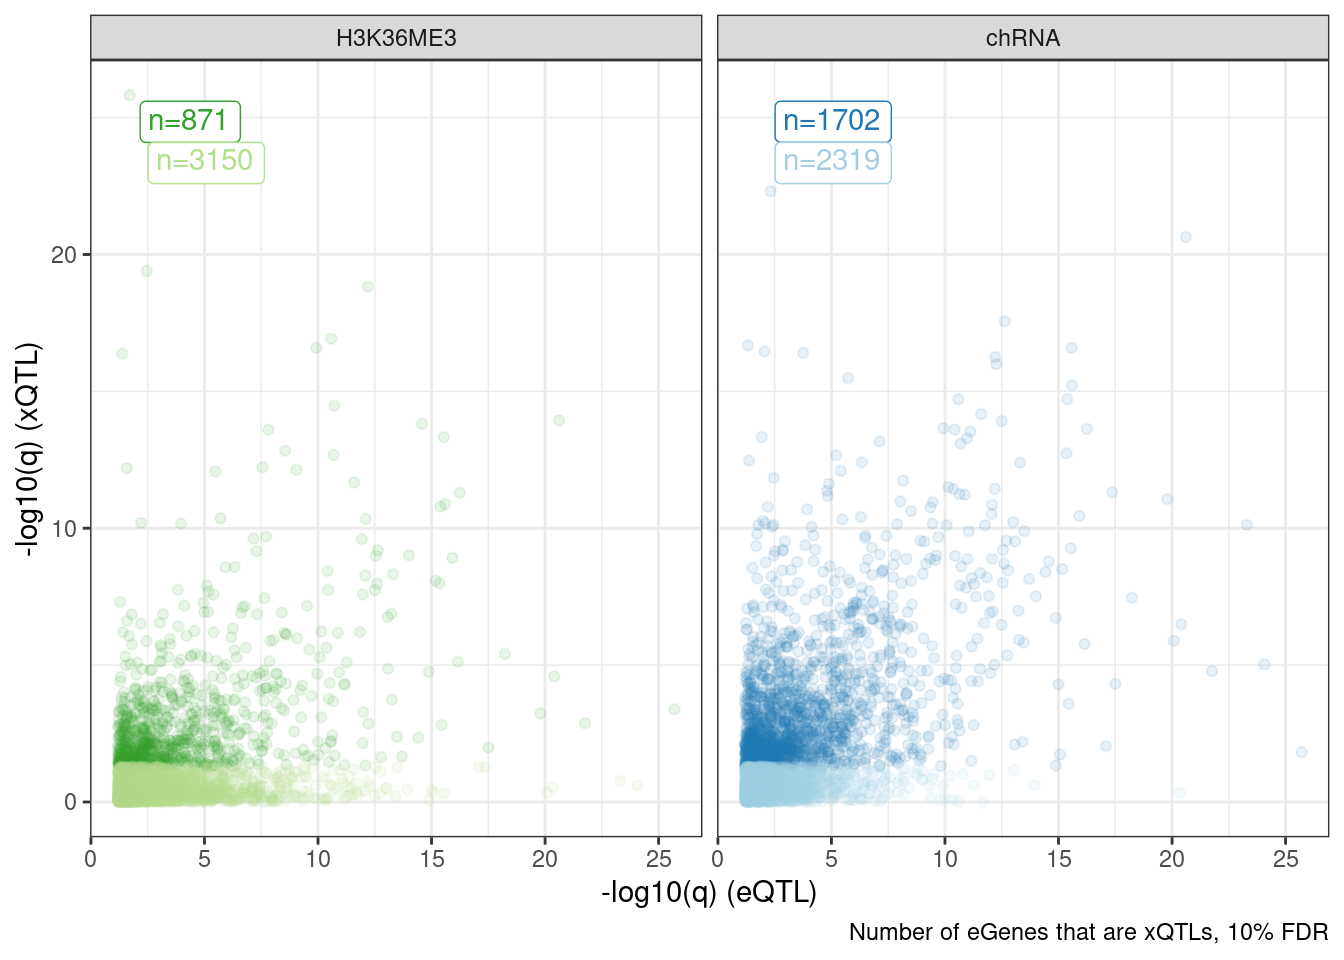
GenewiseTests %>%
  filter(
    PC1 == "Expression.Splicing.Subset_YRI" &
      PC2 %in% c("H3K27AC")
    ) %>%
  filter(
    paste(P1, P2, sep=";") %in% PeaksToTSS$GenePeakPair
  ) %>%
  inner_join(
    Dat.to.plot %>%
      dplyr::select(Group,Is_xQTL,GeneLocus, FacetLabel)
  ) %>%
  # group_by(PC2, Group, GeneLocus, FacetLabel) %>%
  # arrange(trait.x.p.in.y) %>%
  # distinct(Group, GeneLocus, trait.x.p.in.y, FacetLabel ) %>%
  # ungroup() %>%
  group_by(PC2, Group, FacetLabel) %>%
  mutate(ExpectedP = percent_rank(trait.x.p.in.y)) %>%
  ungroup() %>%
  ggplot(aes(x=-log10(ExpectedP), y=-log10(trait.x.p.in.y), color=Group)) +
  geom_abline() +
  geom_point() +
  scale_color_manual(values=c(ColorKey, "TestSNPs"="gray")) +
  facet_grid(PC2 ~ FacetLabel) +
  theme_bw() +
  theme(legend.position = "none") +
  labs(title="QQ plot of H3K27AC promoter P-values", color="xQTL SNP", y="Observed -log10(P)", x="Theoretical -log10(P)", caption=str_wrap("All points are eQTLs SNPs in the YRI subset. Darker points are also a QTL for the facet title, lighter points are not", 60))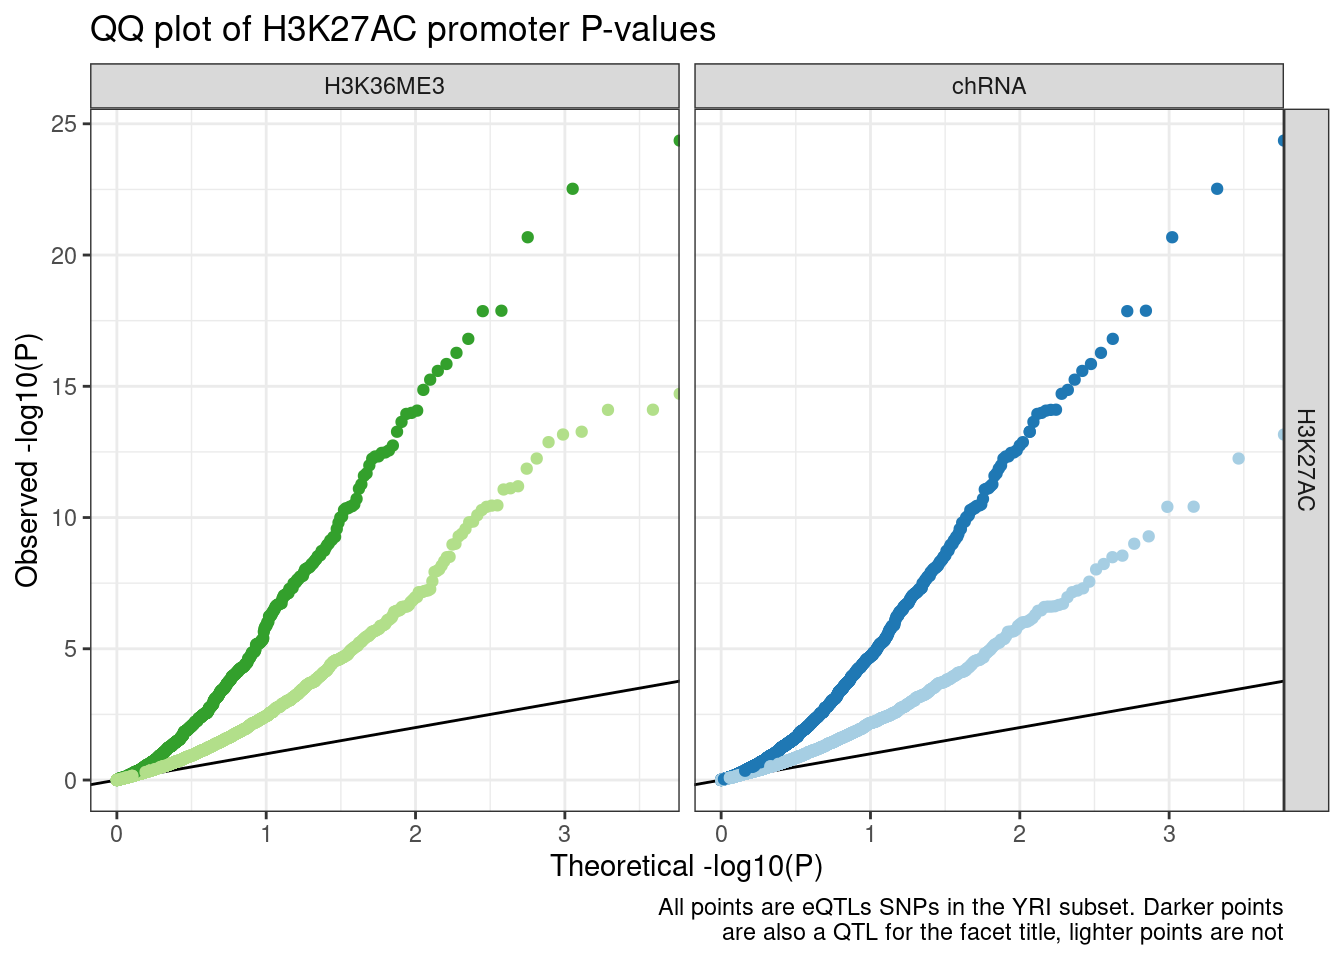
Ok, that makes sense. I now see what the problem was with the sQTL qqplot. I think Carlos might have been using a gene-level test for sQTLs (P value tests the null “Does this intron contain and sQTLs”), whereas I was plotting intron-level tests (“Is this eQTL SNP an sQTL”) Let’s remake the QQ plot with gene-level sQTL tests…
gene.level.sQTL.tests <- fread("../code/QTLs/QTLTools/chRNA.Expression.Splicing/PermutationPassForColoc.txt.gz")Wait, actually ok actually this isn’t using the QTLtools --group flag like i hoped… and i’m generally confused now about what the file Carlos was using is…
Tidy data
In order to ease downstream plotting, I want to merge a few tables: The table with spearman correlation b/n pairwise traits, the table with pairwise P-values, and the table with tidy coloc results…
Note this isn’t ready.. some of the pipeline needs to be rerun
coloc.tidy <- fread("../code/hyprcoloc/Results/ForColoc/MolColocStandard/tidy_results_OnlyColocalized.txt.gz") %>%
  separate(phenotype_full, into=c("PC", "P"), sep=";")

coloc.tidy.pairwise <- left_join(
  coloc.tidy,
  coloc.tidy %>%
    dplyr::select(-iteration, -ColocPr, -RegionalPr, -TopSNPFinemapPr),
  by=c("Locus"),
  suffix=c("1", "2")
) %>%
  filter(!(P1==P2 & PC1 == PC2)) %>%
  filter(snp1 == snp2) %>%
  dplyr::select(ColocalizedTopSNP = snp1, GeneLocus=Locus, everything(), -snp2)

spearman.of.QTL.signals <- fread("../code/hyprcoloc/Results/ForColoc/MolColocStandard/pairwisecor.txt.gz") %>%
  separate(Trait1, into=c("PC1", "P1"), sep=';') %>%
  separate(Trait2, into=c("PC2", "P2"), sep=';') %>%
  dplyr::select(-cor.z.pearson, -cor.logp.pearson, -cor.logp.pearson)

Combined.table <- GenewiseTests %>%
  left_join(spearman.of.QTL.signals) %>%
  left_join(coloc.tidy.pairwise)
Number QTLs
sessionInfo()R version 3.6.1 (2019-07-05)
Platform: x86_64-pc-linux-gnu (64-bit)
Running under: CentOS Linux 7 (Core)
Matrix products: default
BLAS/LAPACK: /software/openblas-0.2.19-el7-x86_64/lib/libopenblas_haswellp-r0.2.19.so
locale:
[1] LC_CTYPE=en_US.UTF-8 LC_NUMERIC=C LC_TIME=C
[4] LC_COLLATE=C LC_MONETARY=C LC_MESSAGES=C
[7] LC_PAPER=C LC_NAME=C LC_ADDRESS=C
[10] LC_TELEPHONE=C LC_MEASUREMENT=C LC_IDENTIFICATION=C
attached base packages:
[1] stats graphics grDevices utils datasets methods base
other attached packages:
[1] RColorBrewer_1.1-2 data.table_1.14.2 forcats_0.4.0 stringr_1.4.0
[5] dplyr_1.0.9 purrr_0.3.4 readr_1.3.1 tidyr_1.2.0
[9] tibble_3.1.7 ggplot2_3.3.6 tidyverse_1.3.0
loaded via a namespace (and not attached):
[1] Rcpp_1.0.5 lubridate_1.7.4 assertthat_0.2.1 rprojroot_2.0.2
[5] digest_0.6.20 utf8_1.1.4 R6_2.4.0 cellranger_1.1.0
[9] backports_1.4.1 reprex_0.3.0 evaluate_0.15 highr_0.9
[13] httr_1.4.4 pillar_1.7.0 rlang_1.0.5 readxl_1.3.1
[17] rstudioapi_0.14 whisker_0.3-2 R.oo_1.22.0 R.utils_2.9.0
[21] rmarkdown_1.13 labeling_0.3 munsell_0.5.0 broom_1.0.0
[25] compiler_3.6.1 httpuv_1.5.1 modelr_0.1.8 xfun_0.31
[29] pkgconfig_2.0.2 htmltools_0.5.3 tidyselect_1.1.2 workflowr_1.6.2
[33] fansi_0.4.0 crayon_1.3.4 dbplyr_1.4.2 withr_2.5.0
[37] later_0.8.0 R.methodsS3_1.7.1 grid_3.6.1 jsonlite_1.6
[41] gtable_0.3.0 lifecycle_1.0.1 DBI_1.1.0 git2r_0.26.1
[45] magrittr_1.5 scales_1.1.0 cli_3.3.0 stringi_1.4.3
[49] farver_2.1.0 fs_1.5.2 promises_1.0.1 xml2_1.3.2
[53] ellipsis_0.3.2 generics_0.1.3 vctrs_0.4.1 tools_3.6.1
[57] glue_1.6.2 hms_0.5.3 fastmap_1.1.0 yaml_2.2.0
[61] colorspace_1.4-1 rvest_0.3.5 knitr_1.39 haven_2.3.1