ApaQTLs with all individuals
Briana Mittleman
9/25/2018
Last updated: 2019-02-15
Checks: 6 0
Knit directory: threeprimeseq/analysis/
This reproducible R Markdown analysis was created with workflowr (version 1.2.0). The Report tab describes the reproducibility checks that were applied when the results were created. The Past versions tab lists the development history.
Great! Since the R Markdown file has been committed to the Git repository, you know the exact version of the code that produced these results.
Great job! The global environment was empty. Objects defined in the global environment can affect the analysis in your R Markdown file in unknown ways. For reproduciblity it’s best to always run the code in an empty environment.
The command set.seed(12345) was run prior to running the code in the R Markdown file. Setting a seed ensures that any results that rely on randomness, e.g. subsampling or permutations, are reproducible.
Great job! Recording the operating system, R version, and package versions is critical for reproducibility.
Nice! There were no cached chunks for this analysis, so you can be confident that you successfully produced the results during this run.
Great! You are using Git for version control. Tracking code development and connecting the code version to the results is critical for reproducibility. The version displayed above was the version of the Git repository at the time these results were generated.
Note that you need to be careful to ensure that all relevant files for the analysis have been committed to Git prior to generating the results (you can use wflow_publish or wflow_git_commit). workflowr only checks the R Markdown file, but you know if there are other scripts or data files that it depends on. Below is the status of the Git repository when the results were generated:
Ignored files:
    Ignored:    .DS_Store
    Ignored:    .Rhistory
    Ignored:    .Rproj.user/
    Ignored:    data/.DS_Store
    Ignored:    data/perm_QTL_trans_noMP_5percov/
    Ignored:    output/.DS_Store

Untracked files:
    Untracked:  KalistoAbundance18486.txt
    Untracked:  analysis/4suDataIGV.Rmd
    Untracked:  analysis/DirectionapaQTL.Rmd
    Untracked:  analysis/EvaleQTLs.Rmd
    Untracked:  analysis/YL_QTL_test.Rmd
    Untracked:  analysis/ncbiRefSeq_sm.sort.mRNA.bed
    Untracked:  analysis/snake.config.notes.Rmd
    Untracked:  analysis/verifyBAM.Rmd
    Untracked:  analysis/verifybam_dubs.Rmd
    Untracked:  code/PeaksToCoverPerReads.py
    Untracked:  code/strober_pc_pve_heatmap_func.R
    Untracked:  data/18486.genecov.txt
    Untracked:  data/APApeaksYL.total.inbrain.bed
    Untracked:  data/ApaQTLs/
    Untracked:  data/ChromHmmOverlap/
    Untracked:  data/DistTXN2Peak_genelocAnno/
    Untracked:  data/GM12878.chromHMM.bed
    Untracked:  data/GM12878.chromHMM.txt
    Untracked:  data/LianoglouLCL/
    Untracked:  data/LocusZoom/
    Untracked:  data/NuclearApaQTLs.txt
    Untracked:  data/PeakCounts/
    Untracked:  data/PeakCounts_noMP_5perc/
    Untracked:  data/PeakCounts_noMP_genelocanno/
    Untracked:  data/PeakUsage/
    Untracked:  data/PeakUsage_noMP/
    Untracked:  data/PeakUsage_noMP_GeneLocAnno/
    Untracked:  data/PeaksUsed/
    Untracked:  data/PeaksUsed_noMP_5percCov/
    Untracked:  data/RNAkalisto/
    Untracked:  data/RefSeq_annotations/
    Untracked:  data/TotalApaQTLs.txt
    Untracked:  data/Totalpeaks_filtered_clean.bed
    Untracked:  data/UnderstandPeaksQC/
    Untracked:  data/WASP_STAT/
    Untracked:  data/YL-SP-18486-T-combined-genecov.txt
    Untracked:  data/YL-SP-18486-T_S9_R1_001-genecov.txt
    Untracked:  data/YL_QTL_test/
    Untracked:  data/apaExamp/
    Untracked:  data/apaQTL_examp_noMP/
    Untracked:  data/bedgraph_peaks/
    Untracked:  data/bin200.5.T.nuccov.bed
    Untracked:  data/bin200.Anuccov.bed
    Untracked:  data/bin200.nuccov.bed
    Untracked:  data/clean_peaks/
    Untracked:  data/comb_map_stats.csv
    Untracked:  data/comb_map_stats.xlsx
    Untracked:  data/comb_map_stats_39ind.csv
    Untracked:  data/combined_reads_mapped_three_prime_seq.csv
    Untracked:  data/diff_iso_GeneLocAnno/
    Untracked:  data/diff_iso_proc/
    Untracked:  data/diff_iso_trans/
    Untracked:  data/ensemble_to_genename.txt
    Untracked:  data/example_gene_peakQuant/
    Untracked:  data/explainProtVar/
    Untracked:  data/filtPeakOppstrand_cov_noMP_GeneLocAnno_5perc/
    Untracked:  data/filtered_APApeaks_merged_allchrom_refseqTrans.closest2End.bed
    Untracked:  data/filtered_APApeaks_merged_allchrom_refseqTrans.closest2End.noties.bed
    Untracked:  data/first50lines_closest.txt
    Untracked:  data/gencov.test.csv
    Untracked:  data/gencov.test.txt
    Untracked:  data/gencov_zero.test.csv
    Untracked:  data/gencov_zero.test.txt
    Untracked:  data/gene_cov/
    Untracked:  data/joined
    Untracked:  data/leafcutter/
    Untracked:  data/merged_combined_YL-SP-threeprimeseq.bg
    Untracked:  data/molPheno_noMP/
    Untracked:  data/mol_overlap/
    Untracked:  data/mol_pheno/
    Untracked:  data/nom_QTL/
    Untracked:  data/nom_QTL_opp/
    Untracked:  data/nom_QTL_trans/
    Untracked:  data/nuc6up/
    Untracked:  data/nuc_10up/
    Untracked:  data/other_qtls/
    Untracked:  data/pQTL_otherphen/
    Untracked:  data/peakPerRefSeqGene/
    Untracked:  data/perm_QTL/
    Untracked:  data/perm_QTL_GeneLocAnno_noMP_5percov/
    Untracked:  data/perm_QTL_GeneLocAnno_noMP_5percov_3UTR/
    Untracked:  data/perm_QTL_opp/
    Untracked:  data/perm_QTL_trans/
    Untracked:  data/perm_QTL_trans_filt/
    Untracked:  data/protAndAPAAndExplmRes.Rda
    Untracked:  data/protAndAPAlmRes.Rda
    Untracked:  data/protAndExpressionlmRes.Rda
    Untracked:  data/reads_mapped_three_prime_seq.csv
    Untracked:  data/smash.cov.results.bed
    Untracked:  data/smash.cov.results.csv
    Untracked:  data/smash.cov.results.txt
    Untracked:  data/smash_testregion/
    Untracked:  data/ssFC200.cov.bed
    Untracked:  data/temp.file1
    Untracked:  data/temp.file2
    Untracked:  data/temp.gencov.test.txt
    Untracked:  data/temp.gencov_zero.test.txt
    Untracked:  data/threePrimeSeqMetaData.csv
    Untracked:  data/threePrimeSeqMetaData55Ind.txt
    Untracked:  data/threePrimeSeqMetaData55Ind.xlsx
    Untracked:  data/threePrimeSeqMetaData55Ind_noDup.txt
    Untracked:  data/threePrimeSeqMetaData55Ind_noDup.xlsx
    Untracked:  data/threePrimeSeqMetaData55Ind_noDup_WASPMAP.txt
    Untracked:  data/threePrimeSeqMetaData55Ind_noDup_WASPMAP.xlsx
    Untracked:  output/picard/
    Untracked:  output/plots/
    Untracked:  output/qual.fig2.pdf

Unstaged changes:
    Modified:   analysis/28ind.peak.explore.Rmd
    Modified:   analysis/CompareLianoglouData.Rmd
    Modified:   analysis/NewPeakPostMP.Rmd
    Modified:   analysis/apaQTLoverlapGWAS.Rmd
    Modified:   analysis/cleanupdtseq.internalpriming.Rmd
    Modified:   analysis/coloc_apaQTLs_protQTLs.Rmd
    Modified:   analysis/dif.iso.usage.leafcutter.Rmd
    Modified:   analysis/diff_iso_pipeline.Rmd
    Modified:   analysis/explainpQTLs.Rmd
    Modified:   analysis/explore.filters.Rmd
    Modified:   analysis/flash2mash.Rmd
    Modified:   analysis/mispriming_approach.Rmd
    Modified:   analysis/overlapMolQTL.Rmd
    Modified:   analysis/overlapMolQTL.opposite.Rmd
    Modified:   analysis/overlap_qtls.Rmd
    Modified:   analysis/peakOverlap_oppstrand.Rmd
    Modified:   analysis/peakQCPPlots.Rmd
    Modified:   analysis/pheno.leaf.comb.Rmd
    Modified:   analysis/pipeline_55Ind.Rmd
    Modified:   analysis/swarmPlots_QTLs.Rmd
    Modified:   analysis/test.max2.Rmd
    Modified:   analysis/test.smash.Rmd
    Modified:   analysis/understandPeaks.Rmd
    Modified:   code/Snakefile
Note that any generated files, e.g. HTML, png, CSS, etc., are not included in this status report because it is ok for generated content to have uncommitted changes.
These are the previous versions of the R Markdown and HTML files. If you’ve configured a remote Git repository (see ?wflow_git_remote), click on the hyperlinks in the table below to view them.
| File | Version | Author | Date | Message |
|---|---|---|---|---|
| html | ea3cfeb | Briana Mittleman | 2018-09-26 | Build site. |
| Rmd | 1c62f0b | Briana Mittleman | 2018-09-26 | add distribution of distance |
| html | cd3bdf8 | Briana Mittleman | 2018-09-26 | Build site. |
| Rmd | 529ace6 | Briana Mittleman | 2018-09-26 | add QTL res |
| html | b1bcf99 | Briana Mittleman | 2018-09-25 | Build site. |
| Rmd | f4e1942 | Briana Mittleman | 2018-09-25 | initiate all ind QTL analysis |
library(tidyverse)── Attaching packages ───────────────────────────────────────────────────────────── tidyverse 1.2.1 ──✔ ggplot2 3.0.0 ✔ purrr 0.2.5
✔ tibble 1.4.2 ✔ dplyr 0.7.6
✔ tidyr 0.8.1 ✔ stringr 1.4.0
✔ readr 1.1.1 ✔ forcats 0.3.0Warning: package 'stringr' was built under R version 3.5.2── Conflicts ──────────────────────────────────────────────────────────────── tidyverse_conflicts() ──
✖ dplyr::filter() masks stats::filter()
✖ dplyr::lag() masks stats::lag()library(reshape2)
Attaching package: 'reshape2'The following object is masked from 'package:tidyr':
smithslibrary(workflowr)This is workflowr version 1.2.0
Run ?workflowr for help getting startedI am using the code from peakOverlap_oppstrand.Rmd analysis to call QTLs on the full set of individuals. (still missing 4 due to genotype issues- Remove 18500, 19092 and 19193, 18497 - at 35).
Scripts:
* APAqtl_nominal_oppstrand.sh
- APAqtl_perm_Opp.sh
cat /project2/gilad/briana/threeprimeseq/data/perm_APAqtl_Opp/filtered_APApeaks_merged_allchrom_refseqGenes_pheno_Total* > /project2/gilad/briana/threeprimeseq/data/perm_APAqtl_Opp/filtered_APApeaks_merged_allchrom_refseqGenes_pheno_Total_permRes.txt

cat /project2/gilad/briana/threeprimeseq/data/perm_APAqtl_Opp/filtered_APApeaks_merged_allchrom_refseqGenes_pheno_Nuclear* > /project2/gilad/briana/threeprimeseq/data/perm_APAqtl_Opp/filtered_APApeaks_merged_allchrom_refseqGenes_pheno_Nuclear_permRes.txt
Write a script to ad the BH correction of the permuted QTL pvalues. I will write the plots to
APAqtlpermCorrectQQplot.R
library(dplyr)


##total results
tot.perm= read.table("/project2/gilad/briana/threeprimeseq/data/perm_APAqtl_Opp/filtered_APApeaks_merged_allchrom_refseqGenes_pheno_Total_permRes.txt",head=F, stringsAsFactors=F, col.names = c("pid", "nvar", "shape1", "shape2", "dummy", "sid", "dist", "npval", "slope", "ppval", "bpval"))

#BH correction
tot.perm$bh=p.adjust(tot.perm$bpval, method="fdr")

#plot qqplot
pdf("/project2/gilad/briana/threeprimeseq/output/plots/qqplot_total_APAperm.pdf")
qqplot_total= qqplot(-log10(runif(nrow(tot.perm))), -log10(tot.perm$bpval),ylab="-log10 Total permuted pvalue", xlab="Uniform expectation", main="Total permuted pvalues for all snps")
abline(0,1)
dev.off()

#write df with BH

write.table(tot.perm, file = "/project2/gilad/briana/threeprimeseq/data/perm_APAqtl_Opp/filtered_APApeaks_merged_allchrom_refseqGenes_pheno_Total_permResBH.txt", col.names = T, row.names = F, quote = F)

##nuclear results


nuc.perm= read.table("/project2/gilad/briana/threeprimeseq/data/perm_APAqtl_Opp/filtered_APApeaks_merged_allchrom_refseqGenes_pheno_Nuclear_permRes.txt",head=F, stringsAsFactors=F, col.names = c("pid", "nvar", "shape1", "shape2", "dummy", "sid", "dist", "npval", "slope", "ppval", "bpval"))
nuc.perm$bh=p.adjust(nuc.perm$bpval, method="fdr")


#plot qqplot
pdf("/project2/gilad/briana/threeprimeseq/output/plots/qqplot_nuclear_APAperm.pdf")
qqplot(-log10(runif(nrow(nuc.perm))), -log10(nuc.perm$bpval),ylab="-log10 Nuclear permuted pvalue", xlab="Uniform expectation", main="Nuclear permuted pvalues for all snps")
abline(0,1)
dev.off()

# write df with BH
write.table(nuc.perm, file = "/project2/gilad/briana/threeprimeseq/data/perm_APAqtl_Opp/filtered_APApeaks_merged_allchrom_refseqGenes_pheno_Nuclear_permResBH.txt", col.names = T, row.names = F, quote = F)
Write a script to run this:
run_APAqtlpermCorrectQQplot.sh
#!/bin/bash


#SBATCH --job-name=run_APAqtlpermCorrectQQplot
#SBATCH --account=pi-yangili1
#SBATCH --time=24:00:00
#SBATCH --output=run_APAqtlpermCorrectQQplot.out
#SBATCH --error=run_APAqtlpermCorrectQQplot.err
#SBATCH --partition=broadwl
#SBATCH --mem=12G
#SBATCH --mail-type=END

module load Anaconda3
source activate three-prime-env


Rscript APAqtlpermCorrectQQplot.R
Total results
tot_permBH=read.table("../data/perm_QTL_opp/filtered_APApeaks_merged_allchrom_refseqGenes_pheno_Total_permResBH.txt", header=T, stringsAsFactors = F)Check to quality of the tests:
plot(tot_permBH$ppval, tot_permBH$bpval, xlab="Direct method", ylab="Beta approximation", main="Total Check plot")
abline(0, 1, col="red")
| Version | Author | Date |
|---|---|---|
| cd3bdf8 | Briana Mittleman | 2018-09-26 |
plot(-log10(tot_permBH$bh), main="Total BH corrected pval")
abline(h=1,col="Red")
| Version | Author | Date |
|---|---|---|
| cd3bdf8 | Briana Mittleman | 2018-09-26 |
I am going to look how many variants pass the 10% FDR.
tot_qtl_10= tot_permBH %>% filter(-log10(bh) > 1)
nrow(tot_qtl_10)
[1] 1468This is not accounting for the same peak in multiple genes. I want to look at the number of unique snps that are significant.
tot_qtl_10uniq= tot_permBH %>% filter(-log10(bh) > 1)  %>% summarise(n_distinct(sid))
tot_qtl_10uniq
n_distinct(sid)
1 568Nuclear results
nuc_permBH=read.table("../data/perm_QTL_opp/filtered_APApeaks_merged_allchrom_refseqGenes_pheno_Nuclear_permResBH.txt", header=T, stringsAsFactors = F)Check to quality of the tests:
plot(nuc_permBH$ppval, nuc_permBH$bpval, xlab="Direct method", ylab="Beta approximation", main="Nuclear Check plot")
abline(0, 1, col="red")
| Version | Author | Date |
|---|---|---|
| cd3bdf8 | Briana Mittleman | 2018-09-26 |
plot(-log10(nuc_permBH$bh), main="Nuclear BH corrected pval")
abline(h=1,col="Red")
| Version | Author | Date |
|---|---|---|
| cd3bdf8 | Briana Mittleman | 2018-09-26 |
I am going to look how many variants pass the 10% FDR.
nuc_qtl_10= nuc_permBH %>% filter(-log10(bh) > 1)
nrow(nuc_qtl_10)
[1] 7025This is not accounting for the same peak in multiple genes. I want to look at the number of unique snps that are significant.
nuc_qtl_10uniq= nuc_permBH %>% filter(-log10(bh) > 1)  %>% summarise(n_distinct(sid))
nuc_qtl_10uniq
n_distinct(sid)
1 2736Compare number of sig QTLs by FDR cuttoff
nQTL_tot=c()
FDR=seq(.05, .5, .01)
for (i in FDR){
  x=tot_permBH %>% filter(bh < i ) %>% nrow()
  nQTL_tot=c(nQTL_tot, x)
}

FDR=seq(.05, .5, .01)
nQTL_nuc=c()
for (i in FDR){
  x=nuc_permBH %>% filter(bh < i ) %>% nrow()
  nQTL_nuc=c(nQTL_nuc, x)
}

nQTL=as.data.frame(cbind(FDR, Total=nQTL_tot, Nuclear=nQTL_nuc))
nQTL_long=melt(nQTL, id.vars = "FDR")

ggplot(nQTL_long, aes(x=FDR, y=value, by=variable, col=variable)) + geom_line(size=1.5) + labs(y="Number of Significant QTLs", title="APAqtls detected by FDR cuttoff", color="Fraction")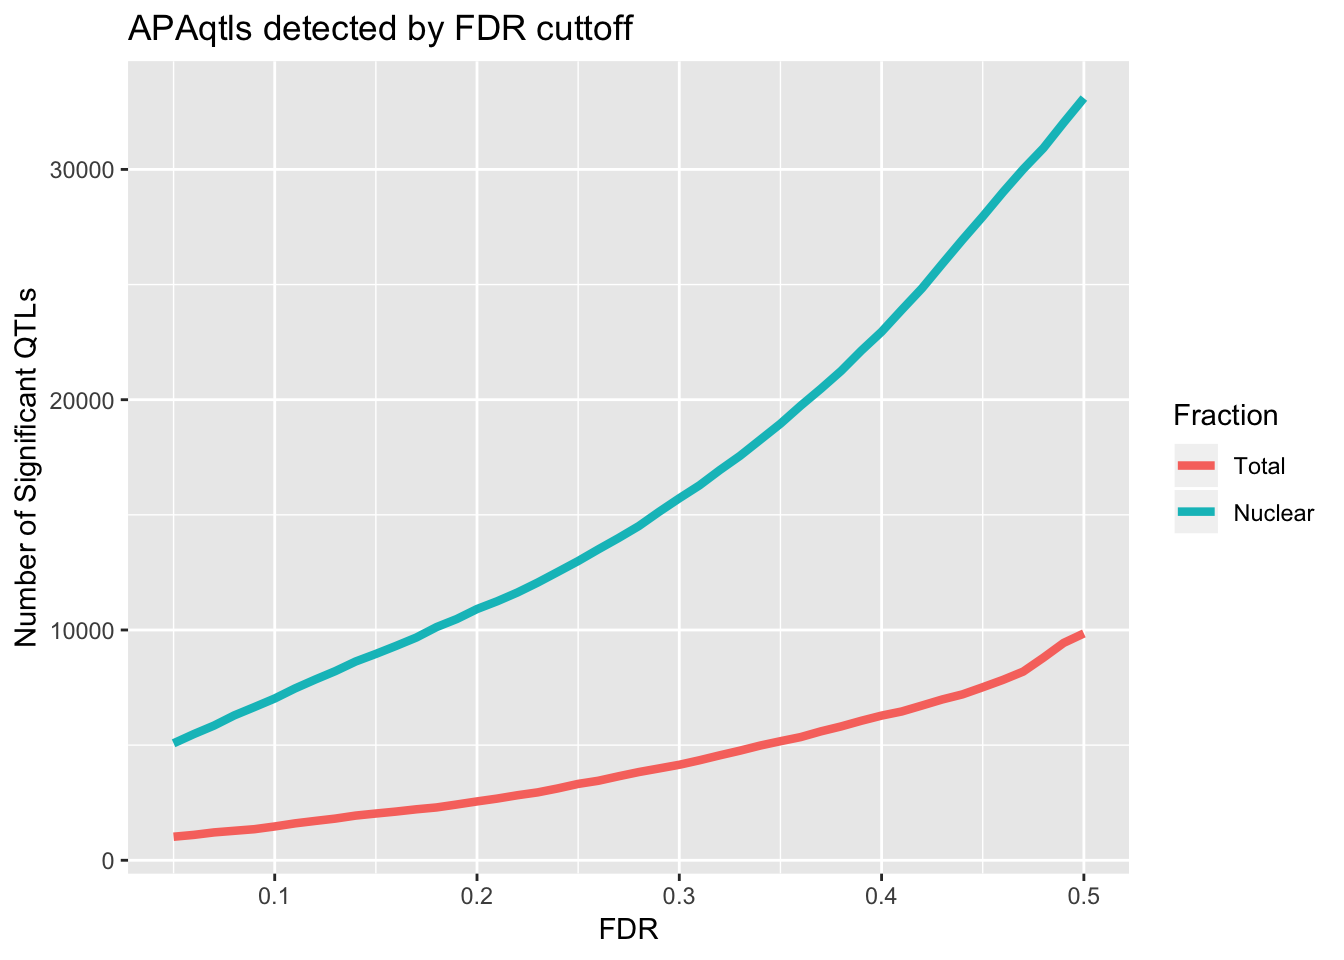
| Version | Author | Date |
|---|---|---|
| cd3bdf8 | Briana Mittleman | 2018-09-26 |
Explore QTLs
Look at distribution of SNP to peak in each fraction:
ggplot(nuc_qtl_10, aes(x=log10(abs(dist) + 1)) )+ geom_histogram(binwidth=.15, alpha=.5 ) + geom_histogram(data=tot_qtl_10, aes(x=log10(abs(dist) + 1)),fill="Red", alpha=.5,binwidth=.15) + annotate("text", x=1, y=950, col="Red", label="Total") + annotate("text", x=1, y=900, col="Black", label="Nuclear") + geom_rect(linetype=1, xmin=.5, xmax=1.5, ymin=850, ymax=1000, color="Black", alpha=0)
| Version | Author | Date |
|---|---|---|
| ea3cfeb | Briana Mittleman | 2018-09-26 |
ggplot(nuc_qtl_10, aes(x=log10(abs(dist) + 1)) )+ geom_density( alpha=.25 ,fill="Black") + geom_density(data=tot_qtl_10, aes(x=log10(abs(dist) + 1)),fill="Red", alpha=.25) + annotate("text", x=1, y=.77, col="Red", label="Total") + annotate("text", x=1, y=.72, col="Black", label="Nuclear") + geom_rect(linetype=1, xmin=.5, xmax=1.5, ymin=.69, ymax=.8, color="Black", alpha=0)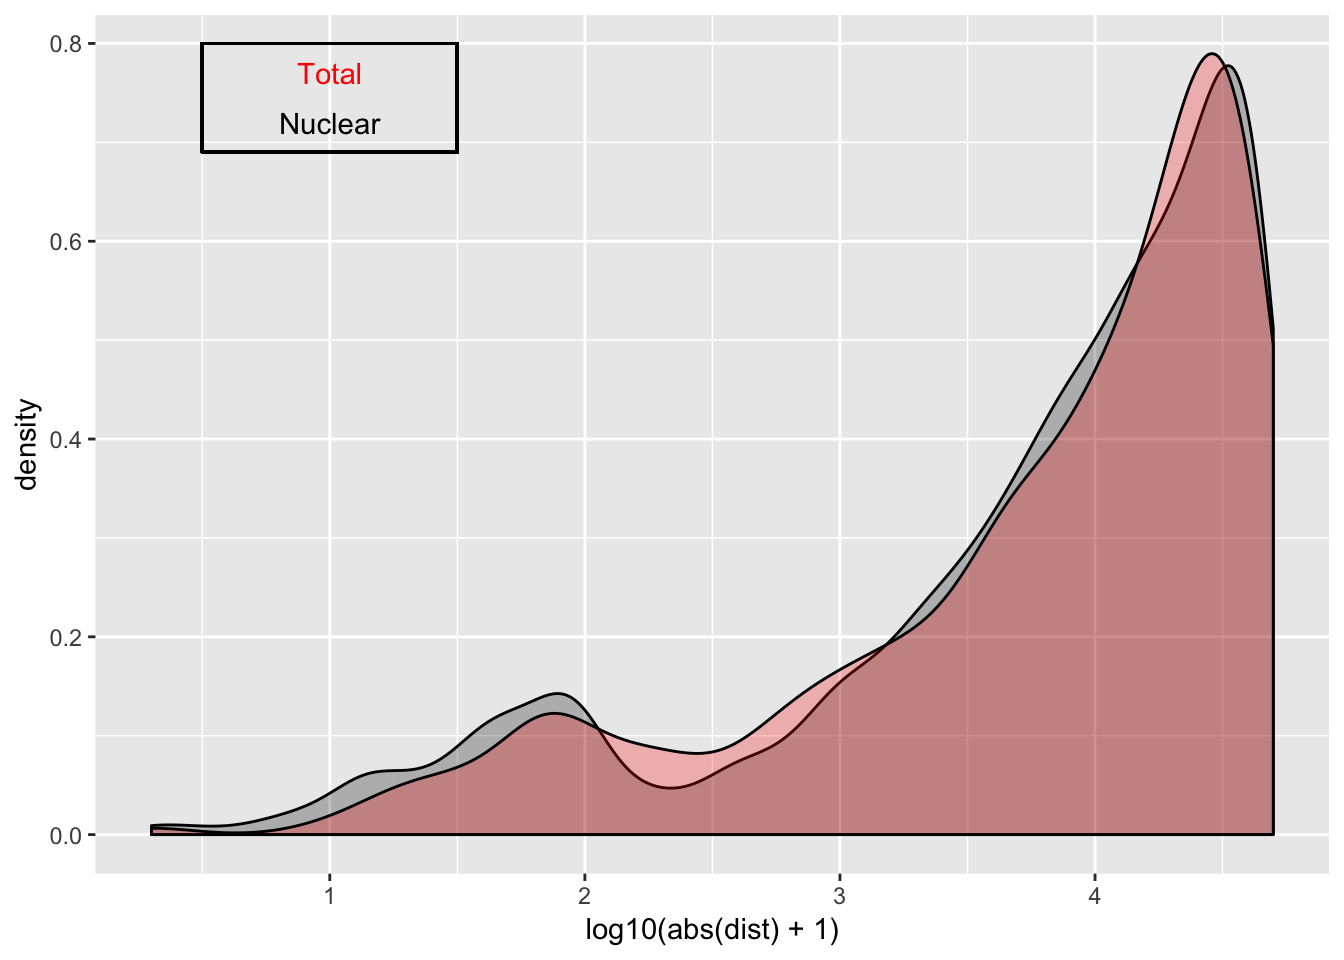
| Version | Author | Date |
|---|---|---|
| ea3cfeb | Briana Mittleman | 2018-09-26 |
sessionInfo()R version 3.5.1 (2018-07-02)
Platform: x86_64-apple-darwin15.6.0 (64-bit)
Running under: macOS 10.14.1
Matrix products: default
BLAS: /Library/Frameworks/R.framework/Versions/3.5/Resources/lib/libRblas.0.dylib
LAPACK: /Library/Frameworks/R.framework/Versions/3.5/Resources/lib/libRlapack.dylib
locale:
[1] en_US.UTF-8/en_US.UTF-8/en_US.UTF-8/C/en_US.UTF-8/en_US.UTF-8
attached base packages:
[1] stats graphics grDevices utils datasets methods base
other attached packages:
[1] bindrcpp_0.2.2 workflowr_1.2.0 reshape2_1.4.3 forcats_0.3.0
[5] stringr_1.4.0 dplyr_0.7.6 purrr_0.2.5 readr_1.1.1
[9] tidyr_0.8.1 tibble_1.4.2 ggplot2_3.0.0 tidyverse_1.2.1
loaded via a namespace (and not attached):
[1] Rcpp_0.12.19 cellranger_1.1.0 plyr_1.8.4 compiler_3.5.1
[5] pillar_1.3.0 git2r_0.24.0 bindr_0.1.1 tools_3.5.1
[9] digest_0.6.17 lubridate_1.7.4 jsonlite_1.6 evaluate_0.13
[13] nlme_3.1-137 gtable_0.2.0 lattice_0.20-35 pkgconfig_2.0.2
[17] rlang_0.2.2 cli_1.0.1 rstudioapi_0.9.0 yaml_2.2.0
[21] haven_1.1.2 withr_2.1.2 xml2_1.2.0 httr_1.3.1
[25] knitr_1.20 hms_0.4.2 fs_1.2.6 rprojroot_1.3-2
[29] grid_3.5.1 tidyselect_0.2.4 glue_1.3.0 R6_2.3.0
[33] readxl_1.1.0 rmarkdown_1.11 modelr_0.1.2 magrittr_1.5
[37] whisker_0.3-2 backports_1.1.2 scales_1.0.0 htmltools_0.3.6
[41] rvest_0.3.2 assertthat_0.2.0 colorspace_1.3-2 labeling_0.3
[45] stringi_1.2.4 lazyeval_0.2.1 munsell_0.5.0 broom_0.5.0
[49] crayon_1.3.4