Approach to better assign genes to peaks
Briana Mittleman
1/28/2019
Last updated: 2019-01-30
workflowr checks: (Click a bullet for more information)-
✔ R Markdown file: up-to-date
Great! Since the R Markdown file has been committed to the Git repository, you know the exact version of the code that produced these results.
-
✔ Environment: empty
Great job! The global environment was empty. Objects defined in the global environment can affect the analysis in your R Markdown file in unknown ways. For reproduciblity it’s best to always run the code in an empty environment.
-
✔ Seed:
set.seed(12345)The command
set.seed(12345)was run prior to running the code in the R Markdown file. Setting a seed ensures that any results that rely on randomness, e.g. subsampling or permutations, are reproducible. -
✔ Session information: recorded
Great job! Recording the operating system, R version, and package versions is critical for reproducibility.
-
Great! You are using Git for version control. Tracking code development and connecting the code version to the results is critical for reproducibility. The version displayed above was the version of the Git repository at the time these results were generated.✔ Repository version: a8a9acb
Note that you need to be careful to ensure that all relevant files for the analysis have been committed to Git prior to generating the results (you can usewflow_publishorwflow_git_commit). workflowr only checks the R Markdown file, but you know if there are other scripts or data files that it depends on. Below is the status of the Git repository when the results were generated:
Note that any generated files, e.g. HTML, png, CSS, etc., are not included in this status report because it is ok for generated content to have uncommitted changes.Ignored files: Ignored: .DS_Store Ignored: .Rhistory Ignored: .Rproj.user/ Ignored: data/.DS_Store Ignored: output/.DS_Store Untracked files: Untracked: KalistoAbundance18486.txt Untracked: analysis/DirectionapaQTL.Rmd Untracked: analysis/EvaleQTLs.Rmd Untracked: analysis/YL_QTL_test.Rmd Untracked: analysis/ncbiRefSeq_sm.sort.mRNA.bed Untracked: analysis/snake.config.notes.Rmd Untracked: analysis/verifyBAM.Rmd Untracked: analysis/verifybam_dubs.Rmd Untracked: code/PeaksToCoverPerReads.py Untracked: code/strober_pc_pve_heatmap_func.R Untracked: data/18486.genecov.txt Untracked: data/APApeaksYL.total.inbrain.bed Untracked: data/ChromHmmOverlap/ Untracked: data/GM12878.chromHMM.bed Untracked: data/GM12878.chromHMM.txt Untracked: data/LianoglouLCL/ Untracked: data/LocusZoom/ Untracked: data/NuclearApaQTLs.txt Untracked: data/PeakCounts/ Untracked: data/PeakCounts_noMP_5perc/ Untracked: data/PeakUsage/ Untracked: data/PeakUsage_noMP/ Untracked: data/PeakUsage_noMP_GeneLocAnno/ Untracked: data/PeaksUsed/ Untracked: data/PeaksUsed_noMP_5percCov/ Untracked: data/RNAkalisto/ Untracked: data/RefSeq_annotations/ Untracked: data/TotalApaQTLs.txt Untracked: data/Totalpeaks_filtered_clean.bed Untracked: data/UnderstandPeaksQC/ Untracked: data/YL-SP-18486-T-combined-genecov.txt Untracked: data/YL-SP-18486-T_S9_R1_001-genecov.txt Untracked: data/YL_QTL_test/ Untracked: data/apaExamp/ Untracked: data/apaQTL_examp_noMP/ Untracked: data/bedgraph_peaks/ Untracked: data/bin200.5.T.nuccov.bed Untracked: data/bin200.Anuccov.bed Untracked: data/bin200.nuccov.bed Untracked: data/clean_peaks/ Untracked: data/comb_map_stats.csv Untracked: data/comb_map_stats.xlsx Untracked: data/comb_map_stats_39ind.csv Untracked: data/combined_reads_mapped_three_prime_seq.csv Untracked: data/diff_iso_GeneLocAnno/ Untracked: data/diff_iso_proc/ Untracked: data/diff_iso_trans/ Untracked: data/ensemble_to_genename.txt Untracked: data/example_gene_peakQuant/ Untracked: data/explainProtVar/ Untracked: data/filtered_APApeaks_merged_allchrom_refseqTrans.closest2End.bed Untracked: data/filtered_APApeaks_merged_allchrom_refseqTrans.closest2End.noties.bed Untracked: data/first50lines_closest.txt Untracked: data/gencov.test.csv Untracked: data/gencov.test.txt Untracked: data/gencov_zero.test.csv Untracked: data/gencov_zero.test.txt Untracked: data/gene_cov/ Untracked: data/joined Untracked: data/leafcutter/ Untracked: data/merged_combined_YL-SP-threeprimeseq.bg Untracked: data/molPheno_noMP/ Untracked: data/mol_overlap/ Untracked: data/mol_pheno/ Untracked: data/nom_QTL/ Untracked: data/nom_QTL_opp/ Untracked: data/nom_QTL_trans/ Untracked: data/nuc6up/ Untracked: data/nuc_10up/ Untracked: data/other_qtls/ Untracked: data/pQTL_otherphen/ Untracked: data/peakPerRefSeqGene/ Untracked: data/perm_QTL/ Untracked: data/perm_QTL_opp/ Untracked: data/perm_QTL_trans/ Untracked: data/perm_QTL_trans_filt/ Untracked: data/perm_QTL_trans_noMP_5percov/ Untracked: data/protAndAPAAndExplmRes.Rda Untracked: data/protAndAPAlmRes.Rda Untracked: data/protAndExpressionlmRes.Rda Untracked: data/reads_mapped_three_prime_seq.csv Untracked: data/smash.cov.results.bed Untracked: data/smash.cov.results.csv Untracked: data/smash.cov.results.txt Untracked: data/smash_testregion/ Untracked: data/ssFC200.cov.bed Untracked: data/temp.file1 Untracked: data/temp.file2 Untracked: data/temp.gencov.test.txt Untracked: data/temp.gencov_zero.test.txt Untracked: data/threePrimeSeqMetaData.csv Untracked: output/picard/ Untracked: output/plots/ Untracked: output/qual.fig2.pdf Unstaged changes: Modified: analysis/28ind.peak.explore.Rmd Modified: analysis/CompareLianoglouData.Rmd Modified: analysis/apaQTLoverlapGWAS.Rmd Modified: analysis/cleanupdtseq.internalpriming.Rmd Modified: analysis/coloc_apaQTLs_protQTLs.Rmd Modified: analysis/dif.iso.usage.leafcutter.Rmd Modified: analysis/diff_iso_pipeline.Rmd Modified: analysis/explainpQTLs.Rmd Modified: analysis/explore.filters.Rmd Modified: analysis/flash2mash.Rmd Modified: analysis/mispriming_approach.Rmd Modified: analysis/overlapMolQTL.Rmd Modified: analysis/overlapMolQTL.opposite.Rmd Modified: analysis/overlap_qtls.Rmd Modified: analysis/peakOverlap_oppstrand.Rmd Modified: analysis/peakQCPPlots.Rmd Modified: analysis/pheno.leaf.comb.Rmd Modified: analysis/swarmPlots_QTLs.Rmd Modified: analysis/test.max2.Rmd Modified: analysis/understandPeaks.Rmd Modified: code/Snakefile
Expand here to see past versions:
| File | Version | Author | Date | Message |
|---|---|---|---|---|
| Rmd | a8a9acb | Briana Mittleman | 2019-01-30 | add explanation for midlevel |
| html | 736a503 | Briana Mittleman | 2019-01-29 | Build site. |
| Rmd | a7f0295 | Briana Mittleman | 2019-01-29 | evaluate top delta PSI |
| html | 26951df | Briana Mittleman | 2019-01-29 | Build site. |
| html | 1def3fb | Briana Mittleman | 2019-01-29 | Build site. |
| Rmd | d194ec2 | Briana Mittleman | 2019-01-29 | lc results |
| html | 2701515 | Briana Mittleman | 2019-01-29 | Build site. |
| Rmd | 956f4a8 | Briana Mittleman | 2019-01-29 | peak usage 5% |
| html | 4e74f81 | Briana Mittleman | 2019-01-28 | Build site. |
| Rmd | e7ed8fc | Briana Mittleman | 2019-01-28 | fix map func |
| html | a97adbc | Briana Mittleman | 2019-01-28 | Build site. |
| Rmd | a2911ff | Briana Mittleman | 2019-01-28 | start analysis for new gene peak assignemnt |
New Approach Idea
Lin et al: An in-depth map of polyadenylation sites in cancer 2012: -Mapped locations to annotated locations in UCUS browser: “The mapped locations were annotated using the UCSC genome browser tables ( 26 ). When a locus could be attributed to multiple possible annotations, the locus was assigned with a single annotation in the following priority order: 3′ UTRs (sense), coding sequences (CDS, sense), 5′ UTRs (sense), intron (sense), non-coding RNAs (ncRNAs, sense), 5′ UTR antisense, CDS antisense, 3′ UTR antisense, intron antisense, promoter antisense, ncRNA antisense and intergenic”
I want to download this annotation and try this. I am using the ncbi_refseq annotations. I will download regions of the genome seperatly and then merge the files.
5’ UTR
Coding Exon
Intron
3’ UTR
(downstream 5000)-downstream proximal region
I also want a dictionary with the transcripts and the gene names for the annotation. This information will come from the Transcript2GeneName file. In this file the transcript ID is in column1 and the gene name column 13.
I have downloaded all of the these to data/RefSeq_annotations. I will concatinate all of these for a full annotation dataset, I will then sort this file. The file is ncbiRefSeq_allAnnotation.sort.bed
Using this I can create an annotation in a bed file I can use for the overlap with my peaks. This will include getting the transcript to gene annotations. I will transfer the files to midway in my genome annotation directory and work with them there.
Format full refseq annotation:
TXN2Gene_file="/project2/gilad/briana/genome_anotation_data/RefSeq_annotations/Transcript2GeneName.dms"

gene_dic={}

for ln in open(TXN2Gene_file,"r"):
   txn=ln.split()[1]
   gene=ln.split()[12]
   gene_dic[txn]=gene

outF=open("/project2/gilad/briana/genome_anotation_data/RefSeq_annotations/ncbiRefSeq_FormatedallAnnotation.sort.bed","w")

inFile="/project2/gilad/briana/genome_anotation_data/RefSeq_annotations/ncbiRefSeq_allAnnotation.sort.bed"


for ln in open(inFile, "r"):
   chrom, start, end, name, score, strand = ln.split()
   chrom_fix=chrom[3:]
   txn=name.split("_")[:2]
   txnF="_".join(txn)
   gene=gene_dic[txnF]
   type=name.split("_")[2]
   id=type + ":" + gene
   outF.write("%s\t%s\t%s\t%s\t%s\t%s\n"%(chrom_fix, start, end, id, score, strand))

outF.close()
Map peaks with new annotation
I want to create a file with my peaks mapped to these regions. I will include a structure for when there is a tie and put intergenic if it is not found. I need to do an intersect that gives me all of the IDs. After this I can use python to parse the hiarchy.
I can use bedtools map for this. I want all of the data to come back.
-c 4 -o distinct
-S opposite strand
I will do this on the peaks before I looked at usage.
mapnoMPPeaks2GenomeLoc.sh
#!/bin/bash

#SBATCH --job-name=mapnoMPPeaks2GenomeLoc
#SBATCH --account=pi-yangili1
#SBATCH --time=24:00:00
#SBATCH --output=mapnoMPPeaks2GenomeLoc.out
#SBATCH --error=mapnoMPPeaks2GenomeLoc.err
#SBATCH --partition=broadwl
#SBATCH --mem=12G
#SBATCH --mail-type=END

module load Anaconda3
source activate three-prime-env

#annotation: /project2/gilad/briana/genome_anotation_data/RefSeq_annotations/ncbiRefSeq_FormatedallAnnotation.sort.bed

#peaks:  /project2/gilad/briana/threeprimeseq/data/mergedPeaks_noMP_filtered/Filtered_APApeaks_merged_allchrom_noMP.sort.named.noCHR.bed


bedtools map -a /project2/gilad/briana/threeprimeseq/data/mergedPeaks_noMP_filtered/Filtered_APApeaks_merged_allchrom_noMP.sort.named.noCHR.bed -b /project2/gilad/briana/genome_anotation_data/RefSeq_annotations/ncbiRefSeq_FormatedallAnnotation.sort.bed -c 4 -S -o distinct > /project2/gilad/briana/threeprimeseq/data/mergedPeaks_noMP_GeneLoc/Filtered_APApeaks_merged_allchrom_noMP.sort.named.noCHR_geneLoc.bed
Look at how many get no annotation. I can do this interactively in python.
num=0
for ln in open("/project2/gilad/briana/threeprimeseq/data/mergedPeaks_noMP_GeneLoc/Filtered_APApeaks_merged_allchrom_noMP.sort.named.noCHR_geneLoc.bed", "r"):
    location=ln.split()[7]
    if location==".":
        num +=1

print(num)
This shows me that 85% of the peaks fall into one of these annotations.
Now I need to sort out the peaks with multiple annotations.
5’ UTR
Coding Exon
Intron
3’ UTR
(downstream 5000)-downstream proximal region
I can write this out as the SAF I need. GeneID (peak1:1:14404:14484:-:OR4F16) Chr Start End Strand. For this I cannot include the peaks with no gene association. I can go back to this if i need to in the future.
processGenLocPeakAnno2SAF.py
inFile="/project2/gilad/briana/threeprimeseq/data/mergedPeaks_noMP_GeneLoc/Filtered_APApeaks_merged_allchrom_noMP.sort.named.noCHR_geneLoc.bed"
outFile=open("/project2/gilad/briana/threeprimeseq/data/mergedPeaks_noMP_GeneLoc/Filtered_APApeaks_merged_allchrom_noMP.sort.named.noCHR_geneLocParsed.SAF" , "w")

outFile.write("GeneID\tChr\tStart\tEnd\tStrand\n")
for ln in open(inFile, "r"):
    chrom, start, end, peak, cov, strand, score, anno = ln.split()
    if anno==".":
        continue
    anno_lst=anno.split(",")
    if len(anno_lst)==1:
        gene=anno_lst[0].split(":")[1]
        print("1 gene")
        peak_i=int(peak)
        start_i=int(start)
        end_i=int(end)
        ID="peak%d:%s:%d:%d:%s:%s"%(peak_i, chrom, start_i, end_i, strand, gene)
        outFile.write("%s\t%s\t%d\t%d\t%s\n"%(ID, chrom, start_i, end_i, strand))
    else:
        type_dic={}
        for each in anno_lst:
            type_dic[each.split(":")[0]]=each.split(":")[1]
        if "utr3" in type_dic.keys():
            gene=type_dic["utr3"]
            peak_i=int(peak)
            start_i=int(start)
            end_i=int(end)
            ID="peak%d:%s:%d:%d:%s:%s"%(peak_i, chrom, start_i, end_i, strand, gene)
            outFile.write("%s\t%s\t%d\t%d\t%s\n"%(ID, chrom, start_i, end_i, strand))
        elif "end" in type_dic.keys():
            gene=type_dic["end"]
            peak_i=int(peak)
            start_i=int(start)
            end_i=int(end)
            ID="peak%d:%s:%d:%d:%s:%s"%(peak_i, chrom, start_i, end_i, strand, gene)
            outFile.write("%s\t%s\t%d\t%d\t%s\n"%(ID, chrom, start_i, end_i, strand))
        elif "cds" in type_dic.keys():
            gene=type_dic["cds"]
            peak_i=int(peak)
            start_i=int(start)
            end_i=int(end)
            ID="peak%d:%s:%d:%d:%s:%s"%(peak_i, chrom, start_i, end_i, strand, gene)
            outFile.write("%s\t%s\t%d\t%d\t%s\n"%(ID, chrom, start_i, end_i, strand))
        elif "utr5" in type_dic.keys():
            gene=type_dic["utr5"]
            peak_i=int(peak)
            start_i=int(start)
            end_i=int(end)
            ID="peak%d:%s:%d:%d:%s:%s"%(peak_i, chrom, start_i, end_i, strand, gene)
            outFile.write("%s\t%s\t%d\t%d\t%s\n"%(ID, chrom, start_i, end_i, strand))
        elif "intron" in type_dic.keys():
            gene=type_dic["intron"]
            peak_i=int(peak)
            start_i=int(start)
            end_i=int(end)
            ID="peak%d:%s:%d:%d:%s:%s"%(peak_i, chrom, start_i, end_i, strand, gene)
            outFile.write("%s\t%s\t%d\t%d\t%s\n"%(ID, chrom, start_i, end_i, strand))

outFile.close()
Map reads to new annotated peaks
This has all of the peaks with at least one gene annotation. (104555) I can run feature counts on this to start getting the usage.
GeneLocAnno_fc_TN_noMP.sh
Because I mapped the genes opposite. The reads are now on in the same direction as the peaks
#!/bin/bash

#SBATCH --job-name=GeneLocAnno_fc_TN_noMP
#SBATCH --account=pi-yangili1
#SBATCH --time=24:00:00
#SBATCH --output=GeneLocAnno_fc_TN_noMP.out
#SBATCH --error=GeneLocAnno_fc_TN_noMP.err
#SBATCH --partition=broadwl
#SBATCH --mem=12G
#SBATCH --mail-type=END

module load Anaconda3
source activate three-prime-env

featureCounts -O -a /project2/gilad/briana/threeprimeseq/data/mergedPeaks_noMP_GeneLoc/Filtered_APApeaks_merged_allchrom_noMP.sort.named.noCHR_geneLocParsed.SAF -F SAF -o /project2/gilad/briana/threeprimeseq/data/filtPeakOppstrand_cov_noMP_GeneLocAnno/filtered_APApeaks_merged_allchrom_refseqGenes.GeneLocAnno_NoMP_sm_quant.Total.fc /project2/gilad/briana/threeprimeseq/data/bam_NoMP_sort/*T-combined-sort.noMP.sort.bam -s 1

featureCounts -O -a /project2/gilad/briana/threeprimeseq/data/mergedPeaks_noMP_GeneLoc/Filtered_APApeaks_merged_allchrom_noMP.sort.named.noCHR_geneLocParsed.SAF -F SAF -o /project2/gilad/briana/threeprimeseq/data/filtPeakOppstrand_cov_noMP_GeneLocAnno/filtered_APApeaks_merged_allchrom_refseqGenes.GeneLocAnno_NoMP_sm_quant.Nuclear.fc /project2/gilad/briana/threeprimeseq/data/bam_NoMP_sort/*N-combined-sort.noMP.sort.bam -s 1
Around 4 mill mapping in nuclear and 7 mill in total.
fix_head_fc_geneLoc_tot_noMP.py
infile= open("/project2/gilad/briana/threeprimeseq/data/filtPeakOppstrand_cov_noMP_GeneLocAnno/filtered_APApeaks_merged_allchrom_refseqGenes.GeneLocAnno_NoMP_sm_quant.Total.fc", "r")
fout = open("/project2/gilad/briana/threeprimeseq/data/filtPeakOppstrand_cov_noMP_GeneLocAnno/filtered_APApeaks_merged_allchrom_refseqGenes.GeneLocAnno_NoMP_sm_quant.Total.fixed.fc",'w')
for line, i in enumerate(infile):
    if line == 1:
        i_list=i.split()
        libraries=i_list[:6]
        for sample in i_list[6:]:
            full = sample.split("/")[7]
            samp= full.split("-")[2:4]
            lim="_"
            samp_st=lim.join(samp)
            libraries.append(samp_st)
        first_line= "\t".join(libraries)
        fout.write(first_line + '\n')
    else :
        fout.write(i)
fout.close()
fix_head_fc_geneLoc_nuc_noMP.py
infile= open("/project2/gilad/briana/threeprimeseq/data/filtPeakOppstrand_cov_noMP_GeneLocAnno/filtered_APApeaks_merged_allchrom_refseqGenes.GeneLocAnno_NoMP_sm_quant.Nuclear.fc", "r")
fout = open("/project2/gilad/briana/threeprimeseq/data/filtPeakOppstrand_cov_noMP_GeneLocAnno/filtered_APApeaks_merged_allchrom_refseqGenes.GeneLocAnno_NoMP_sm_quant.Nuclear.fixed.fc",'w')
for line, i in enumerate(infile):
    if line == 1:
        i_list=i.split()
        libraries=i_list[:6]
        for sample in i_list[6:]:
            full = sample.split("/")[7]
            samp= full.split("-")[2:4]
            lim="_"
            samp_st=lim.join(samp)
            libraries.append(samp_st)
        first_line= "\t".join(libraries)
        fout.write(first_line + '\n')
    else :
        fout.write(i)
fout.close()
I can use the fileIDs
/project2/gilad/briana/threeprimeseq/data/filtPeakOppstrand_cov_noMP/file_id_mapping_nuclear_Transcript.txt and /project2/gilad/briana/threeprimeseq/data/filtPeakOppstrand_cov_noMP/file_id_mapping_total_Transcript.txt
Make phenotypes
I need to make a file with the gene start and ends because I use these in the phenotypes for QTL mapping. I can do this with the project2/gilad/briana/genome_anotation_data/RefSeq_annotations/Transcript2GeneName.dms file. I want the file to look like chr,start,end,txn:gene,.,strand I will sue the start and end of the coding seq
getGeneEnds.py
TXN2Gene_file=open("/project2/gilad/briana/genome_anotation_data/RefSeq_annotations/Transcript2GeneName.dms","r")

outFile=open("/project2/gilad/briana/genome_anotation_data/RefSeq_annotations/ncbiRefSeq_endAllGenes.bed", "w")

for i, ln in enumerate(TXN2Gene_file):
    if i >0 :
        chrom=ln.split()[2]
        chromf=chrom[3:]
        start=int(ln.split()[6])
        end=int(ln.split()[7])
        txn=ln.split()[1]
        genename=ln.split()[12]
        id=txn + ":" + genename
        strand=ln.split()[3]
        score="."
        outFile.write("%s\t%s\t%s\t%s\t%s\t%s\n"%(chromf, start, end, id, score, strand))

outFile.close()
Sort the bed file:
sort -k1,1 -k2,2n /project2/gilad/briana/genome_anotation_data/RefSeq_annotations/ncbiRefSeq_endAllGenes.bed > /project2/gilad/briana/genome_anotation_data/RefSeq_annotations/ncbiRefSeq_endAllGenes.sort.bedmakePhenoRefSeqPeaks_GeneLoc_Total_noMP.py
#PYTHON 3

dic_IND = {}
dic_BAM = {}

for ln in open("/project2/gilad/briana/threeprimeseq/data/filtPeakOppstrand_cov_noMP/file_id_mapping_total_Transcript.txt"):
    bam, IND = ln.split("\t")
    IND = IND.strip()
    dic_IND[bam] = IND
    if IND not in dic_BAM:
        dic_BAM[IND] = []
    dic_BAM[IND].append(bam)


#now I have ind dic with keys as the bam and ind as the values
#I also have a bam dic with ind as the keys and bam as the values

inds=list(dic_BAM.keys()) #list of ind libraries

#gene start and end dictionaries:
dic_geneS = {}
dic_geneE = {}
for ln in open("/project2/gilad/briana/genome_anotation_data/RefSeq_annotations/ncbiRefSeq_endAllGenes.sort.bed"):
    chrom, start, end, geneID, score, strand = ln.split('\t')
    gene= geneID.split(":")[1]
#    if "-" in gene:
 #       gene=gene.split("-")[0]
    if gene not in dic_geneS:
        dic_geneS[gene]=int(start)
        dic_geneE[gene]=int(end)


#list of genes

count_file=open("/project2/gilad/briana/threeprimeseq/data/filtPeakOppstrand_cov_noMP_GeneLocAnno/filtered_APApeaks_merged_allchrom_refseqGenes.GeneLocAnno_NoMP_sm_quant.Total.fixed.fc", "r")
genes=[]
for line , i in enumerate(count_file):
    if line > 1:
        i_list=i.split()
        id=i_list[0]
        id_list=id.split(":")
        gene=id_list[5]
        if gene not in genes:
            genes.append(gene)

#make the ind and gene dic
dic_dub={}
for g in genes:
    dic_dub[g]={}
    for i in inds:
        dic_dub[g][i]=0


#populate the dictionary
count_file=open("/project2/gilad/briana/threeprimeseq/data/filtPeakOppstrand_cov_noMP_GeneLocAnno/filtered_APApeaks_merged_allchrom_refseqGenes.GeneLocAnno_NoMP_sm_quant.Total.fixed.fc", "r")
for line, i in enumerate(count_file):
    if line > 1:
        i_list=i.split()
        id=i_list[0]
        id_list=id.split(":")
        g= id_list[5]
        values=list(i_list[6:])
        list_list=[]
        for ind,val in zip(inds, values):
            list_list.append([ind, val])
        for num, name in enumerate(list_list):
            dic_dub[g][list_list[num][0]] += int(list_list[num][1])


#write the file by acessing the dictionary and putting values in the table ver the value in the dic


fout=open("/project2/gilad/briana/threeprimeseq/data/phenotypes_filtPeakTranscript_noMP_GeneLocAnno/filtered_APApeaks_merged_allchrom_refseqGenes.GeneLocAnno_NoMP_sm_quant.Total.fixed.pheno.fc","w")
peak=["chrom"]
inds_noL=[]
for each in inds:
    indsNA= "NA" + each[:-2]
    inds_noL.append(indsNA)
fout.write(" ".join(peak + inds_noL) + '\n' )


count_file=open("/project2/gilad/briana/threeprimeseq/data/filtPeakOppstrand_cov_noMP_GeneLocAnno/filtered_APApeaks_merged_allchrom_refseqGenes.GeneLocAnno_NoMP_sm_quant.Total.fixed.fc", "r")
for line , i in enumerate(count_file):
    if line > 1:
        i_list=i.split()
        id=i_list[0]
        id_list=id.split(":")
        gene=id_list[5]
        start=dic_geneS[id_list[5]]
        end=dic_geneE[id_list[5]]
        buff=[]
        buff.append("chr%s:%d:%d:%s_%s_%s"%(id_list[1], start, end, id_list[5], id_list[4], id_list[0]))
        for x,y in zip(i_list[6:], inds):
            b=int(dic_dub[gene][y])
            t=int(x)
            buff.append("%d/%d"%(t,b))
        fout.write(" ".join(buff)+ '\n')

fout.close()
makePhenoRefSeqPeaks_GeneLoc_Nuclear_noMP.py
#PYTHON 3

dic_IND = {}
dic_BAM = {}

for ln in open("/project2/gilad/briana/threeprimeseq/data/filtPeakOppstrand_cov_noMP/file_id_mapping_nuclear_Transcript.txt"):
    bam, IND = ln.split("\t")
    IND = IND.strip()
    dic_IND[bam] = IND
    if IND not in dic_BAM:
        dic_BAM[IND] = []
    dic_BAM[IND].append(bam)


#now I have ind dic with keys as the bam and ind as the values
#I also have a bam dic with ind as the keys and bam as the values

inds=list(dic_BAM.keys()) #list of ind libraries

#gene start and end dictionaries:
dic_geneS = {}
dic_geneE = {}
for ln in open("/project2/gilad/briana/genome_anotation_data/RefSeq_annotations/ncbiRefSeq_endAllGenes.sort.bed"):
    chrom, start, end, geneID, score, strand = ln.split('\t')
    gene= geneID.split(":")[1]
    #if "-" in gene:
     #   gene=gene.split("-")[0]
    if gene not in dic_geneS:
        dic_geneS[gene]=int(start)
        dic_geneE[gene]=int(end)


#list of genes

count_file=open("/project2/gilad/briana/threeprimeseq/data/filtPeakOppstrand_cov_noMP_GeneLocAnno/filtered_APApeaks_merged_allchrom_refseqGenes.GeneLocAnno_NoMP_sm_quant.Nuclear.fixed.fc", "r")
genes=[]
for line , i in enumerate(count_file):
    if line > 1:
        i_list=i.split()
        id=i_list[0]
        id_list=id.split(":")
        gene=id_list[5]
        if gene not in genes:
            genes.append(gene)

#make the ind and gene dic
dic_dub={}
for g in genes:
    dic_dub[g]={}
    for i in inds:
        dic_dub[g][i]=0


#populate the dictionary
count_file=open("/project2/gilad/briana/threeprimeseq/data/filtPeakOppstrand_cov_noMP_GeneLocAnno/filtered_APApeaks_merged_allchrom_refseqGenes.GeneLocAnno_NoMP_sm_quant.Nuclear.fixed.fc", "r")
for line, i in enumerate(count_file):
    if line > 1:
        i_list=i.split()
        id=i_list[0]
        id_list=id.split(":")
        g= id_list[5]
        values=list(i_list[6:])
        list_list=[]
        for ind,val in zip(inds, values):
            list_list.append([ind, val])
        for num, name in enumerate(list_list):
            dic_dub[g][list_list[num][0]] += int(list_list[num][1])


#write the file by acessing the dictionary and putting values in the table ver the value in the dic


fout=open("/project2/gilad/briana/threeprimeseq/data/phenotypes_filtPeakTranscript_noMP_GeneLocAnno/filtered_APApeaks_merged_allchrom_refseqGenes.GeneLocAnno_NoMP_sm_quant.Nuclear.fixed.pheno.fc","w")
peak=["chrom"]
inds_noL=[]
for each in inds:
    indsNA= "NA" + each[:-2]
    inds_noL.append(indsNA)
fout.write(" ".join(peak + inds_noL) + '\n' )


count_file=open("/project2/gilad/briana/threeprimeseq/data/filtPeakOppstrand_cov_noMP_GeneLocAnno/filtered_APApeaks_merged_allchrom_refseqGenes.GeneLocAnno_NoMP_sm_quant.Nuclear.fixed.fc", "r")
for line , i in enumerate(count_file):
    if line > 1:
        i_list=i.split()
        id=i_list[0]
        id_list=id.split(":")
        gene=id_list[5]
        start=dic_geneS[id_list[5]]
        end=dic_geneE[id_list[5]]
        buff=[]
        buff.append("chr%s:%d:%d:%s_%s_%s"%(id_list[1], start, end, id_list[5], id_list[4], id_list[0]))
        for x,y in zip(i_list[6:], inds):
            b=int(dic_dub[gene][y])
            t=int(x)
            buff.append("%d/%d"%(t,b))
        fout.write(" ".join(buff)+ '\n')

fout.close()
Run make pheno files:
run_makePhen_sep_GeneLocAnno_noMP.sh
#!/bin/bash

#SBATCH --job-name=run_makePhen_sep_GeneLocAnno_noMP
#SBATCH --account=pi-yangili1
#SBATCH --time=24:00:00
#SBATCH --output=run_makePhen_sep_GeneLocAnno_noMP.out
#SBATCH --error=run_makePhen_sep_GeneLocAnno_noMP.err
#SBATCH --partition=broadwl
#SBATCH --mem=12G
#SBATCH --mail-type=END

module load Anaconda3
source activate three-prime-env

python makePhenoRefSeqPeaks_GeneLoc_Total_noMP.py

python makePhenoRefSeqPeaks_GeneLoc_Nuclear_noMP.py
Convert to Usage
pheno2CountOnly_genelocAnno.R
library(reshape2)
library(tidyverse)


totalPeakUs=read.table("/project2/gilad/briana/threeprimeseq/data/phenotypes_filtPeakTranscript_noMP_GeneLocAnno/filtered_APApeaks_merged_allchrom_refseqGenes.GeneLocAnno_NoMP_sm_quant.Total.fixed.pheno.fc", header = T, stringsAsFactors = F) %>% separate(chrom, sep = ":", into = c("chr", "start", "end", "id")) %>% separate(id, sep="_", into=c("gene", "strand", "peak"))
nuclearPeakUs=read.table("/project2/gilad/briana/threeprimeseq/data/phenotypes_filtPeakTranscript_noMP_GeneLocAnno/filtered_APApeaks_merged_allchrom_refseqGenes.GeneLocAnno_NoMP_sm_quant.Nuclear.fixed.pheno.fc", header = T, stringsAsFactors = F) %>% separate(chrom, sep = ":", into = c("chr", "start", "end", "id")) %>% separate(id, sep="_", into=c("gene", "strand", "peak"))


write.table(totalPeakUs[,7:dim(totalPeakUs)[2]], file="/project2/gilad/briana/threeprimeseq/data/phenotypes_filtPeakTranscript_noMP_GeneLocAnno/filtered_APApeaks_merged_allchrom_refseqGenes.GeneLocAnno_NoMP_sm_quant.Total.fixed.pheno.CountsOnly",quote=FALSE, col.names = F, row.names = F)

write.table(nuclearPeakUs[,7:dim(nuclearPeakUs)[2]], file="/project2/gilad/briana/threeprimeseq/data/phenotypes_filtPeakTranscript_noMP_GeneLocAnno/filtered_APApeaks_merged_allchrom_refseqGenes.GeneLocAnno_NoMP_sm_quant.Nuclear.fixed.pheno.CountsOnly",quote=FALSE, col.names = F, row.names = F)
convertCount2Numeric_noMP_GeneLocAnno.py
def convert(infile, outfile):
  final=open(outfile, "w")
  for ln in open(infile, "r"):
    line_list=ln.split()
    new_list=[]
    for i in line_list:
      num, dem = i.split("/")
      if dem == "0":
        perc = "0.00"
      else:
        perc = int(num)/int(dem)
        perc=round(perc,2)
        perc= str(perc)
      new_list.append(perc)
    final.write("\t".join(new_list)+ '\n')
  final.close()

convert("/project2/gilad/briana/threeprimeseq/data/phenotypes_filtPeakTranscript_noMP_GeneLocAnno/filtered_APApeaks_merged_allchrom_refseqGenes.GeneLocAnno_NoMP_sm_quant.Total.fixed.pheno.CountsOnly","/project2/gilad/briana/threeprimeseq/data/phenotypes_filtPeakTranscript_noMP_GeneLocAnno/filtered_APApeaks_merged_allchrom_refseqGenes.GeneLocAnno_NoMP_sm_quant.Total.fixed.pheno.CountsOnlyNumeric.txt")


convert("/project2/gilad/briana/threeprimeseq/data/phenotypes_filtPeakTranscript_noMP_GeneLocAnno/filtered_APApeaks_merged_allchrom_refseqGenes.GeneLocAnno_NoMP_sm_quant.Nuclear.fixed.pheno.CountsOnly","/project2/gilad/briana/threeprimeseq/data/phenotypes_filtPeakTranscript_noMP_GeneLocAnno/filtered_APApeaks_merged_allchrom_refseqGenes.GeneLocAnno_NoMP_sm_quant.Nuclear.fixed.pheno.CountsOnlyNumeric.txt")
Pull these into R here so I can filter peaks with 5% and understand how many per gene.
library(workflowr)This is workflowr version 1.1.1
Run ?workflowr for help getting startedlibrary(tidyverse)── Attaching packages ─────────────────────────────────────── tidyverse 1.2.1 ──✔ ggplot2 3.0.0 ✔ purrr 0.2.5
✔ tibble 1.4.2 ✔ dplyr 0.7.6
✔ tidyr 0.8.1 ✔ stringr 1.3.1
✔ readr 1.1.1 ✔ forcats 0.3.0── Conflicts ────────────────────────────────────────── tidyverse_conflicts() ──
✖ dplyr::filter() masks stats::filter()
✖ dplyr::lag() masks stats::lag()library(reshape2)
Attaching package: 'reshape2'The following object is masked from 'package:tidyr':
smithslibrary(cowplot)
Attaching package: 'cowplot'The following object is masked from 'package:ggplot2':
ggsavelibrary(ggpubr)Loading required package: magrittr
Attaching package: 'magrittr'The following object is masked from 'package:purrr':
set_namesThe following object is masked from 'package:tidyr':
extract
Attaching package: 'ggpubr'The following object is masked from 'package:cowplot':
get_legendtotalPeakUs=read.table("../data/PeakUsage_noMP_GeneLocAnno/filtered_APApeaks_merged_allchrom_refseqGenes.GeneLocAnno_NoMP_sm_quant.Total.fixed.pheno.fc", header = T, stringsAsFactors = F) %>% separate(chrom, sep = ":", into = c("chr", "start", "end", "id")) %>% separate(id, sep="_", into=c("gene", "strand", "peak"))Warning: Expected 3 pieces. Additional pieces discarded in 4 rows [13402,
13403, 13404, 101569].nuclearPeakUs=read.table("../data/PeakUsage_noMP_GeneLocAnno/filtered_APApeaks_merged_allchrom_refseqGenes.GeneLocAnno_NoMP_sm_quant.Nuclear.fixed.pheno.fc", header = T, stringsAsFactors = F) %>% separate(chrom, sep = ":", into = c("chr", "start", "end", "id")) %>% separate(id, sep="_", into=c("gene", "strand", "peak"))Warning: Expected 3 pieces. Additional pieces discarded in 4 rows [13402,
13403, 13404, 101569].ind=colnames(totalPeakUs)[7:dim(totalPeakUs)[2]]
totalPeakUs_CountNum=read.table("../data/PeakUsage_noMP_GeneLocAnno/filtered_APApeaks_merged_allchrom_refseqGenes.GeneLocAnno_NoMP_sm_quant.Total.fixed.pheno.CountsOnlyNumeric.txt", col.names = ind)
nuclearPeakUs_CountNum=read.table("../data/PeakUsage_noMP_GeneLocAnno/filtered_APApeaks_merged_allchrom_refseqGenes.GeneLocAnno_NoMP_sm_quant.Nuclear.fixed.pheno.CountsOnlyNumeric.txt", col.names = ind)#numeric with anno
totalPeak=as.data.frame(cbind(totalPeakUs[,1:6], totalPeakUs_CountNum))
nuclearPeak=as.data.frame(cbind(nuclearPeakUs[,1:6], nuclearPeakUs_CountNum))
#mean
totalPeakUs_CountNum_mean=rowMeans(totalPeakUs_CountNum)
nuclearPeakUs_CountNum_mean=rowMeans(nuclearPeakUs_CountNum)
#append mean to anno
TotalPeakUSMean=as.data.frame(cbind(totalPeakUs[,1:6],totalPeakUs_CountNum_mean))
NuclearPeakUSMean=as.data.frame(cbind(nuclearPeakUs[,1:6],nuclearPeakUs_CountNum_mean))Filter on the mean
TotalPeakUSMean_filt=TotalPeakUSMean %>% filter(totalPeakUs_CountNum_mean>=.05) %>% group_by(gene) %>% summarise(Npeaks=n())
totalPeaksPerGene=TotalPeakUSMean_filt %>% group_by(Npeaks) %>% summarise(GenesWithNPeaks=n())


NuclearPeakUSMean_filt=NuclearPeakUSMean %>% filter(nuclearPeakUs_CountNum_mean>=.05) %>% group_by(gene) %>% summarise(Npeaks=n())
nuclearPeaksPerGene=NuclearPeakUSMean_filt %>% group_by(Npeaks) %>% summarise(GenesWithNPeaks=n())
nuclearPeaksPerGene$GenesWithNPeaks=as.integer(nuclearPeaksPerGene$GenesWithNPeaks)
Peak num level
nPeaksBoth=totalPeaksPerGene %>% full_join(nuclearPeaksPerGene, by="Npeaks")
colnames(nPeaksBoth)= c("Peaks", "Total", "Nuclear")
nPeaksBoth$Total= nPeaksBoth$Total %>% replace_na(0)

#melt nPeaksBoth
nPeaksBoth_melt=melt(nPeaksBoth, id.var="Peaks")
colnames(nPeaksBoth_melt)= c("Peaks", "Fraction", "Genes")

#plot
peakUsage5perc=ggplot(nPeaksBoth_melt, aes(x=Peaks, y=Genes, fill=Fraction)) + geom_bar(stat="identity", position = "dodge") + labs(title="Number of Genes with >5% Peak Usage \n cleaned for mispriming") + theme(axis.text.y = element_text(size=12),axis.title.y=element_text(size=10,face="bold"), axis.title.x=element_text(size=12,face="bold"))+ scale_fill_manual(values=c("darkviolet","deepskyblue3"))  + facet_grid(~Fraction)

peakUsage5perc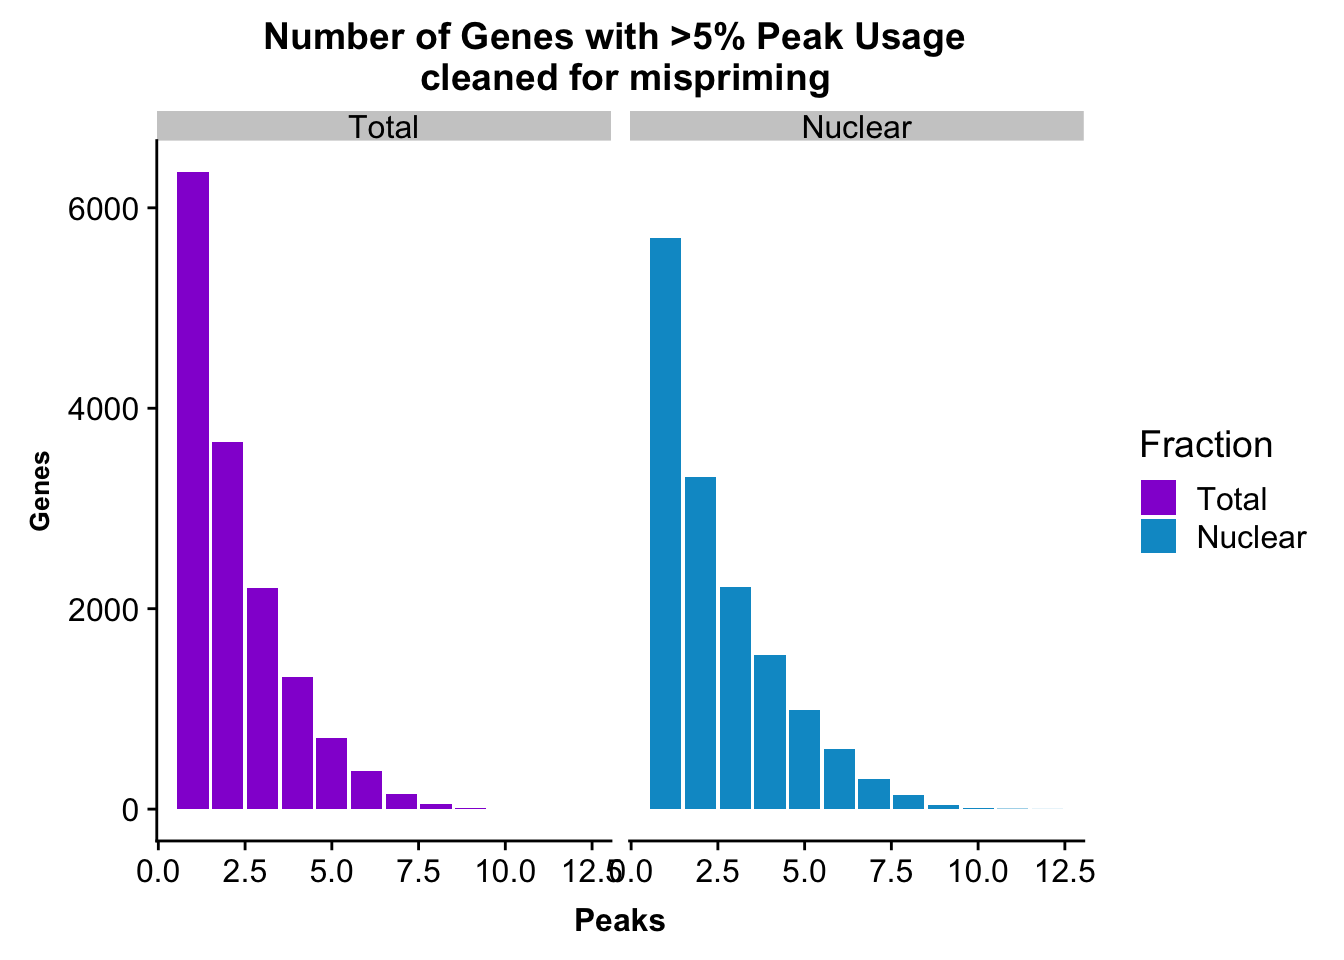
Expand here to see past versions of unnamed-chunk-20-1.png:
| Version | Author | Date |
|---|---|---|
| 2701515 | Briana Mittleman | 2019-01-29 |
This is a similar distribution to the other annotations.
Save this plot:
ggsave(peakUsage5perc, file="../output/plots/QC_plots/peakUsage5perc_noMP_geneLocAnno.png")Saving 7 x 5 in imageGenes covered with these annoations.
#nuclear
nrow(NuclearPeakUSMean_filt)
[1] 14851#total
nrow(TotalPeakUSMean_filt) [1] 14852There are more genes in this. We expect this because i have included LINCs.
Look at number of peaks in each set.
#nuclear
NuclearPeakUSMean %>% filter(nuclearPeakUs_CountNum_mean>=.05) %>% nrow()
[1] 37370#total
TotalPeakUSMean %>% filter(totalPeakUs_CountNum_mean>=.05) %>% nrow()[1] 33002There are a few less peaks. This is expected give we cut 15% of the peaks because they are not within 5kb of an annotated gene.
Write out these peaks
NuclearPeakUSMean_5perc=NuclearPeakUSMean %>% filter(nuclearPeakUs_CountNum_mean>=.05)
write.table(NuclearPeakUSMean_5perc,file="../data/PeakUsage_noMP_GeneLocAnno/filtered_APApeaks_merged_allchrom_refseqGenes.GeneLocAnno.NoMP_sm_quant.Nuclear_fixed.pheno.5percPeaks.txt", row.names=F, col.names=F, quote = F)


TotalPeakUSMean_5per= TotalPeakUSMean %>% filter(totalPeakUs_CountNum_mean>=.05)
write.table(TotalPeakUSMean_5per,file="../data/PeakUsage_noMP_GeneLocAnno/filtered_APApeaks_merged_allchrom_refseqGenes.GeneLocAnno.NoMP_sm_quant.Total_fixed.pheno.5percPeaks.txt", row.names=F, col.names=F, quote = F)
I want to filter these peaks so I can rerun the leafcutter analysis and look at some of the results. I transfered these to /project2/gilad/briana/threeprimeseq/data/phenotypes_filtPeakTranscript_noMP_GeneLocAnno/.
filterPheno_bothFraction_GeneLocAnno_5perc.py
#python

totalokPeaks5perc_file="/project2/gilad/briana/threeprimeseq/data/phenotypes_filtPeakTranscript_noMP_GeneLocAnno/filtered_APApeaks_merged_allchrom_refseqGenes.GeneLocAnno.NoMP_sm_quant.Total_fixed.pheno.5percPeaks.txt"

totalokPeaks5perc={}
for ln in open(totalokPeaks5perc_file,"r"):
    peakname=ln.split()[5]
    totalokPeaks5perc[peakname]=""


nuclearokPeaks5perc_file="/project2/gilad/briana/threeprimeseq/data/phenotypes_filtPeakTranscript_noMP_GeneLocAnno/filtered_APApeaks_merged_allchrom_refseqGenes.GeneLocAnno.NoMP_sm_quant.Nuclear_fixed.pheno.5percPeaks.txt"
nuclearokPeaks5perc={}
for ln in open(nuclearokPeaks5perc_file,"r"):
    peakname=ln.split()[5]
    nuclearokPeaks5perc[peakname]=""


totalPhenoBefore=open("/project2/gilad/briana/threeprimeseq/data/phenotypes_filtPeakTranscript_noMP_GeneLocAnno/filtered_APApeaks_merged_allchrom_refseqGenes.GeneLocAnno_NoMP_sm_quant.Total.fixed.pheno.fc","r")
totalPhenoAfter=open("/project2/gilad/briana/threeprimeseq/data/phenotypes_filtPeakTranscript_noMP_GeneLocAnno_5percUs/filtered_APApeaks_merged_allchrom_refseqGenes.GeneLocAnno_NoMP_sm_quant.Total.fixed.pheno_5perc.fc", "w")
for num, ln in enumerate(totalPhenoBefore):
    if num ==0:
        totalPhenoAfter.write(ln)
    else:
        id=ln.split()[0].split(":")[3].split("_")[2]
        if id in totalokPeaks5perc.keys():
            totalPhenoAfter.write(ln)
totalPhenoAfter.close()

nuclearPhenoBefore=open("/project2/gilad/briana/threeprimeseq/data/phenotypes_filtPeakTranscript_noMP_GeneLocAnno/filtered_APApeaks_merged_allchrom_refseqGenes.GeneLocAnno_NoMP_sm_quant.Nuclear.fixed.pheno.fc","r")
nuclearPhenoAfter=open("/project2/gilad/briana/threeprimeseq/data/phenotypes_filtPeakTranscript_noMP_GeneLocAnno_5percUs/filtered_APApeaks_merged_allchrom_refseqGenes.GeneLocAnno_NoMP_sm_quant.Nuclear.fixed.pheno_5perc.fc", "w")
for num, ln in enumerate(nuclearPhenoBefore):
    if num ==0:
        nuclearPhenoAfter.write(ln)
    else:
        id=ln.split()[0].split(":")[3].split("_")[2]
        if id in nuclearokPeaks5perc.keys():
            nuclearPhenoAfter.write(ln)
nuclearPhenoAfter.close()
Diff Iso in leafcutter
Now I can use these peaks to get counts for leafcutter.
I want a file that will have the peaks from total or nuclear.
I am starting here with the SAF file
filternamePeaks5percCov_GeneLocAnno.py
assignedPeaks=open("/project2/gilad/briana/threeprimeseq/data/mergedPeaks_noMP_GeneLoc/Filtered_APApeaks_merged_allchrom_noMP.sort.named.noCHR_geneLocParsed.SAF","r")
outFile=open("/project2/gilad/briana/threeprimeseq/data/mergedPeaks_noMP_GeneLoc/Filtered_APApeaks_merged_allchrom_noMP.sort.named.noCHR_geneLocParsed.5percCov.SAF", "w")

totalokPeaks5perc_file="/project2/gilad/briana/threeprimeseq/data/phenotypes_filtPeakTranscript_noMP_GeneLocAnno/filtered_APApeaks_merged_allchrom_refseqGenes.GeneLocAnno.NoMP_sm_quant.Total_fixed.pheno.5percPeaks.txt"
nuclearokPeaks5perc_file="/project2/gilad/briana/threeprimeseq/data/phenotypes_filtPeakTranscript_noMP_GeneLocAnno/filtered_APApeaks_merged_allchrom_refseqGenes.GeneLocAnno.NoMP_sm_quant.Nuclear_fixed.pheno.5percPeaks.txt"

allPeakOk={}
for ln in open(nuclearokPeaks5perc_file,"r"):
    peakname=ln.split()[5]
    peaknum=peakname[4:]
    allPeakOk[peaknum]=""
for ln in open(totalokPeaks5perc_file,"r"):
    peakname=ln.split()[5]
    peaknum=peakname[4:]
    if peaknum not in allPeakOk.keys():
        allPeakOk[peaknum]=""

for i, ln in enumerate(assignedPeaks):
    if i == 0:
        outFile.write(ln)
    else:
        ID=ln.split()[0]
        peak=ID.split(":")[0]
        peak_num=peak[4:]
        if peak_num in allPeakOk.keys():
             outFile.write(ln)
outFile.close()
Now I will run feature counts, remembering that i want to look at the same strand as the peaks.
bothFrac_processed_GeneLocAnno_FC.sh
#!/bin/bash

#SBATCH --job-name=bothFrac_processed_GeneLocAnno_FC
#SBATCH --account=pi-yangili1
#SBATCH --time=24:00:00
#SBATCH --output=bothFrac_processed_GeneLocAnno_FC.out
#SBATCH --error=bothFrac_processed_GeneLocAnno_FC.err
#SBATCH --partition=broadwl
#SBATCH --mem=12G
#SBATCH --mail-type=END

module load Anaconda3
source activate three-prime-env


featureCounts -O -a /project2/gilad/briana/threeprimeseq/data/mergedPeaks_noMP_GeneLoc/Filtered_APApeaks_merged_allchrom_noMP.sort.named.noCHR_geneLocParsed.5percCov.SAF -F SAF -o /project2/gilad/briana/threeprimeseq/data/filtPeakOppstrand_cov_processed_GeneLocAnno_bothFrac/filtered_APApeaks_merged_allchrom_refseqGenes.GeneLocAnno_sm_quant_processed.fc /project2/gilad/briana/threeprimeseq/data/bam_NoMP_sort/*sort.bam -s 1
Fix header for this:
fix_head_fc_procBothFrac_GeneLocAnno.py
#python

infile= open("/project2/gilad/briana/threeprimeseq/data/filtPeakOppstrand_cov_processed_GeneLocAnno_bothFrac/filtered_APApeaks_merged_allchrom_refseqGenes.GeneLocAnno_sm_quant_processed.fc", "r")
fout = open("/project2/gilad/briana/threeprimeseq/data/filtPeakOppstrand_cov_processed_GeneLocAnno_bothFrac/filtered_APApeaks_merged_allchrom_refseqGenes.GeneLocAnno_sm_quant_processed_fixed.fc",'w')
for line, i in enumerate(infile):
    if line == 1:
        i_list=i.split()
        libraries = i_list[:6]
        print(libraries)
        for sample in i_list[6:]:
            full = sample.split("/")[7]
            samp= full.split("-")[2:4]
            lim="_"
            samp_st=lim.join(samp)
            libraries.append(samp_st)
        first_line= "\t".join(libraries)
        fout.write(first_line + '\n')
    else :
        fout.write(i)
fout.close()
fc2leafphen_processed_GeneLocAnno.py
inFile= open("/project2/gilad/briana/threeprimeseq/data/filtPeakOppstrand_cov_processed_GeneLocAnno_bothFrac/filtered_APApeaks_merged_allchrom_refseqGenes.GeneLocAnno_sm_quant_processed_fixed.fc", "r")
outFile= open("/project2/gilad/briana/threeprimeseq/data/pheno_DiffIso_processed_GeneLocAnno/filtered_APApeaks_merged_allchrom_refseqGenes.GeneLocAnno_sm_quant_processed_forLC.fc", "w")

for num, ln in enumerate(inFile):
        if num == 1:
            lines=ln.split()[6:]
            outFile.write(" ".join(lines)+'\n')
        if num > 1:
            ID=ln.split()[0]
            peak=ID.split(":")[0]
            chrom=ID.split(":")[1]
            start=ID.split(":")[2]
            start=int(start)
            end=ID.split(":")[3]
            end=int(end)
            strand=ID.split(":")[4]
            gene=ID.split(":")[5]
            new_ID="chr%s:%d:%d:%s"%(chrom, start, end, gene)
            pheno=ln.split()[6:]
            pheno.insert(0, new_ID)
            outFile.write(" ".join(pheno)+'\n')

outFile.close()
subset_diffisopheno_processed_GeneLocAnno.py
def main(inFile, outFile, target):
    ifile=open(inFile, "r")
    ofile=open(outFile, "w")
    target=int(target)
    for num, ln in enumerate(ifile):
        if num == 0:
            ofile.write(ln)
        else:
            ID=ln.split()[0]
            chrom=ID.split(":")[0][3:]
            print(chrom)
            chrom=int(chrom)
            if chrom == target:
                ofile.write(ln)

if __name__ == "__main__":
    import sys

    target = sys.argv[1]
    inFile = "/project2/gilad/briana/threeprimeseq/data/pheno_DiffIso_processed_GeneLocAnno/filtered_APApeaks_merged_allchrom_refseqGenes.GeneLocAnno_sm_quant_processed_forLC.fc"
    outFile = "/project2/gilad/briana/threeprimeseq/data/pheno_DiffIso_processed_GeneLocAnno/filtered_APApeaks_merged_allchrom_refseqGenes.GeneLocAnno_sm_quant_processed_forLC_%s.txt"%(target)
    main(inFile, outFile, target)
run_subset_diffisopheno_processed_GeneLocAnno.sh
#!/bin/bash

#SBATCH --job-name=run_subset_diffisopheno_processed_GeneLocAnno
#SBATCH --account=pi-yangili1
#SBATCH --time=24:00:00
#SBATCH --output=run_subset_diffisopheno_processed_GeneLocAnno.out
#SBATCH --error=run_subset_diffisopheno_processed_GeneLocAnno.err
#SBATCH --partition=broadwl
#SBATCH --mem=12G
#SBATCH --mail-type=END

module load Anaconda3
source activate three-prime-env

for i in 1 2 3 4 5 6 7 8 9 10 11 12 13 14 15 16 17 18 19 20 21 22
do
python subset_diffisopheno_processed_GeneLocAnno.py  $i
done
makeLCSampleList_processed_GeneLocAnno.py
outfile=open("/project2/gilad/briana/threeprimeseq/data/pheno_DiffIso_processed_GeneLocAnno/sample_groups.txt", "w")
infile=open("/project2/gilad/briana/threeprimeseq/data/filtPeakOppstrand_cov_processed_GeneLocAnno_bothFrac/filtered_APApeaks_merged_allchrom_refseqGenes.GeneLocAnno_sm_quant_processed.fc", "r")

for line, i in enumerate(infile):
    if line == 1:
        i_list=i.split()
        libraries=[]
        for sample in i_list[6:]:
            full = sample.split("/")[7]
            samp= full.split("-")[2:4]
            lim="_"
            samp_st=lim.join(samp)
            libraries.append(samp_st)
        for l in libraries:
            if l[-1] == "T":
                outfile.write("%s\tTotal\n"%(l))
            else:
                outfile.write("%s\tNuclear\n"%(l))
    else:
          next

outfile.close()
run_leafcutter_ds_bychrom_processed_GeneLocAnno.sh
#!/bin/bash

#SBATCH --job-name=run_leafcutter_ds_bychrom_processed_GeneLocAnno
#SBATCH --account=pi-yangili1
#SBATCH --time=24:00:00
#SBATCH --output=run_leafcutter_ds_bychrom_processed_GeneLocAnno.out
#SBATCH --error=run_leafcutter_ds_bychrom_processed_GeneLocAnno.err
#SBATCH --partition=bigmem2
#SBATCH --mem=50G
#SBATCH --mail-type=END

module load R

for i in 1 2 3 4 5 6 7 8 9 10 11 12 13 14 15 16 17 18 19 20 21 22
do
Rscript /project2/gilad/briana/davidaknowles-leafcutter-c3d9474/scripts/leafcutter_ds.R --num_threads 4  /project2/gilad/briana/threeprimeseq/data/pheno_DiffIso_processed_GeneLocAnno/filtered_APApeaks_merged_allchrom_refseqGenes.GeneLocAnno_sm_quant_processed_forLC_${i}.txt /project2/gilad/briana/threeprimeseq/data/pheno_DiffIso_processed_GeneLocAnno/sample_groups.txt -o /project2/gilad/briana/threeprimeseq/data/diff_iso_processed_GeneLocAnno/TN_diff_isoform_GeneLocAnno_chr${i}.txt
done
awk '{if(NR>1)print}' /project2/gilad/briana/threeprimeseq/data/diff_iso_processed_GeneLocAnno/TN_diff_isoform_GeneLocAnno_chr*.txt_effect_sizes.txt > /project2/gilad/briana/threeprimeseq/data/diff_iso_processed_GeneLocAnno/TN_diff_isoform_GeneLocAnno_AllChrom.txt_effect_sizes.txt
awk '{if(NR>1)print}' /project2/gilad/briana/threeprimeseq/data/diff_iso_processed_GeneLocAnno/TN_diff_isoform_GeneLocAnno_chr*cluster_significance.txt > /project2/gilad/briana/threeprimeseq/data/diff_iso_processed_GeneLocAnno/TN_diff_isoform_GeneLocAnno_AllChrom.txt_cluster_significance.txtLook at the significant peaks
diffIso=read.table("../data/diff_iso_GeneLocAnno/TN_diff_isoform_GeneLocAnno_AllChrom.txt_cluster_significance.txt", header = F,col.names = c("status",   "loglr",    "df",   "p",    "cluster",  "p.adjust"),stringsAsFactors = F,sep="\t") %>% filter(status == "Success")


diffIso$p.adjust=as.numeric(as.character(diffIso$p.adjust))


qqplot(-log10(runif(nrow(diffIso))), -log10(diffIso$p.adjust),ylab="-log10 Total Adjusted Leafcutter pvalue", xlab="-log 10 Uniform expectation", main="Leafcutter differencial isoform analysis between fractions")
abline(0,1)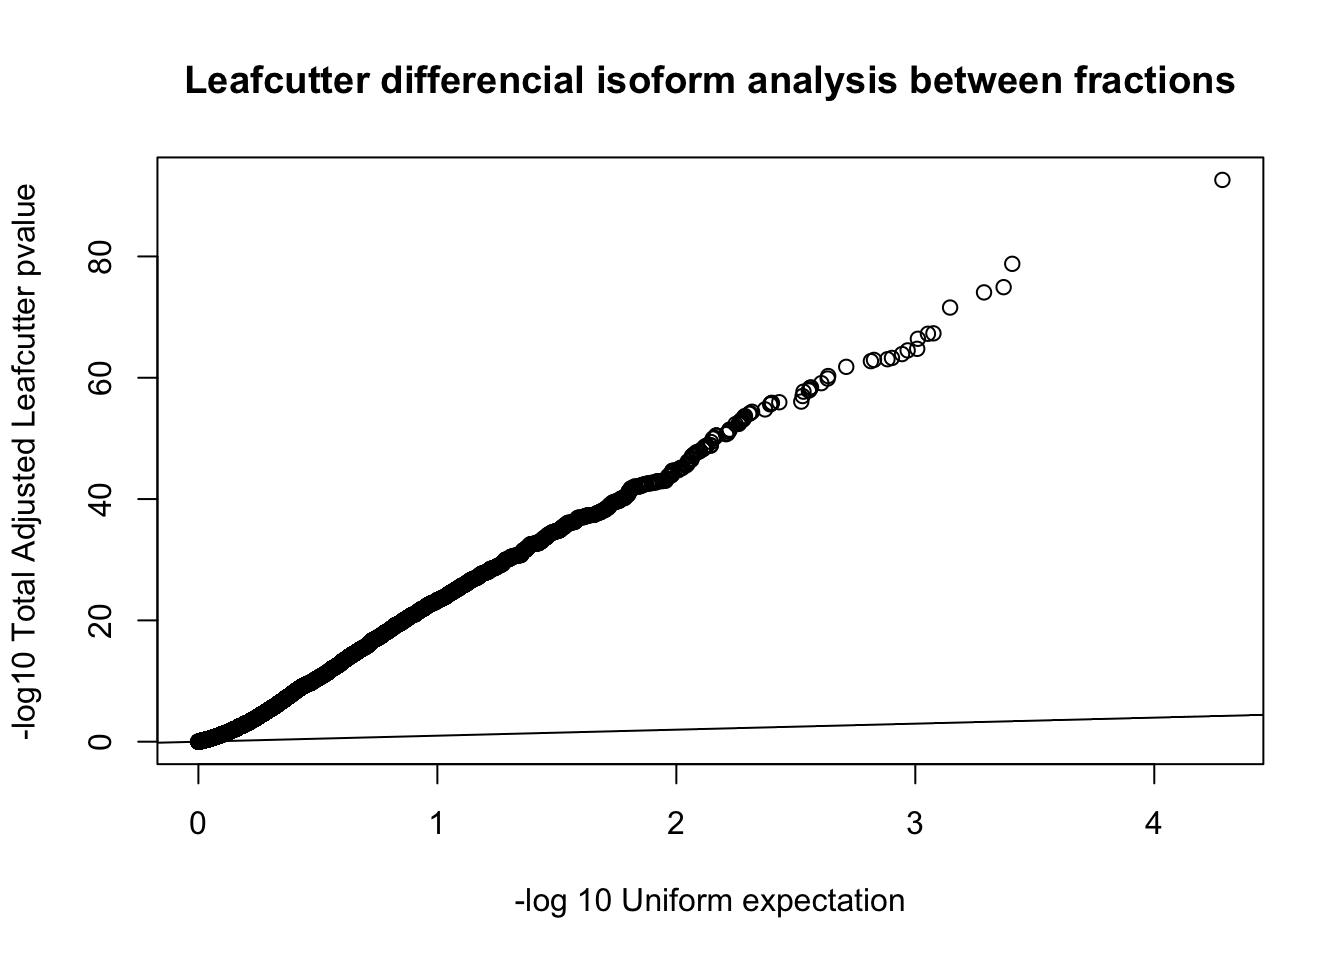
Expand here to see past versions of unnamed-chunk-35-1.png:
| Version | Author | Date |
|---|---|---|
| 1def3fb | Briana Mittleman | 2019-01-29 |
Look at the effect sizes and delta PSI values
effectsize=read.table("../data/diff_iso_GeneLocAnno/TN_diff_isoform_GeneLocAnno_AllChrom.txt_effect_sizes.txt", stringsAsFactors = F, col.names=c('intron',  'logef' ,'Nuclear', 'Total','deltapsi'))

effectsize$deltapsi=as.numeric(as.character(effectsize$deltapsi))
Warning: NAs introduced by coercionplot(sort(effectsize$deltapsi),main="Leafcutter delta PSI", ylab="Delta PSI", xlab="Peak Index")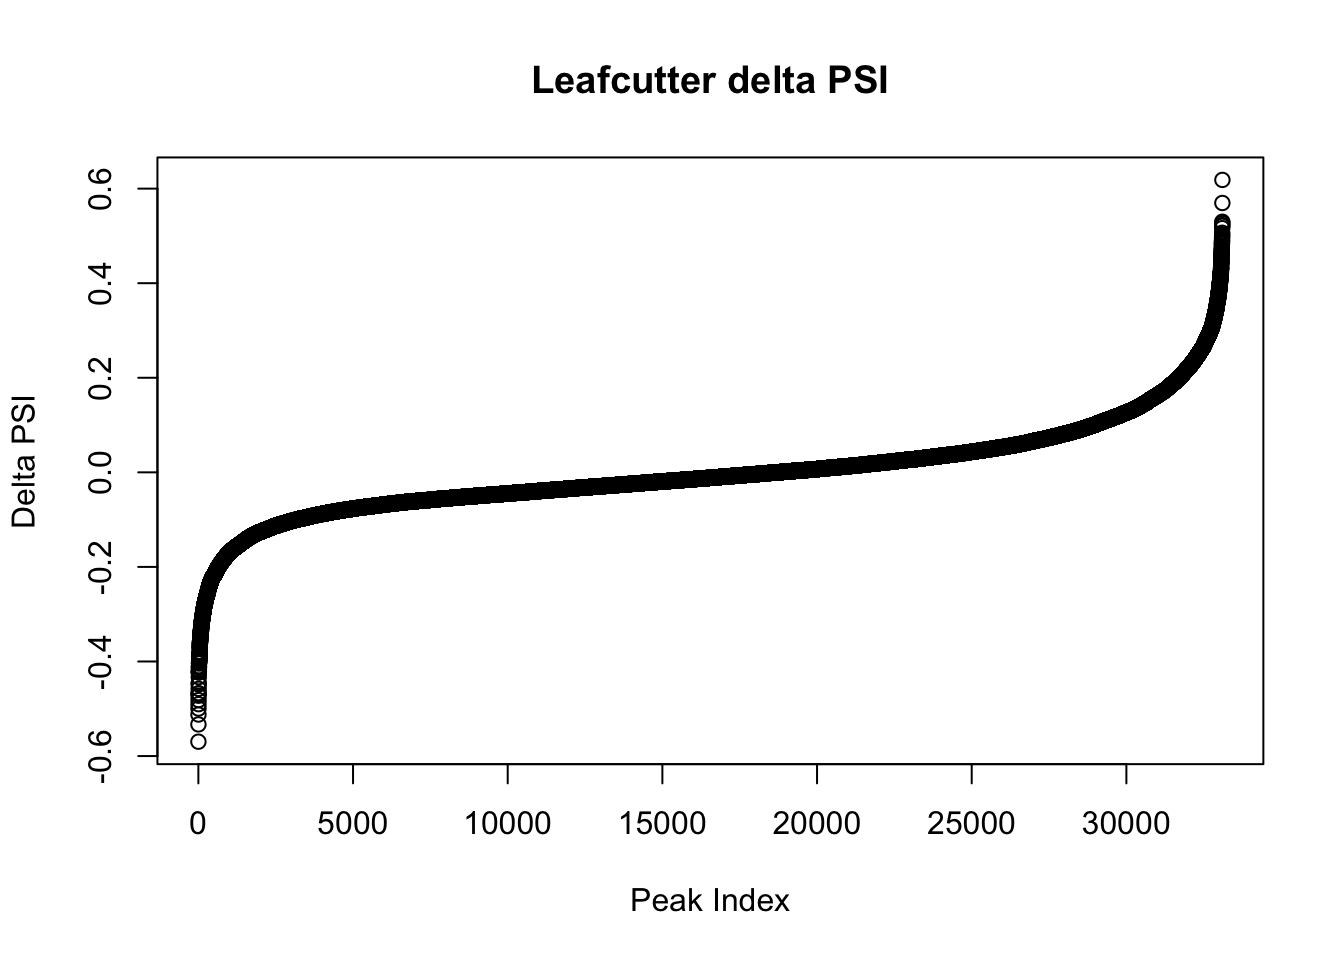
Expand here to see past versions of unnamed-chunk-36-1.png:
| Version | Author | Date |
|---|---|---|
| 1def3fb | Briana Mittleman | 2019-01-29 |
I will look at the top PSI values to check these assignments:
filterHighPSI=effectsize %>% filter(abs(deltapsi)>.4) %>% arrange(deltapsi)
slice(filterHighPSI, 1:10)
intron logef Nuclear
1 chr20:58647920:58648008:C20orf197 -1.30029968847689 0.75961199274038
2 chr16:81123538:81123627:GCSH -1.74065267433486 0.670469380269928
3 chr6:84007319:84007404:ME1 -1.78018772633575 0.606503443795698
4 chr3:60357325:60357413:FHIT -1.26667104228337 0.610069267936541
5 chr19:36806427:36806515:LINC00665 -1.07992220081782 0.777431269442217
6 chr5:158459560:158459648:EBF1 -1.42831987542981 0.748019907501062
7 chr14:51976014:51976057:FRMD6 -1.78704520971336 0.547050860607198
8 chr7:147596894:147596932:CNTNAP2 -0.774209465545986 0.705908150746242
9 chr9:86581185:86581267:MIR7-1 -1.06118532400755 0.8197624679828
10 chr9:131123419:131123501:SLC27A4 -0.785767406518831 0.78532017459677
Total deltapsi
1 0.189994498257158 -0.5696175
2 0.137387545557619 -0.5330818
3 0.094302459218906 -0.5122010
4 0.110490691620035 -0.4995786
5 0.287187087245474 -0.4902442
6 0.266472225627269 -0.4815477
7 0.0746333216691989 -0.4724175
8 0.238177555374367 -0.4677306
9 0.352599645113899 -0.4671628
10 0.327502618698554 -0.4578176Files to make: -bed file with all 5% peaks (named with gene)
Convert Filtered_APApeaks_merged_allchrom_noMP.sort.named.noCHR_geneLocParsed.5percCov.SAF to a bed file
Chrom, start, end, name, score, strand
peaksGeneLocAnno_5percSAF2Bed.py
inFile="/project2/gilad/briana/threeprimeseq/data/mergedPeaks_noMP_GeneLoc/Filtered_APApeaks_merged_allchrom_noMP.sort.named.noCHR_geneLocParsed.5percCov.SAF"
outFile=open("/project2/gilad/briana/threeprimeseq/data/mergedPeaks_noMP_GeneLoc/Filtered_APApeaks_merged_allchrom_noMP.sort.named.noCHR_geneLocParsed.5percCov.bed", "w")

for i, ln in enumerate(inFile):
  if i >0:
     ID, chrom, start, end, strand = ln.split()
     gene=ID.split(":")[5]
     peaknum=ID.split(:)[0]
     newID=gene + ":"+ peaknum
     start_i=int(start)
     end_i=int(end)
     score="."
     outFile.write("%s\t%d\t%d\t%s\t%s\t%s\n"%(chrom, start_i, end_i, newID, score, strand))
outFile.close()
Evaluate top differences
- C20orf197
peak72985 - in the three prime UTR
total:0.08948718 nuclear: 0.3607692
the other peak is peak72984 - first exon of the gene
total: 0.39769231 nuclear: 0.1264103
- GCSH:
Total has 3 peaks and nuclear has 2 used at 5%.
peak46139- internal intron peak
Total:0.15743590 Nuclear: 0.6787179
The other common peak is peak46138 and is in the 3’ UTR Total: 0.73333333 Nuclear: 0.2943590
- ME1
chr6:84007319:84007404-peak 102432 - intronic peak
Total:0.09307692
Nuclear: 0.54974359
There are 2 more peaks for this gene. They are in the 3’ UTR
peak 102430- distal
Total:0.31794872 Nuclear:0.17230769
peak 102431 - proximal
Total: 0.43512821
Nuclear: 0.20179487
- FHIT
Total and nuclear use different peaks and only have 1 with over 5%.
Total: peak79937 (0.2492308) - in the 3’ UTR
Nucelar: peak79975- (0.0574359) intronic
There is a lot of coverage in this gene. Many low used peaks that are mostly noise.
- LINC00665
peak57872 -last Intron Total: 0.2538462
Nuclear: 0.7361538
peak57873 upstream intron
total: 0.5923077 Nuclear: 0.2382051
This means the nuclear is the longer version.
- EBF1
peak97306 - intronic
Total: 0.07538462
Nuclear: 0.1443590
This is the only peak used at 5% in nuclear. The total also has usage for 2 3’UTR peaks. peak97237-distal- 0.08512821 peak97240- prox- 0.13358974
this shows there is a lot of noise peaks in this gene
FRMD6 This is confusing because the genes FRMD6 and FRMD6-AS1 and FRMD6-AS2 overlap.
CNTNAP2
peak111687- Intronic Total: 0.2510256 Nuclear: 0.72102564
Most used total peak is peak111684. This peak is upstream in another intron
Total: 0.7371795
Nuclear: 0.22769231
Looks like nuclear uses the longer version here
MIR7-1 Not that much coverage in this location for the RNA, not sure I trust this
SLC27A4
peak121617 3’ UTR of gene
Total: 0.3171795 Nuclear: 0.72923077
Most used total peak is peak121616 total: 0.6269231
nuclear: 0.14461538
This is in the first intron
Looks like the longer version is the nuclear again.
Evaluate mid level differences
filtermidPSI=effectsize %>% filter(abs(deltapsi)>.1,  abs(deltapsi)<.2 ) %>% arrange(desc(deltapsi))
slice(filtermidPSI, 1:15)
intron logef Nuclear
1 chr12:8397823:8397909:LOC101927905 0.448461429949208 0.250725451684143
2 chr1:219385083:219385168:LYPLAL1 0.954954667285417 0.47522506522198
3 chr21:16333556:16333644:NRIP1 0.836443235134216 0.351219846182051
4 chr15:37102357:37102448:C15orf41 1.47799526856201 0.0446234385277765
5 chr3:57611182:57611269:DENND6A 1.06294476937985 0.647880789005199
6 chr13:41493162:41493319:TPTE2P5 1.02758163936723 0.120932187018109
7 chr16:70514471:70514557:COG4 0.966111688983429 0.71445630320153
8 chr16:58741035:58741118:GOT2 1.18588583796077 0.773862280159172
9 chr6:10756725:10757026:TMEM14B 0.602233504297137 0.500765966416333
10 chr11:94153032:94153131:MRE11 0.459564470994093 0.329029417246997
11 chr20:42275772:42275861:IFT52 1.06151089956002 0.765140743199829
12 chr7:75162621:75162703:HIP1 0.740637787039692 0.659230309804744
13 chr20:18364013:18364097:DZANK1 0.821963077144347 0.502350766672134
14 chr4:185308878:185308968:IRF2 0.618692449311092 0.244938382583888
15 chr1:200520630:200520714:KIF14 0.679726537109473 0.559096573104719
Total deltapsi
1 0.45070463537782 0.1999792
2 0.675186030796747 0.1999610
3 0.551128323720684 0.1999085
4 0.244503990743873 0.1998806
5 0.847659137175468 0.1997783
6 0.320706102127373 0.1997739
7 0.914220776425143 0.1997645
8 0.973455289793462 0.1995930
9 0.700276572781718 0.1995106
10 0.528529300729028 0.1994999
11 0.964569032134389 0.1994283
12 0.858643155030094 0.1994128
13 0.701691505947061 0.1993407
14 0.444264508262277 0.1993261
15 0.758376508386949 0.1992799- LOC101927905- not a great example because this is not a protein coding gene.
peak23703
Total: 0.2471795 Nuclear: 0.1784615
- LYPLAL1
Peak 10544- Proximal 3’ UTR peak
Total:0.60000000 Nuclear: 0.38487179
Peak 10545 - distal 3’ UTR
Total:0.21615385 Nuclear: 0.21564103
Nuclear uses 2 peaks in the second to last intron of the gene.
- NRIP1
peak77305 3’ UTR
total:0.57333333 nuclear:0.32076923
Nuclear fraction has an internal peak used at 0.2800000 that is not used in total
C15orf41- looked at this gene prior
DENND6A
Peak79852 - 3’ UTR of the gene (most distal) Total:0.80897436 Nuclear:0.60512821
Other 3’ UTR peak is 79853
Total:0.07769231 Nucelar 0.06512821
Nuclear has 3 extra internal peaks used at at least 5%
TPTE2P5 peak31262 one of the first introns of a long gene. This part of the gene overlaps with SUGT1P3
total:0.27897436 nuclear: 0.10025641COG4 peak45747- 3; UTR peak
total:0.9135897 nuclear: 0.71179487
Total has one more peak in an intron- 45748
total:0.0700000 nuclear:0.22974359
Other nucelar peak is peak45749 at 0.05897436
Example of internal peak usage in nuclear
- GOT2 Peak 45272 3’ UTR
Total:0.9528205 Nuclear: 0.7635897
Other peak used in nuclear is in second to last intron
Peak 45274- nuclear 0.2307692
internal peak usage in nuclear
- TMEM14B
Peak 98769 first 3’ UTR of the gene (this gene has 2 transcripts with 2 different 3’ UTRs. looks like this is the only one we get usage for) Total:0.6343590 Nuclear: 0.49512821
Peal98768 is only used in the nuclear at 5% or above- it is used at 0.22743590
This means we get internal 3’ in this for the nuclear.
- MRE11
peak 21611 3’ UTR peak
Total: 0.47102564 nuclear: 0.27512821
There is a run on peak in both as well (beyond annotated UTR)
peak 21608 Total: 0.35230769 nucelar: 0.52256410
The other used peak for both fractions is 21616 and is <10% in both
- IFT52
peak 72169- 3’ UTR (only total peak) total:0.9548718 nucelar: 0.7610256
Other nuclear peak:
peak 72168 in an intron
nuclear: 0.2133333
Example of internal stopage in nuclear
- HIP1
peak 108486 3’ UTR total: 0.83794872 nuclear 0.6253846
More internal peak usage in nuclear
- DZANK1
Peak 71173 - 3’ UTR
total:0.66358974 nuclear: 0.52717949
5 other peaks in nuclear, 3 other in total.
- IRF2
peak 90870
total: 0.39051282 nuclear: 0.18538462
the nuclear fraction uses peak90889 at 0.29025641. this is in the first intron on the gene
- KIF14
peak9668 3’ UTR
total:0.65743590 nuclear:0.5341026
Total actually has one extra peak used here. This is only about 5%.
Other peaks:
peak9674- second intron total: 0.07692308 nuclear: 0.1538462
peak9671-intronic
total:0.11615385 nuclear: 0.1779487
Here is looks like more internal peaks in nuclear.
Session information
sessionInfo()R version 3.5.1 (2018-07-02)
Platform: x86_64-apple-darwin15.6.0 (64-bit)
Running under: macOS 10.14.1
Matrix products: default
BLAS: /Library/Frameworks/R.framework/Versions/3.5/Resources/lib/libRblas.0.dylib
LAPACK: /Library/Frameworks/R.framework/Versions/3.5/Resources/lib/libRlapack.dylib
locale:
[1] en_US.UTF-8/en_US.UTF-8/en_US.UTF-8/C/en_US.UTF-8/en_US.UTF-8
attached base packages:
[1] stats graphics grDevices utils datasets methods base
other attached packages:
[1] bindrcpp_0.2.2 ggpubr_0.1.8 magrittr_1.5 cowplot_0.9.3
[5] reshape2_1.4.3 forcats_0.3.0 stringr_1.3.1 dplyr_0.7.6
[9] purrr_0.2.5 readr_1.1.1 tidyr_0.8.1 tibble_1.4.2
[13] ggplot2_3.0.0 tidyverse_1.2.1 workflowr_1.1.1
loaded via a namespace (and not attached):
[1] tidyselect_0.2.4 haven_1.1.2 lattice_0.20-35
[4] colorspace_1.3-2 htmltools_0.3.6 yaml_2.2.0
[7] rlang_0.2.2 R.oo_1.22.0 pillar_1.3.0
[10] glue_1.3.0 withr_2.1.2 R.utils_2.7.0
[13] modelr_0.1.2 readxl_1.1.0 bindr_0.1.1
[16] plyr_1.8.4 munsell_0.5.0 gtable_0.2.0
[19] cellranger_1.1.0 rvest_0.3.2 R.methodsS3_1.7.1
[22] evaluate_0.11 labeling_0.3 knitr_1.20
[25] broom_0.5.0 Rcpp_0.12.19 scales_1.0.0
[28] backports_1.1.2 jsonlite_1.5 hms_0.4.2
[31] digest_0.6.17 stringi_1.2.4 grid_3.5.1
[34] rprojroot_1.3-2 cli_1.0.1 tools_3.5.1
[37] lazyeval_0.2.1 crayon_1.3.4 whisker_0.3-2
[40] pkgconfig_2.0.2 xml2_1.2.0 lubridate_1.7.4
[43] assertthat_0.2.0 rmarkdown_1.10 httr_1.3.1
[46] rstudioapi_0.8 R6_2.3.0 nlme_3.1-137
[49] git2r_0.23.0 compiler_3.5.1
This reproducible R Markdown analysis was created with workflowr 1.1.1