LocusZoom Plot
Briana Mittleman
11/15/2018
Last updated: 2018-11-15
workflowr checks: (Click a bullet for more information)-
✔ R Markdown file: up-to-date
Great! Since the R Markdown file has been committed to the Git repository, you know the exact version of the code that produced these results.
-
✔ Environment: empty
Great job! The global environment was empty. Objects defined in the global environment can affect the analysis in your R Markdown file in unknown ways. For reproduciblity it’s best to always run the code in an empty environment.
-
✔ Seed:
set.seed(12345)The command
set.seed(12345)was run prior to running the code in the R Markdown file. Setting a seed ensures that any results that rely on randomness, e.g. subsampling or permutations, are reproducible. -
✔ Session information: recorded
Great job! Recording the operating system, R version, and package versions is critical for reproducibility.
-
Great! You are using Git for version control. Tracking code development and connecting the code version to the results is critical for reproducibility. The version displayed above was the version of the Git repository at the time these results were generated.✔ Repository version: 23c62c9
Note that you need to be careful to ensure that all relevant files for the analysis have been committed to Git prior to generating the results (you can usewflow_publishorwflow_git_commit). workflowr only checks the R Markdown file, but you know if there are other scripts or data files that it depends on. Below is the status of the Git repository when the results were generated:
Note that any generated files, e.g. HTML, png, CSS, etc., are not included in this status report because it is ok for generated content to have uncommitted changes.Ignored files: Ignored: .DS_Store Ignored: .Rhistory Ignored: .Rproj.user/ Ignored: data/.DS_Store Ignored: output/.DS_Store Untracked files: Untracked: KalistoAbundance18486.txt Untracked: analysis/ncbiRefSeq_sm.sort.mRNA.bed Untracked: analysis/snake.config.notes.Rmd Untracked: analysis/verifyBAM.Rmd Untracked: data/18486.genecov.txt Untracked: data/APApeaksYL.total.inbrain.bed Untracked: data/ChromHmmOverlap/ Untracked: data/GM12878.chromHMM.bed Untracked: data/GM12878.chromHMM.txt Untracked: data/LocusZoom/ Untracked: data/NuclearApaQTLs.txt Untracked: data/PeaksUsed/ Untracked: data/RNAkalisto/ Untracked: data/TotalApaQTLs.txt Untracked: data/Totalpeaks_filtered_clean.bed Untracked: data/YL-SP-18486-T-combined-genecov.txt Untracked: data/YL-SP-18486-T_S9_R1_001-genecov.txt Untracked: data/apaExamp/ Untracked: data/bedgraph_peaks/ Untracked: data/bin200.5.T.nuccov.bed Untracked: data/bin200.Anuccov.bed Untracked: data/bin200.nuccov.bed Untracked: data/clean_peaks/ Untracked: data/comb_map_stats.csv Untracked: data/comb_map_stats.xlsx Untracked: data/comb_map_stats_39ind.csv Untracked: data/combined_reads_mapped_three_prime_seq.csv Untracked: data/diff_iso_trans/ Untracked: data/ensemble_to_genename.txt Untracked: data/example_gene_peakQuant/ Untracked: data/filtered_APApeaks_merged_allchrom_refseqTrans.closest2End.bed Untracked: data/filtered_APApeaks_merged_allchrom_refseqTrans.closest2End.noties.bed Untracked: data/first50lines_closest.txt Untracked: data/gencov.test.csv Untracked: data/gencov.test.txt Untracked: data/gencov_zero.test.csv Untracked: data/gencov_zero.test.txt Untracked: data/gene_cov/ Untracked: data/joined Untracked: data/leafcutter/ Untracked: data/merged_combined_YL-SP-threeprimeseq.bg Untracked: data/mol_overlap/ Untracked: data/mol_pheno/ Untracked: data/nom_QTL/ Untracked: data/nom_QTL_opp/ Untracked: data/nom_QTL_trans/ Untracked: data/nuc6up/ Untracked: data/other_qtls/ Untracked: data/peakPerRefSeqGene/ Untracked: data/perm_QTL/ Untracked: data/perm_QTL_opp/ Untracked: data/perm_QTL_trans/ Untracked: data/reads_mapped_three_prime_seq.csv Untracked: data/smash.cov.results.bed Untracked: data/smash.cov.results.csv Untracked: data/smash.cov.results.txt Untracked: data/smash_testregion/ Untracked: data/ssFC200.cov.bed Untracked: data/temp.file1 Untracked: data/temp.file2 Untracked: data/temp.gencov.test.txt Untracked: data/temp.gencov_zero.test.txt Untracked: output/picard/ Untracked: output/plots/ Untracked: output/qual.fig2.pdf Unstaged changes: Modified: analysis/28ind.peak.explore.Rmd Modified: analysis/39indQC.Rmd Modified: analysis/apaQTLoverlapGWAS.Rmd Modified: analysis/cleanupdtseq.internalpriming.Rmd Modified: analysis/coloc_apaQTLs_protQTLs.Rmd Modified: analysis/dif.iso.usage.leafcutter.Rmd Modified: analysis/diff_iso_pipeline.Rmd Modified: analysis/explore.filters.Rmd Modified: analysis/flash2mash.Rmd Modified: analysis/overlapMolQTL.Rmd Modified: analysis/overlap_qtls.Rmd Modified: analysis/peakOverlap_oppstrand.Rmd Modified: analysis/pheno.leaf.comb.Rmd Modified: analysis/swarmPlots_QTLs.Rmd Modified: analysis/test.max2.Rmd Modified: code/Snakefile
Expand here to see past versions:
| File | Version | Author | Date | Message |
|---|---|---|---|---|
| Rmd | 23c62c9 | Briana Mittleman | 2018-11-15 | add locus zoom initial analysis |
In this analysis I will create locus zoom plots for the example QTLs that look to be associated in APA and protein but not in RNA. I will first do this for the EIF2A totalAPA example. peak228606, 3:150302010.
To run this analysis, I will need the nominal pvalues for this peak/gene. I can then plot the snp location against the pvalue. After I have this working, I can add the r2 values.
EIF2A==ENSG00000144895
grep EIF2A /project2/gilad/briana/genome_anotation_data/ensemble_to_genename.txt
grep peak228606 /project2/gilad/briana/threeprimeseq/data/nominal_APAqtl_trans/filtered_APApeaks_merged_allchrom_refseqGenes_pheno_Total_NomRes.txt > /project2/gilad/briana/threeprimeseq/data/LocusZoom/TotalAPA.peak228606.EIF2A.nomTotal.txt


grep ENSG00000144895 /project2/gilad/briana/threeprimeseq/data/molecular_QTLs/nom/fastqtl_qqnorm_RNAseq_phase2.fixed.nominal.out > /project2/gilad/briana/threeprimeseq/data/LocusZoom/RNA.EIF2A.nomTotal.txt

grep ENSG00000144895 /project2/gilad/briana/threeprimeseq/data/molecular_QTLs/nom/fastqtl_qqnorm_prot.fixed.nominal.out > /project2/gilad/briana/threeprimeseq/data/LocusZoom/Prot.EIF2A.nomTotal.txt
FastQTL results for nominal: * phenoID
SID
Distance
Nominal Pval
Slope
Librarys
library(workflowr)This is workflowr version 1.1.1
Run ?workflowr for help getting startedlibrary(reshape2)
library(tidyverse)── Attaching packages ─────────────────────────────────────────────────────────────────────────── tidyverse 1.2.1 ──✔ ggplot2 3.0.0 ✔ purrr 0.2.5
✔ tibble 1.4.2 ✔ dplyr 0.7.6
✔ tidyr 0.8.1 ✔ stringr 1.3.1
✔ readr 1.1.1 ✔ forcats 0.3.0── Conflicts ────────────────────────────────────────────────────────────────────────────── tidyverse_conflicts() ──
✖ dplyr::filter() masks stats::filter()
✖ dplyr::lag() masks stats::lag()library(VennDiagram)Loading required package: gridLoading required package: futile.loggerlibrary(data.table)
Attaching package: 'data.table'The following objects are masked from 'package:dplyr':
between, first, lastThe following object is masked from 'package:purrr':
transposeThe following objects are masked from 'package:reshape2':
dcast, meltlibrary(ggpubr)Loading required package: magrittr
Attaching package: 'magrittr'The following object is masked from 'package:purrr':
set_namesThe following object is masked from 'package:tidyr':
extract
Attaching package: 'ggpubr'The following object is masked from 'package:VennDiagram':
rotatelibrary(cowplot)
Attaching package: 'cowplot'The following object is masked from 'package:ggpubr':
get_legendThe following object is masked from 'package:ggplot2':
ggsaveAPA=read.table("../data/LocusZoom/TotalAPA.peak228606.EIF2A.nomTotal.txt", stringsAsFactors = F, col.names = c("PeakID", "SID", "Dist", "APAPval","slope")) %>% separate(SID, into=c("Chrom", "Location"), sep=":") %>% select( Location, APAPval)
APA$Location=as.integer(APA$Location)
Prot=read.table("../data/LocusZoom/Prot.EIF2A.nomTotal.txt", stringsAsFactors = F, col.names = c("PeakID", "SID", "Dist", "ProtPval","slope")) %>% separate(SID, into=c("Chrom", "Location"), sep=":")%>% select( Location, ProtPval)
Prot$Location=as.integer(Prot$Location)
RNA=read.table("../data/LocusZoom/RNA.EIF2A.nomTotal.txt", stringsAsFactors = F, col.names = c("PeakID", "SID", "Dist", "RnaPval","slope")) %>% separate(SID, into=c("Chrom", "Location"), sep=":")%>% select( Location, RnaPval)
RNA$Location=as.integer(RNA$Location)I can join these by the snps that are tested for all three.
allPheno=APA %>% inner_join(Prot, by="Location") %>% inner_join(RNA, by="Location")First I can just plot these as is and see what happens:
allPhen_melt= melt(allPheno, id.vars="Location")ggplot(allPhen_melt,aes(x=Location, y=value)) + geom_point() + facet_grid( rows=vars(variable))
I need to zoom in around my locus 150302010
allPheno_filt=allPheno %>% filter(Location> 150297010 & Location < 150307010)

allPhen_filt_melt= melt(allPheno_filt, id.vars="Location")

ggplot(allPhen_filt_melt,aes(x=Location, y=-log10(value))) + geom_point() + facet_grid( rows=vars(variable)) + geom_vline(xintercept=150302010, linetype="dashed", color = "red") + theme(axis.line=element_line()) + theme(panel.grid.major = element_line("lightgray",0.25), panel.grid.minor = element_line("lightgray",0.25)) + labs(x="Chromosome 3 Location", y="-Log 10 Pvalue", title="Locus Zoom for EIF2A:peak228606")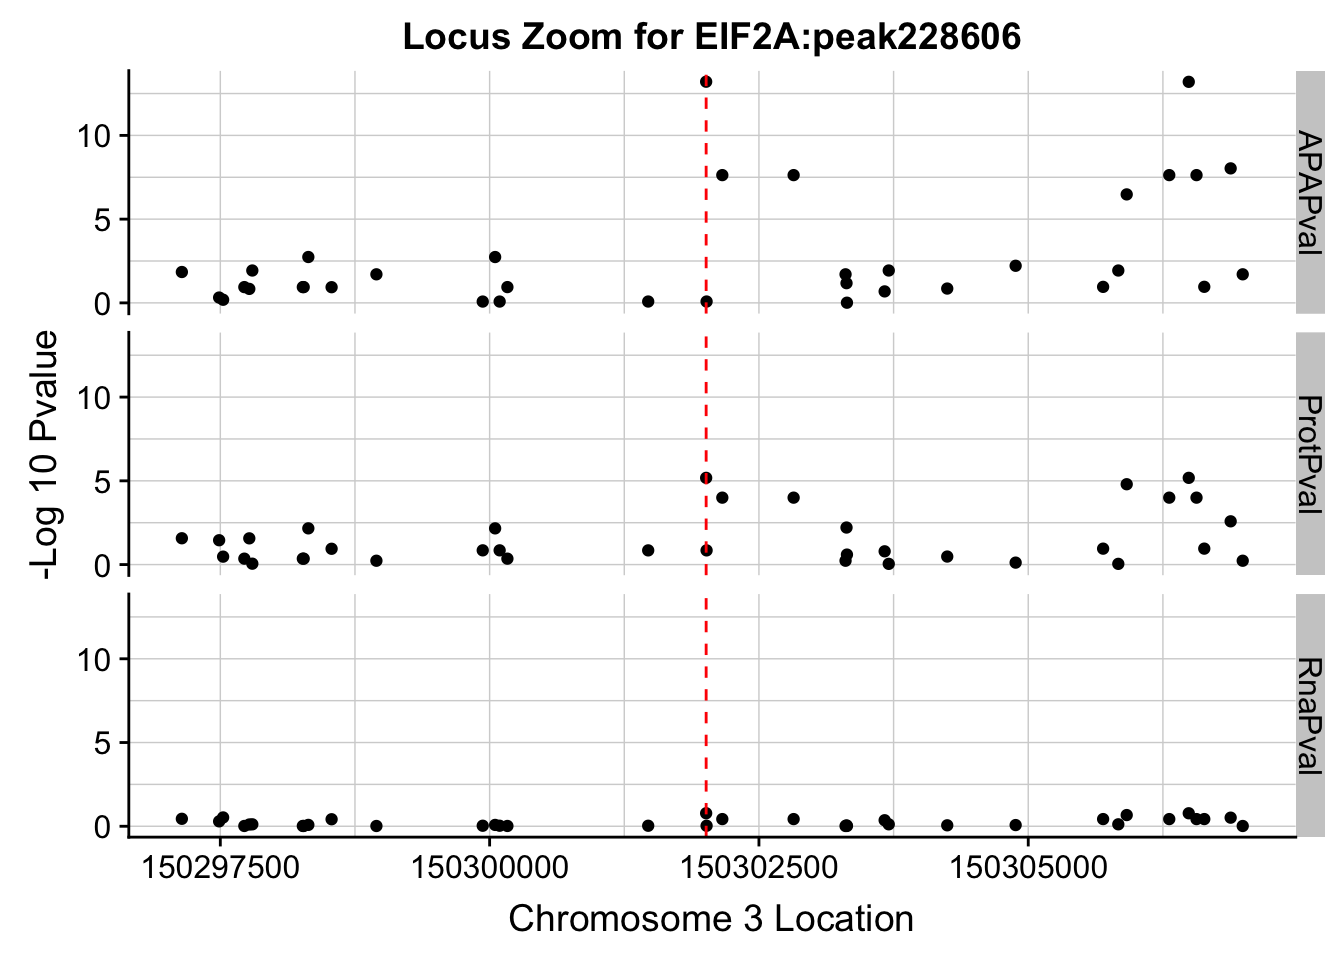
Plot each seperatly because power is different.
allPhen_filt_APA=allPhen_filt_melt %>% filter(variable=="APAPval")
allPhen_filt_Prot=allPhen_filt_melt %>% filter(variable=="ProtPval")
allPhen_filt_RNA=allPhen_filt_melt %>% filter(variable=="RnaPval")
Plot each seperatly then use cow plot
apa=ggplot(allPhen_filt_APA, aes(x=Location, y= -log10(value))) + geom_point()+ geom_vline(xintercept=150302010, linetype="dashed", color = "red")

prot=ggplot(allPhen_filt_Prot, aes(x=Location, y= -log10(value))) + geom_point()+ geom_vline(xintercept=150302010, linetype="dashed", color = "red")

rna=ggplot(allPhen_filt_RNA, aes(x=Location, y= -log10(value))) + geom_point()+ geom_vline(xintercept=150302010, linetype="dashed", color = "red")
plot_grid(apa,prot,rna, align = "v", ncol=1)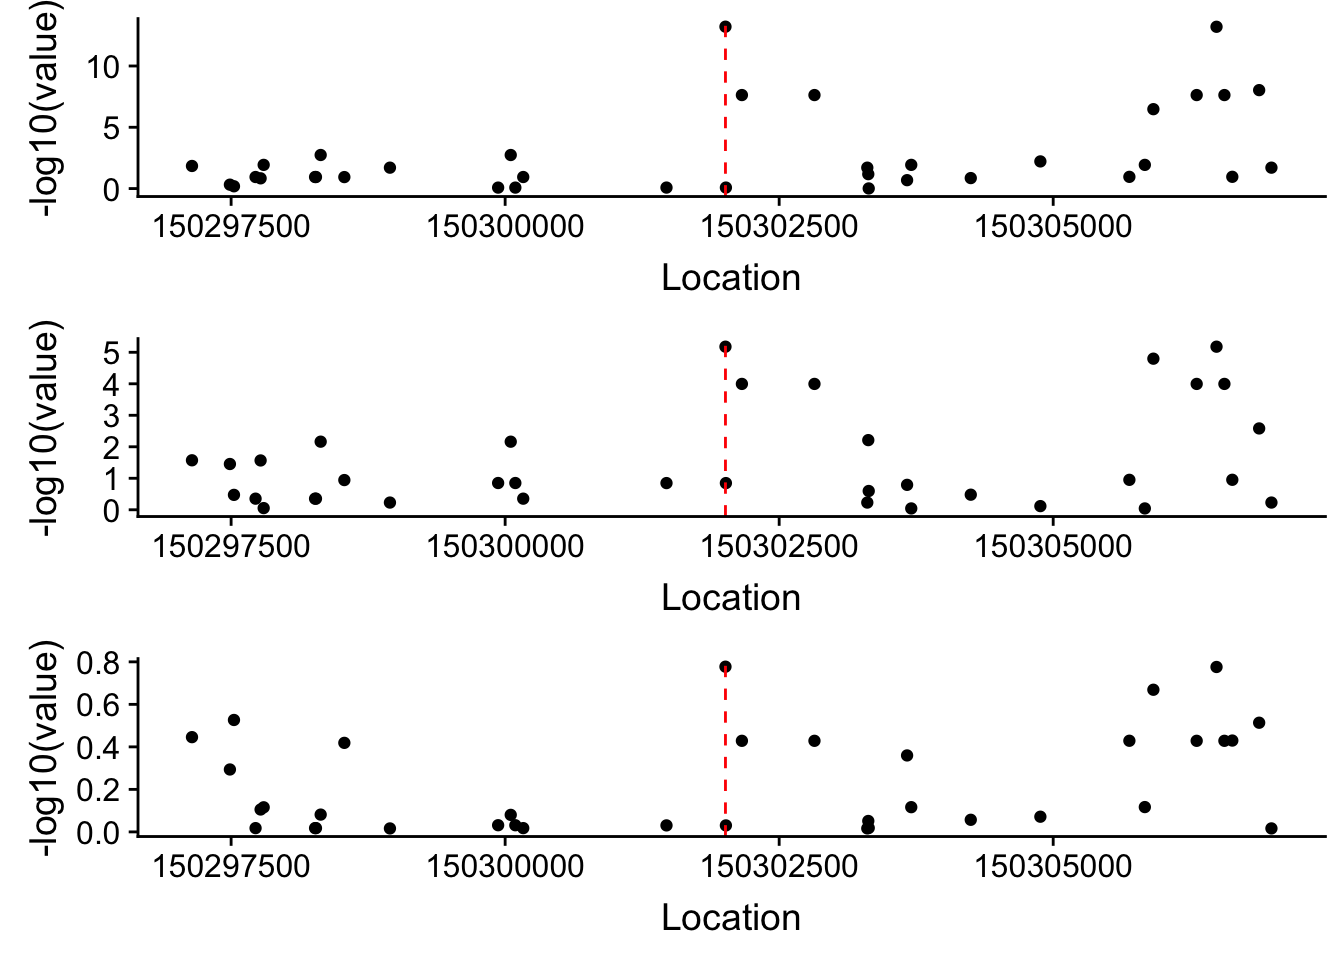
Session information
sessionInfo()R version 3.5.1 (2018-07-02)
Platform: x86_64-apple-darwin15.6.0 (64-bit)
Running under: macOS Sierra 10.12.6
Matrix products: default
BLAS: /Library/Frameworks/R.framework/Versions/3.5/Resources/lib/libRblas.0.dylib
LAPACK: /Library/Frameworks/R.framework/Versions/3.5/Resources/lib/libRlapack.dylib
locale:
[1] en_US.UTF-8/en_US.UTF-8/en_US.UTF-8/C/en_US.UTF-8/en_US.UTF-8
attached base packages:
[1] grid stats graphics grDevices utils datasets methods
[8] base
other attached packages:
[1] bindrcpp_0.2.2 cowplot_0.9.3 ggpubr_0.1.8
[4] magrittr_1.5 data.table_1.11.8 VennDiagram_1.6.20
[7] futile.logger_1.4.3 forcats_0.3.0 stringr_1.3.1
[10] dplyr_0.7.6 purrr_0.2.5 readr_1.1.1
[13] tidyr_0.8.1 tibble_1.4.2 ggplot2_3.0.0
[16] tidyverse_1.2.1 reshape2_1.4.3 workflowr_1.1.1
loaded via a namespace (and not attached):
[1] tidyselect_0.2.4 haven_1.1.2 lattice_0.20-35
[4] colorspace_1.3-2 htmltools_0.3.6 yaml_2.2.0
[7] rlang_0.2.2 R.oo_1.22.0 pillar_1.3.0
[10] glue_1.3.0 withr_2.1.2 R.utils_2.7.0
[13] lambda.r_1.2.3 modelr_0.1.2 readxl_1.1.0
[16] bindr_0.1.1 plyr_1.8.4 munsell_0.5.0
[19] gtable_0.2.0 cellranger_1.1.0 rvest_0.3.2
[22] R.methodsS3_1.7.1 evaluate_0.11 labeling_0.3
[25] knitr_1.20 broom_0.5.0 Rcpp_0.12.19
[28] formatR_1.5 backports_1.1.2 scales_1.0.0
[31] jsonlite_1.5 hms_0.4.2 digest_0.6.17
[34] stringi_1.2.4 rprojroot_1.3-2 cli_1.0.1
[37] tools_3.5.1 lazyeval_0.2.1 futile.options_1.0.1
[40] crayon_1.3.4 whisker_0.3-2 pkgconfig_2.0.2
[43] xml2_1.2.0 lubridate_1.7.4 assertthat_0.2.0
[46] rmarkdown_1.10 httr_1.3.1 rstudioapi_0.8
[49] R6_2.3.0 nlme_3.1-137 git2r_0.23.0
[52] compiler_3.5.1
This reproducible R Markdown analysis was created with workflowr 1.1.1