Protein and RNA pvalues for apaQTLs
Briana Mittleman
2/19/2019
Last updated: 2019-03-01
Checks: 6 0
Knit directory: threeprimeseq/analysis/
This reproducible R Markdown analysis was created with workflowr (version 1.2.0). The Report tab describes the reproducibility checks that were applied when the results were created. The Past versions tab lists the development history.
Great! Since the R Markdown file has been committed to the Git repository, you know the exact version of the code that produced these results.
Great job! The global environment was empty. Objects defined in the global environment can affect the analysis in your R Markdown file in unknown ways. For reproduciblity it’s best to always run the code in an empty environment.
The command set.seed(12345) was run prior to running the code in the R Markdown file. Setting a seed ensures that any results that rely on randomness, e.g. subsampling or permutations, are reproducible.
Great job! Recording the operating system, R version, and package versions is critical for reproducibility.
Nice! There were no cached chunks for this analysis, so you can be confident that you successfully produced the results during this run.
Great! You are using Git for version control. Tracking code development and connecting the code version to the results is critical for reproducibility. The version displayed above was the version of the Git repository at the time these results were generated.
Note that you need to be careful to ensure that all relevant files for the analysis have been committed to Git prior to generating the results (you can use wflow_publish or wflow_git_commit). workflowr only checks the R Markdown file, but you know if there are other scripts or data files that it depends on. Below is the status of the Git repository when the results were generated:
Ignored files:
    Ignored:    .DS_Store
    Ignored:    .Rhistory
    Ignored:    .Rproj.user/
    Ignored:    data/.DS_Store
    Ignored:    data/perm_QTL_trans_noMP_5percov/
    Ignored:    output/.DS_Store

Untracked files:
    Untracked:  KalistoAbundance18486.txt
    Untracked:  analysis/4suDataIGV.Rmd
    Untracked:  analysis/DirectionapaQTL.Rmd
    Untracked:  analysis/EvaleQTLs.Rmd
    Untracked:  analysis/YL_QTL_test.Rmd
    Untracked:  analysis/groSeqAnalysis.Rmd
    Untracked:  analysis/ncbiRefSeq_sm.sort.mRNA.bed
    Untracked:  analysis/snake.config.notes.Rmd
    Untracked:  analysis/verifyBAM.Rmd
    Untracked:  analysis/verifybam_dubs.Rmd
    Untracked:  code/PeaksToCoverPerReads.py
    Untracked:  code/strober_pc_pve_heatmap_func.R
    Untracked:  data/18486.genecov.txt
    Untracked:  data/APApeaksYL.total.inbrain.bed
    Untracked:  data/AllPeak_counts/
    Untracked:  data/ApaQTLs/
    Untracked:  data/ApaQTLs_otherPhen/
    Untracked:  data/ChromHmmOverlap/
    Untracked:  data/DistTXN2Peak_genelocAnno/
    Untracked:  data/GM12878.chromHMM.bed
    Untracked:  data/GM12878.chromHMM.txt
    Untracked:  data/LianoglouLCL/
    Untracked:  data/LocusZoom/
    Untracked:  data/LocusZoom_Unexp/
    Untracked:  data/LocusZoom_proc/
    Untracked:  data/MatchedSnps/
    Untracked:  data/NuclearApaQTLs.txt
    Untracked:  data/PeakCounts/
    Untracked:  data/PeakCounts_noMP_5perc/
    Untracked:  data/PeakCounts_noMP_genelocanno/
    Untracked:  data/PeakUsage/
    Untracked:  data/PeakUsage_noMP/
    Untracked:  data/PeakUsage_noMP_GeneLocAnno/
    Untracked:  data/PeaksUsed/
    Untracked:  data/PeaksUsed_noMP_5percCov/
    Untracked:  data/QTL_overlap/
    Untracked:  data/RNAkalisto/
    Untracked:  data/RefSeq_annotations/
    Untracked:  data/Replicates_usage/
    Untracked:  data/TotalApaQTLs.txt
    Untracked:  data/Totalpeaks_filtered_clean.bed
    Untracked:  data/UnderstandPeaksQC/
    Untracked:  data/WASP_STAT/
    Untracked:  data/YL-SP-18486-T-combined-genecov.txt
    Untracked:  data/YL-SP-18486-T_S9_R1_001-genecov.txt
    Untracked:  data/YL_QTL_test/
    Untracked:  data/apaExamp/
    Untracked:  data/apaExamp_proc/
    Untracked:  data/apaQTL_examp_noMP/
    Untracked:  data/bedgraph_peaks/
    Untracked:  data/bin200.5.T.nuccov.bed
    Untracked:  data/bin200.Anuccov.bed
    Untracked:  data/bin200.nuccov.bed
    Untracked:  data/clean_peaks/
    Untracked:  data/comb_map_stats.csv
    Untracked:  data/comb_map_stats.xlsx
    Untracked:  data/comb_map_stats_39ind.csv
    Untracked:  data/combined_reads_mapped_three_prime_seq.csv
    Untracked:  data/diff_iso_GeneLocAnno/
    Untracked:  data/diff_iso_proc/
    Untracked:  data/diff_iso_trans/
    Untracked:  data/eQTLs_Lietal/
    Untracked:  data/ensemble_to_genename.txt
    Untracked:  data/example_gene_peakQuant/
    Untracked:  data/explainProtVar/
    Untracked:  data/filtPeakOppstrand_cov_noMP_GeneLocAnno_5perc/
    Untracked:  data/filtered_APApeaks_merged_allchrom_refseqTrans.closest2End.bed
    Untracked:  data/filtered_APApeaks_merged_allchrom_refseqTrans.closest2End.noties.bed
    Untracked:  data/first50lines_closest.txt
    Untracked:  data/gencov.test.csv
    Untracked:  data/gencov.test.txt
    Untracked:  data/gencov_zero.test.csv
    Untracked:  data/gencov_zero.test.txt
    Untracked:  data/gene_cov/
    Untracked:  data/joined
    Untracked:  data/leafcutter/
    Untracked:  data/merged_combined_YL-SP-threeprimeseq.bg
    Untracked:  data/molPheno_noMP/
    Untracked:  data/mol_overlap/
    Untracked:  data/mol_pheno/
    Untracked:  data/nom_QTL/
    Untracked:  data/nom_QTL_opp/
    Untracked:  data/nom_QTL_trans/
    Untracked:  data/nuc6up/
    Untracked:  data/nuc_10up/
    Untracked:  data/other_qtls/
    Untracked:  data/pQTL_otherphen/
    Untracked:  data/pacbio_cov/
    Untracked:  data/peakPerRefSeqGene/
    Untracked:  data/peaks4DT/
    Untracked:  data/perm_QTL/
    Untracked:  data/perm_QTL_GeneLocAnno_noMP_5percov/
    Untracked:  data/perm_QTL_GeneLocAnno_noMP_5percov_3UTR/
    Untracked:  data/perm_QTL_diffWindow/
    Untracked:  data/perm_QTL_opp/
    Untracked:  data/perm_QTL_trans/
    Untracked:  data/perm_QTL_trans_filt/
    Untracked:  data/protAndAPAAndExplmRes.Rda
    Untracked:  data/protAndAPAlmRes.Rda
    Untracked:  data/protAndExpressionlmRes.Rda
    Untracked:  data/reads_mapped_three_prime_seq.csv
    Untracked:  data/smash.cov.results.bed
    Untracked:  data/smash.cov.results.csv
    Untracked:  data/smash.cov.results.txt
    Untracked:  data/smash_testregion/
    Untracked:  data/ssFC200.cov.bed
    Untracked:  data/temp.file1
    Untracked:  data/temp.file2
    Untracked:  data/temp.gencov.test.txt
    Untracked:  data/temp.gencov_zero.test.txt
    Untracked:  data/threePrimeSeqMetaData.csv
    Untracked:  data/threePrimeSeqMetaData55Ind.txt
    Untracked:  data/threePrimeSeqMetaData55Ind.xlsx
    Untracked:  data/threePrimeSeqMetaData55Ind_noDup.txt
    Untracked:  data/threePrimeSeqMetaData55Ind_noDup.xlsx
    Untracked:  data/threePrimeSeqMetaData55Ind_noDup_WASPMAP.txt
    Untracked:  data/threePrimeSeqMetaData55Ind_noDup_WASPMAP.xlsx
    Untracked:  output/LZ/
    Untracked:  output/deeptools_plots/
    Untracked:  output/picard/
    Untracked:  output/plots/
    Untracked:  output/qual.fig2.pdf

Unstaged changes:
    Modified:   analysis/28ind.peak.explore.Rmd
    Modified:   analysis/CompareLianoglouData.Rmd
    Modified:   analysis/NewPeakPostMP.Rmd
    Modified:   analysis/apaQTLoverlapGWAS.Rmd
    Modified:   analysis/cleanupdtseq.internalpriming.Rmd
    Modified:   analysis/coloc_apaQTLs_protQTLs.Rmd
    Modified:   analysis/dif.iso.usage.leafcutter.Rmd
    Modified:   analysis/diff_iso_pipeline.Rmd
    Modified:   analysis/explainpQTLs.Rmd
    Modified:   analysis/explore.filters.Rmd
    Modified:   analysis/fixBWChromNames.Rmd
    Modified:   analysis/flash2mash.Rmd
    Modified:   analysis/mispriming_approach.Rmd
    Modified:   analysis/overlapMolQTL.Rmd
    Modified:   analysis/overlapMolQTL.opposite.Rmd
    Modified:   analysis/overlap_qtls.Rmd
    Modified:   analysis/peakOverlap_oppstrand.Rmd
    Modified:   analysis/peakQCPPlots.Rmd
    Modified:   analysis/peakQCplotsSTARprocessing.Rmd
    Modified:   analysis/pheno.leaf.comb.Rmd
    Modified:   analysis/pipeline_55Ind.Rmd
    Modified:   analysis/swarmPlots_QTLs.Rmd
    Modified:   analysis/test.max2.Rmd
    Modified:   analysis/test.smash.Rmd
    Modified:   analysis/understandPeaks.Rmd
    Modified:   analysis/unexplainedeQTL_analysis.Rmd
    Modified:   code/Snakefile
Note that any generated files, e.g. HTML, png, CSS, etc., are not included in this status report because it is ok for generated content to have uncommitted changes.
These are the previous versions of the R Markdown and HTML files. If you’ve configured a remote Git repository (see ?wflow_git_remote), click on the hyperlinks in the table below to view them.
| File | Version | Author | Date | Message |
|---|---|---|---|---|
| Rmd | 4fbbff7 | Briana Mittleman | 2019-03-01 | fix dim |
| html | 9fb796b | Briana Mittleman | 2019-02-28 | Build site. |
| Rmd | d91ac3d | Briana Mittleman | 2019-02-28 | hypergeo for pval |
| html | c7cc40f | Briana Mittleman | 2019-02-28 | Build site. |
| Rmd | 55ba3a5 | Briana Mittleman | 2019-02-28 | sep by explained and unexplained |
| html | 92ed301 | Briana Mittleman | 2019-02-20 | Build site. |
| Rmd | b0b45a7 | Briana Mittleman | 2019-02-20 | save plot |
| html | 7d671f5 | Briana Mittleman | 2019-02-20 | Build site. |
| Rmd | e5ff528 | Briana Mittleman | 2019-02-20 | add distribution and pi1 |
| html | 386f80d | Briana Mittleman | 2019-02-19 | Build site. |
| Rmd | 2a9d059 | Briana Mittleman | 2019-02-19 | code for nom pvals |
apaQTLs in RNA and prot
library(workflowr)This is workflowr version 1.2.0
Run ?workflowr for help getting startedlibrary(reshape2)
library(tidyverse)── Attaching packages ──────────────────────────────────────────────────────────────────────────── tidyverse 1.2.1 ──✔ ggplot2 3.0.0 ✔ purrr 0.2.5
✔ tibble 1.4.2 ✔ dplyr 0.7.6
✔ tidyr 0.8.1 ✔ stringr 1.4.0
✔ readr 1.1.1 ✔ forcats 0.3.0Warning: package 'stringr' was built under R version 3.5.2── Conflicts ─────────────────────────────────────────────────────────────────────────────── tidyverse_conflicts() ──
✖ dplyr::filter() masks stats::filter()
✖ dplyr::lag() masks stats::lag()library(cowplot)
Attaching package: 'cowplot'The following object is masked from 'package:ggplot2':
ggsavelibrary(qvalue)For a lot of this project I have been looking at the relationship between APA, RNA, and protein. I want to use trhis analysis to get the nominal pvalues for the associations of the snp:gene pairs found in the APA qtl analysis. This will help me find examples and look at the distributions overall.
I want a file that has the nominal pvalues for each of the apaQTls in the total 3’, nuclear 3’, RNA, and protein. I will have to convert the gene names.
Start with a dictionary of the QTLs. It will have the snp as the key and converted gene as the value. I can then write out the associations.
I can do this seperate for RNA and protein with total and nuclear by having a script that can take all of the combinations. After I get the results I can merge them and add NAs for missing measurements.
I can ask questions like, given a snp is a apaQTL what is nom association in other pheno.
Molpval4ApaQTL.py
def main(QTL, phen, outF, phenotype):
    fout=open(outF,"w")
    geneNames=open("/project2/gilad/briana/genome_anotation_data/ensemble_to_genename.txt","r")
    #gene name dictionary
    geneDic={}
    geneDicOpp={}
    for i, ln in enumerate(geneNames):
        if i >0:
            ID=ln.split()[0]
            gene=ln.split()[1]
            if gene not in geneDic.keys():
                geneDic[gene]=[ID]
            else:
                geneDic[gene].append(ID)
            geneDicOpp[ID]=gene
    print(geneDicOpp.keys())
    #qtl dic
    qtlDic={}
    for ln in open(QTL,"r"):
        snp=ln.split()[5]
        gene=ln.split()[0].split(":")[-1].split("_")[0]
        #gene_id=geneDic[gene]
        qtlDic[snp]=gene
    #loop over pheno
    for ln in open(phen,"r"):
        snp=ln.split()[1]
        if snp in qtlDic.keys():
            if phenotype == "RNA":
                gene=ln.split()[0].split(".")[0]
                if gene not in geneDicOpp.keys():
                    next
                geneName=geneDicOpp[gene]
            else:
                gene=ln.split()[0]
                if gene not in geneDicOpp.keys():
                    next
                geneName=geneDicOpp[gene]
            if qtlDic[snp]==geneName:
               pval=ln.split()[3]
               fout.write("%s\t%s\t%s\t%s\n"%(snp, gene, geneName, pval))
    fout.close()


if __name__ == "__main__":
    import sys
    fraction = sys.argv[1]
    pheno = sys.argv[2]
    inQTL="/project2/gilad/briana/threeprimeseq/data/ApaQTLs/%sapaQTLs.GeneLocAnno.noMP.5perc.10FDR.txt"%(fraction)
    if pheno == "RNA":
        inPhen="/project2/gilad/briana/threeprimeseq/data/molecular_QTLs/nom/fastqtl_qqnorm_RNAseq_phase2.fixed.nominal.out"
    if pheno =="Protein":
        inPhen= "/project2/gilad/briana/threeprimeseq/data/molecular_QTLs/nom/fastqtl_qqnorm_prot_fixed.nominal.out"
    out="/project2/gilad/briana/threeprimeseq/data/ApaQTLs_otherPhen/%sQTLsin%s.txt"%(fraction, pheno)
    main(inQTL, inPhen, out, pheno)
Run this on all combinations:
run_Molpval4ApaQTL.sh
#!/bin/bash

#SBATCH --job-name=run_Molpval4ApaQTL
#SBATCH --account=pi-yangili1
#SBATCH --time=36:00:00
#SBATCH --output=run_Molpval4ApaQTL.out
#SBATCH --error=run_Molpval4ApaQTL.err
#SBATCH --partition=broadwl
#SBATCH --mem=30G
#SBATCH --mail-type=END


module load Anaconda3
source activate three-prime-env

python Molpval4ApaQTL.py Total RNA
python Molpval4ApaQTL.py Nuclear RNA
python Molpval4ApaQTL.py Total Protein
python Molpval4ApaQTL.py Nuclear Protein
Pull these in:
NucRNA=read.table("../data/ApaQTLs_otherPhen/NuclearQTLsinRNA.txt", col.names = c("SNP", "Gene", "GeneName", "RNA_P"),stringsAsFactors = F)
TotRNA=read.table("../data/ApaQTLs_otherPhen/TotalQTLsinRNA.txt", col.names = c("SNP", "Gene", "GeneName", "RNA_P"),stringsAsFactors = F)
NucProt=read.table("../data/ApaQTLs_otherPhen/NuclearQTLsinProtein.txt", col.names = c("SNP", "Gene", "GeneName", "Prot_P"),stringsAsFactors = F)
TotProt=read.table("../data/ApaQTLs_otherPhen/TotalQTLsinProtein.txt", col.names = c("SNP", "Gene", "GeneName", "Prot_P"),stringsAsFactors = F)
Pi1 values:
Nuclear:
- RNA
NucRNAPi=pi0est(NucRNA$RNA_P, pi0.method = "bootstrap")
1-NucRNAPi$pi0
[1] 0.3436293- Protein
NucProtPi=pi0est(NucProt$Prot_P, pi0.method = "bootstrap")
1-NucProtPi$pi0
[1] 0.3577982Total:
- RNA
TotRNAPi=pi0est(TotRNA$RNA_P, pi0.method = "bootstrap")
1-TotRNAPi$pi0
[1] 0.3361227- Protein
TotProtPi=pi0est(TotProt$Prot_P, pi0.method = "bootstrap")
1-TotProtPi$pi0
[1] 0.3333333Histograms:
png("../output/plots/OverlapRNAandProtPi.png")
par(mfrow=c(2,2))
hist(TotRNA$RNA_P,xlab="RNA Pvalue", main="Total apaQTLs \nin RNA")
text(.6,50, paste("pi_1=", round((1-TotRNAPi$pi0), digit=3), sep=" "))
hist(TotProt$Prot_P,xlab="Protein Pvalue", main="Total apaQTLs \nin Protein")
text(.6,20, paste("pi_1=", round((1-TotProtPi$pi0), digit=3), sep=" "))
hist(NucRNA$RNA_P,xlab="RNA Pvalue", main="Nuclear apaQTLs \nin RNA")
text(.6,90, paste("pi_1=", round((1-NucRNAPi$pi0), digit=3), sep=" "))
hist(NucProt$Prot_P,xlab="Protein Pvalue", main="Nuclear apaQTLs \nin Protein")
text(.6,30, paste("pi_1=", round((1-NucProtPi$pi0), digit=3), sep=" "))
dev.off()
quartz_off_screen
2 Put together to look at examples and distributions:
NucOverlap=NucRNA %>% full_join(NucProt, by=c("SNP", "Gene", "GeneName"))

NucOverlap_melt=melt(NucOverlap, id.vars = c("SNP", "Gene", "GeneName"))
colnames(NucOverlap_melt)=c("SNP", "Gene", "GeneName", "Pheno", "Pvalue")

ggplot(NucOverlap_melt, aes(x=Pvalue, by=Pheno, fill=Pheno))+ geom_density(alpha=.5) +labs(title="RNA and Protien Pvalues for Nuclear apaQTLs") + scale_fill_manual(values=c("yellow","blue"))
Warning: Removed 300 rows containing non-finite values (stat_density).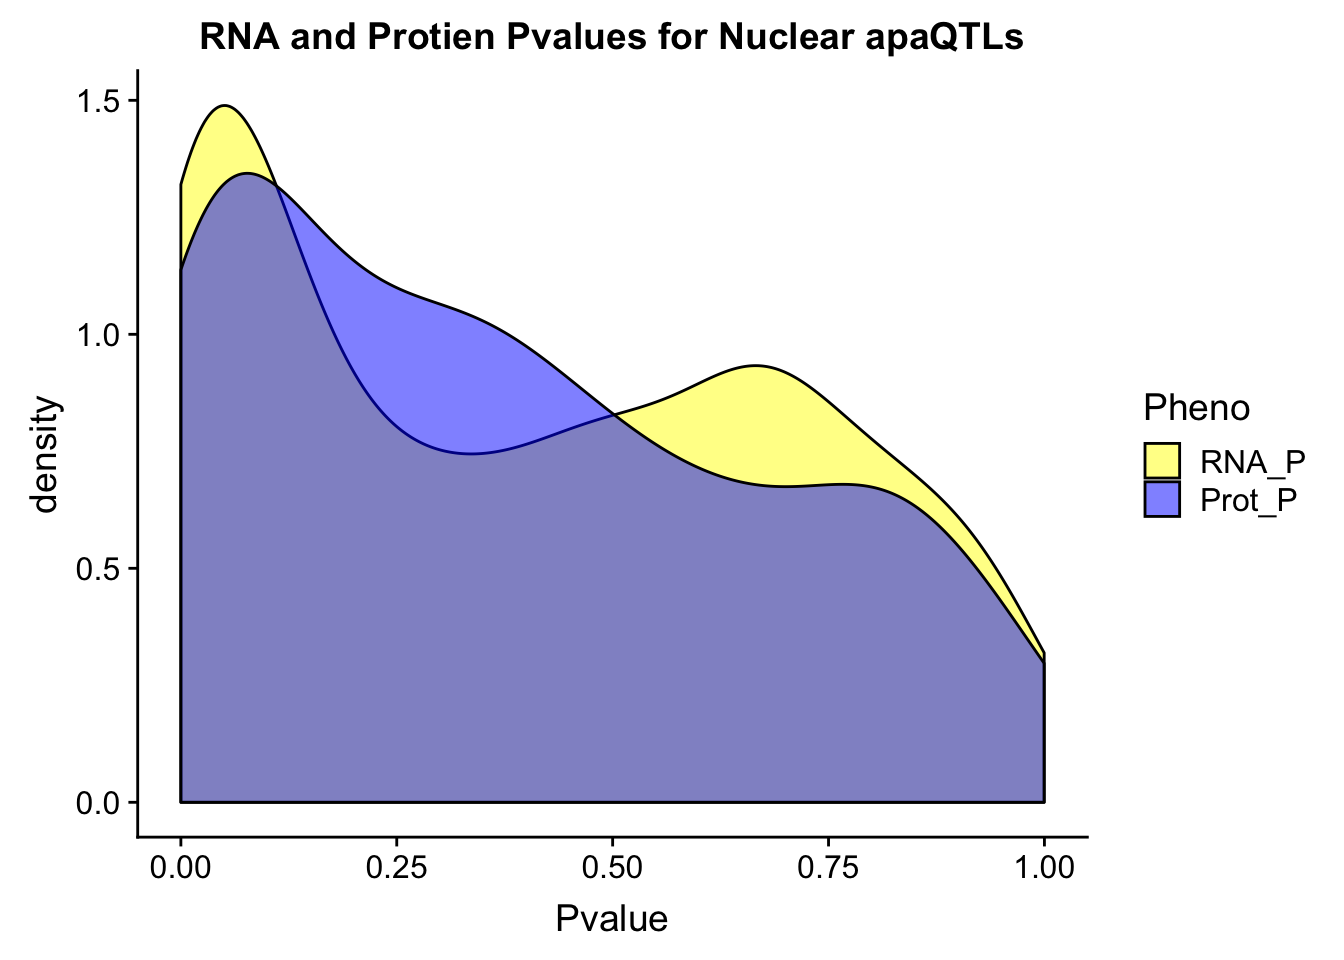
TotOverlap=TotRNA %>% full_join(TotProt, by=c("SNP", "Gene", "GeneName"))

TotOverlap_melt=melt(TotOverlap, id.vars = c("SNP", "Gene", "GeneName"))
colnames(TotOverlap_melt)=c("SNP", "Gene", "GeneName", "Pheno", "Pvalue")

ggplot(TotOverlap_melt, aes(x=Pvalue, by=Pheno, fill=Pheno))+ geom_density(alpha=.5) + labs(title="RNA and Protien Pvalues for Total apaQTLs") + scale_fill_manual(values=c("yellow","blue"))
Warning: Removed 133 rows containing non-finite values (stat_density).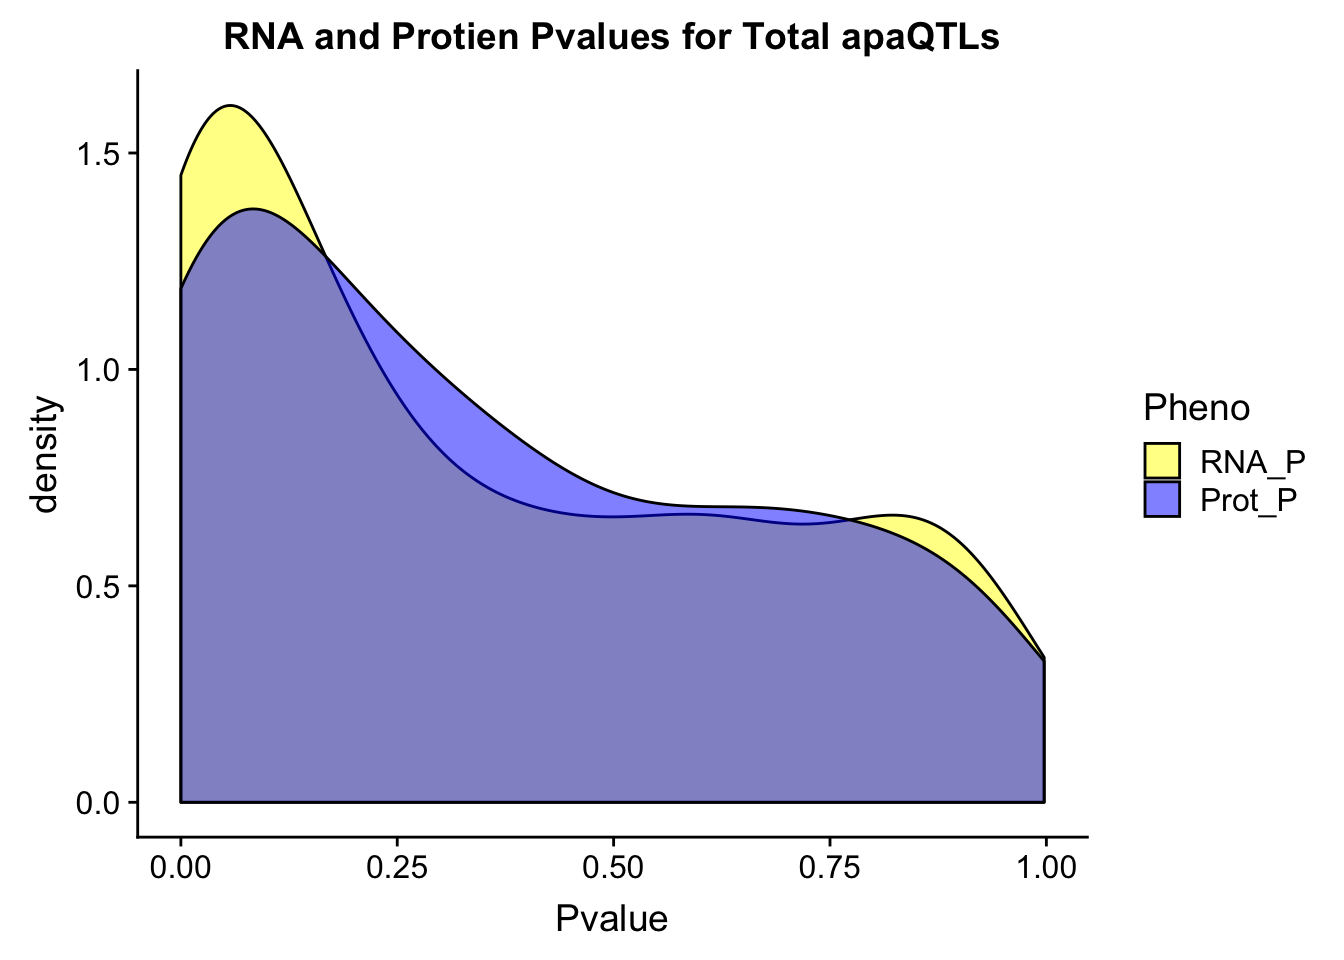
Look at the pi1 with bootstrapping:
set.seed(1)
pi1Bootstrap= function(pval){
    output=integer(100)
    for (i in 1:length(output)){
      samp=sample(pval,length(pval), replace = T)
      Spi0=pi0est(samp, pi0.method = "bootstrap")
      pi1=1-Spi0$pi0
      output[i]=pi1
    }
    return(output)
}
#TotP_sim=pi1Bootstrap(TotProt$Prot_P)
TotR_sim=pi1Bootstrap(TotRNA$RNA_P)
NucP_sim=pi1Bootstrap(NucProt$Prot_P)
NucR_sim=pi1Bootstrap(NucRNA$RNA_P)

TotP_est=1-TotProtPi$pi0
TotR_est=1-TotRNAPi$pi0
NucP_est=1-NucProtPi$pi0
NucR_est=1-NucRNAPi$pi0
Fraction=c("Total", "Total", "Nuclear", "Nuclear")
Category=c("Protein", "RNA","Protein", "RNA")
Estimate=c(TotP_est,TotR_est,NucP_est,NucR_est)
SD=c(0, sd(TotR_sim),sd(NucP_sim), sd(NucR_sim))
Pi1DF=as.data.frame(cbind(Fraction, Category,Estimate,SD))
Pi1DF$Estimate= as.numeric(as.character(Pi1DF$Estimate))
Pi1DF$SD= as.numeric(as.character(Pi1DF$SD))ggplot(Pi1DF,aes(x=Category, y=Estimate, col=Category)) + geom_point() + geom_errorbar(aes(ymin=(Estimate-SD), ymax=(Estimate+SD)),width=.1) + facet_grid(~Fraction) + scale_color_manual(values=c("red", "blue")) + labs(title="Pi1 Sharing Between apaQTLs and other molQTLs")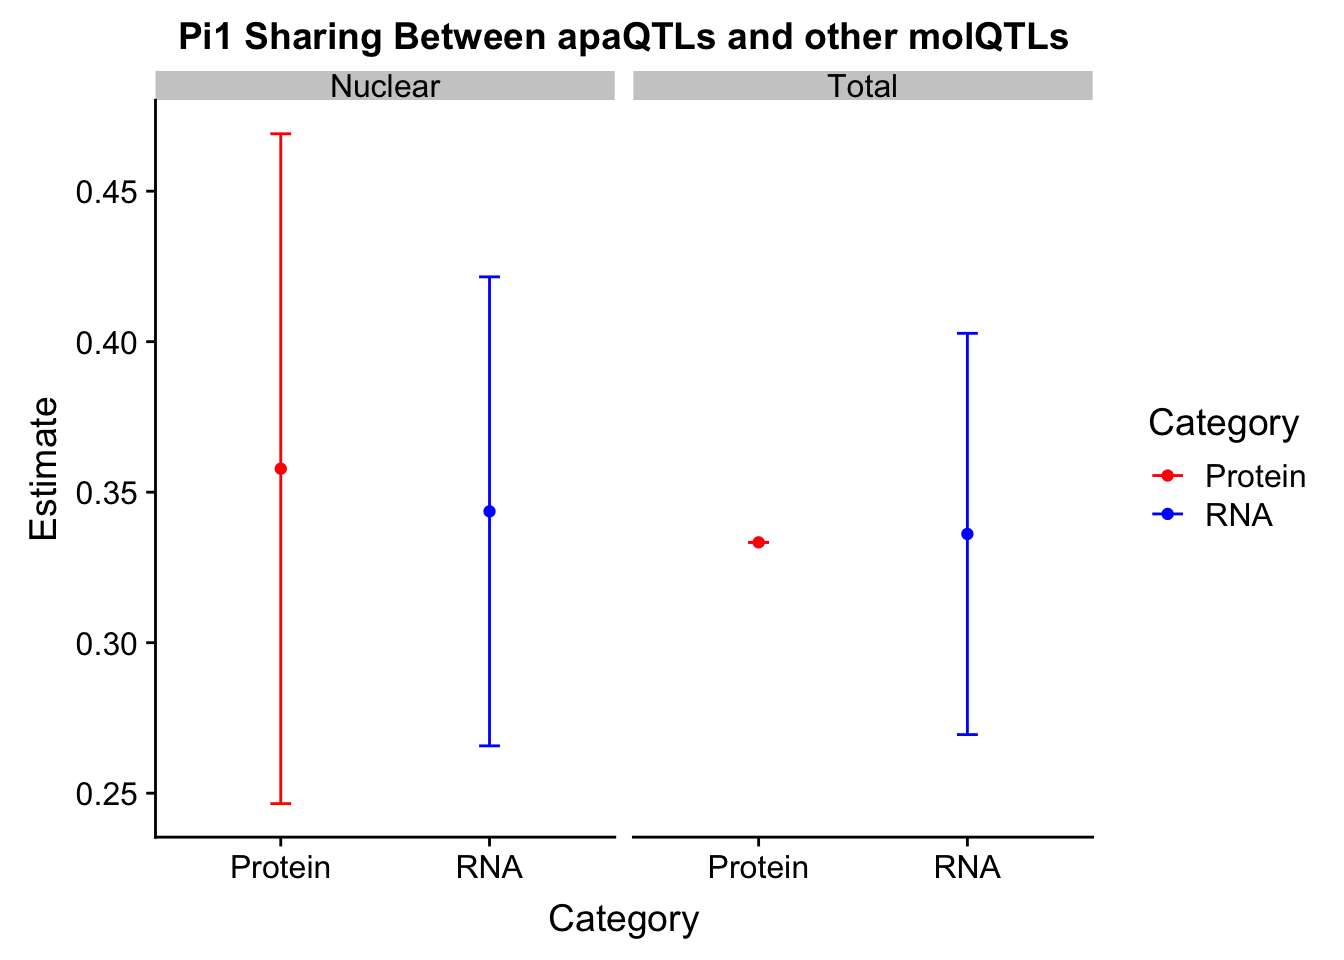
| Version | Author | Date |
|---|---|---|
| c7cc40f | Briana Mittleman | 2019-02-28 |
Split explained and unexplained
I want to look at genes for unexplained eQTLs. I need to make a list of the genes with an unexplained eQTL.
getUnexpeQTLGenes.py
inFile="/project2/gilad/briana/threeprimeseq/data/eQTL_Lietal/unexplained_FDR10.txt"
outFile=open("/project2/gilad/briana/threeprimeseq/data/eQTL_Lietal/unexplained_FDR10_genes.txt", "w")
for ln in open(inFile, "r"):
    if length(ln.split())==3:
        gene=ln.split()[2]
        outFile.write("%s\n"%(gene))
    else:
       genes=ln.split()[2:]
       for i in genes:
           outFile.write("%s\n"%i)

outFile.close()
geneNames=read.table("../data/ensemble_to_genename.txt",stringsAsFactors = F, header = T, sep="\t")
unexpGene=read.table("../data/eQTLs_Lietal/unexplained_FDR10_genes.txt", header = F, col.names = c("Gene.stable.ID"),stringsAsFactors = F) %>% inner_join(geneNames, by="Gene.stable.ID")
colnames(unexpGene)=c("Gene.stable.ID", "GeneName", "Source")Now I want to seperate the eQTL pvalue results by these gene.
Total:
TotRNAun=TotRNA %>% semi_join(unexpGene,by="GeneName")
TotRNAUnPval=TotRNAun %>% select(RNA_P) %>% mutate(Category="Unexplained")
TotRNAEx=TotRNA %>% anti_join(unexpGene, by="GeneName")
TotRNAExPval=TotRNAEx%>% select(RNA_P) %>% mutate(Category="Explained")

#full data frame
AllRNAP_tot=as.data.frame(rbind(TotRNAUnPval,TotRNAExPval))

totExvUn=ggplot(AllRNAP_tot, aes(by=Category, x=RNA_P, fill=Category))+ geom_density(alpha=.3) + scale_fill_manual(values=c("red", "blue")) + labs(x="eQTL association pvalue", title="Total apaQTL associations \n in eQTLs analysis") + annotate("text", label="P < .0001", x=.75, y=2) + annotate("text", label="***", x=.75, y=1.8)
Nuclear:
NucRNAun=NucRNA %>% semi_join(unexpGene,by="GeneName")
NucRNAUnPval=NucRNAun %>% select(RNA_P) %>% mutate(Category="Unexplained")
NucRNAEx=NucRNA %>% anti_join(unexpGene, by="GeneName")
NucRNAExPval=NucRNAEx%>% select(RNA_P) %>% mutate(Category="Explained")

AllRNAP_nuc=as.data.frame(rbind(NucRNAUnPval,NucRNAExPval))

nucExvUn=ggplot(AllRNAP_nuc, aes(by=Category, x=RNA_P, fill=Category))+ geom_density(alpha=.3) + scale_fill_manual(values=c("red", "blue")) + labs(x="eQTL association pvalue", title="Nuclear apaQTL associations \n in eQTLs analysis") +annotate("text", label="P < .0001", x=.75, y=1.5)+ annotate("text", label="***", x=.75, y=1.4)
bothExOver=plot_grid(totExvUn,nucExvUn)
bothExOver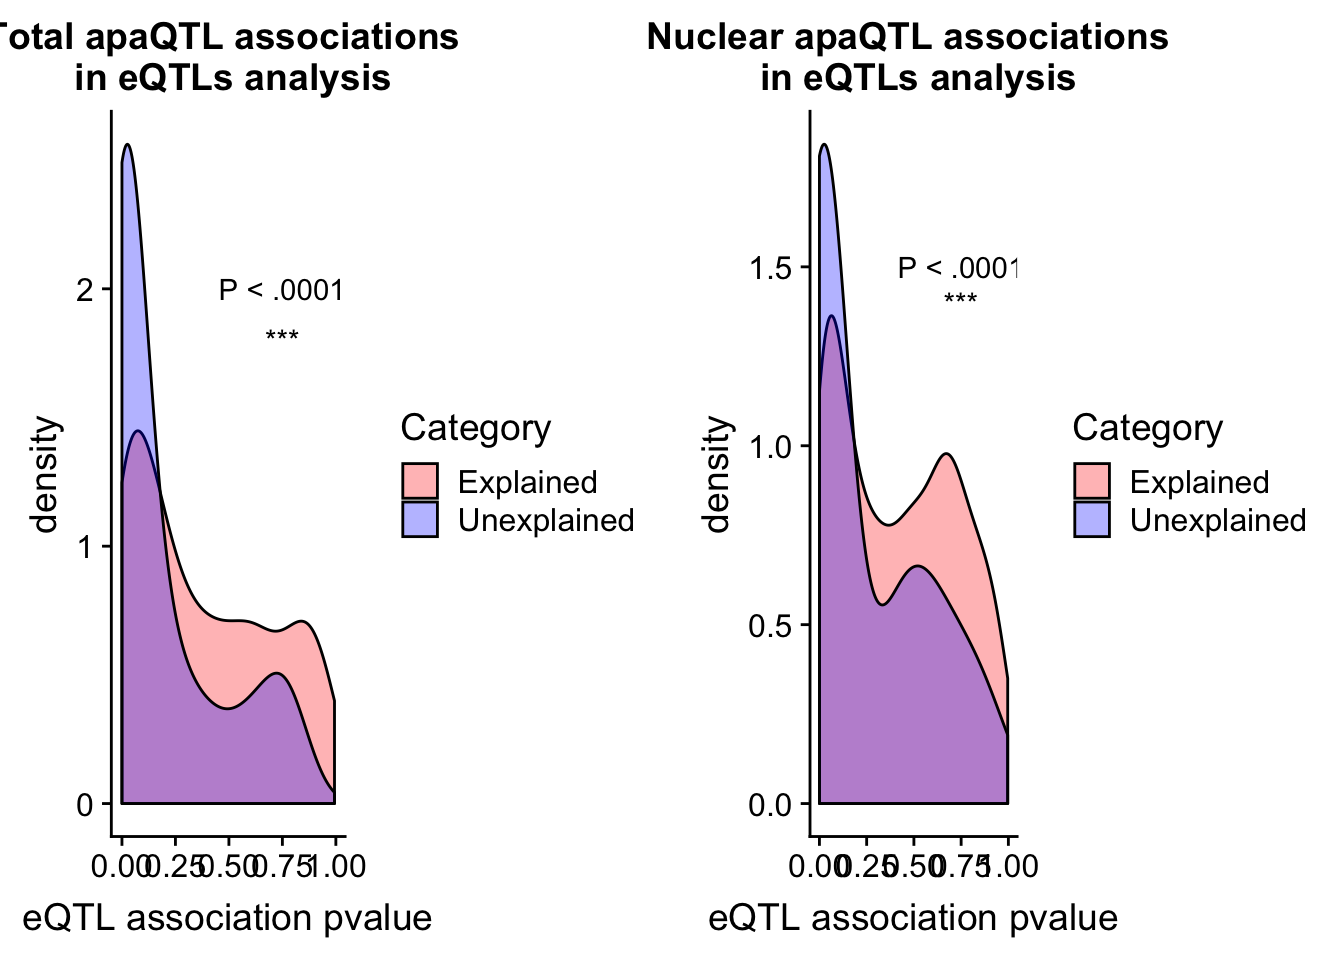
ggsave(bothExOver, file="../output/plots/apaQTLsinExplainedvUnexplainedeQTLs.png", height = 5, width = 10)Try to get pi1 for these analysis:
#TotRNAunpi=pi0est(TotRNAun$RNA_P, pi0.method = "bootstrap",na.rm=T)
TotRNAExpi=pi0est(TotRNAEx$RNA_P, pi0.method = "bootstrap")
1- TotRNAExpi$pi0
[1] 0.2875817NucRNAunpi=pi0est(NucRNAun$RNA_P, pi0.method = "bootstrap")
1-NucRNAunpi$pi0[1] 0.6111111NucRNAExpi=pi0est(NucRNAEx$RNA_P, pi0.method = "bootstrap")
1- TotRNAExpi$pi0[1] 0.2875817Look at significance in a hypergeometric
I will put the number that are less than .1 and those that are more in each set. I will make a 2 by 2 table with exp/unexplained as cols and rows as sig vs not.
- Total
alpha=.05
TotRNAUnPval_sig=TotRNAUnPval %>% filter(RNA_P <=.05) %>% nrow()
TotRNAUnPval_Nsig=TotRNAUnPval %>% filter(RNA_P >.05) %>% nrow()

TotRNAExPval_sig=TotRNAExPval %>% filter(RNA_P <=.05) %>% nrow()
TotRNAExPval_Nsig=TotRNAExPval %>% filter(RNA_P >.05) %>% nrow()

TotalSig=c(TotRNAUnPval_sig,TotRNAExPval_sig)
TotNSig=c(TotRNAUnPval_Nsig,TotRNAExPval_Nsig)

TotalMatrix=rbind(TotalSig,TotNSig )
TotalMatrix
[,1] [,2]
TotalSig 18 45
TotNSig 17 159Lower tail is false because we are asknig if we get more sig than expected
phyper(18,35,204,63, lower.tail = F)[1] 0.000126086- Nuclear
NucRNAUnPval_sig=NucRNAUnPval %>% filter(RNA_P <=.1) %>% nrow()
NucRNAUnPval_Nsig=NucRNAUnPval %>% filter(RNA_P >.1) %>% nrow()

NucRNAExPval_sig=NucRNAExPval %>% filter(RNA_P <=.1) %>% nrow()
NucRNAExPval_Nsig=NucRNAExPval %>% filter(RNA_P >.1) %>% nrow()

NucSig=c(NucRNAUnPval_sig,NucRNAExPval_sig)
NucNSig=c(NucRNAUnPval_Nsig,NucRNAExPval_Nsig)

NucMatrix=rbind(NucSig,NucNSig )
NucMatrix
[,1] [,2]
NucSig 31 110
NucNSig 29 348phyper(31,69,458,141, lower.tail = F)[1] 0.0001318397
sessionInfo()R version 3.5.1 (2018-07-02)
Platform: x86_64-apple-darwin15.6.0 (64-bit)
Running under: macOS 10.14.1
Matrix products: default
BLAS: /Library/Frameworks/R.framework/Versions/3.5/Resources/lib/libRblas.0.dylib
LAPACK: /Library/Frameworks/R.framework/Versions/3.5/Resources/lib/libRlapack.dylib
locale:
[1] en_US.UTF-8/en_US.UTF-8/en_US.UTF-8/C/en_US.UTF-8/en_US.UTF-8
attached base packages:
[1] stats graphics grDevices utils datasets methods base
other attached packages:
[1] bindrcpp_0.2.2 qvalue_2.12.0 cowplot_0.9.3 forcats_0.3.0
[5] stringr_1.4.0 dplyr_0.7.6 purrr_0.2.5 readr_1.1.1
[9] tidyr_0.8.1 tibble_1.4.2 ggplot2_3.0.0 tidyverse_1.2.1
[13] reshape2_1.4.3 workflowr_1.2.0
loaded via a namespace (and not attached):
[1] tidyselect_0.2.4 splines_3.5.1 haven_1.1.2 lattice_0.20-35
[5] colorspace_1.3-2 htmltools_0.3.6 yaml_2.2.0 rlang_0.2.2
[9] pillar_1.3.0 glue_1.3.0 withr_2.1.2 modelr_0.1.2
[13] readxl_1.1.0 bindr_0.1.1 plyr_1.8.4 munsell_0.5.0
[17] gtable_0.2.0 cellranger_1.1.0 rvest_0.3.2 evaluate_0.13
[21] labeling_0.3 knitr_1.20 broom_0.5.0 Rcpp_0.12.19
[25] scales_1.0.0 backports_1.1.2 jsonlite_1.6 fs_1.2.6
[29] hms_0.4.2 digest_0.6.17 stringi_1.2.4 grid_3.5.1
[33] rprojroot_1.3-2 cli_1.0.1 tools_3.5.1 magrittr_1.5
[37] lazyeval_0.2.1 crayon_1.3.4 whisker_0.3-2 pkgconfig_2.0.2
[41] xml2_1.2.0 lubridate_1.7.4 assertthat_0.2.0 rmarkdown_1.11
[45] httr_1.3.1 rstudioapi_0.9.0 R6_2.3.0 nlme_3.1-137
[49] git2r_0.24.0 compiler_3.5.1