Peak Plots
Briana Mittleman
2/16/2019
Last updated: 2019-02-21
Checks: 6 0
Knit directory: threeprimeseq/analysis/
This reproducible R Markdown analysis was created with workflowr (version 1.2.0). The Report tab describes the reproducibility checks that were applied when the results were created. The Past versions tab lists the development history.
Great! Since the R Markdown file has been committed to the Git repository, you know the exact version of the code that produced these results.
Great job! The global environment was empty. Objects defined in the global environment can affect the analysis in your R Markdown file in unknown ways. For reproduciblity it’s best to always run the code in an empty environment.
The command set.seed(12345) was run prior to running the code in the R Markdown file. Setting a seed ensures that any results that rely on randomness, e.g. subsampling or permutations, are reproducible.
Great job! Recording the operating system, R version, and package versions is critical for reproducibility.
Nice! There were no cached chunks for this analysis, so you can be confident that you successfully produced the results during this run.
Great! You are using Git for version control. Tracking code development and connecting the code version to the results is critical for reproducibility. The version displayed above was the version of the Git repository at the time these results were generated.
Note that you need to be careful to ensure that all relevant files for the analysis have been committed to Git prior to generating the results (you can use wflow_publish or wflow_git_commit). workflowr only checks the R Markdown file, but you know if there are other scripts or data files that it depends on. Below is the status of the Git repository when the results were generated:
Ignored files:
    Ignored:    .DS_Store
    Ignored:    .Rhistory
    Ignored:    .Rproj.user/
    Ignored:    analysis/figure/
    Ignored:    data/.DS_Store
    Ignored:    data/perm_QTL_trans_noMP_5percov/
    Ignored:    output/.DS_Store

Untracked files:
    Untracked:  KalistoAbundance18486.txt
    Untracked:  analysis/4suDataIGV.Rmd
    Untracked:  analysis/DirectionapaQTL.Rmd
    Untracked:  analysis/EvaleQTLs.Rmd
    Untracked:  analysis/YL_QTL_test.Rmd
    Untracked:  analysis/ncbiRefSeq_sm.sort.mRNA.bed
    Untracked:  analysis/snake.config.notes.Rmd
    Untracked:  analysis/verifyBAM.Rmd
    Untracked:  analysis/verifybam_dubs.Rmd
    Untracked:  code/PeaksToCoverPerReads.py
    Untracked:  code/strober_pc_pve_heatmap_func.R
    Untracked:  data/18486.genecov.txt
    Untracked:  data/APApeaksYL.total.inbrain.bed
    Untracked:  data/AllPeak_counts/
    Untracked:  data/ApaQTLs/
    Untracked:  data/ApaQTLs_otherPhen/
    Untracked:  data/ChromHmmOverlap/
    Untracked:  data/DistTXN2Peak_genelocAnno/
    Untracked:  data/GM12878.chromHMM.bed
    Untracked:  data/GM12878.chromHMM.txt
    Untracked:  data/LianoglouLCL/
    Untracked:  data/LocusZoom/
    Untracked:  data/LocusZoom_proc/
    Untracked:  data/MatchedSnps/
    Untracked:  data/NuclearApaQTLs.txt
    Untracked:  data/PeakCounts/
    Untracked:  data/PeakCounts_noMP_5perc/
    Untracked:  data/PeakCounts_noMP_genelocanno/
    Untracked:  data/PeakUsage/
    Untracked:  data/PeakUsage_noMP/
    Untracked:  data/PeakUsage_noMP_GeneLocAnno/
    Untracked:  data/PeaksUsed/
    Untracked:  data/PeaksUsed_noMP_5percCov/
    Untracked:  data/QTL_overlap/
    Untracked:  data/RNAkalisto/
    Untracked:  data/RefSeq_annotations/
    Untracked:  data/TotalApaQTLs.txt
    Untracked:  data/Totalpeaks_filtered_clean.bed
    Untracked:  data/UnderstandPeaksQC/
    Untracked:  data/WASP_STAT/
    Untracked:  data/YL-SP-18486-T-combined-genecov.txt
    Untracked:  data/YL-SP-18486-T_S9_R1_001-genecov.txt
    Untracked:  data/YL_QTL_test/
    Untracked:  data/apaExamp/
    Untracked:  data/apaExamp_proc/
    Untracked:  data/apaQTL_examp_noMP/
    Untracked:  data/bedgraph_peaks/
    Untracked:  data/bin200.5.T.nuccov.bed
    Untracked:  data/bin200.Anuccov.bed
    Untracked:  data/bin200.nuccov.bed
    Untracked:  data/clean_peaks/
    Untracked:  data/comb_map_stats.csv
    Untracked:  data/comb_map_stats.xlsx
    Untracked:  data/comb_map_stats_39ind.csv
    Untracked:  data/combined_reads_mapped_three_prime_seq.csv
    Untracked:  data/diff_iso_GeneLocAnno/
    Untracked:  data/diff_iso_proc/
    Untracked:  data/diff_iso_trans/
    Untracked:  data/ensemble_to_genename.txt
    Untracked:  data/example_gene_peakQuant/
    Untracked:  data/explainProtVar/
    Untracked:  data/filtPeakOppstrand_cov_noMP_GeneLocAnno_5perc/
    Untracked:  data/filtered_APApeaks_merged_allchrom_refseqTrans.closest2End.bed
    Untracked:  data/filtered_APApeaks_merged_allchrom_refseqTrans.closest2End.noties.bed
    Untracked:  data/first50lines_closest.txt
    Untracked:  data/gencov.test.csv
    Untracked:  data/gencov.test.txt
    Untracked:  data/gencov_zero.test.csv
    Untracked:  data/gencov_zero.test.txt
    Untracked:  data/gene_cov/
    Untracked:  data/joined
    Untracked:  data/leafcutter/
    Untracked:  data/merged_combined_YL-SP-threeprimeseq.bg
    Untracked:  data/molPheno_noMP/
    Untracked:  data/mol_overlap/
    Untracked:  data/mol_pheno/
    Untracked:  data/nom_QTL/
    Untracked:  data/nom_QTL_opp/
    Untracked:  data/nom_QTL_trans/
    Untracked:  data/nuc6up/
    Untracked:  data/nuc_10up/
    Untracked:  data/other_qtls/
    Untracked:  data/pQTL_otherphen/
    Untracked:  data/peakPerRefSeqGene/
    Untracked:  data/perm_QTL/
    Untracked:  data/perm_QTL_GeneLocAnno_noMP_5percov/
    Untracked:  data/perm_QTL_GeneLocAnno_noMP_5percov_3UTR/
    Untracked:  data/perm_QTL_diffWindow/
    Untracked:  data/perm_QTL_opp/
    Untracked:  data/perm_QTL_trans/
    Untracked:  data/perm_QTL_trans_filt/
    Untracked:  data/protAndAPAAndExplmRes.Rda
    Untracked:  data/protAndAPAlmRes.Rda
    Untracked:  data/protAndExpressionlmRes.Rda
    Untracked:  data/reads_mapped_three_prime_seq.csv
    Untracked:  data/smash.cov.results.bed
    Untracked:  data/smash.cov.results.csv
    Untracked:  data/smash.cov.results.txt
    Untracked:  data/smash_testregion/
    Untracked:  data/ssFC200.cov.bed
    Untracked:  data/temp.file1
    Untracked:  data/temp.file2
    Untracked:  data/temp.gencov.test.txt
    Untracked:  data/temp.gencov_zero.test.txt
    Untracked:  data/threePrimeSeqMetaData.csv
    Untracked:  data/threePrimeSeqMetaData55Ind.txt
    Untracked:  data/threePrimeSeqMetaData55Ind.xlsx
    Untracked:  data/threePrimeSeqMetaData55Ind_noDup.txt
    Untracked:  data/threePrimeSeqMetaData55Ind_noDup.xlsx
    Untracked:  data/threePrimeSeqMetaData55Ind_noDup_WASPMAP.txt
    Untracked:  data/threePrimeSeqMetaData55Ind_noDup_WASPMAP.xlsx
    Untracked:  output/deeptools_plots/
    Untracked:  output/picard/
    Untracked:  output/plots/
    Untracked:  output/qual.fig2.pdf

Unstaged changes:
    Modified:   analysis/28ind.peak.explore.Rmd
    Modified:   analysis/CompareLianoglouData.Rmd
    Modified:   analysis/NewPeakPostMP.Rmd
    Modified:   analysis/apaQTLoverlapGWAS.Rmd
    Modified:   analysis/cleanupdtseq.internalpriming.Rmd
    Modified:   analysis/coloc_apaQTLs_protQTLs.Rmd
    Modified:   analysis/dif.iso.usage.leafcutter.Rmd
    Modified:   analysis/diffIsoAnalysisNewMapping.Rmd
    Modified:   analysis/diff_iso_pipeline.Rmd
    Modified:   analysis/explainpQTLs.Rmd
    Modified:   analysis/explore.filters.Rmd
    Modified:   analysis/flash2mash.Rmd
    Modified:   analysis/mispriming_approach.Rmd
    Modified:   analysis/overlapMolQTL.Rmd
    Modified:   analysis/overlapMolQTL.opposite.Rmd
    Modified:   analysis/overlap_qtls.Rmd
    Modified:   analysis/peakOverlap_oppstrand.Rmd
    Modified:   analysis/peakQCPPlots.Rmd
    Modified:   analysis/pheno.leaf.comb.Rmd
    Modified:   analysis/pipeline_55Ind.Rmd
    Modified:   analysis/swarmPlots_QTLs.Rmd
    Modified:   analysis/test.max2.Rmd
    Modified:   analysis/test.smash.Rmd
    Modified:   analysis/understandPeaks.Rmd
    Modified:   code/Snakefile
Note that any generated files, e.g. HTML, png, CSS, etc., are not included in this status report because it is ok for generated content to have uncommitted changes.
These are the previous versions of the R Markdown and HTML files. If you’ve configured a remote Git repository (see ?wflow_git_remote), click on the hyperlinks in the table below to view them.
| File | Version | Author | Date | Message |
|---|---|---|---|---|
| Rmd | 3fea87f | Briana Mittleman | 2019-02-21 | add pi plot |
| html | 031978b | Briana Mittleman | 2019-02-20 | Build site. |
| Rmd | 11f0bee | Briana Mittleman | 2019-02-20 | modify dT |
| html | a39ad03 | Briana Mittleman | 2019-02-20 | Build site. |
| Rmd | e07197b | Briana Mittleman | 2019-02-20 | fix strands |
| html | a4fd0e0 | Briana Mittleman | 2019-02-19 | Build site. |
| Rmd | d3a76f3 | Briana Mittleman | 2019-02-19 | fix link |
| html | 69dfcbc | Briana Mittleman | 2019-02-18 | Build site. |
| Rmd | af9929e | Briana Mittleman | 2019-02-18 | rna alone |
| html | d27ed26 | Briana Mittleman | 2019-02-18 | Build site. |
| Rmd | f0cf945 | Briana Mittleman | 2019-02-18 | add deeptools plot code |
| html | 879be33 | Briana Mittleman | 2019-02-16 | Build site. |
| Rmd | f8c76ea | Briana Mittleman | 2019-02-16 | move peak QC plots |
library(workflowr)This is workflowr version 1.2.0
Run ?workflowr for help getting startedlibrary(tidyverse)── Attaching packages ──────────────────────────────────────────────────────────────────────────── tidyverse 1.2.1 ──✔ ggplot2 3.0.0 ✔ purrr 0.2.5
✔ tibble 1.4.2 ✔ dplyr 0.7.6
✔ tidyr 0.8.1 ✔ stringr 1.4.0
✔ readr 1.1.1 ✔ forcats 0.3.0Warning: package 'stringr' was built under R version 3.5.2── Conflicts ─────────────────────────────────────────────────────────────────────────────── tidyverse_conflicts() ──
✖ dplyr::filter() masks stats::filter()
✖ dplyr::lag() masks stats::lag()library(reshape2)
Attaching package: 'reshape2'The following object is masked from 'package:tidyr':
smithslibrary(cowplot)
Attaching package: 'cowplot'The following object is masked from 'package:ggplot2':
ggsaveI want to remake a lot of the peak QC plots I have been making with the new mapped and proccessed data created in the accounting for mappping bias analysis
Peaks per gene
Number of genes with 1 peak, 2 peaks, more peaks
Distance between gene and TES
Peaks in each category
Peak Size
Peak per gene:
I will do this for total and nuclear 5% seperatly then for the peaks I used in the QTL analysis.
Nuclear peaks: 42127: /project2/gilad/briana/threeprimeseq/data/phenotypes_filtPeakTranscript_noMP_GeneLocAnno/filtered_APApeaks_merged_allchrom_refseqGenes.GeneLocAnno.NoMP_sm_quant.Nuclear_fixed.pheno.5percPeaks.txt
Total peaks: 36915: /project2/gilad/briana/threeprimeseq/data/phenotypes_filtPeakTranscript_noMP_GeneLocAnno/filtered_APApeaks_merged_allchrom_refseqGenes.GeneLocAnno.NoMP_sm_quant.Total_fixed.pheno.5percPeaks.txt
peakNames=c("chr", 'start','end','gene','strand','name', 'mean')
totalPeaks=read.table("../data/PeaksUsed_noMP_5percCov/filtered_APApeaks_merged_allchrom_refseqGenes.GeneLocAnno.NoMP_sm_quant.Total_fixed.pheno.5percPeaks.txt", stringsAsFactors = F, col.names = peakNames)
nuclearPeaks=read.table("../data/PeaksUsed_noMP_5percCov/filtered_APApeaks_merged_allchrom_refseqGenes.GeneLocAnno.NoMP_sm_quant.Nuclear_fixed.pheno.5percPeaks.txt", stringsAsFactors = F, col.names = peakNames)
Peaks per gene:
totalPeaks_genes=totalPeaks %>% group_by(gene) %>% summarise(nPeaks=n()) %>% group_by(nPeaks) %>% summarise(GenesWithNPeaks=n())
nuclearPeaks_genes=nuclearPeaks %>% group_by(gene) %>% summarise(nPeaks=n())%>% group_by(nPeaks) %>% summarise(GenesWithNPeaks=n())

nPeaksBoth=totalPeaks_genes %>% full_join(nuclearPeaks_genes, by="nPeaks")

colnames(nPeaksBoth)= c("Npeaks", "Total", "Nuclear")
nPeaksBoth$Total= nPeaksBoth$Total %>% replace_na(0)

#melt nPeaksBoth
nPeaksBoth_melt=melt(nPeaksBoth, id.var="Npeaks")
colnames(nPeaksBoth_melt)= c("PAS", "Fraction", "Genes")

peakUsage5perc=ggplot(nPeaksBoth_melt, aes(x=PAS, y=Genes, fill=Fraction)) + geom_bar(stat="identity", position = "dodge") + labs(title="Number of Genes by PAS Number \n 5% Usage",x="Number of PAS in Gene") + theme(axis.text.y = element_text(size=12),axis.title.y=element_text(size=10,face="bold"), axis.title.x=element_text(size=12,face="bold"))+ scale_fill_manual(values=c("darkviolet","deepskyblue3"))  + facet_grid(~Fraction)

peakUsage5perc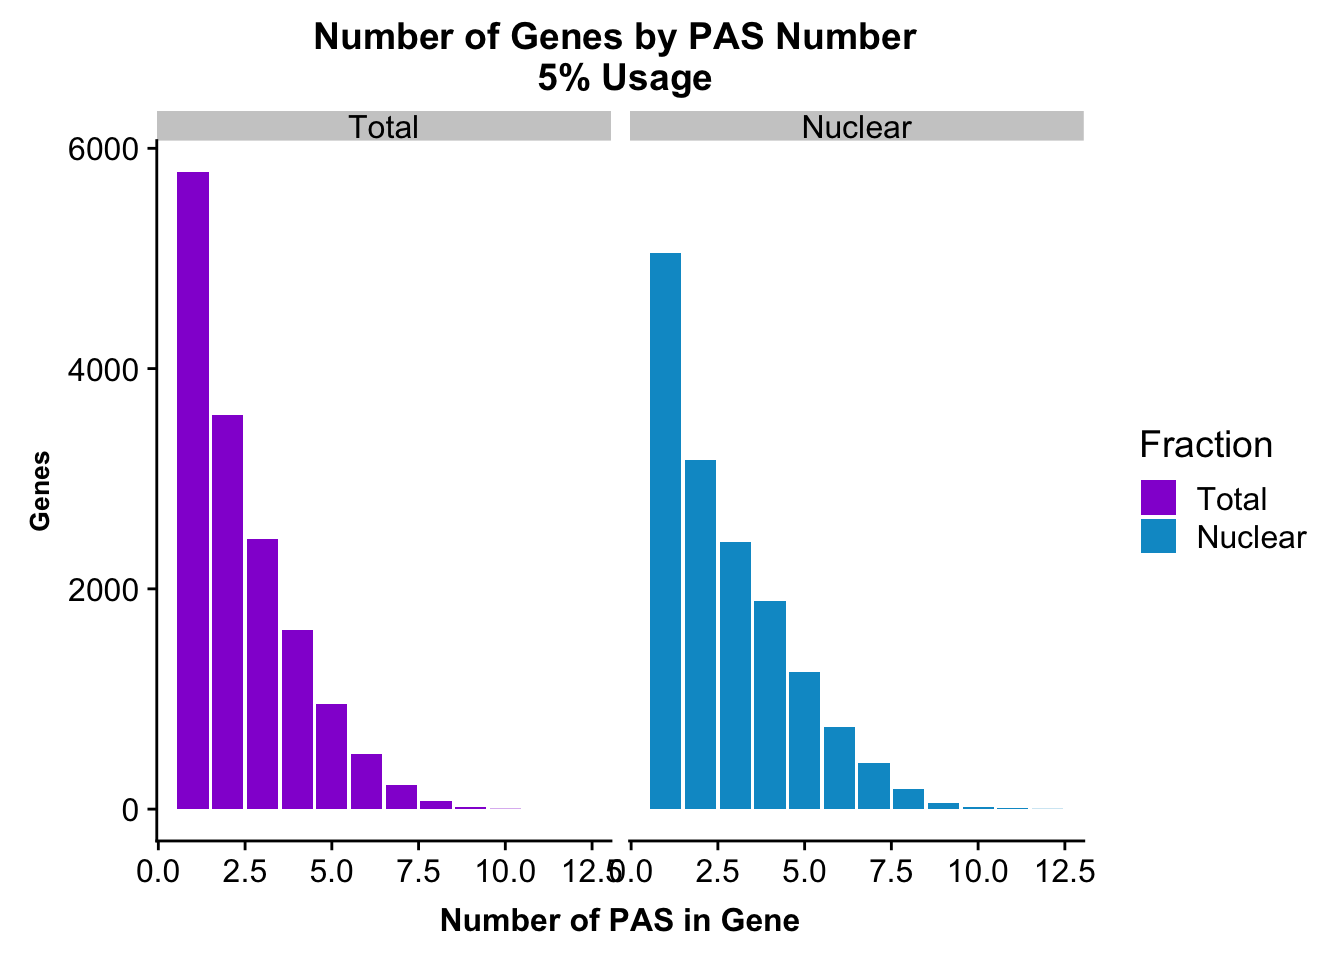
| Version | Author | Date |
|---|---|---|
| 879be33 | Briana Mittleman | 2019-02-16 |
ggsave(peakUsage5perc, file="../output/plots/PeakNumberPerGenebyFrac.png")Saving 7 x 5 in imagePlot this with the peaks used in the fraction
allPeaks=read.table("../data/PeaksUsed_noMP_5percCov/Filtered_APApeaks_merged_allchrom_noMP.sort.named.noCHR_geneLocParsed.5percCov.bed", stringsAsFactors = F, col.names = c("chr", 'start','end', 'id', 'score', 'strand')) %>% separate(id, into=c("gene", "peak"), sep=":")%>% group_by(gene) %>% summarise(nPeaks=n()) %>% group_by(nPeaks) %>% summarise(GenesWithNPeaks=n())

colnames(allPeaks)=c("PAS","Genes" )

allPeaksGenes=ggplot(allPeaks, aes(x=PAS, y=Genes)) + geom_bar(stat="identity",fill="blue") + labs(title="Number of Genes by PAS Count: \n PAS Used in QTL analysis",x="Number of PAS in Gene") + theme(axis.text.y = element_text(size=12),axis.title.y=element_text(size=10,face="bold"), axis.title.x=element_text(size=12,face="bold"))

allPeaksGenes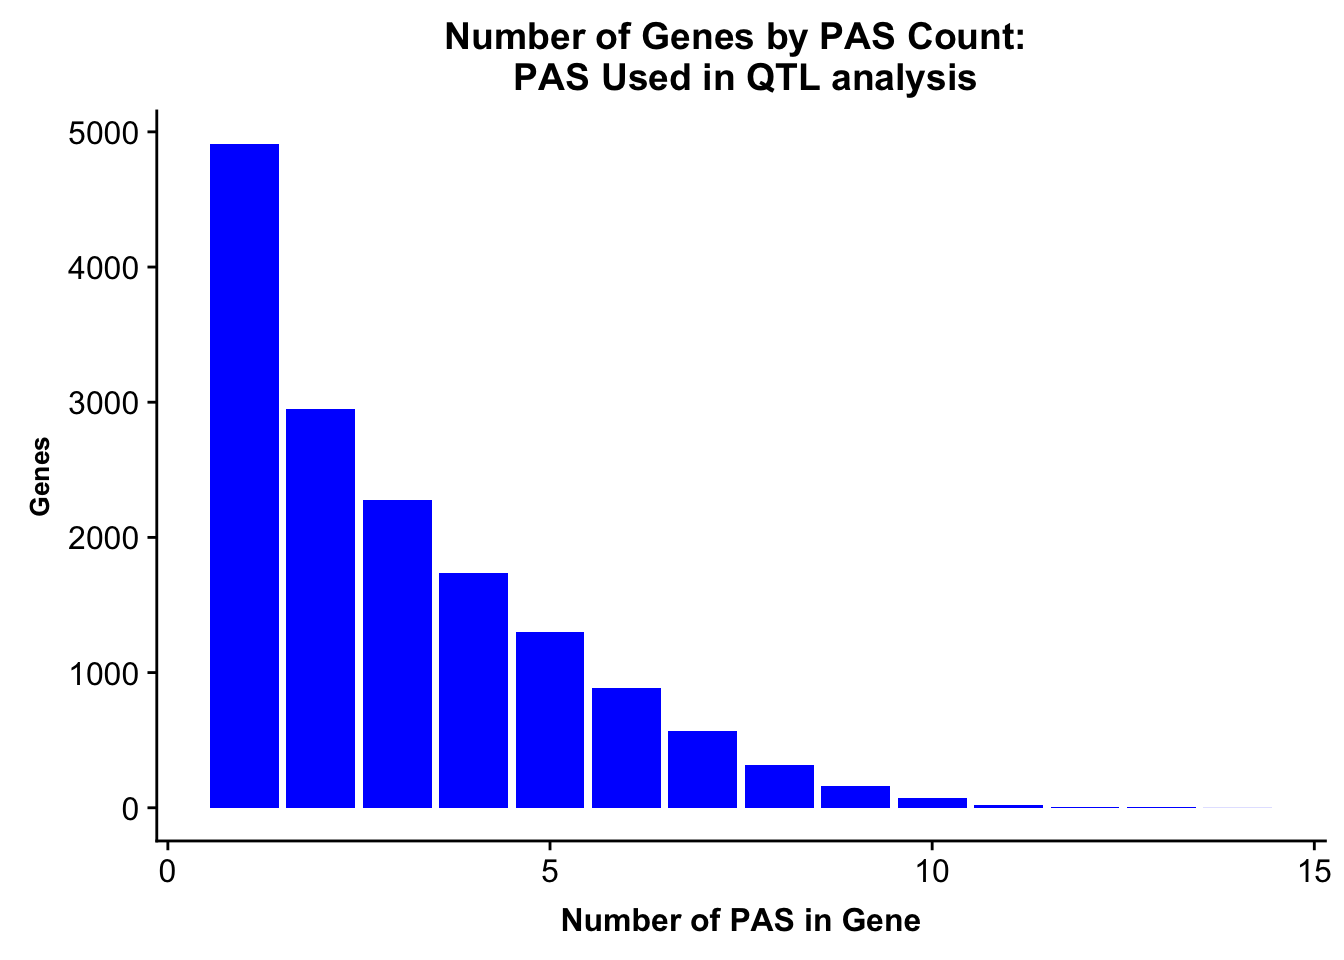
| Version | Author | Date |
|---|---|---|
| 879be33 | Briana Mittleman | 2019-02-16 |
ggsave(allPeaksGenes, file="../output/plots/PeakNumberPerGeneUsedinQTL.png")Saving 7 x 5 in imageNumber of genes with 1 peak, 2 peaks, more peaks
Make this as a boxplot
GeneAnno=read.table("../data/RefSeq_annotations/Transcript2GeneName.dms", stringsAsFactors = F, header=T) %>% select(name2) %>%  unique()
colnames(GeneAnno)="gene"
genesWithpeak= read.table("../data/PeaksUsed_noMP_5percCov/Filtered_APApeaks_merged_allchrom_noMP.sort.named.noCHR_geneLocParsed.5percCov.bed", stringsAsFactors = F, col.names = c("chr", 'start','end', 'id', 'score', 'strand')) %>% separate(id, into=c("gene", "peak"), sep=":") %>% select(gene) %>% unique()

Geneswith0= GeneAnno %>% anti_join(genesWithpeak, by="gene") %>% nrow()
Geneswith0
[1] 11896To get the genes with 0 peaks I need to pull in the gene annotation file
morethan2= allPeaks %>% filter(PAS > 2)
colSums(morethan2)
PAS Genes
102 7361 Category=c("0 PAS", "1 PAS", "2 PAS", "More than 2 PAS")
genesPerCat=c(11896/27115, 4909/27115, 2949/27115, 7361/27115)
genesPerCat_df=as.data.frame(cbind(Category,genesPerCat))
genesPerCat_df$genesPerCat=as.numeric(as.character(genesPerCat_df$genesPerCat))
lab0=paste("Genes =", "11896", sep=" ")
lab1=paste("Genes =", "4909", sep=" ")
lab2=paste("Genes =", "2949", sep=" ")
labMore=paste("Genes =", "7361", sep=" ")
propGenesbyPAS=ggplot(genesPerCat_df, aes(x="", y=genesPerCat, fill=Category)) + geom_bar(stat="identity") + labs(x="Total Genes = 27115", y="Proportion of Genes", title="Proportion of Genes by number of PAS") + annotate("text", x="", y= .7, label=lab0) + annotate("text", x="", y= .5, label=lab1) + annotate("text", x="", y= .33, label=lab2) + annotate("text", x="", y= .2, label=labMore) + scale_fill_brewer(palette="RdYlBu")
propGenesbyPAS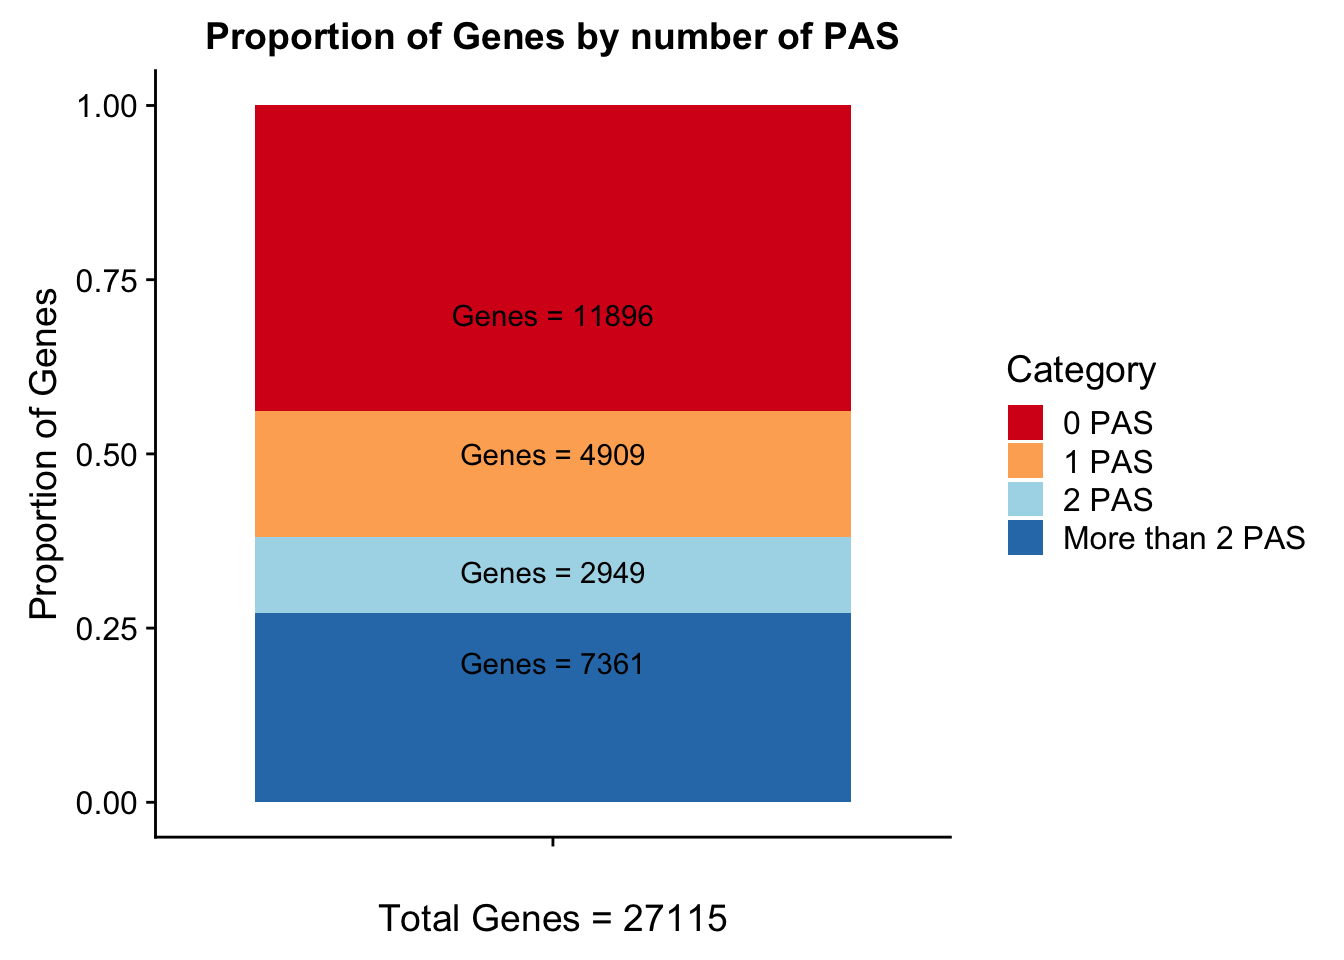
| Version | Author | Date |
|---|---|---|
| 879be33 | Briana Mittleman | 2019-02-16 |
ggsave(propGenesbyPAS, file="../output/plots/PropOfGenesByPASnum.png",height=8, width=5)Box plot
propGenesbyPASpi=ggplot(genesPerCat_df, aes(x="", y=genesPerCat, fill=Category)) + geom_bar(stat="identity") + labs(x="Total Genes = 27115", y="Proportion of Genes", title="Proportion of Genes by number of PAS") +coord_polar("y")  +  scale_fill_brewer(palette="RdYlBu")

propGenesbyPASpi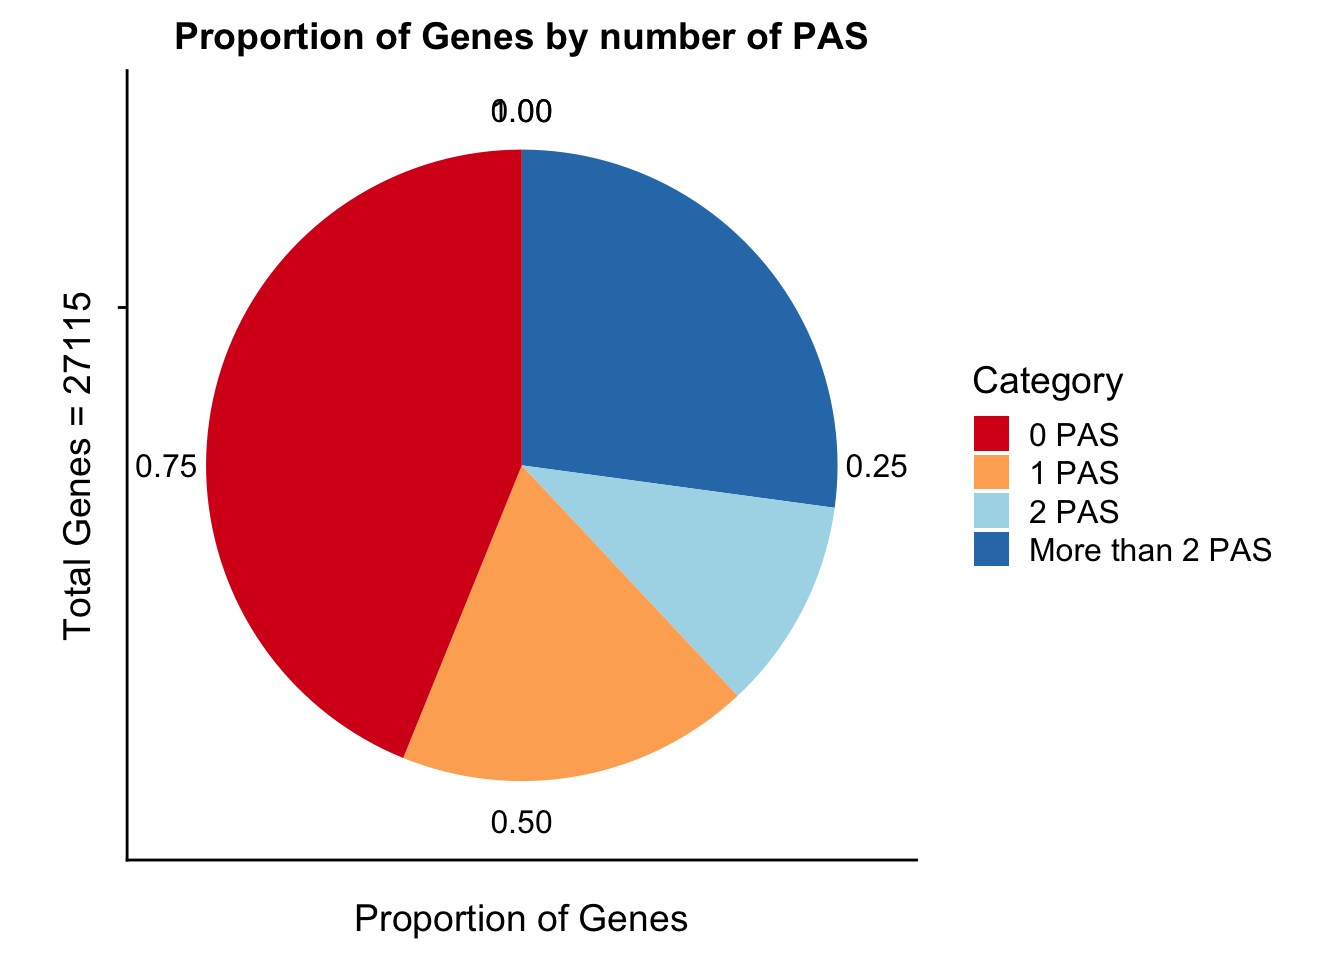
ggsave(propGenesbyPASpi, file="../output/plots/PropOfGenesByPASnum_piplot.png")Saving 7 x 5 in imageDistance between TES and peak
- GetDistTXNend2Peak.py
convert /project2/gilad/briana/threeprimeseq/data/mergedPeaks_noMP_GeneLoc/Filtered_APApeaks_merged_allchrom_noMP.sort.named.noCHR_geneLocParsed.5percCov.SAF to bed file
peaksGeneLocAnno_5percSAF2Bed.py
distTXN2Peak=read.table("../data/DistTXN2Peak_genelocAnno/distPeak2EndTXN.txt", col.names = c("Peak", "name2", "Distance", "Gene_Strand"),stringsAsFactors = F)
txnanno=read.table("../data/RefSeq_annotations/Transcript2GeneName.dms", header=T,stringsAsFactors = F) %>% mutate(length=abs(txEnd-txStart)) %>% semi_join(distTXN2Peak, by="name2")
distTXN2Peak =distTXN2Peak %>% mutate(AbsDist=abs(Distance))
mean(txnanno$length)
[1] 60808.79distTXN2PeakPlot=ggplot(distTXN2Peak, aes(x=AbsDist + 1)) + geom_density() + scale_x_log10() + labs(x="Absolute Distance between end of Transcription and center of Peak", title="Distribution of transcription to peak absolute distance") + geom_vline(xintercept=mean(txnanno$length), col="red") + annotate("text", x=1000000, y=.4, label="Average transcript length \n for genes in peaks", col='red')
distTXN2PeakPlot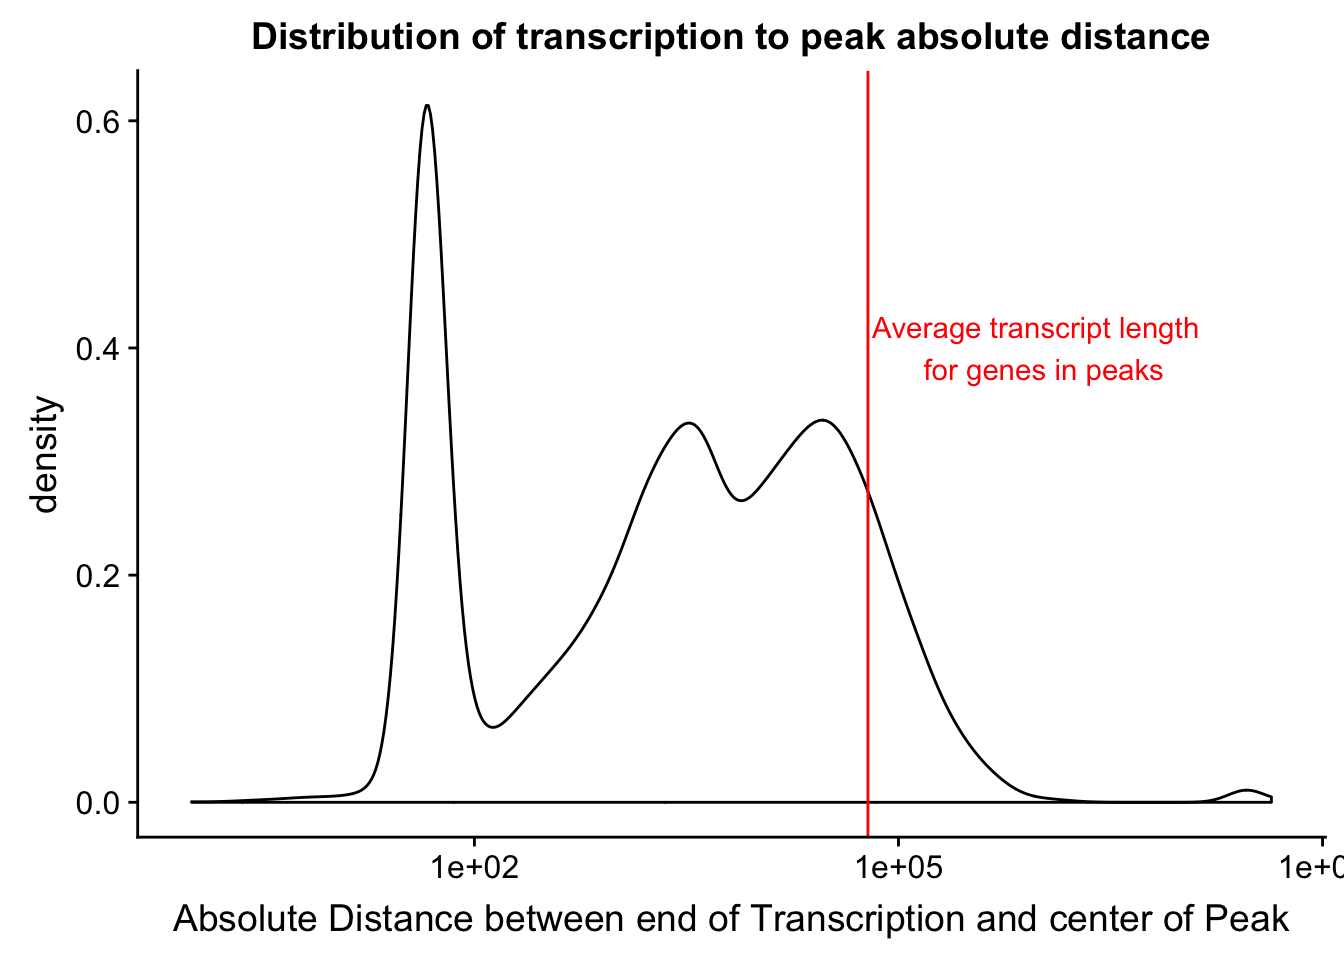
ggsave(distTXN2PeakPlot, file="../output/plots/DistanceBetweenPeakandTES.png")Saving 7 x 5 in imagePeaks per category
- processGenLocPeakAnno2SAF_withAnno.py
- filternamePeaks5percCov_GeneLocAnno_withAnno.py
peakswAnno=read.table("../data/PeaksUsed_noMP_5percCov/Filtered_APApeaks_merged_allchrom_noMP.sort.named.noCHR_geneLocParsed.5percCov_withAnno.SAF", header=T) %>% separate(GeneID, into=c("Peak", "chrom", "start", "end", "strand", "gene", "loc"),sep=":") %>% select(Peak, loc) %>% group_by(loc) %>% summarise(Num=n())locationOfPeaks=ggplot(peakswAnno, aes(x=loc, y=Num)) + geom_bar(stat="identity", fill="blue") + labs(x="Gene Location", y="Number of Peaks", title="Location distribution for all PAS with 5% Usage")
locationOfPeaks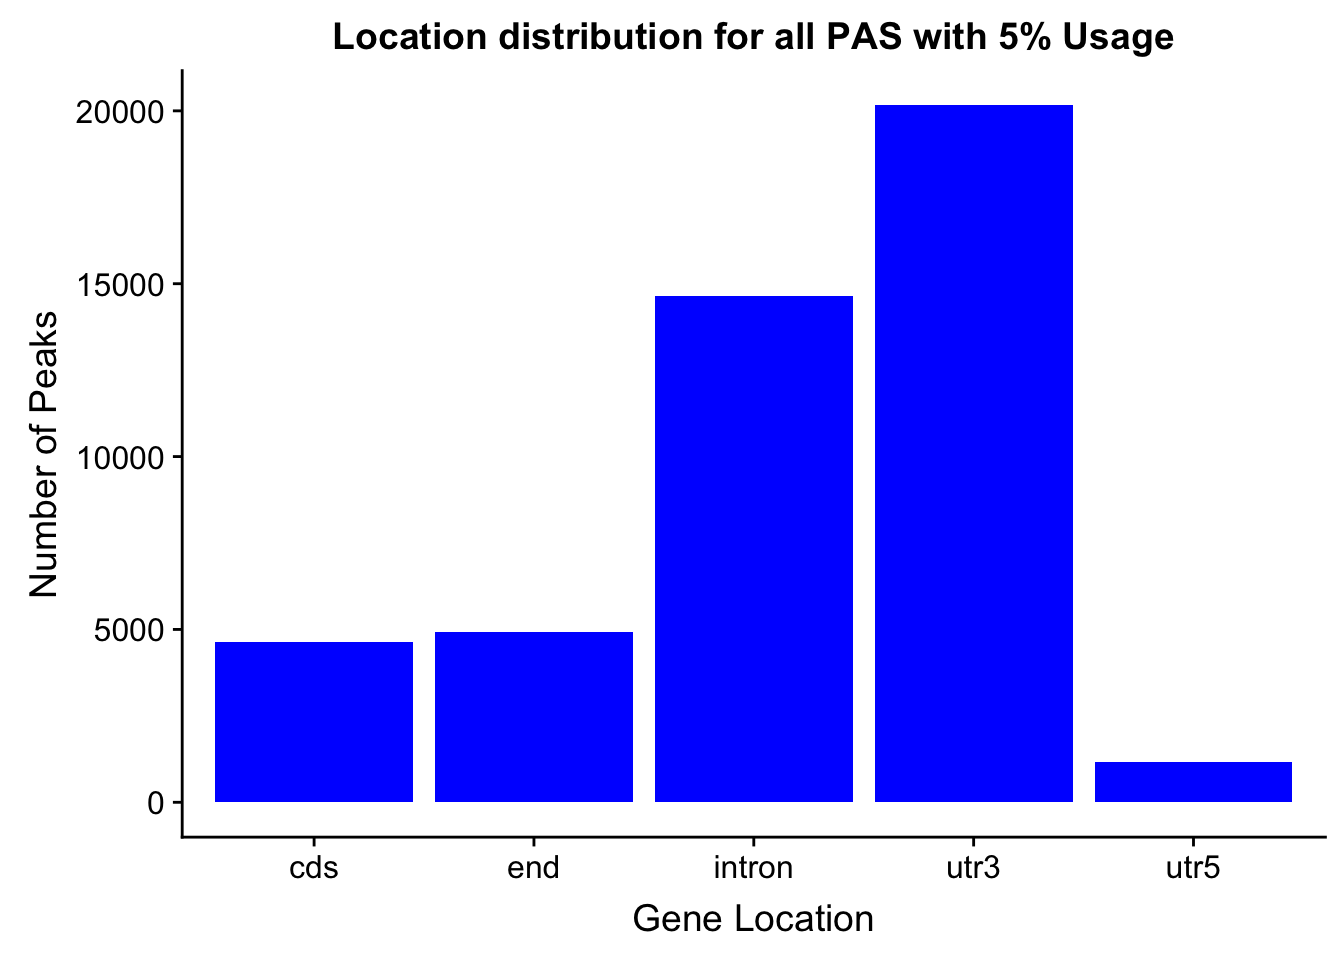
ggsave(locationOfPeaks, file="../output/plots/PeakLocationByAnnotation.png")Saving 7 x 5 in imagePeak Size
Peak length:
peaks=read.table("../data/PeaksUsed_noMP_5percCov/Filtered_APApeaks_merged_allchrom_noMP.sort.named.noCHR_geneLocParsed.5percCov.bed",col.names=c("chr", 'start','end', 'peak', 'score', 'strand')) %>% mutate(length=end-start)ggplot(peaks,aes(x=length)) + geom_histogram(bins=300) + labs(title="Peak Size", x="number of basepairs") + geom_vline(xintercept =mean(peaks$length),col="red")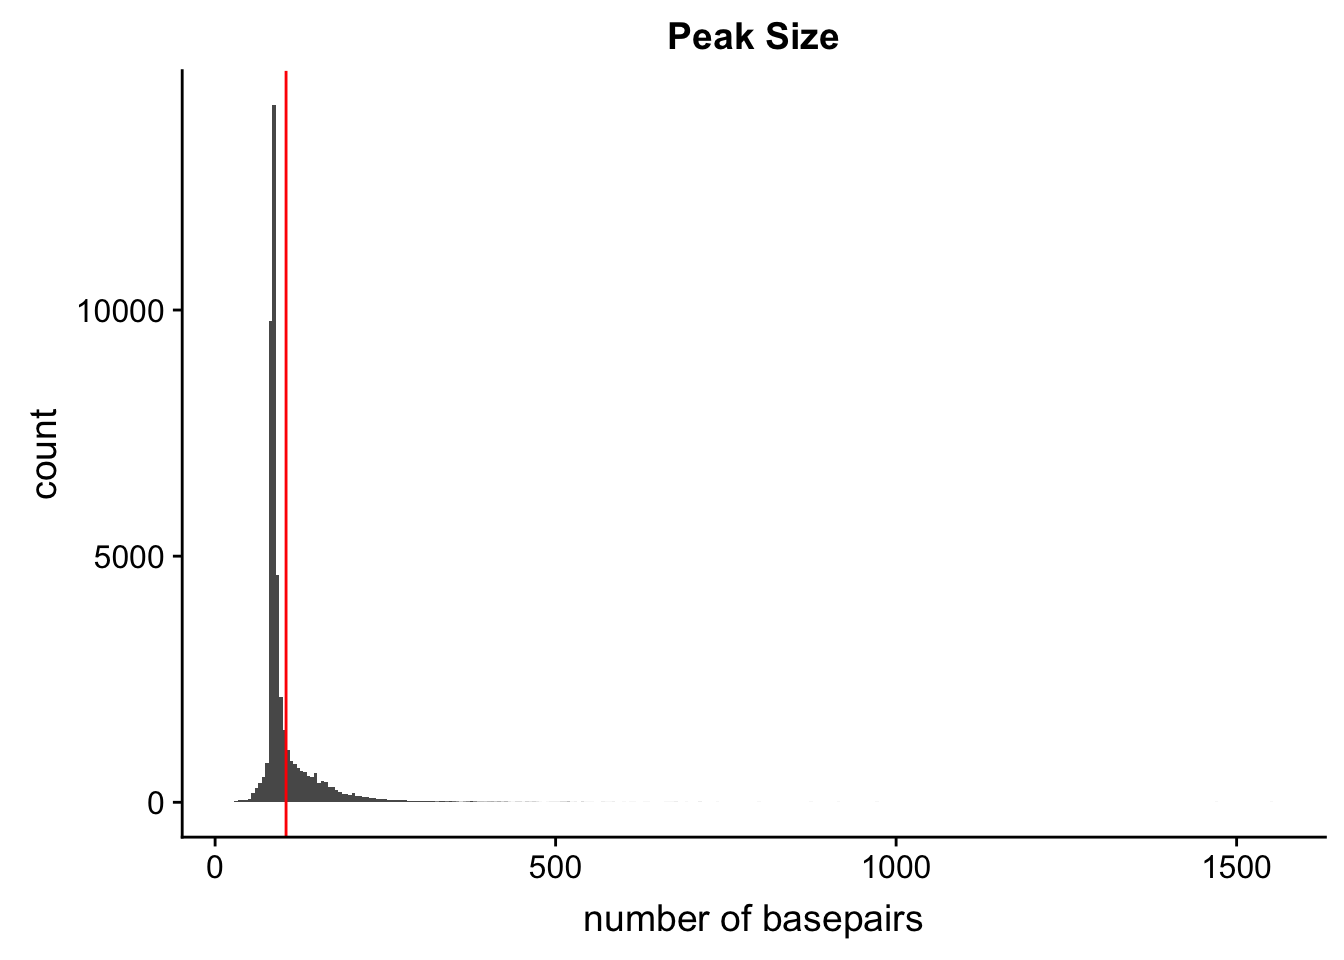
Deep tools:
files to remake:
Merged bam files are in /project2/gilad/briana/threeprimeseq/data/mergedBams_NoMP
Code is mergeBam2BW.sh
mergeBam2BW.sh
#!/bin/bash

#SBATCH --job-name=mergeBam2B
#SBATCH --account=pi-yangili1
#SBATCH --time=24:00:00
#SBATCH --output=mergeBam2BW.out
#SBATCH --error=mergeBam2BW.err
#SBATCH --partition=bigmem2
#SBATCH --mem=100G
#SBATCH --mail-type=END

module load Anaconda3
source activate three-prime-env

#total
bamCoverage -b /project2/gilad/briana/threeprimeseq/data/mergedBams_NoMP/AllTotalSamples.MergedBamFiles.noMP.sort.bam -o /project2/gilad/briana/threeprimeseq/data/mergedBW/Total_MergedBamCoverage.bw

#nuclear
bamCoverage -b /project2/gilad/briana/threeprimeseq/data/mergedBams_NoMP/AllNuclearSamples.MergedBamFiles.noMP.sort.bam -o /project2/gilad/briana/threeprimeseq/data/mergedBW/Nuclear_MergedBamCoverage.bw
I need to remake the peak files with the strand opposite (peaks are opposite strand from the reads!)
fixStrand4DTplots.py
peaksIn="/project2/gilad/briana/threeprimeseq/data/mergedPeaks_noMP_GeneLoc/Filtered_APApeaks_merged_allchrom_noMP.sort.named.noCHR_geneLocParsed.5percCov.bed"
intronIn="/project2/gilad/briana/threeprimeseq/data/mergedPeaks_noMP_GeneLoc/Filtered_APApeaks_merged_allchrom_noMP.sort.named.noCHR_geneLocParsed_5percCov_INTRON.bed"
PeakOut="/project2/gilad/briana/threeprimeseq/data/peaks4DT/APAPeaks_5percCov_fixedStrand.bed"
intronOut="/project2/gilad/briana/threeprimeseq/data/peaks4DT/APAPeaks_5percCov_fixedStrand_INTRON.bed"


def fix_strand(Fin,Fout):
    fout=open(Fout,"w")
    for ln in open(Fin, "r"):
        chrom, start, end, name, score, strand = ln.split()
        if strand=="+":
            fout.write("%s\t%s\t%s\t%s\t%s\t-\n"%(chrom,start,end,name,score))
        else:
            fout.write("%s\t%s\t%s\t%s\t%s\t+\n"%(chrom,start,end,name,score))
    fout.close()


fix_strand(peaksIn, PeakOut)
fix_strand(intronIn, intronOut)
/project2/gilad/briana/threeprimeseq/data/mergedPeaks_noMP_GeneLoc/Filtered_APApeaks_merged_allchrom_noMP.sort.named.noCHR_geneLocParsed.5percCov.bed
/project2/gilad/briana/threeprimeseq/data/mergedPeaks_noMP_GeneLoc/Filtered_APApeaks_merged_allchrom_noMP.sort.named.noCHR_geneLocParsed_5percCov_INTRON.bed
BothFracDTPlotmyPeaks_noMPFilt.sh
#!/bin/bash

#SBATCH --job-name=BothFracDTPlotmyPeaks_noMPFilt
#SBATCH --account=pi-yangili1
#SBATCH --time=24:00:00
#SBATCH --output=BothFracDTPlotmyPeaks_noMPFilt.out
#SBATCH --error=BothFracDTPlotmyPeaks_noMPFilt.err
#SBATCH --partition=bigmem2
#SBATCH --mem=100G
#SBATCH --mail-type=END

module load Anaconda3
source activate three-prime-env


computeMatrix reference-point -S /project2/gilad/briana/threeprimeseq/data/mergedBW/Total_MergedBamCoverage.bw /project2/gilad/briana/threeprimeseq/data/mergedBW/Nuclear_MergedBamCoverage.bw -R /project2/gilad/briana/threeprimeseq/data/peaks4DT/APAPeaks_5percCov_fixedStrand.bed -b 1000 -a 1000  -out /project2/gilad/briana/threeprimeseq/data/LianoglouDeepTools/BothFrac_myPeaksNompfilt.gz

plotHeatmap --sortRegions descend -m /project2/gilad/briana/threeprimeseq/data/LianoglouDeepTools/BothFrac_myPeaksNompfilt.gz --refPointLabel "Called PAS" --plotTitle "Combined Reads at All Called PAS" --heatmapHeight 7 --colorMap YlGnBu  -out /project2/gilad/briana/threeprimeseq/data/LianoglouDeepTools/BothFrac_myPeaksNompfilt.png
RNADTPlotmyPeaks_noMPFilt.sh
#!/bin/bash

#SBATCH --job-name=RNADTPlotmyPeaks_noMPFilt
#SBATCH --account=pi-yangili1
#SBATCH --time=24:00:00
#SBATCH --output=RNADTPlotmyPeaks_noMPFilt.out
#SBATCH --error=RNADTPlotmyPeaks_noMPFilt.err
#SBATCH --partition=bigmem2
#SBATCH --mem=100G
#SBATCH --mail-type=END

module load Anaconda3
source activate three-prime-env


computeMatrix reference-point -S /project2/gilad/briana/threeprimeseq/data/rnaseq_bw/RNAseqGeuvadis_STAR_6samp_MergedBams.sort.bw -R /project2/gilad/briana/threeprimeseq/data/peaks4DT/APAPeaks_5percCov_fixedStrand.bed -b 1000 -a 1000  -out /project2/gilad/briana/threeprimeseq/data/LianoglouDeepTools/RNA_myPeaksNompfilt.gz

plotHeatmap --sortRegions descend -m /project2/gilad/briana/threeprimeseq/data/LianoglouDeepTools/RNA_myPeaksNompfilt.gz --refPointLabel "Called PAS" --plotTitle "Combined Reads at All Called PAS" --heatmapHeight 7 --colorMap YlGnBu  -out /project2/gilad/briana/threeprimeseq/data/LianoglouDeepTools/RNA_myPeaksNompfilt.png
I want to make one of these that look at total, nuclear, and RNA at peaks assigned to an intron. This means I need to subset the peak file to only include these. I can do this similar to how I did the UTR subset in this analysis
I want to make a bedfile with these peaks. I need to also make sure they are in the final clean peaks
makeIntronPeakBed.py
inFile="/project2/gilad/briana/threeprimeseq/data/mergedPeaks_noMP_GeneLoc/Filtered_APApeaks_merged_allchrom_noMP.sort.named.noCHR_geneLoc.bed"
outFile=open("/project2/gilad/briana/threeprimeseq/data/mergedPeaks_noMP_GeneLoc/Filtered_APApeaks_merged_allchrom_noMP.sort.named.noCHR_geneLocParsed_5percCov_INTRON.bed" , "w")
okPeaks=open("/project2/gilad/briana/threeprimeseq/data/mergedPeaks_noMP_GeneLoc/Filtered_APApeaks_merged_allchrom_noMP.sort.named.noCHR_geneLocParsed.5percCov.bed", "r")


okPeak_dic={}
for ln in okPeaks:
    peak=ln.split()[3].split(":")[1]
    peak_num=peak[4:]
    okPeak_dic[peak_num]=""


for ln in open(inFile, "r"):
    chrom, start, end, peak, cov, strand, score, anno = ln.split()
    if anno==".":
        continue
    anno_lst=anno.split(",")
    if len(anno_lst)==1:
        gene=anno_lst[0].split(":")[1]
        if anno_lst[0].split(":")[0]=="intron":
            if peak in okPeak_dic.keys():
                peak_i=int(peak)
                start_i=int(start)
                end_i=int(end)
                type="intron"
                outFile.write("%s\t%d\t%d\t%s\t%s\t%s\n"%(chrom, start_i, end_i, type,score, strand))
    else:
        type_dic={}
        for each in anno_lst:
            type_dic[each.split(":")[0]]=each.split(":")[1]
        if "utr3" in type_dic.keys():
            continue
        if "intron" in type_dic.keys():
             if peak in okPeak_dic.keys():
                 peak_i=int(peak)
                 start_i=int(start)
                 end_i=int(end)
                 type="intron"
                 outFile.write("%s\t%d\t%d\t%s\t%s\t%s\n"%(chrom, start_i, end_i,type ,score, strand))
outFile.close()
BothFracDTPlotmyIntronPeaks_noMPFilt.sh
#!/bin/bash

#SBATCH --job-name=BothFracDTPlotmyIntronPeaks_noMPFilt
#SBATCH --account=pi-yangili1
#SBATCH --time=24:00:00
#SBATCH --output=BothFracRNADTPlotmyIntronPeaks_noMPFilt.out
#SBATCH --error=BothFracRNADTPlotmyIntronPeaks_noMPFilt.err
#SBATCH --partition=bigmem2
#SBATCH --mem=100G
#SBATCH --mail-type=END

module load Anaconda3
source activate three-prime-env


computeMatrix reference-point -S /project2/gilad/briana/threeprimeseq/data/mergedBW/Total_MergedBamCoverage.bw /project2/gilad/briana/threeprimeseq/data/mergedBW/Nuclear_MergedBamCoverage.bw /project2/gilad/briana/threeprimeseq/data/rnaseq_bw/RNAseqGeuvadis_STAR_6samp_MergedBams.sort.bw -R /project2/gilad/briana/threeprimeseq/data/peaks4DT/APAPeaks_5percCov_fixedStrand_INTRON.bed -b 1000 -a 1000  -out /project2/gilad/briana/threeprimeseq/data/LianoglouDeepTools/BothFrac_myPeaksIntron_Nompfilt.gz

plotHeatmap --sortRegions descend -m /project2/gilad/briana/threeprimeseq/data/LianoglouDeepTools/BothFrac_myPeaksIntron_Nompfilt.gz --refPointLabel "Called Intronic PAS" --plotTitle "Combined Reads at Intronic PAS" --heatmapHeight 7 --colorMap YlGnBu  -out /project2/gilad/briana/threeprimeseq/data/LianoglouDeepTools/BothFrac_myPeaksIntronNompfilt.png
RNA seq only:
RNADTPlotmyIntronPeaks_noMPFilt.sh
#!/bin/bash

#SBATCH --job-name=RNADTPlotmyIntronPeaks_noMPFilt
#SBATCH --account=pi-yangili1
#SBATCH --time=24:00:00
#SBATCH --output=RNADTPlotmyIntronPeaks_noMPFilt.out
#SBATCH --error=RNADTPlotmyIntronPeaks_noMPFilt.err
#SBATCH --partition=bigmem2
#SBATCH --mem=100G
#SBATCH --mail-type=END

module load Anaconda3
source activate three-prime-env


computeMatrix reference-point -S /project2/gilad/briana/threeprimeseq/data/rnaseq_bw/RNAseqGeuvadis_STAR_6samp_MergedBams.sort.bw -R /project2/gilad/briana/threeprimeseq/data/peaks4DT/APAPeaks_5percCov_fixedStrand_INTRON.bed -b 1000 -a 1000  -out /project2/gilad/briana/threeprimeseq/data/LianoglouDeepTools/RNA_myPeaksIntron_Nompfilt.gz

plotHeatmap --sortRegions descend -m /project2/gilad/briana/threeprimeseq/data/LianoglouDeepTools/RNA_myPeaksIntron_Nompfilt.gz --refPointLabel "Called Intronic PAS" --plotTitle "Combined Reads at Intronic PAS" --heatmapHeight 7 --colorMap YlGnBu  -out /project2/gilad/briana/threeprimeseq/data/LianoglouDeepTools/RNA_myPeaksIntronNompfilt.png
I should try this with the nuclear RNA samples
I need to merge them and make a BW.
mergeNucRNAseq.sh
#!/bin/bash

#SBATCH --job-name=mergeNucRNAseq
#SBATCH --account=pi-yangili1
#SBATCH --time=24:00:00
#SBATCH --output=mergeNucRNAseq.out
#SBATCH --error=mergeNucRNAseq.err
#SBATCH --partition=bigmem2
#SBATCH --mem=100G
#SBATCH --mail-type=END

module load Anaconda3
source activate three-prime-env


samtools merge /project2/gilad/briana/threeprimeseq/data/NuclearRNA/NuclearRNA_merged.bam  /project2/gilad/briana/Total_Nuc_RNA_seq_data/170428_K00242_0214_AHK2GMBBXX-YG-SP20/data/sort/YG-SP20-Nuc-2_S5_L005_R1_001-sort.bam /project2/gilad/briana/Total_Nuc_RNA_seq_data/170428_K00242_0214_AHK2GMBBXX-YG-SP20/data/sort/YG-SP20-Nuc-1_S2_L005_R1_001-sort.bam

samtools sort /project2/gilad/briana/threeprimeseq/data/NuclearRNA/NuclearRNA_merged.bam > /project2/gilad/briana/threeprimeseq/data/NuclearRNA/NuclearRNA_merged.sort.bam

samtools index /project2/gilad/briana/threeprimeseq/data/NuclearRNA/NuclearRNA_merged.sort.bam
NucBam2BW.sh
#!/bin/bash

#SBATCH --job-name=NucBam2BW
#SBATCH --account=pi-yangili1
#SBATCH --time=24:00:00
#SBATCH --output=NucBam2BW.out
#SBATCH --error=NucBam2BW.err
#SBATCH --partition=bigmem2
#SBATCH --mem=100G
#SBATCH --mail-type=END

module load Anaconda3
source activate three-prime-env

#total
bamCoverage -b /project2/gilad/briana/threeprimeseq/data/NuclearRNA/NuclearRNA_merged.sort.bam -o /project2/gilad/briana/threeprimeseq/data/NuclearRNA/NuclearRNA_merged.sort.bw
NucRNADTPlotmyIntronPeaks_noMPFilt.sh
#!/bin/bash

#SBATCH --job-name=NucRNADTPlotmyIntronPeaks_noMPFilt
#SBATCH --account=pi-yangili1
#SBATCH --time=24:00:00
#SBATCH --output=NucRNADTPlotmyIntronPeaks_noMPFilt.out
#SBATCH --error=NucRNADTPlotmyIntronPeaks_noMPFilt.err
#SBATCH --partition=bigmem2
#SBATCH --mem=100G
#SBATCH --mail-type=END

module load Anaconda3
source activate three-prime-env


computeMatrix reference-point -S /project2/gilad/briana/threeprimeseq/data/NuclearRNA/NuclearRNA_merged.sort.bw -R /project2/gilad/briana/threeprimeseq/data/peaks4DT/APAPeaks_5percCov_fixedStrand_INTRON.bed  -b 1000 -a 1000  -out /project2/gilad/briana/threeprimeseq/data/LianoglouDeepTools/NucRNA_myPeaksIntron_Nompfilt.gz

plotHeatmap --sortRegions descend -m /project2/gilad/briana/threeprimeseq/data/LianoglouDeepTools/NucRNA_myPeaksIntron_Nompfilt.gz --refPointLabel "Called Intronic PAS" --plotTitle "Combined Reads at Intronic PAS" --heatmapHeight 7 --colorMap YlGnBu  -out /project2/gilad/briana/threeprimeseq/data/LianoglouDeepTools/NucRNA_myPeaksIntronNompfilt.png
NucRNADTPlotmyIntronPeaks_noMPFilt_150.sh
#!/bin/bash

#SBATCH --job-name=NucRNADTPlotmyIntronPeaks_noMPFilt_150
#SBATCH --account=pi-yangili1
#SBATCH --time=24:00:00
#SBATCH --output=NucRNADTPlotmyIntronPeaks_noMPFilt150.out
#SBATCH --error=NucRNADTPlotmyIntronPeaks_noMPFilt150.err
#SBATCH --partition=bigmem2
#SBATCH --mem=100G
#SBATCH --mail-type=END

module load Anaconda3
source activate three-prime-env


computeMatrix reference-point -S /project2/gilad/briana/threeprimeseq/data/NuclearRNA/NuclearRNA_merged.sort.bw -R /project2/gilad/briana/threeprimeseq/data/peaks4DT/APAPeaks_5percCov_fixedStrand_INTRON.bed  -b 150 -a 150  -out /project2/gilad/briana/threeprimeseq/data/LianoglouDeepTools/NucRNA_myPeaksIntron_Nompfilt150.gz

plotHeatmap --sortRegions descend -m /project2/gilad/briana/threeprimeseq/data/LianoglouDeepTools/NucRNA_myPeaksIntron_Nompfilt150.gz --refPointLabel "Called Intronic PAS" --plotTitle "Combined Reads at Intronic PAS" --heatmapHeight 7 --colorMap YlGnBu  -out /project2/gilad/briana/threeprimeseq/data/LianoglouDeepTools/NucRNA_myPeaksIntronNompfilt150.png
NucRNADTPlotmyIntronPeaks_noMPFilt_300.sh
#!/bin/bash

#SBATCH --job-name=NucRNADTPlotmyIntronPeaks_noMPFilt_300
#SBATCH --account=pi-yangili1
#SBATCH --time=24:00:00
#SBATCH --output=NucRNADTPlotmyIntronPeaks_noMPFilt300.out
#SBATCH --error=NucRNADTPlotmyIntronPeaks_noMPFilt300.err
#SBATCH --partition=bigmem2
#SBATCH --mem=100G
#SBATCH --mail-type=END

module load Anaconda3
source activate three-prime-env


computeMatrix reference-point -S /project2/gilad/briana/threeprimeseq/data/NuclearRNA/NuclearRNA_merged.sort.bw -R /project2/gilad/briana/threeprimeseq/data/peaks4DT/APAPeaks_5percCov_fixedStrand_INTRON.bed  -b 300 -a 300  -out /project2/gilad/briana/threeprimeseq/data/LianoglouDeepTools/NucRNA_myPeaksIntron_Nompfilt300.gz

plotHeatmap --sortRegions descend -m /project2/gilad/briana/threeprimeseq/data/LianoglouDeepTools/NucRNA_myPeaksIntron_Nompfilt300.gz --refPointLabel "Called Intronic PAS" --plotTitle "Combined Reads at Intronic PAS" --heatmapHeight 7 --colorMap YlGnBu  -out /project2/gilad/briana/threeprimeseq/data/LianoglouDeepTools/NucRNA_myPeaksIntronNompfilt300.png
TES and TSS (not looking right- coding end doesnt work)
fixStrand4DTplots_TESTSS.py Fix strand for these:
TSSIn="/project2/gilad/briana/genome_anotation_data/RefSeq_annotations/ncbiRefSeq_TSSAllGenes.bed"
TESIn="/project2/gilad/briana/genome_anotation_data/RefSeq_annotations/ncbiRefSeq_TESAllGenes.bed"
TSSOut="/project2/gilad/briana/threeprimeseq/data/peaks4DT/ncbiRefSeq_TSSAllGenes_fixedStrand.bed"
TESOut="/project2/gilad/briana/threeprimeseq/data/peaks4DT/ncbiRefSeq_TESAllGenes_fixedStrand.bed"


def fix_strand(Fin,Fout):
    fout=open(Fout,"w")
    for ln in open(Fin, "r"):
        chrom, start, end, name, score, strand = ln.split()
        if strand=="+":
            fout.write("%s\t%s\t%s\t%s\t%s\t-\n"%(chrom,start,end,name,score))
        else:
            fout.write("%s\t%s\t%s\t%s\t%s\t+\n"%(chrom,start,end,name,score))
    fout.close()


fix_strand(TSSIn, TSSOut)
fix_strand(TESIn, TESOut)
files to make: new TSS file from the annotation in the new gene loc annocation pipeline
getTss.py
TXN2Gene_file=open("/project2/gilad/briana/genome_anotation_data/RefSeq_annotations/Transcript2GeneName.dms","r")

outFile=open("/project2/gilad/briana/genome_anotation_data/RefSeq_annotations/ncbiRefSeq_TSSAllGenes.bed", "w")

for i, ln in enumerate(TXN2Gene_file):
    if i >0 :
        chrom=ln.split()[2]
        chromf=chrom[3:]
        start=int(ln.split()[6])-1
        end=int(ln.split()[6])
        txn=ln.split()[1]
        genename=ln.split()[12]
        id=txn + ":" + genename
        strand=ln.split()[3]
        score="."
        outFile.write("%s\t%s\t%s\t%s\t%s\t%s\n"%(chromf, start, end, id, score, strand))

outFile.close()
RNADTPlotTSS_noMPFilt.sh
#!/bin/bash

#SBATCH --job-name=RNADTPlotTSS_noMPFilt
#SBATCH --account=pi-yangili1
#SBATCH --time=24:00:00
#SBATCH --output=RNADTPlotTSS_noMPFilt.out
#SBATCH --error=RNADTPlotTSS_noMPFilt.err
#SBATCH --partition=bigmem2
#SBATCH --mem=100G
#SBATCH --mail-type=END

module load Anaconda3
source activate three-prime-env


computeMatrix reference-point -S  /project2/gilad/briana/threeprimeseq/data/rnaseq_bw/RNAseqGeuvadis_STAR_6samp_MergedBams.sort.bw -R /project2/gilad/briana/genome_anotation_data/ncbiRefSeq.mRNA.transcriptTSS.bed -b 1000 -a 1000  -out /project2/gilad/briana/threeprimeseq/data/LianoglouDeepTools/RNA_TSS_Nompfilt.gz

plotHeatmap --sortRegions descend -m /project2/gilad/briana/threeprimeseq/data/LianoglouDeepTools/RNA_TSS_Nompfilt.gz --refPointLabel "Called TSS" --plotTitle "Combined Reads at TSS" --heatmapHeight 7 --colorMap YlGnBu  -out /project2/gilad/briana/threeprimeseq/data/LianoglouDeepTools/RNA_TSS_Nompfilt.png
BothFracDTPlotTSS_noMPFilt.sh
#!/bin/bash

#SBATCH --job-name=BothFracDTPlotTSS_noMPFilt
#SBATCH --account=pi-yangili1
#SBATCH --time=24:00:00
#SBATCH --output=BothFracDTPlotTSS_noMPFilt.out
#SBATCH --error=BothFracDTPlotTSS_noMPFilt.err
#SBATCH --partition=bigmem2
#SBATCH --mem=100G
#SBATCH --mail-type=END

module load Anaconda3
source activate three-prime-env


computeMatrix reference-point -S /project2/gilad/briana/threeprimeseq/data/mergedBW/Total_MergedBamCoverage.bw /project2/gilad/briana/threeprimeseq/data/mergedBW/Nuclear_MergedBamCoverage.bw  -R /project2/gilad/briana/genome_anotation_data/ncbiRefSeq.mRNA.transcriptTSS.bed -b 1000 -a 1000  -out /project2/gilad/briana/threeprimeseq/data/LianoglouDeepTools/BothFrac_TSS_Nompfilt.gz

plotHeatmap --sortRegions descend -m /project2/gilad/briana/threeprimeseq/data/LianoglouDeepTools/BothFrac_TSS_Nompfilt.gz --refPointLabel "Called TSS" --plotTitle "Combined Reads at TSS" --heatmapHeight 7 --colorMap YlGnBu  -out /project2/gilad/briana/threeprimeseq/data/LianoglouDeepTools/BothFrac_TSS_Nompfilt.png
getTES.py
TXN2Gene_file=open("/project2/gilad/briana/genome_anotation_data/RefSeq_annotations/Transcript2GeneName.dms","r")

outFile=open("/project2/gilad/briana/genome_anotation_data/RefSeq_annotations/ncbiRefSeq_TESAllGenes.bed", "w")

for i, ln in enumerate(TXN2Gene_file):
    if i >0 :
        chrom=ln.split()[2]
        chromf=chrom[3:]
        start=int(ln.split()[7])-1
        end=int(ln.split()[7])
        txn=ln.split()[1]
        genename=ln.split()[12]
        id=txn + ":" + genename
        strand=ln.split()[3]
        score="."
        outFile.write("%s\t%s\t%s\t%s\t%s\t%s\n"%(chromf, start, end, id, score, strand))

outFile.close()
BothFracRNADTPlotTES_noMPFilt.sh
#!/bin/bash

#SBATCH --job-name=BothFracRNADTPlotTES_noMPFilt
#SBATCH --account=pi-yangili1
#SBATCH --time=24:00:00
#SBATCH --output=BothFracRNADTPlotTES_noMPFilt.out
#SBATCH --error=BothFracRNADTPlotTESnoMPFilt.err
#SBATCH --partition=bigmem2
#SBATCH --mem=100G
#SBATCH --mail-type=END

module load Anaconda3
source activate three-prime-env


computeMatrix reference-point -S /project2/gilad/briana/threeprimeseq/data/mergedBW/Total_MergedBamCoverage.bw /project2/gilad/briana/threeprimeseq/data/mergedBW/Nuclear_MergedBamCoverage.bw /project2/gilad/briana/threeprimeseq/data/rnaseq_bw/RNAseqGeuvadis_STAR_6samp_MergedBams.sort.bw -R /project2/gilad/briana/threeprimeseq/data/peaks4DT/ncbiRefSeq_TESAllGenes_fixedStrand.bed -b 1000 -a 1000  -out /project2/gilad/briana/threeprimeseq/data/LianoglouDeepTools/BothFracRNA_TES_Nompfilt.gz

plotHeatmap --sortRegions descend -m /project2/gilad/briana/threeprimeseq/data/LianoglouDeepTools/BothFracRNA_TES_Nompfilt.gz --refPointLabel "Called TES" --plotTitle "Combined Reads at TES" --heatmapHeight 7 --colorMap YlGnBu  -out /project2/gilad/briana/threeprimeseq/data/LianoglouDeepTools/BothFracRNA_TES_Nompfilt.png
RNADTPlotTES_noMPFilt.sh
#!/bin/bash

#SBATCH --job-name=RNADTPlotTES_noMPFilt
#SBATCH --account=pi-yangili1
#SBATCH --time=24:00:00
#SBATCH --output=RNADTPlotTES_noMPFilt.out
#SBATCH --error=RNADTPlotTESnoMPFilt.err
#SBATCH --partition=bigmem2
#SBATCH --mem=100G
#SBATCH --mail-type=END

module load Anaconda3
source activate three-prime-env


computeMatrix reference-point -S /project2/gilad/briana/threeprimeseq/data/rnaseq_bw/RNAseqGeuvadis_STAR_6samp_MergedBams.sort.bw -R /project2/gilad/briana/threeprimeseq/data/peaks4DT/ncbiRefSeq_TESAllGenes_fixedStrand.bed -b 1000 -a 1000  -out /project2/gilad/briana/threeprimeseq/data/LianoglouDeepTools/RNA_TES_Nompfilt.gz

plotHeatmap --sortRegions descend -m /project2/gilad/briana/threeprimeseq/data/LianoglouDeepTools/RNA_TES_Nompfilt.gz --refPointLabel "Called TES" --plotTitle "Combined Reads at TES" --heatmapHeight 7 --colorMap YlGnBu  -out /project2/gilad/briana/threeprimeseq/data/LianoglouDeepTools/RNA_TES_Nompfilt.png
/project2/gilad/briana/genome_anotation_data/ncbiRefSeq.mRNA.transcriptTSS.bed
ATAC seq
ATAC seq bam files are in /project2/yangili1/LCL/ATAC/ I will merge the bam files.
mergeBamFiles_ATAC.sh
#!/bin/bash

#SBATCH --job-name=mergeBamFiles_ATAC
#SBATCH --account=pi-yangili1
#SBATCH --time=8:00:00
#SBATCH --output=mergeBamFiles_ATAC.out
#SBATCH --error=mergeBamFiles_ATAC.err
#SBATCH --partition=bigmem2
#SBATCH --mem=100G
#SBATCH --mail-type=END

module load Anaconda3
source activate three-prime-env


samtools merge  /project2/gilad/briana/threeprimeseq/data/ATAC_mergeBam/ATAC_merged.bam /project2/yangili1/LCL/ATAC/*.sort.bam

samtools sort /project2/gilad/briana/threeprimeseq/data/ATAC_mergeBam/ATAC_merged.bam > /project2/gilad/briana/threeprimeseq/data/ATAC_mergeBam/ATAC_merged.sort.bam

samtools index /project2/gilad/briana/threeprimeseq/data/ATAC_mergeBam/ATAC_merged.sort.bam
bam2BW_ATAC.sh
#!/bin/bash

#SBATCH --job-name=bam2BW_ATAC
#SBATCH --account=pi-yangili1
#SBATCH --time=24:00:00
#SBATCH --output=bam2BW_ATAC.out
#SBATCH --error=bam2BW_ATAC.err
#SBATCH --partition=bigmem2
#SBATCH --mem=100G
#SBATCH --mail-type=END

module load Anaconda3
source activate three-prime-env

#total
bamCoverage -b /project2/gilad/briana/threeprimeseq/data/ATAC_mergeBam/ATAC_merged.sort.bam -o /project2/gilad/briana/threeprimeseq/data/ATAC_mergeBW/ATAC_merged.sort.bw
ATACDTPlotmyIntronPeaks_noMPFilt.sh
#!/bin/bash

#SBATCH --job-name=ATACDTPlotmyIntronPeaks_noMPFilt
#SBATCH --account=pi-yangili1
#SBATCH --time=24:00:00
#SBATCH --output=ATACDTPlotmyIntronPeaks_noMPFilt.out
#SBATCH --error=ATACDTPlotmyIntronPeaks_noMPFilt.err
#SBATCH --partition=bigmem2
#SBATCH --mem=100G
#SBATCH --mail-type=END

module load Anaconda3
source activate three-prime-env


computeMatrix reference-point -S /project2/gilad/briana/threeprimeseq/data/ATAC_mergeBW/ATAC_merged.sort.bw -R /project2/gilad/briana/threeprimeseq/data/peaks4DT/APAPeaks_5percCov_fixedStrand_INTRON.bed  -b 1000 -a 1000  -out /project2/gilad/briana/threeprimeseq/data/LianoglouDeepTools/ATAC_myPeaksIntron_Nompfilt.gz

plotHeatmap --sortRegions descend -m /project2/gilad/briana/threeprimeseq/data/LianoglouDeepTools/ATAC_myPeaksIntron_Nompfilt.gz --refPointLabel "Called Intronic PAS" --plotTitle "ATAC-seq at Intronic PAS" --heatmapHeight 7 --colorMap YlGnBu  -out /project2/gilad/briana/threeprimeseq/data/LianoglouDeepTools/ATAC_myPeaksIntronNompfilt.png
Do it with the 3’ UTR peaks
sessionInfo()R version 3.5.1 (2018-07-02)
Platform: x86_64-apple-darwin15.6.0 (64-bit)
Running under: macOS 10.14.1
Matrix products: default
BLAS: /Library/Frameworks/R.framework/Versions/3.5/Resources/lib/libRblas.0.dylib
LAPACK: /Library/Frameworks/R.framework/Versions/3.5/Resources/lib/libRlapack.dylib
locale:
[1] en_US.UTF-8/en_US.UTF-8/en_US.UTF-8/C/en_US.UTF-8/en_US.UTF-8
attached base packages:
[1] stats graphics grDevices utils datasets methods base
other attached packages:
[1] bindrcpp_0.2.2 cowplot_0.9.3 reshape2_1.4.3 forcats_0.3.0
[5] stringr_1.4.0 dplyr_0.7.6 purrr_0.2.5 readr_1.1.1
[9] tidyr_0.8.1 tibble_1.4.2 ggplot2_3.0.0 tidyverse_1.2.1
[13] workflowr_1.2.0
loaded via a namespace (and not attached):
[1] tidyselect_0.2.4 haven_1.1.2 lattice_0.20-35
[4] colorspace_1.3-2 htmltools_0.3.6 yaml_2.2.0
[7] rlang_0.2.2 pillar_1.3.0 glue_1.3.0
[10] withr_2.1.2 RColorBrewer_1.1-2 modelr_0.1.2
[13] readxl_1.1.0 bindr_0.1.1 plyr_1.8.4
[16] munsell_0.5.0 gtable_0.2.0 cellranger_1.1.0
[19] rvest_0.3.2 evaluate_0.13 labeling_0.3
[22] knitr_1.20 broom_0.5.0 Rcpp_0.12.19
[25] scales_1.0.0 backports_1.1.2 jsonlite_1.6
[28] fs_1.2.6 hms_0.4.2 digest_0.6.17
[31] stringi_1.2.4 grid_3.5.1 rprojroot_1.3-2
[34] cli_1.0.1 tools_3.5.1 magrittr_1.5
[37] lazyeval_0.2.1 crayon_1.3.4 whisker_0.3-2
[40] pkgconfig_2.0.2 xml2_1.2.0 lubridate_1.7.4
[43] assertthat_0.2.0 rmarkdown_1.11 httr_1.3.1
[46] rstudioapi_0.9.0 R6_2.3.0 nlme_3.1-137
[49] git2r_0.24.0 compiler_3.5.1