Use cleanUpdTSeq for internal priming
Briana Mittleman
7/24/2018
Last updated: 2018-07-26
workflowr checks: (Click a bullet for more information)-
✔ R Markdown file: up-to-date
Great! Since the R Markdown file has been committed to the Git repository, you know the exact version of the code that produced these results.
-
✔ Environment: empty
Great job! The global environment was empty. Objects defined in the global environment can affect the analysis in your R Markdown file in unknown ways. For reproduciblity it’s best to always run the code in an empty environment.
-
✔ Seed:
set.seed(12345)The command
set.seed(12345)was run prior to running the code in the R Markdown file. Setting a seed ensures that any results that rely on randomness, e.g. subsampling or permutations, are reproducible. -
✔ Session information: recorded
Great job! Recording the operating system, R version, and package versions is critical for reproducibility.
-
Great! You are using Git for version control. Tracking code development and connecting the code version to the results is critical for reproducibility. The version displayed above was the version of the Git repository at the time these results were generated.✔ Repository version: 31118c6
Note that you need to be careful to ensure that all relevant files for the analysis have been committed to Git prior to generating the results (you can usewflow_publishorwflow_git_commit). workflowr only checks the R Markdown file, but you know if there are other scripts or data files that it depends on. Below is the status of the Git repository when the results were generated:
Note that any generated files, e.g. HTML, png, CSS, etc., are not included in this status report because it is ok for generated content to have uncommitted changes.Ignored files: Ignored: .DS_Store Ignored: .Rhistory Ignored: .Rproj.user/ Ignored: output/.DS_Store Untracked files: Untracked: data/18486.genecov.txt Untracked: data/APApeaksYL.total.inbrain.bed Untracked: data/YL-SP-18486-T_S9_R1_001-genecov.txt Untracked: data/bedgraph_peaks/ Untracked: data/bin200.5.T.nuccov.bed Untracked: data/bin200.Anuccov.bed Untracked: data/bin200.nuccov.bed Untracked: data/clean_peaks/ Untracked: data/gene_cov/ Untracked: data/leafcutter/ Untracked: data/nuc6up/ Untracked: data/reads_mapped_three_prime_seq.csv Untracked: data/smash.cov.results.bed Untracked: data/smash.cov.results.csv Untracked: data/smash.cov.results.txt Untracked: data/smash_testregion/ Untracked: data/ssFC200.cov.bed Untracked: output/picard/ Untracked: output/plots/ Untracked: output/qual.fig2.pdf Unstaged changes: Modified: analysis/dif.iso.usage.leafcutter.Rmd Modified: analysis/explore.filters.Rmd Modified: analysis/test.max2.Rmd Modified: code/Snakefile
Expand here to see past versions:
| File | Version | Author | Date | Message |
|---|---|---|---|---|
| Rmd | 31118c6 | Briana Mittleman | 2018-07-26 | add length and coverage analysis |
| html | f3eaa0b | Briana Mittleman | 2018-07-25 | Build site. |
| Rmd | be5fac4 | Briana Mittleman | 2018-07-25 | explore cleanup results |
| html | 3a5a8fe | Briana Mittleman | 2018-07-25 | Build site. |
| Rmd | d8394a3 | Briana Mittleman | 2018-07-25 | start clean up code analysis |
Install new packages:
source("https://bioconductor.org/biocLite.R")
biocLite("BSgenome.Hsapiens.UCSC.hg19")
Load Packages:
library(workflowr)This is workflowr version 1.1.1
Run ?workflowr for help getting startedlibrary(cleanUpdTSeq)Loading required package: BiocGenericsLoading required package: parallel
Attaching package: 'BiocGenerics'The following objects are masked from 'package:parallel':
clusterApply, clusterApplyLB, clusterCall, clusterEvalQ,
clusterExport, clusterMap, parApply, parCapply, parLapply,
parLapplyLB, parRapply, parSapply, parSapplyLBThe following objects are masked from 'package:stats':
IQR, mad, sd, var, xtabsThe following objects are masked from 'package:base':
anyDuplicated, append, as.data.frame, basename, cbind,
colMeans, colnames, colSums, dirname, do.call, duplicated,
eval, evalq, Filter, Find, get, grep, grepl, intersect,
is.unsorted, lapply, lengths, Map, mapply, match, mget, order,
paste, pmax, pmax.int, pmin, pmin.int, Position, rank, rbind,
Reduce, rowMeans, rownames, rowSums, sapply, setdiff, sort,
table, tapply, union, unique, unsplit, which, which.max,
which.minLoading required package: BSgenomeLoading required package: S4VectorsLoading required package: stats4
Attaching package: 'S4Vectors'The following object is masked from 'package:base':
expand.gridLoading required package: IRangesLoading required package: GenomeInfoDbLoading required package: GenomicRangesLoading required package: BiostringsLoading required package: XVector
Attaching package: 'Biostrings'The following object is masked from 'package:base':
strsplitLoading required package: rtracklayerLoading required package: BSgenome.Drerio.UCSC.danRer7Loading required package: seqinr
Attaching package: 'seqinr'The following object is masked from 'package:Biostrings':
translateLoading required package: e1071library(GenomicRanges)
library(BSgenome.Hsapiens.UCSC.hg19)
library(ggseqlogo)
library(ggplot2)
library(dplyr)
Attaching package: 'dplyr'The following object is masked from 'package:seqinr':
countThe following objects are masked from 'package:Biostrings':
collapse, intersect, setdiff, setequal, unionThe following object is masked from 'package:XVector':
sliceThe following objects are masked from 'package:GenomicRanges':
intersect, setdiff, unionThe following object is masked from 'package:GenomeInfoDb':
intersectThe following objects are masked from 'package:IRanges':
collapse, desc, intersect, setdiff, slice, unionThe following objects are masked from 'package:S4Vectors':
first, intersect, rename, setdiff, setequal, unionThe following objects are masked from 'package:BiocGenerics':
combine, intersect, setdiff, unionThe following objects are masked from 'package:stats':
filter, lagThe following objects are masked from 'package:base':
intersect, setdiff, setequal, unionlibrary(gridExtra)
Attaching package: 'gridExtra'The following object is masked from 'package:dplyr':
combineThe following object is masked from 'package:BiocGenerics':
combinelibrary(tidyr)
Attaching package: 'tidyr'The following object is masked from 'package:S4Vectors':
expandClean Peaks
I am also going to install cleanUpdTSeq on my midway account because I will want to write scripts using this package that can take in any bedfile and will write out the file with the classification results. I can also have the cutoff option be a parameter that will change.
The test set should have chr, start, end, name, score, strand.
#!/bin/rscripts

# usage: ./cleanupdtseq.R in_bedfile, outfile, cuttoff

#this script takes a putative peak file, and output file name and a cuttoff for classification and outputs the file with all of the seqs classified.

#use optparse for management of input arguments I want to be able to imput the 6up nuc file and write out a filter file

#script needs to run outside of conda env. should module load R in bash script when I submit it
library(optparse)
library(dplyr)
library(tidyr)
library(ggplot2)
library(cleanUpdTSeq)
library(GenomicRanges)
library(BSgenome.Hsapiens.UCSC.hg19)


option_list = list(
  make_option(c("-f", "--file"), action="store", default=NA, type='character',
              help="input file"),
  make_option(c("-o", "--output"), action="store", default=NA, type='character',
              help="output file"),
  make_option(c("-c", "--cutoff"), action="store", default=NA, type='double',
              help="assignment cuttoff")
)


opt_parser <- OptionParser(option_list=option_list)
opt <- parse_args(opt_parser)


#interrupt execution if no file is  supplied
if (is.null(opt$file)){
  print_help(opt_parser)
  stop("Need input file", call.=FALSE)
}

#imput file for test data
testSet <- read.table(file = opt$file, sep="\t", header=TRUE)
peaks <- BED2GRangesSeq(testSet, withSeq=FALSE)

#build vector with human genome

testSet.NaiveBayes <- buildFeatureVector(peaks, BSgenomeName=Hsapiens,
                                         upstream=40, downstream=30,
                                         wordSize=6, alphabet=c("ACGT"),
                                         sampleType="unknown",
                                         replaceNAdistance=30,
                                         method="NaiveBayes",
                                         ZeroBasedIndex=1, fetchSeq=TRUE)

#classfy sites with built in classsifer

data(classifier)
testResults <- predictTestSet(testSet.NaiveBayes=testSet.NaiveBayes,
                              classifier=classifier,
                              outputFile=NULL,
                              assignmentCutoff=opt$cutoff)


#write results

write.table(testResults, file=opt$output, quote = F, row.names = F, col.names = T)
I will need to module load R in the bash script that writes this.
#!/bin/bash

#SBATCH --job-name=clean_filteredpeakstotal
#SBATCH --account=pi-yangili1
#SBATCH --time=24:00:00
#SBATCH --output=clean_filteredpeakstotal.out
#SBATCH --error=clean_filteredpeakstotal.err
#SBATCH --partition=broadwl
#SBATCH --mem=40G
#SBATCH --mail-type=END


module load R

Rscript cleanupdtseq.R  -f /project2/gilad/briana/threeprimeseq/data/clean.peaks/APAfiltered_named.bed -o /project2/gilad/briana/threeprimeseq/data/clean.peaks/clean_APAfilteredTotal.txt -c .5
#add names to bed file with peaks
#awk '{print $1 "\t" $2 "\t" $3 "\t" $1 ":" $2 ":" $3 "\t"  $4 "\t"  $5 "\t" $6}' APAfiltered.bed > APAfiltered_named.bed


seq 1 199880 > peak.num.txt
paste APAfiltered.bed peak.num.txt | column -s $'\t' -t > temp
awk '{print $1 "\t" $2 "\t" $3 "\t" $7  "\t"  $4 "\t"  $5 "\t" $6}' temp >  APAfiltered_named.bed
Characterize results
This cuttoff results in a move from 199880 to 125825 called sites.
peaks=read.table("../data/clean_peaks/clean_APAfilteredTotal.txt", header = T, stringsAsFactors = F)Plot the density of the probabilities. I expect a bimodal distribution.
ggplot(peaks, aes(probTrue)) + geom_density(fill="blue") + labs(title="Density of Probability Peak is a True APA peak", x="Probability True PAS")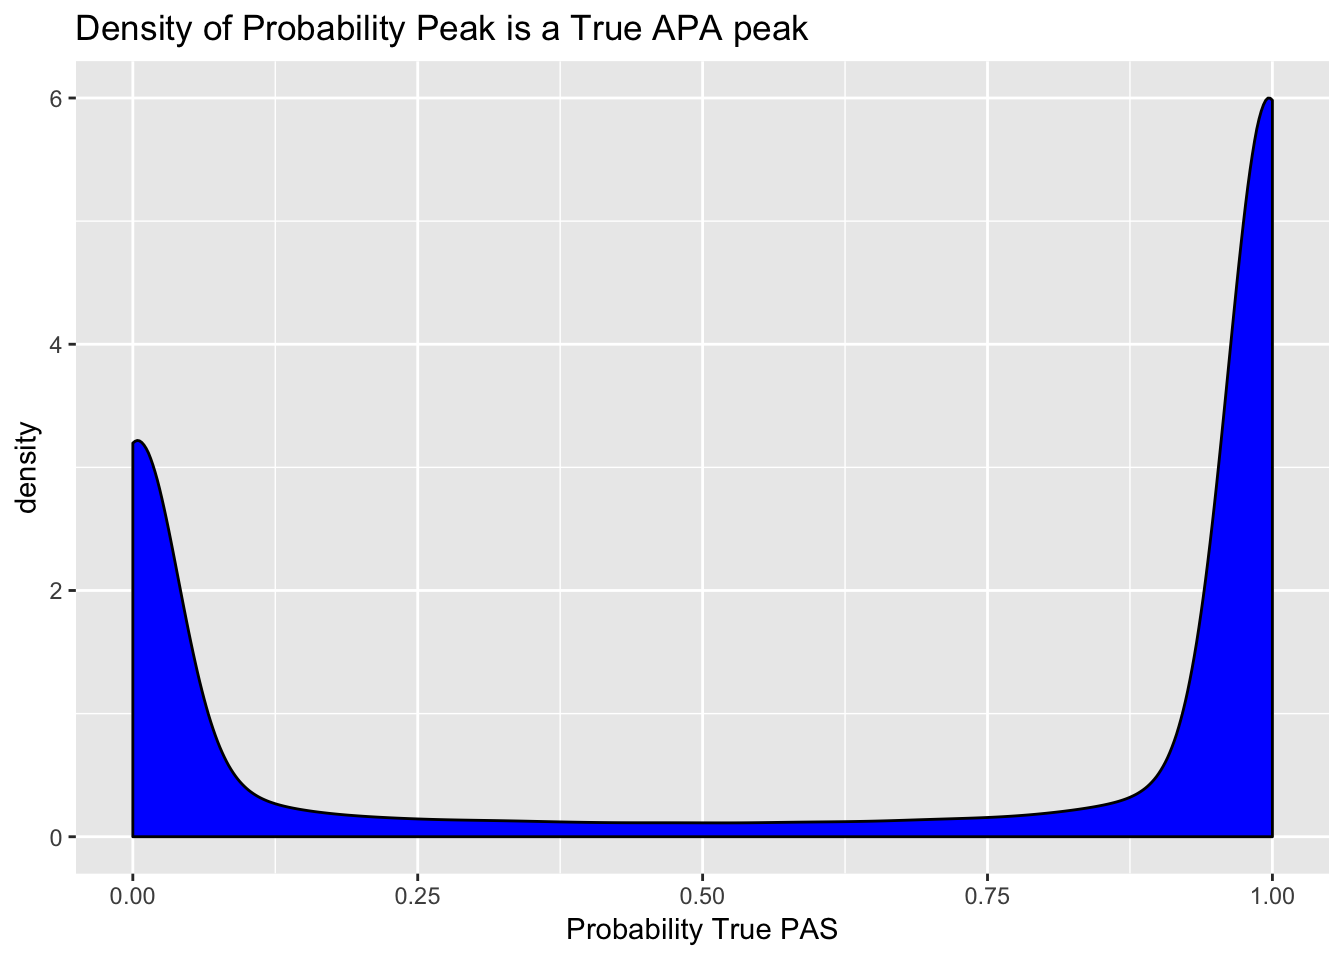
Expand here to see past versions of unnamed-chunk-7-1.png:
| Version | Author | Date |
|---|---|---|
| f3eaa0b | Briana Mittleman | 2018-07-25 |
Next I want to make logo plots for the upstream sequences seperated by class. I expect to see an overrepresentation of A/T in the upstream of the false samples.
true_peaks=peaks %>% filter(pred.class==1)
false_peaks=peaks %>% filter(pred.class==0)
I can extract just the upstream seq for each class.
true_peaks_up=peaks %>% filter(pred.class==1) %>% select(UpstreamSeq)
false_peaks_up= peaks %>% filter(pred.class==0) %>% select(UpstreamSeq)
Sequence composition
trueplot_up=ggseqlogo(true_peaks_up,seq_type='dna', method = 'prob') + labs(x="Base number", title="Upstream Seq: True PAS")

falseplot_up=ggseqlogo(false_peaks_up,seq_type='dna', method = 'prob')  + labs(x="Base number", title="Upstream Seq: False PAS")


gridExtra::grid.arrange(trueplot_up,falseplot_up)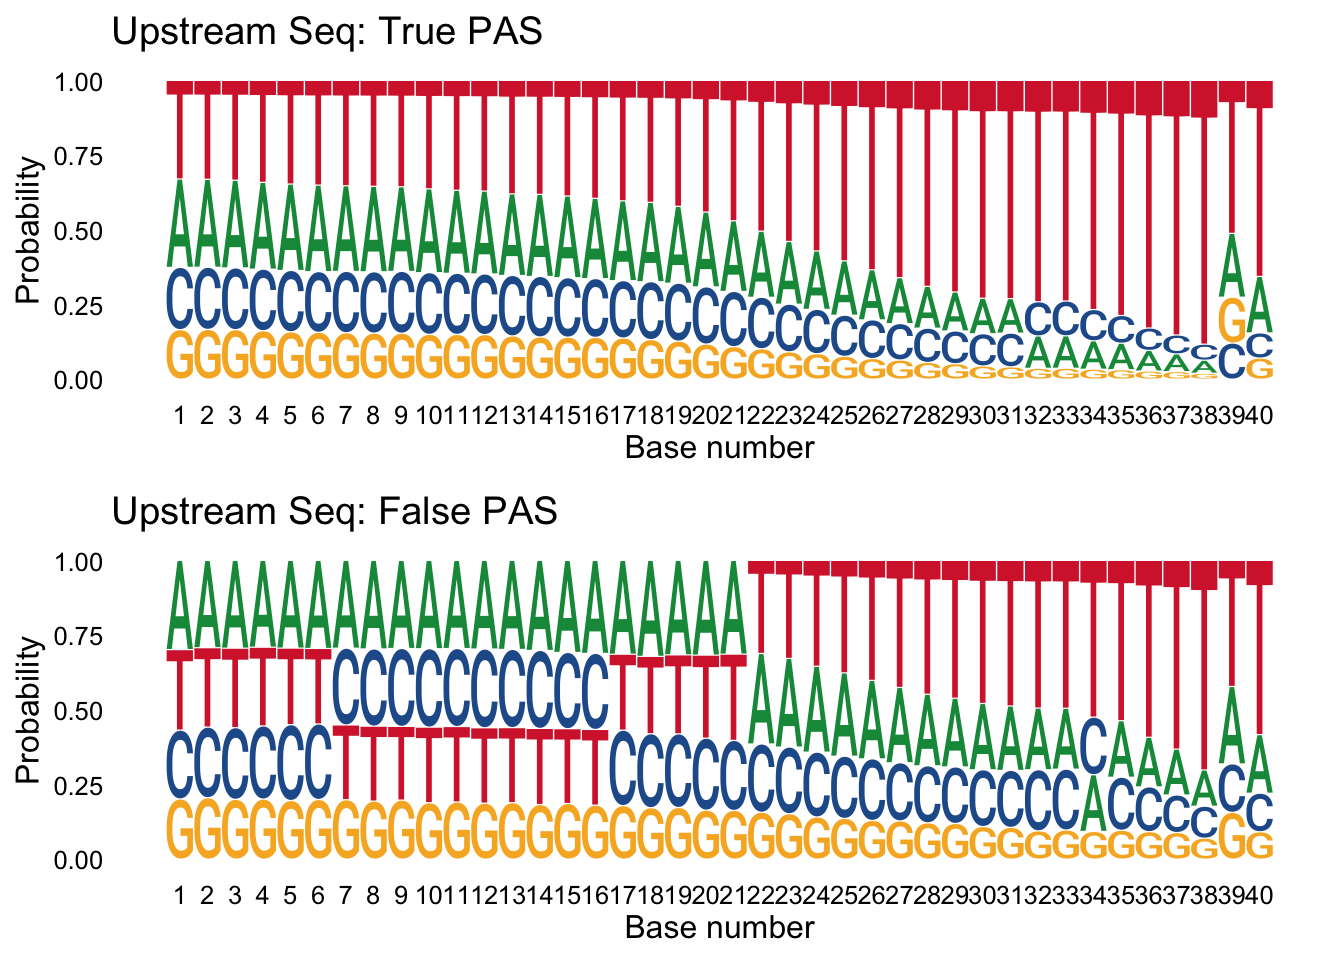
Expand here to see past versions of unnamed-chunk-10-1.png:
| Version | Author | Date |
|---|---|---|
| f3eaa0b | Briana Mittleman | 2018-07-25 |
I can do the same thing for the downstream seq.
true_peaks_down=peaks %>% filter(pred.class==1) %>% select(DownstreamSeq)
false_peaks_down= peaks %>% filter(pred.class==0) %>% select(DownstreamSeq)


trueplot_down=ggseqlogo(true_peaks_down,seq_type='dna', method = 'prob') + labs(x="Base number", title="Downstream Seq: True PAS")

falseplot_down=ggseqlogo(false_peaks_down,seq_type='dna', method = 'prob')  + labs(x="Base number", title="Downstream Seq: False PAS")


gridExtra::grid.arrange(trueplot_down,falseplot_down)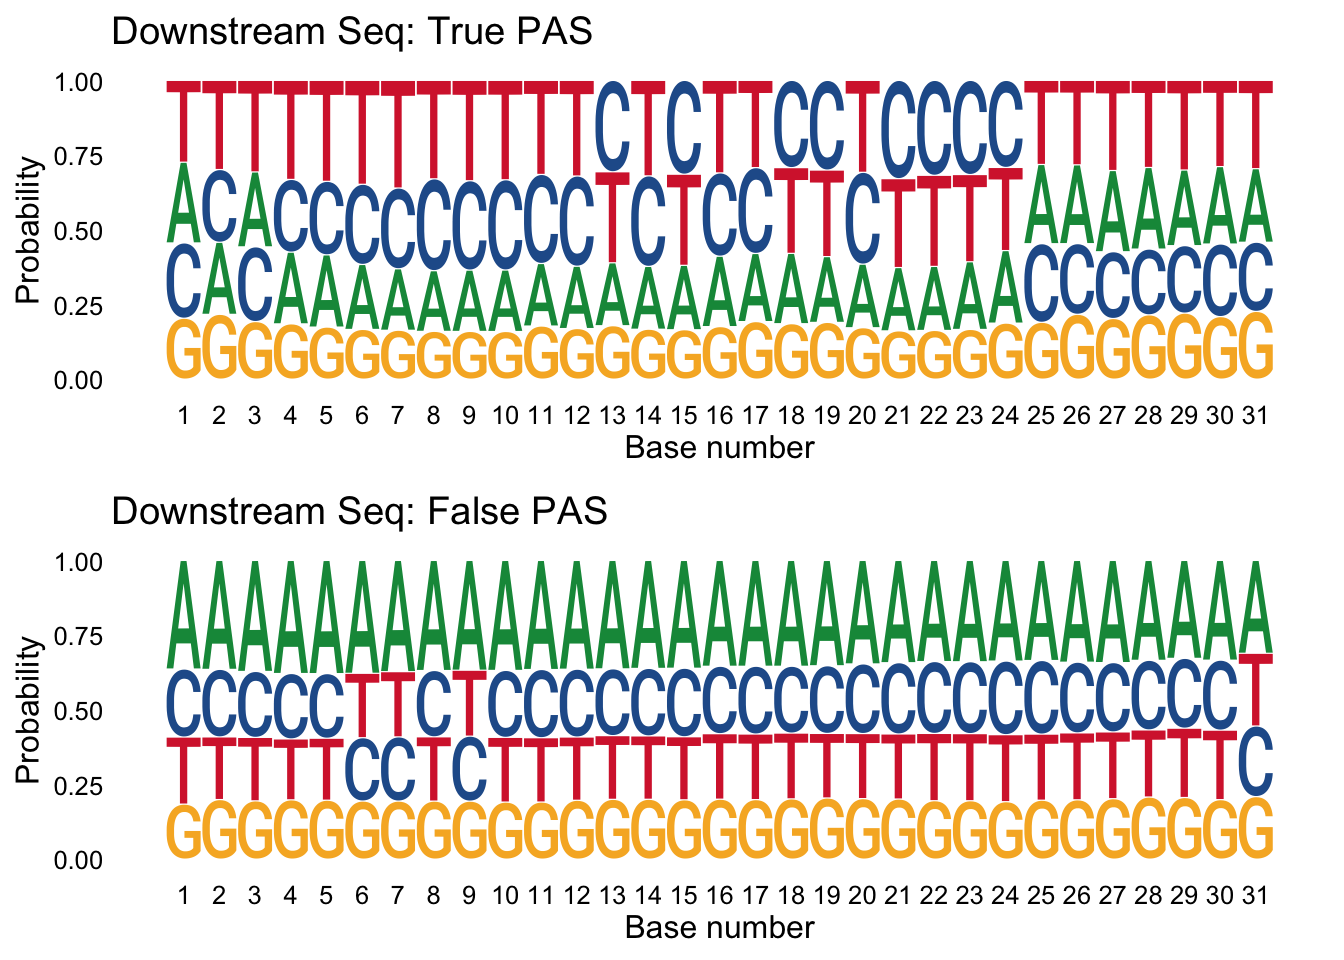
Expand here to see past versions of unnamed-chunk-11-1.png:
| Version | Author | Date |
|---|---|---|
| f3eaa0b | Briana Mittleman | 2018-07-25 |
Length differnces between true and false peaks
I can join all of the information from the original bed with the results using a join by the name.
names=c("chr", "start", "end", "PeakName", "Cov", "Strand", "score")
YL_peaks=read.table("../data/clean_peaks/APAfiltered_named.bed", col.names = names)
full_peaks= inner_join(YL_peaks, peaks, by="PeakName") %>% mutate(length=end-start)
full_peaks$pred.class= as.factor(full_peaks$pred.class)ggplot(full_peaks, aes(length, group=pred.class, fill=pred.class)) + geom_density(alpha=.4) + scale_x_log10() + labs(title="Peak lengths do not differ by predicted class", x="Length of called Peak") + scale_fill_manual(values=c("red", "blue"), name="Predicted Class", labels=c("False Positive", "True PAS"))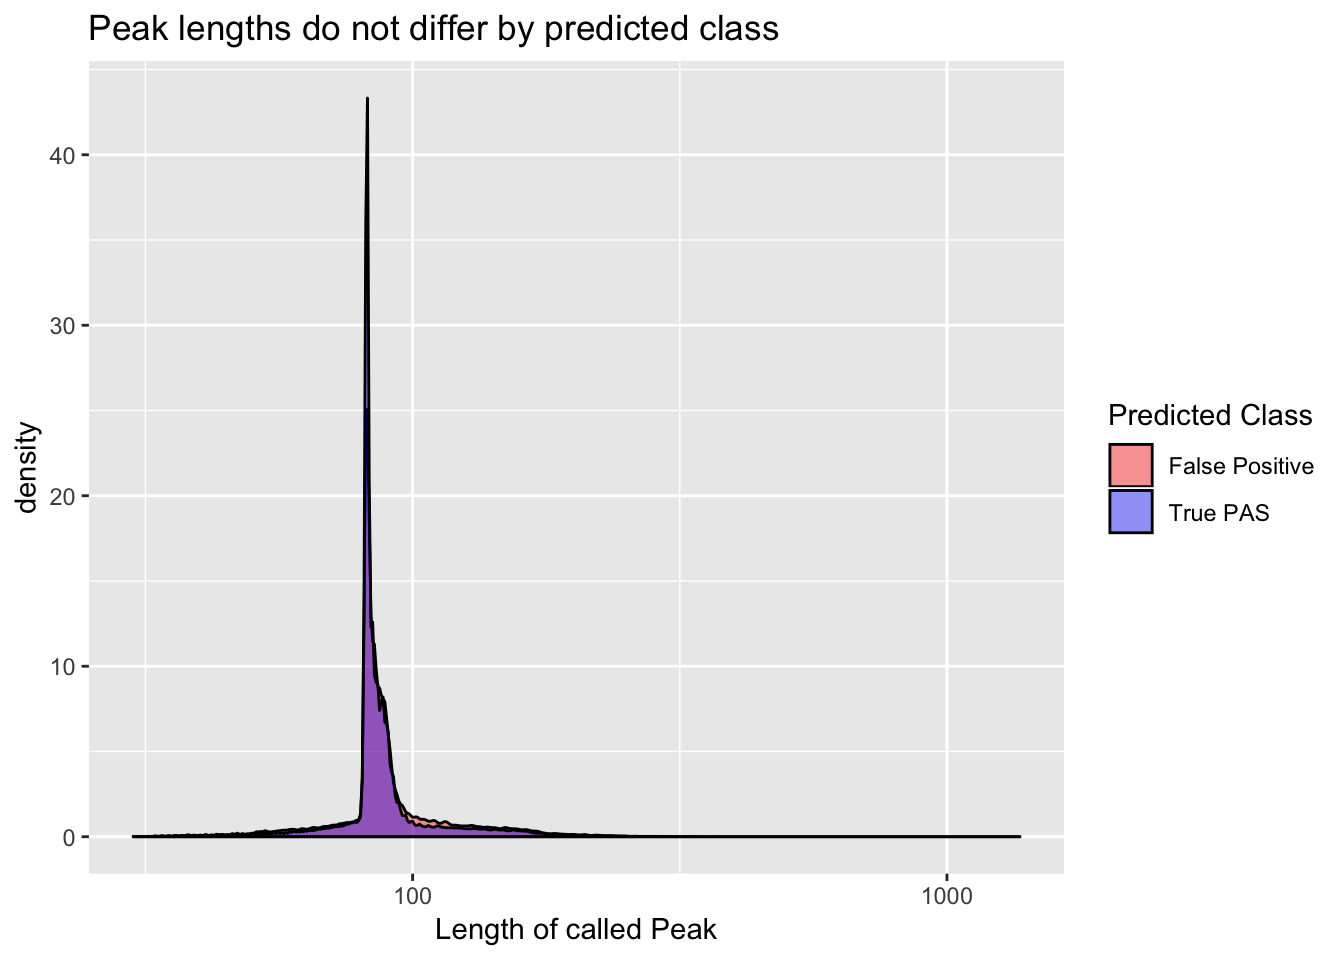
Coverage differnces between true and false peaks
ggplot(full_peaks, aes(x=Cov, group=pred.class, fill=pred.class)) + geom_density(alpha=.4) + scale_x_log10() + labs(title="Peak coverage by predicted class", x=" Peak coverage") + scale_fill_manual(values=c("red", "blue"), name="Predicted Class", labels=c("False Positive", "True PAS"))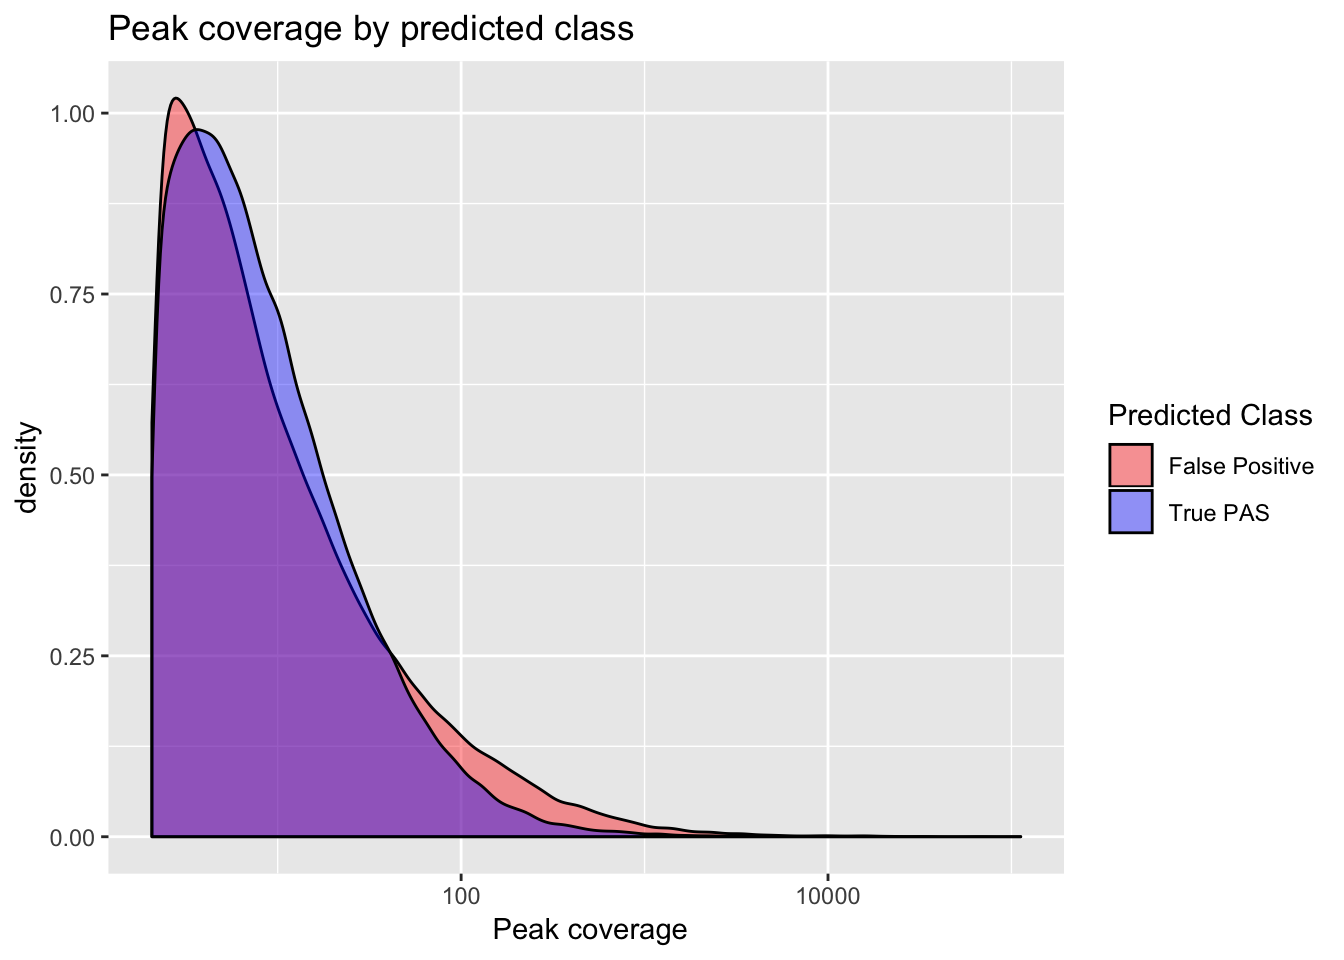 ```
```
Session information
sessionInfo()R version 3.5.1 (2018-07-02)
Platform: x86_64-apple-darwin15.6.0 (64-bit)
Running under: macOS Sierra 10.12.6
Matrix products: default
BLAS: /Library/Frameworks/R.framework/Versions/3.5/Resources/lib/libRblas.0.dylib
LAPACK: /Library/Frameworks/R.framework/Versions/3.5/Resources/lib/libRlapack.dylib
locale:
[1] en_US.UTF-8/en_US.UTF-8/en_US.UTF-8/C/en_US.UTF-8/en_US.UTF-8
attached base packages:
[1] stats4 parallel stats graphics grDevices utils datasets
[8] methods base
other attached packages:
[1] bindrcpp_0.2.2 tidyr_0.8.1
[3] gridExtra_2.3 dplyr_0.7.6
[5] ggplot2_3.0.0 ggseqlogo_0.1
[7] BSgenome.Hsapiens.UCSC.hg19_1.4.0 cleanUpdTSeq_1.18.0
[9] e1071_1.6-8 seqinr_3.4-5
[11] BSgenome.Drerio.UCSC.danRer7_1.4.0 BSgenome_1.48.0
[13] rtracklayer_1.40.3 Biostrings_2.48.0
[15] XVector_0.20.0 GenomicRanges_1.32.6
[17] GenomeInfoDb_1.16.0 IRanges_2.14.10
[19] S4Vectors_0.18.3 BiocGenerics_0.26.0
[21] workflowr_1.1.1
loaded via a namespace (and not attached):
[1] Rcpp_0.12.18 lattice_0.20-35
[3] Rsamtools_1.32.2 class_7.3-14
[5] assertthat_0.2.0 rprojroot_1.3-2
[7] digest_0.6.15 R6_2.2.2
[9] plyr_1.8.4 backports_1.1.2
[11] evaluate_0.11 pillar_1.3.0
[13] zlibbioc_1.26.0 rlang_0.2.1
[15] lazyeval_0.2.1 rstudioapi_0.7
[17] whisker_0.3-2 R.utils_2.6.0
[19] R.oo_1.22.0 Matrix_1.2-14
[21] rmarkdown_1.10 labeling_0.3
[23] BiocParallel_1.14.2 stringr_1.3.1
[25] RCurl_1.95-4.11 munsell_0.5.0
[27] DelayedArray_0.6.2 compiler_3.5.1
[29] pkgconfig_2.0.1 htmltools_0.3.6
[31] tidyselect_0.2.4 SummarizedExperiment_1.10.1
[33] tibble_1.4.2 GenomeInfoDbData_1.1.0
[35] matrixStats_0.54.0 XML_3.98-1.12
[37] withr_2.1.2 crayon_1.3.4
[39] GenomicAlignments_1.16.0 MASS_7.3-50
[41] bitops_1.0-6 R.methodsS3_1.7.1
[43] grid_3.5.1 gtable_0.2.0
[45] git2r_0.23.0 magrittr_1.5
[47] scales_0.5.0 stringi_1.2.4
[49] tools_3.5.1 ade4_1.7-11
[51] Biobase_2.40.0 glue_1.3.0
[53] purrr_0.2.5 yaml_2.1.19
[55] colorspace_1.3-2 knitr_1.20
[57] bindr_0.1.1
This reproducible R Markdown analysis was created with workflowr 1.1.1