Dimension reduction
Dave Tang
2023-09-10
Last updated: 2023-09-10
Checks: 7 0
Knit directory: bioinformatics_tips/
This reproducible R Markdown analysis was created with workflowr (version 1.7.0). The Checks tab describes the reproducibility checks that were applied when the results were created. The Past versions tab lists the development history.
Great! Since the R Markdown file has been committed to the Git repository, you know the exact version of the code that produced these results.
Great job! The global environment was empty. Objects defined in the global environment can affect the analysis in your R Markdown file in unknown ways. For reproduciblity it’s best to always run the code in an empty environment.
The command set.seed(20200503) was run prior to running
the code in the R Markdown file. Setting a seed ensures that any results
that rely on randomness, e.g. subsampling or permutations, are
reproducible.
Great job! Recording the operating system, R version, and package versions is critical for reproducibility.
Nice! There were no cached chunks for this analysis, so you can be confident that you successfully produced the results during this run.
Great job! Using relative paths to the files within your workflowr project makes it easier to run your code on other machines.
Great! You are using Git for version control. Tracking code development and connecting the code version to the results is critical for reproducibility.
The results in this page were generated with repository version b6d9d00. See the Past versions tab to see a history of the changes made to the R Markdown and HTML files.
Note that you need to be careful to ensure that all relevant files for
the analysis have been committed to Git prior to generating the results
(you can use wflow_publish or
wflow_git_commit). workflowr only checks the R Markdown
file, but you know if there are other scripts or data files that it
depends on. Below is the status of the Git repository when the results
were generated:
Ignored files:
    Ignored:    .Rproj.user/
Note that any generated files, e.g. HTML, png, CSS, etc., are not included in this status report because it is ok for generated content to have uncommitted changes.
These are the previous versions of the repository in which changes were
made to the R Markdown (analysis/dim_reduct.Rmd) and HTML
(docs/dim_reduct.html) files. If you’ve configured a remote
Git repository (see ?wflow_git_remote), click on the
hyperlinks in the table below to view the files as they were in that
past version.
| File | Version | Author | Date | Message |
|---|---|---|---|---|
| Rmd | b6d9d00 | Dave Tang | 2023-09-10 | Normalise data |
| html | ca74424 | Dave Tang | 2022-10-27 | Build site. |
| Rmd | cfb532a | Dave Tang | 2022-10-27 | Dimension reduction |
Dimension reduction is useful for identifying correlated features and reducing the data size, which is very useful for visualising large datasets.
Data
Use iris.
dat <- as.matrix(iris[, 1:4])
dat[1:6, 1:4]
Sepal.Length Sepal.Width Petal.Length Petal.Width
[1,] 5.1 3.5 1.4 0.2
[2,] 4.9 3.0 1.4 0.2
[3,] 4.7 3.2 1.3 0.2
[4,] 4.6 3.1 1.5 0.2
[5,] 5.0 3.6 1.4 0.2
[6,] 5.4 3.9 1.7 0.4Normalise data using scale.
dat_norm <- scale(dat)
dat_norm[1:6, 1:4]
Sepal.Length Sepal.Width Petal.Length Petal.Width
[1,] -0.8976739 1.01560199 -1.335752 -1.311052
[2,] -1.1392005 -0.13153881 -1.335752 -1.311052
[3,] -1.3807271 0.32731751 -1.392399 -1.311052
[4,] -1.5014904 0.09788935 -1.279104 -1.311052
[5,] -1.0184372 1.24503015 -1.335752 -1.311052
[6,] -0.5353840 1.93331463 -1.165809 -1.048667Before normalising.
apply(dat, 2, summary) Sepal.Length Sepal.Width Petal.Length Petal.Width
Min. 4.300000 2.000000 1.000 0.100000
1st Qu. 5.100000 2.800000 1.600 0.300000
Median 5.800000 3.000000 4.350 1.300000
Mean 5.843333 3.057333 3.758 1.199333
3rd Qu. 6.400000 3.300000 5.100 1.800000
Max. 7.900000 4.400000 6.900 2.500000After normalising.
apply(dat_norm, 2, summary) Sepal.Length Sepal.Width
Min. -1.8637802962695177999564 -2.4258204175780471167911
1st Qu. -0.8976738791967662223215 -0.5903951331558174864256
Median -0.0523307642581080645350 -0.1315388120502595792338
Mean -0.0000000000000004484318 0.0000000000000002034094
3rd Qu. 0.6722490485464565068696 0.5567456696080762545975
Max. 2.4836985805578661867798 3.0804554356886435506624
Petal.Length Petal.Width
Min. -1.56234224225534856778097 -1.44224482481004634415456
1st Qu. -1.22245633023460542609939 -1.17985947160021398261165
Median 0.33535409986046643693314 0.13206729444894910185937
Mean -0.00000000000000002895326 -0.00000000000000003663049
3rd Qu. 0.76021148988639486443475 0.78803067747353061633930
Max. 1.77986922594862417845718 1.70637941370794465889560PCA
The prcomp() function:
Performs a principal components analysis on the given data matrix and returns the results as an object of class prcomp.
pca <- prcomp(dat_norm)
my_col <- as.integer(iris$Species)

plot(pca$x, col = my_col, pch = 16)
| Version | Author | Date |
|---|---|---|
| ca74424 | Dave Tang | 2022-10-27 |
t-SNE
Install (if necessary) and load.
if(!require(tsne)){
  install.packages("tsne")
}
library(tsne)
t-SNE default perplexity of 30.
tsne_ <- tsne(dat_norm)

plot(tsne_, col = my_col, pch = 16)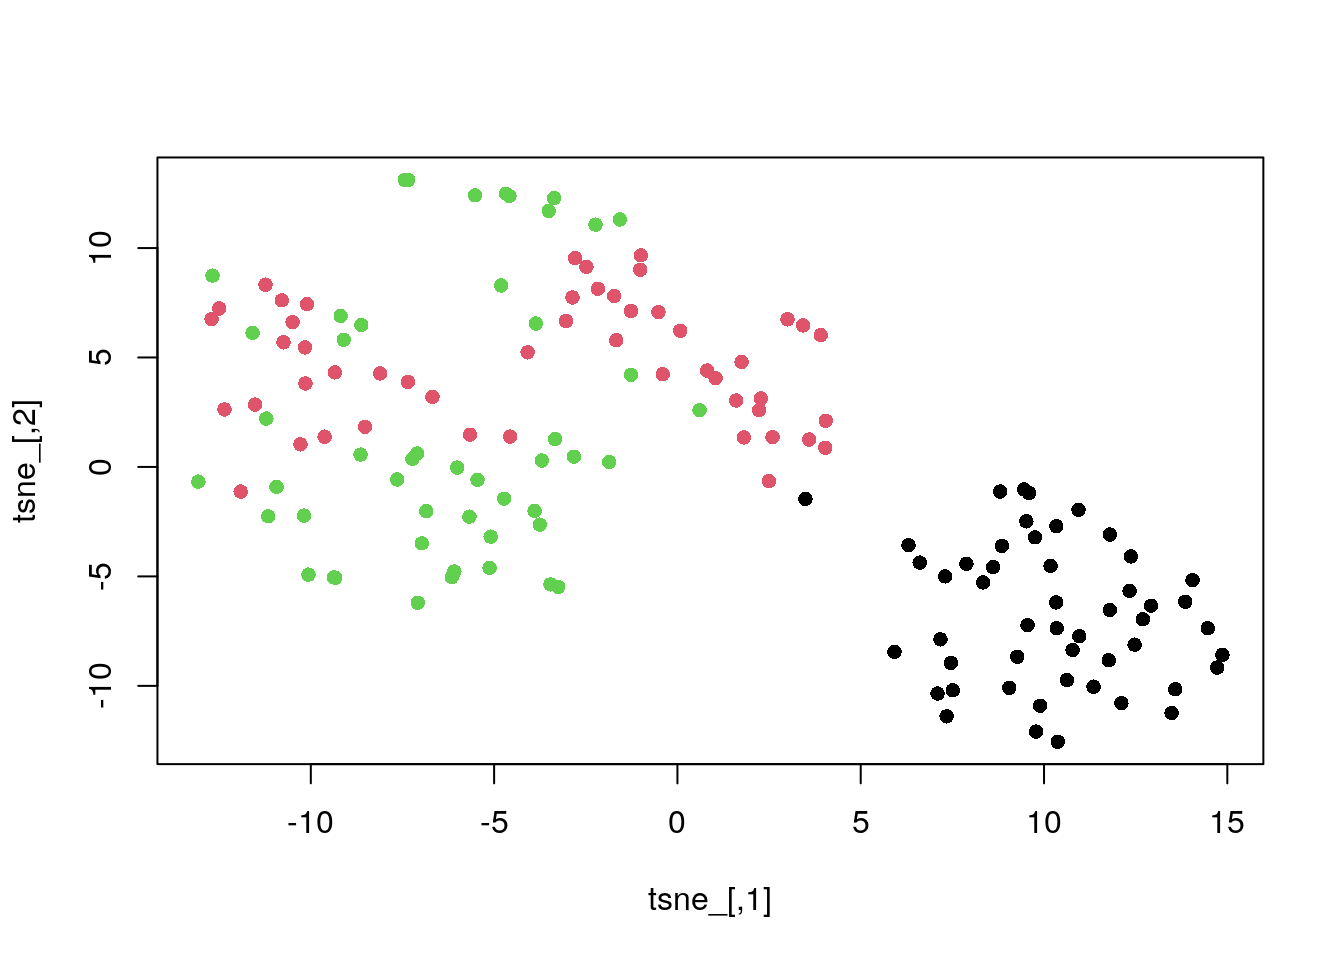
| Version | Author | Date |
|---|---|---|
| ca74424 | Dave Tang | 2022-10-27 |
Perplexity of 20.
tsne_p20 <- tsne(dat_norm, perplexity = 20)

plot(tsne_p20, col = my_col, pch = 16)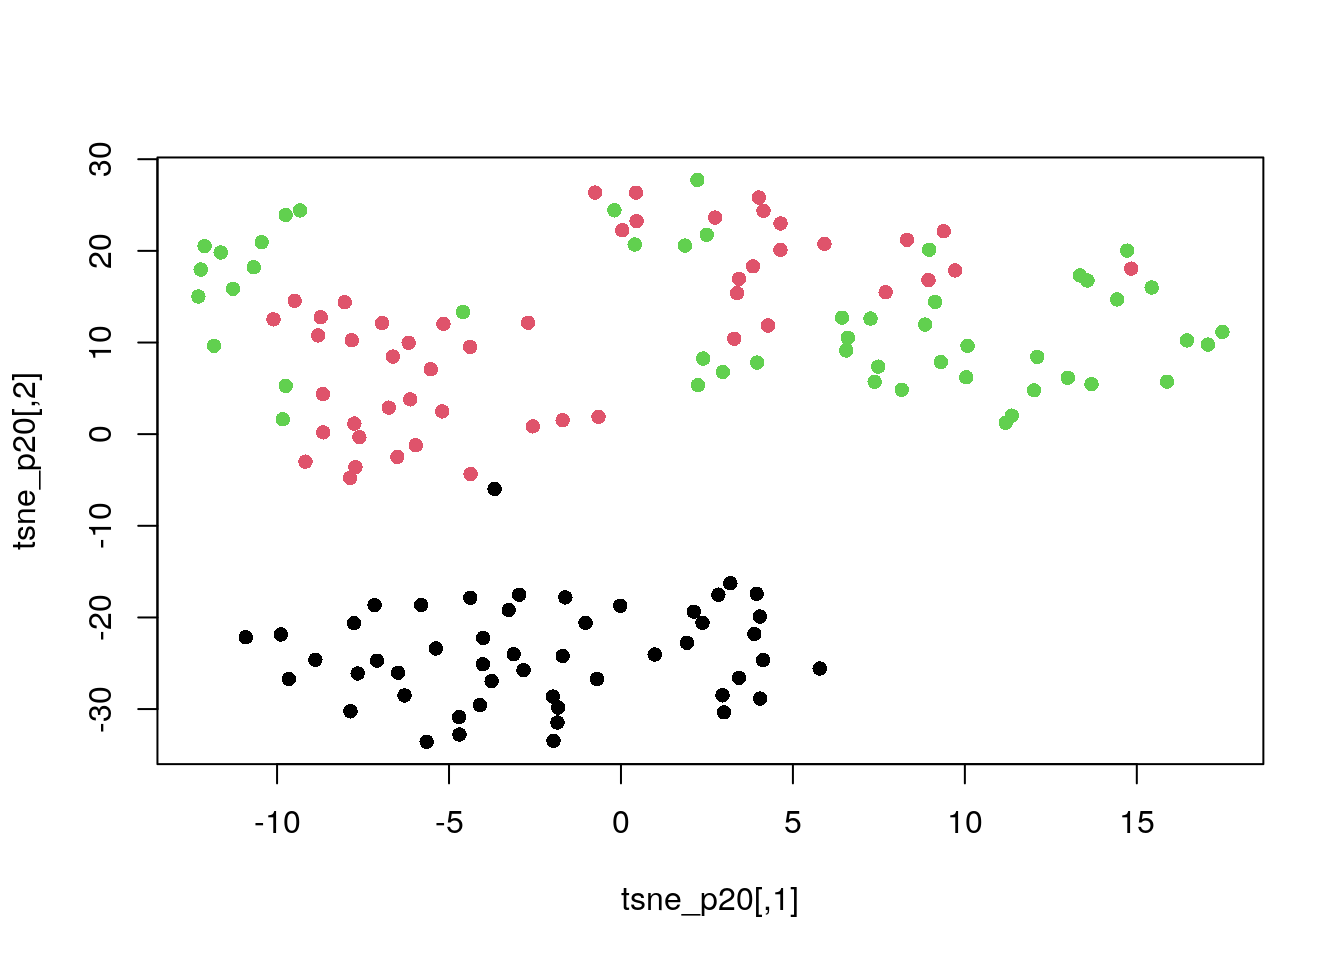
| Version | Author | Date |
|---|---|---|
| ca74424 | Dave Tang | 2022-10-27 |
Perplexity of 40.
tsne_p40 <- tsne(dat_norm, perplexity = 40)

plot(tsne_p40, col = my_col, pch = 16)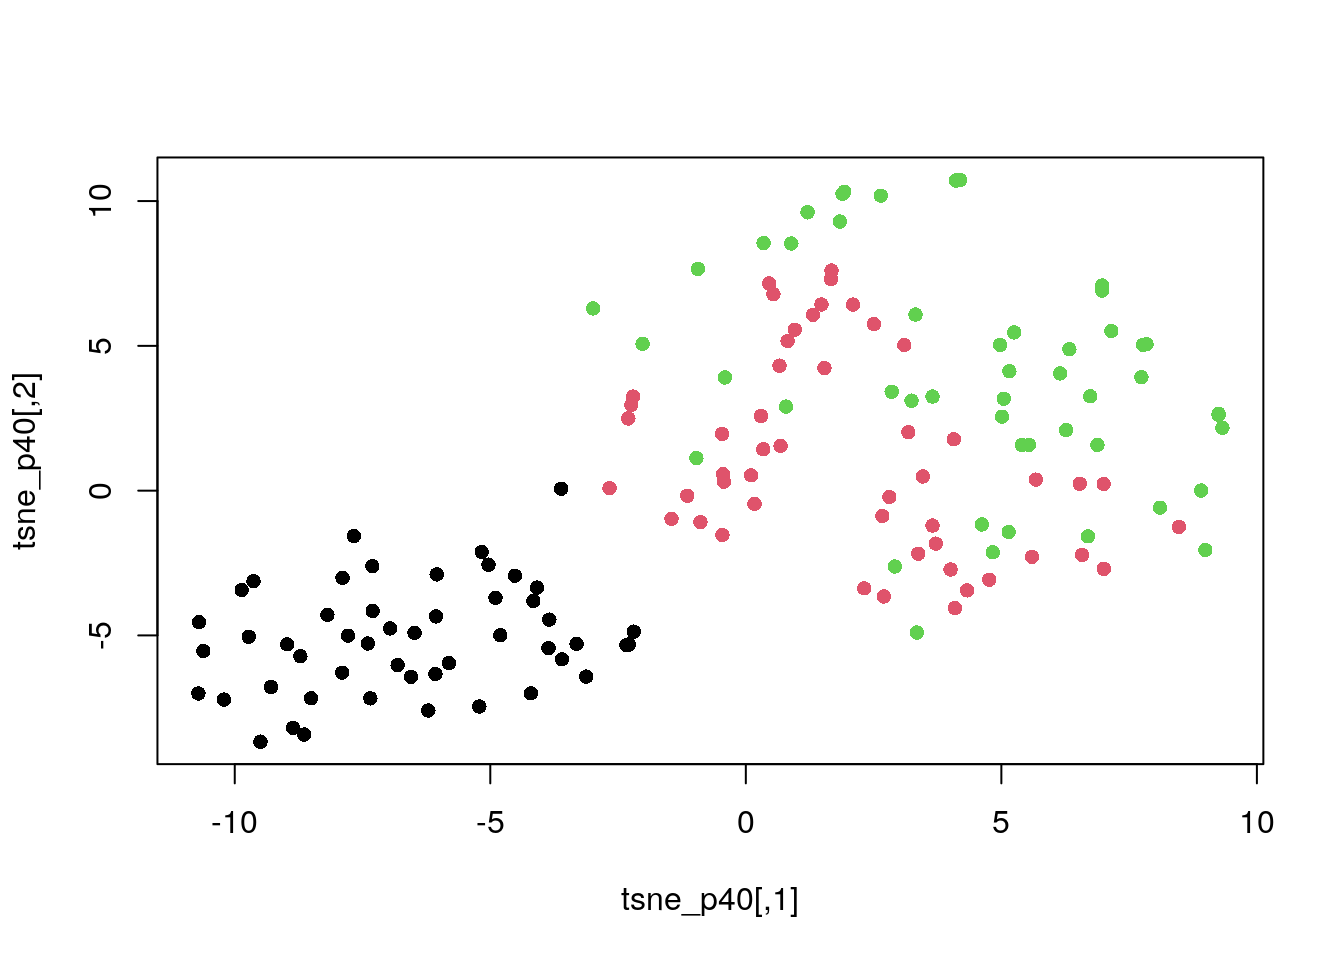
| Version | Author | Date |
|---|---|---|
| ca74424 | Dave Tang | 2022-10-27 |
Perplexity of 50.
tsne_p50 <- tsne(dat_norm, perplexity = 50)

plot(tsne_p50, col = my_col, pch = 16)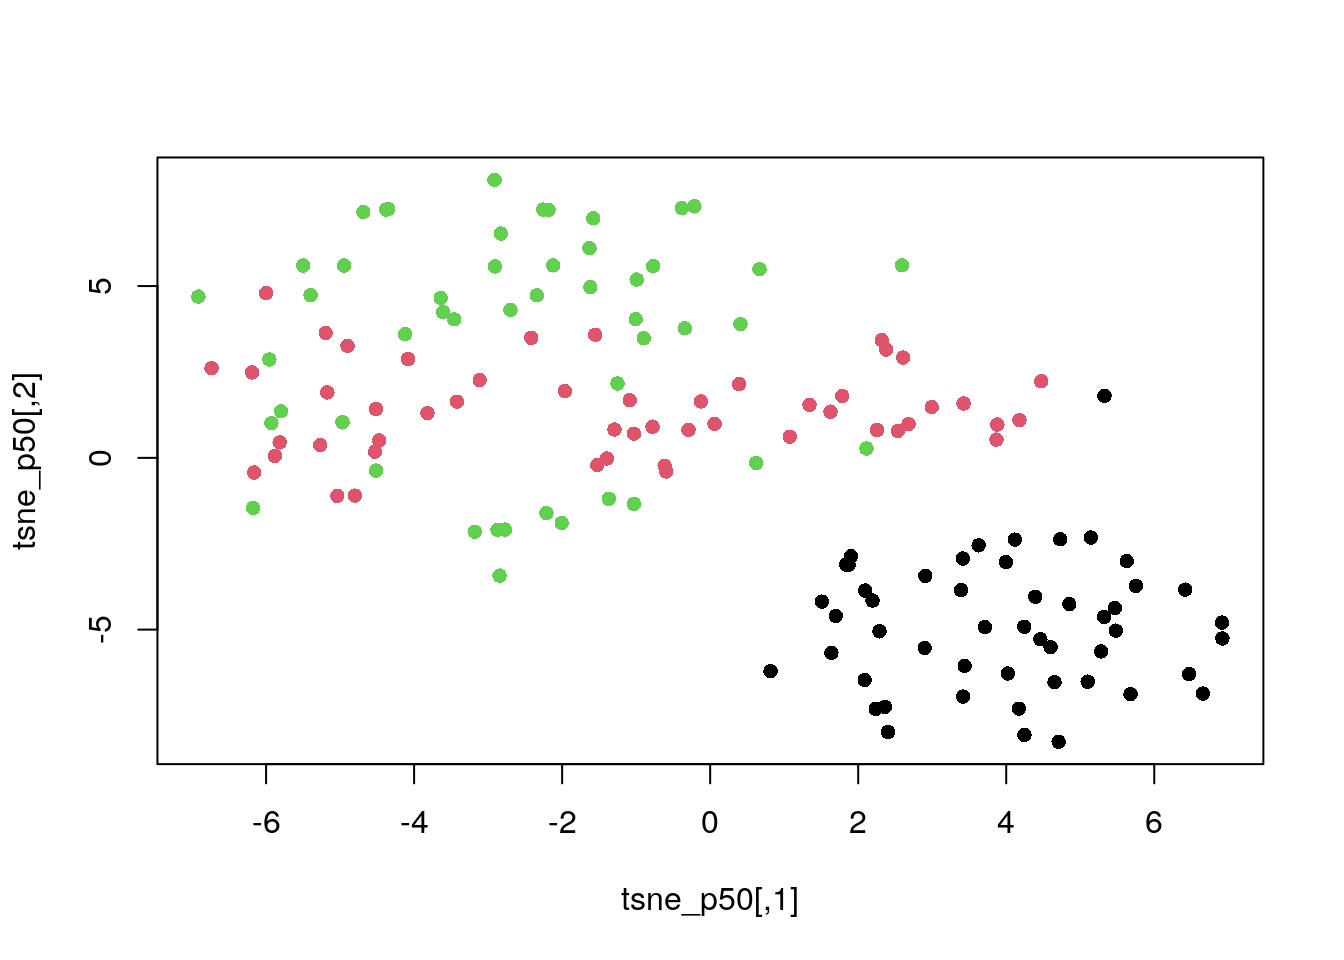
| Version | Author | Date |
|---|---|---|
| ca74424 | Dave Tang | 2022-10-27 |
UMAP
Install (if necessary) and load.
if(!require(umap)){
  install.packages("umap")
}
library(umap)
UMAP default settings.
umap.defaultsumap configuration parameters n_neighbors: 15 n_components: 2 metric: euclidean n_epochs: 200 input: data init: spectral min_dist: 0.1 set_op_mix_ratio: 1 local_connectivity: 1 bandwidth: 1 alpha: 1 gamma: 1 negative_sample_rate: 5 a: NA b: NA spread: 1 random_state: NA transform_state: NA knn: NA knn_repeats: 1 verbose: FALSE umap_learn_args: NAUMAP with default settings.
umap_ <- umap(dat_norm)

plot(umap_$layout, col = my_col, pch = 16)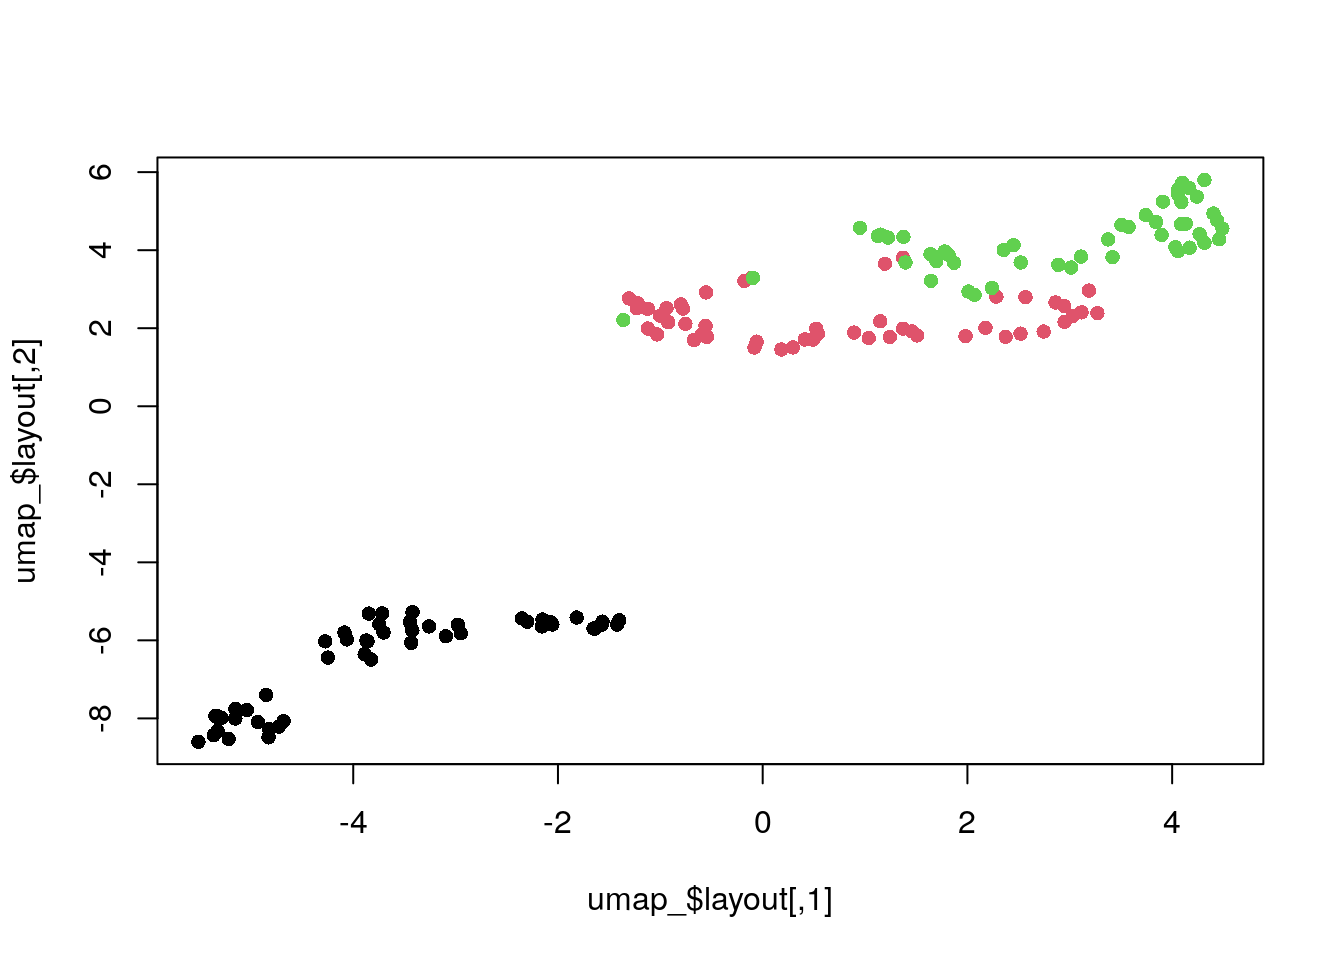
| Version | Author | Date |
|---|---|---|
| ca74424 | Dave Tang | 2022-10-27 |
Adjust number of neighbours.
umap_conf <- umap.defaults
umap_conf$n_neighbors <- 20

umap_n20 <- umap(dat_norm, config = umap_conf)
plot(umap_n20$layout, col = my_col, pch = 16)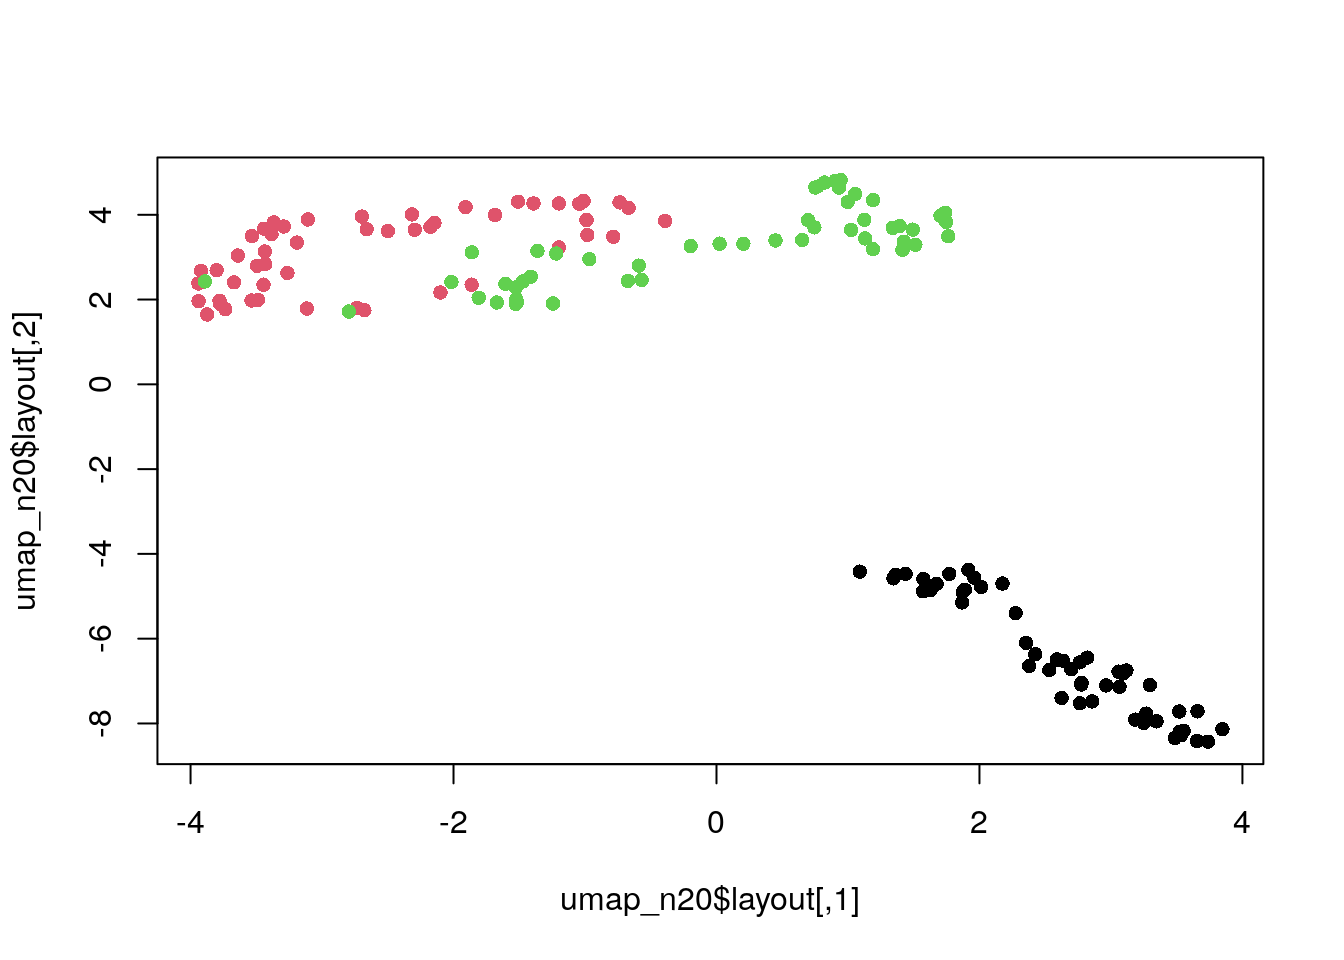
| Version | Author | Date |
|---|---|---|
| ca74424 | Dave Tang | 2022-10-27 |
sessionInfo()R version 4.3.0 (2023-04-21)
Platform: x86_64-pc-linux-gnu (64-bit)
Running under: Ubuntu 22.04.2 LTS
Matrix products: default
BLAS: /usr/lib/x86_64-linux-gnu/openblas-pthread/libblas.so.3
LAPACK: /usr/lib/x86_64-linux-gnu/openblas-pthread/libopenblasp-r0.3.20.so; LAPACK version 3.10.0
locale:
[1] LC_CTYPE=en_US.UTF-8 LC_NUMERIC=C
[3] LC_TIME=en_US.UTF-8 LC_COLLATE=en_US.UTF-8
[5] LC_MONETARY=en_US.UTF-8 LC_MESSAGES=en_US.UTF-8
[7] LC_PAPER=en_US.UTF-8 LC_NAME=C
[9] LC_ADDRESS=C LC_TELEPHONE=C
[11] LC_MEASUREMENT=en_US.UTF-8 LC_IDENTIFICATION=C
time zone: Etc/UTC
tzcode source: system (glibc)
attached base packages:
[1] stats graphics grDevices utils datasets methods base
other attached packages:
[1] umap_0.2.10.0 tsne_0.1-3.1 workflowr_1.7.0
loaded via a namespace (and not attached):
[1] Matrix_1.5-4 jsonlite_1.8.4 compiler_4.3.0 highr_0.10
[5] promises_1.2.0.1 Rcpp_1.0.10 stringr_1.5.0 git2r_0.32.0
[9] callr_3.7.3 later_1.3.0 jquerylib_0.1.4 png_0.1-8
[13] yaml_2.3.7 fastmap_1.1.1 reticulate_1.31 lattice_0.21-8
[17] R6_2.5.1 knitr_1.42 tibble_3.2.1 openssl_2.0.6
[21] rprojroot_2.0.3 bslib_0.4.2 pillar_1.9.0 rlang_1.1.0
[25] utf8_1.2.3 cachem_1.0.7 stringi_1.7.12 httpuv_1.6.9
[29] xfun_0.39 getPass_0.2-2 fs_1.6.2 sass_0.4.5
[33] cli_3.6.1 magrittr_2.0.3 ps_1.7.5 grid_4.3.0
[37] digest_0.6.31 processx_3.8.1 rstudioapi_0.14 askpass_1.1
[41] lifecycle_1.0.3 vctrs_0.6.2 RSpectra_0.16-1 evaluate_0.20
[45] glue_1.6.2 whisker_0.4.1 fansi_1.0.4 rmarkdown_2.21
[49] httr_1.4.5 tools_4.3.0 pkgconfig_2.0.3 htmltools_0.5.5