Selection Models
Daniel J. Kunz & Davis J. McCarthy
Last updated: 2018-08-29
workflowr checks: (Click a bullet for more information)-
✔ R Markdown file: up-to-date
Great! Since the R Markdown file has been committed to the Git repository, you know the exact version of the code that produced these results.
-
✔ Environment: empty
Great job! The global environment was empty. Objects defined in the global environment can affect the analysis in your R Markdown file in unknown ways. For reproduciblity it’s best to always run the code in an empty environment.
-
✔ Seed:
set.seed(20180807)The command
set.seed(20180807)was run prior to running the code in the R Markdown file. Setting a seed ensures that any results that rely on randomness, e.g. subsampling or permutations, are reproducible. -
✔ Session information: recorded
Great job! Recording the operating system, R version, and package versions is critical for reproducibility.
-
Great! You are using Git for version control. Tracking code development and connecting the code version to the results is critical for reproducibility. The version displayed above was the version of the Git repository at the time these results were generated.✔ Repository version: 128fea5
Note that you need to be careful to ensure that all relevant files for the analysis have been committed to Git prior to generating the results (you can usewflow_publishorwflow_git_commit). workflowr only checks the R Markdown file, but you know if there are other scripts or data files that it depends on. Below is the status of the Git repository when the results were generated:
Note that any generated files, e.g. HTML, png, CSS, etc., are not included in this status report because it is ok for generated content to have uncommitted changes.Ignored files: Ignored: .DS_Store Ignored: .Rhistory Ignored: .Rproj.user/ Ignored: .vscode/ Ignored: code/.DS_Store Ignored: data/raw/ Ignored: src/.DS_Store Ignored: src/Rmd/.Rhistory Untracked files: Untracked: Snakefile_clonality Untracked: Snakefile_somatic_calling Untracked: code/analysis_for_garx.Rmd Untracked: code/selection/ Untracked: code/yuanhua/ Untracked: data/canopy/ Untracked: data/cell_assignment/ Untracked: data/de_analysis_FTv62/ Untracked: data/donor_info_070818.txt Untracked: data/donor_info_core.csv Untracked: data/donor_neutrality.tsv Untracked: data/exome-point-mutations/ Untracked: data/fdr10.annot.txt.gz Untracked: data/human_H_v5p2.rdata Untracked: data/human_c2_v5p2.rdata Untracked: data/human_c6_v5p2.rdata Untracked: data/neg-bin-rsquared-petr.csv Untracked: data/neutralitytestr-petr.tsv Untracked: data/sce_merged_donors_cardelino_donorid_all_qc_filt.rds Untracked: data/sce_merged_donors_cardelino_donorid_all_with_qc_labels.rds Untracked: data/sce_merged_donors_cardelino_donorid_unstim_qc_filt.rds Untracked: data/sces/ Untracked: data/selection/ Untracked: data/simulations/ Untracked: data/variance_components/ Untracked: figures/ Untracked: output/differential_expression/ Untracked: output/donor_specific/ Untracked: output/line_info.tsv Untracked: output/nvars_by_category_by_donor.tsv Untracked: output/nvars_by_category_by_line.tsv Untracked: output/variance_components/ Untracked: references/ Untracked: tree.txt
Expand here to see past versions:
Load libraries and data
knitr::opts_chunk$set(echo = TRUE)
library(ggplot2)
library(viridis)
library(ggrepel)
library(neutralitytestr)
library(cowplot)
library(plyr)
dir.create("figures/selection", showWarnings = FALSE, recursive = TRUE)
Load the call set and extract the allele frequencies which used for the fits of the selection models.
filteredAF = read.table("data/exome-point-mutations/high-vs-low-exomes.v62.ft.filt_lenient-alldonors.txt.gz",
                        header = TRUE, stringsAsFactors = FALSE)

mut_list = data.frame("sampleID" = filteredAF$donor_short_id,
                      "af_fibro" = filteredAF$nALT_fibro/(filteredAF$nREF_fibro + filteredAF$nALT_fibro),
                      "af_ips" = filteredAF$nALT_ips/(filteredAF$nREF_ips + filteredAF$nALT_ips),
                      "chr" = filteredAF$chrom,
                      "pos" = filteredAF$pos,
                      "ref" = filteredAF$ref,
                      "mut" = filteredAF$alt,
                      "mutID" = paste(filteredAF$chrom, filteredAF$pos, filteredAF$ref, filteredAF$alt, sep = "_"))

mut_list = mut_list[order(mut_list$sampleID),]
write.table(mut_list, "data/selection/ips-fibro-AF.tsv",
            row.names = FALSE, quote = FALSE, sep = "\t")

mut_list = data.frame("sampleID" = filteredAF$donor_short_id,
                      "af" = filteredAF$nALT_fibro/(filteredAF$nREF_fibro + filteredAF$nALT_fibro),
                      "chr" = filteredAF$chrom,
                      "pos" = filteredAF$pos,
                      "ref" = filteredAF$ref,
                      "mut" = filteredAF$alt)
mut_list = mut_list[order(mut_list$sampleID),]

write.table(mut_list, "data/selection/full-AF.tsv", row.names = FALSE,
            quote = FALSE, sep = "\t")

dir.create("data/selection/AF", showWarnings = FALSE)

for (sampleID in unique(mut_list$sampleID)) {
  sub_mut_list = mut_list[mut_list$sampleID == sampleID,]
  sub_mut_list = sub_mut_list[sub_mut_list$af >= 0.03,]
  write.table(sub_mut_list, paste0("data/selection/AF/AF-", sampleID, ".tsv"),
              row.names = FALSE, quote = FALSE, sep = "\t")
}
Fit selection models
Please open the Mathematica notebook (code/selection/fit-dist.nb) and run it by hand (the outputs generated are used in subsequent cells). The notebook fits the negative binomial model for neutral evolution.
In case you do not have access to Mathematica to run the notebook, we provide its output files in data/selection/neg-bin-params-fit.csv and data/selection/neg-bin-rsquared-fit.csv.
The code below runs the neutralitytestr model.
fmin = 0.05
fmax = 0.45

petrAF = read.table("data/selection/full-AF.tsv", sep = "\t", header = T)
donors = unique(as.vector(petrAF$sampleID))

getSampleNtrtest <- function(afDF, sampleID, fmin, fmax){
  # run neutralitytestr on a single sample
  VAFsample = afDF[afDF$sampleID == sampleID, "af"]
  out = neutralitytest(VAFsample, fmin = fmin, fmax = fmax)
  results = c(sampleID,
              out$area$metric, out$area$pval,
              out$Dk$metric, out$Dk$pval,
              out$meanDist$metric, out$meanDist$pval,
              out$rsq$metric, out$rsq$pval,
              out$mutation.rate)
  names(results) = c("sampleID",
                     "area", "pval_area",
                     "Dk", "pval_Dk",
                     "meanDist", "pval_meanDist",
                     "rsq", "pval_rsq",
                     "mutrate")
  return(results)
}

ntrtestrPetrout = t(sapply(donors,
                           function(sampleID) getSampleNtrtest(
                             petrAF, sampleID, fmin, fmax)))
write.table(ntrtestrPetrout, "data/selection/neutralitytestr.tsv",
            sep = "\t", quote = FALSE, row.names = FALSE)
Plot selection classification
Plot the selection classification based on the goodness of fit results from neutrality testr and the negative binomial like fit.
ntrtestrPetr = read.table("data/selection/neutralitytestr.tsv",
                          stringsAsFactors = FALSE, header = TRUE)

negbinfitPetr = read.table("data/selection/neg-bin-rsquared-fit.csv",
                           stringsAsFactors = FALSE, header = TRUE, sep = ",")
negbinfitPetr$sampleID = negbinfitPetr$fname
negbinfitPetr$sampleID = gsub("AF-", "", negbinfitPetr$sampleID)
negbinfitPetr$sampleID = gsub(".tsv", "", negbinfitPetr$sampleID)
rownames(negbinfitPetr) = negbinfitPetr$sampleID

dfrsq = data.frame(sampleID = ntrtestrPetr$sampleID,
                   rsq_ntrtestr = ntrtestrPetr$rsq,
                   rsq_negbinfit = negbinfitPetr[ntrtestrPetr$sampleID, "rsq"])

cutoff_selection_cummut = 0.85
cutoff_selection_negbin = 0.25
cutoff_neutral_cummut = 0.9
cutoff_neutral_negbin = 0.55


donors = c("euts", "fawm", "feec", "fikt", "garx", "gesg", "heja", "hipn", "ieki",
           "joxm", "kuco", "laey", "lexy", "naju", "nusw", "oaaz", "oilg", "pipw",
           "puie", "qayj", "qolg", "qonc", "rozh", "sehl", "ualf", "vass", "vils",
           "vuna", "wahn", "wetu", "xugn", "zoxy")

dfrsq = dfrsq[(dfrsq$sampleID %in% donors),]

dfrsq$candidatelabel = NA
dfrsq$candidatelabel[dfrsq$sampleID == "puie"] = "puie"

filter_selection = (dfrsq$rsq_ntrtestr < cutoff_selection_cummut) & (dfrsq$rsq_negbinfit < cutoff_selection_negbin)
filter_neutral = (dfrsq$rsq_ntrtestr > cutoff_neutral_cummut) & (dfrsq$rsq_negbinfit > cutoff_neutral_negbin)

dfrsq$selection = "undetermined"
dfrsq$selection[filter_selection] = "selected"
dfrsq$selection[filter_neutral] = "neutral"


plt_scatter = ggplot(dfrsq, aes(x = rsq_negbinfit, y = rsq_ntrtestr)) +
  scale_colour_manual(values = c("neutral" = "#007536", "selected" = "#5EF288",
                               "undetermined" = "#CCCCCC")) +
  geom_point(aes(colour = selection)) +
  geom_label_repel(aes(label = candidatelabel), color = "white",
                   size = 2.5,
                   fill = "black", box.padding = 0.35, point.padding = 0.5,
                   segment.color = 'grey50') +
  theme_bw() +
  theme(text = element_text(size = 9), axis.text = element_text(size = 8),
        axis.title = element_text(size = 9),
        plot.title = element_text(size = 9, hjust = 0.5)) +
  labs(x = "Goodness of Fit - Negative Binomial Distribution",
       y = "Goodness of Fit - Cumulative Mutations") +
  theme(strip.background = element_blank()) +
  labs(title = "") +
  theme(legend.justification = c(1,0), legend.position = c(1,0)) +
  theme(legend.background = element_rect(fill = "transparent",
                                         colour = "transparent"),
        legend.key.size = unit(0.25, "cm")) +
  labs(colour = "Selection")

plt_scatter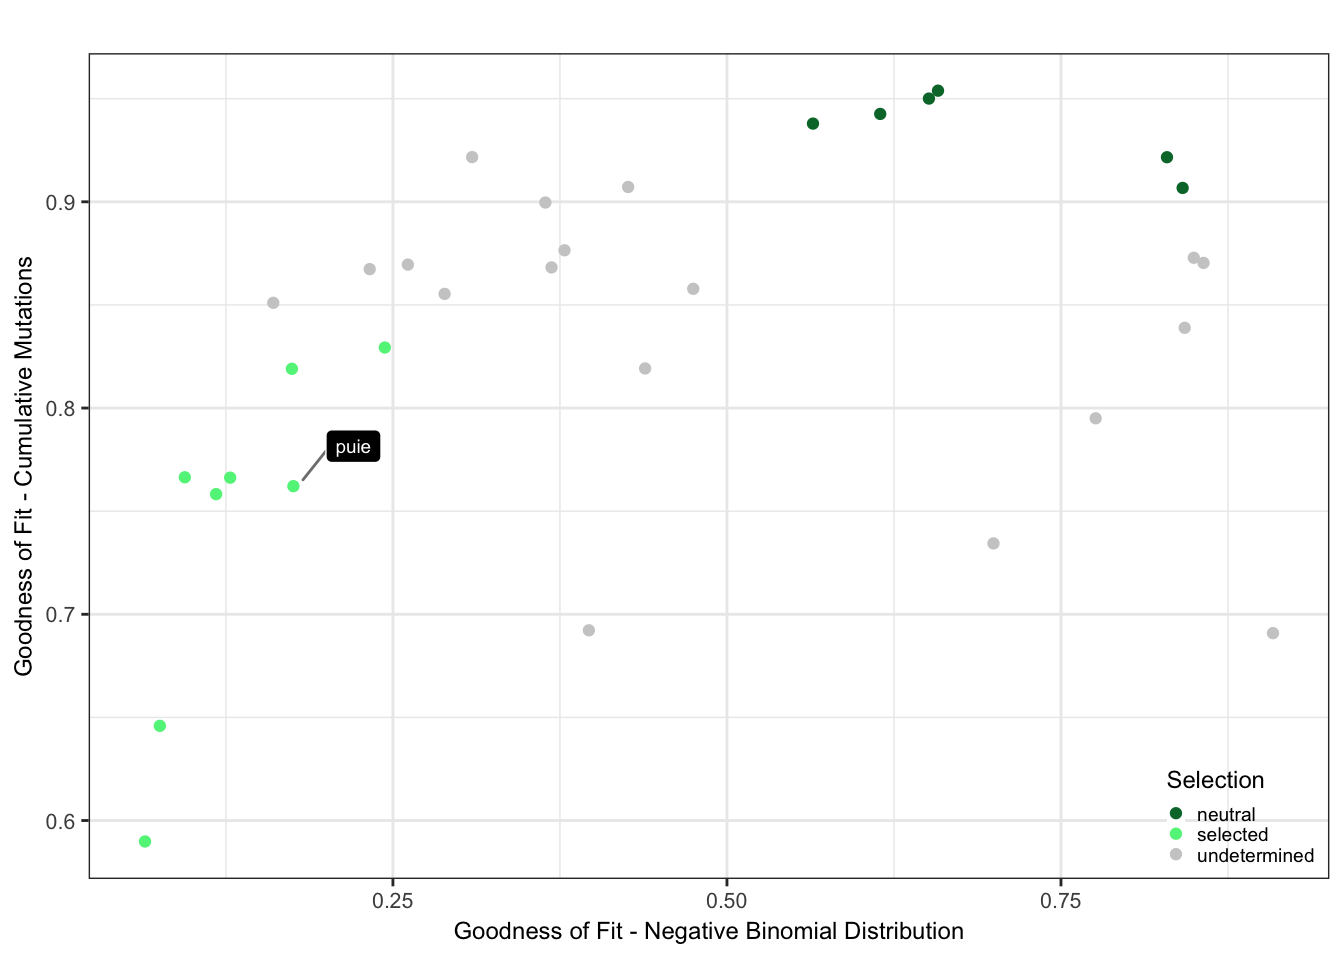
Expand here to see past versions of plot-prev-1.png:
| Version | Author | Date |
|---|---|---|
| 7888ad3 | davismcc | 2018-08-26 |
Visualise negative binomial model
Results from the negative binomial model for neutral evolution.
dfAFpetr = read.table("data/selection/full-AF.tsv", sep = "\t",
                      stringsAsFactors = FALSE, header = TRUE)
dfAFpetr = dfAFpetr[dfAFpetr$sampleID %in% donors,]

fitparamspetr = read.csv("data/selection/neg-bin-params-fit.csv",
                         stringsAsFactors = FALSE, header = TRUE)
fitparamspetr$sampleID = gsub("AF-", "", fitparamspetr$fname)
fitparamspetr$sampleID = gsub(".tsv", "", fitparamspetr$sampleID)

a = 1
b = 1
fun.1 <- function(x, a=1, b=1) 1/(a*x)*exp(-x/b)
args = list(mean = 2, sd = .5)

dd <- data.frame(
  predicted = rnorm(72, mean = 2, sd = 2),
  state = rep(c("A", "B", "C"), each = 24)
)

# save generate plotting points
grid = seq(0.01, 0.6, length = 500)

normaldens <- ddply(fitparamspetr, "sampleID", function(df) {
  data.frame(
    predicted = grid,
    density = fun.1(grid, df$a, df$b)
  )
})

normaldens = normaldens[normaldens$sampleID %in% donors,]

dfAFpetr$id = sapply(dfAFpetr$sampleID,
                     function(sampleID) paste0(
                       sampleID, " (rsq ",
                       round(fitparamspetr$rsq[fitparamspetr$sampleID ==
                                                 sampleID],2),")"))
normaldens$id = sapply(normaldens$sampleID,
                       function(sampleID) dfAFpetr$id[dfAFpetr$sampleID ==
                                                        sampleID][1])

plt_hist = ggplot(dfAFpetr, aes(x = af)) +
  geom_vline(xintercept = fmin, colour = "grey") +
  geom_vline(xintercept = fmax, colour = "grey") +
  geom_histogram(binwidth = (fmax - fmin)/40) +
  geom_line(aes(x = predicted, y = density), data = normaldens, colour = "red") +
  facet_wrap(~ id, scales = "free_y", ncol = 4) +
  theme_bw() +
  theme(text = element_text(size = 9), axis.text = element_text(size = 8), axis.title = element_text(size = 9), plot.title = element_text(size = 9, hjust = 0.5)) +
  labs(x = paste0("Allele Frequency"), y = "# Mutations") +
  theme(legend.position = "none") +
  labs(colour = "") +
  theme(strip.background = element_blank()) +
  labs(title = "")


pname = paste0("selection-neg-bin-fit")
ppath = paste0("figures/selection/", pname, ".pdf")
ggsave(ppath, plot = plt_hist, width = 17, height = 20, units  =  "cm")
ppath  =  paste0("figures/selection/", pname, ".png")
ggsave(ppath, plot = plt_hist, width = 17, height = 20, dpi = 300, units = "cm", limitsize = FALSE)
plt_hist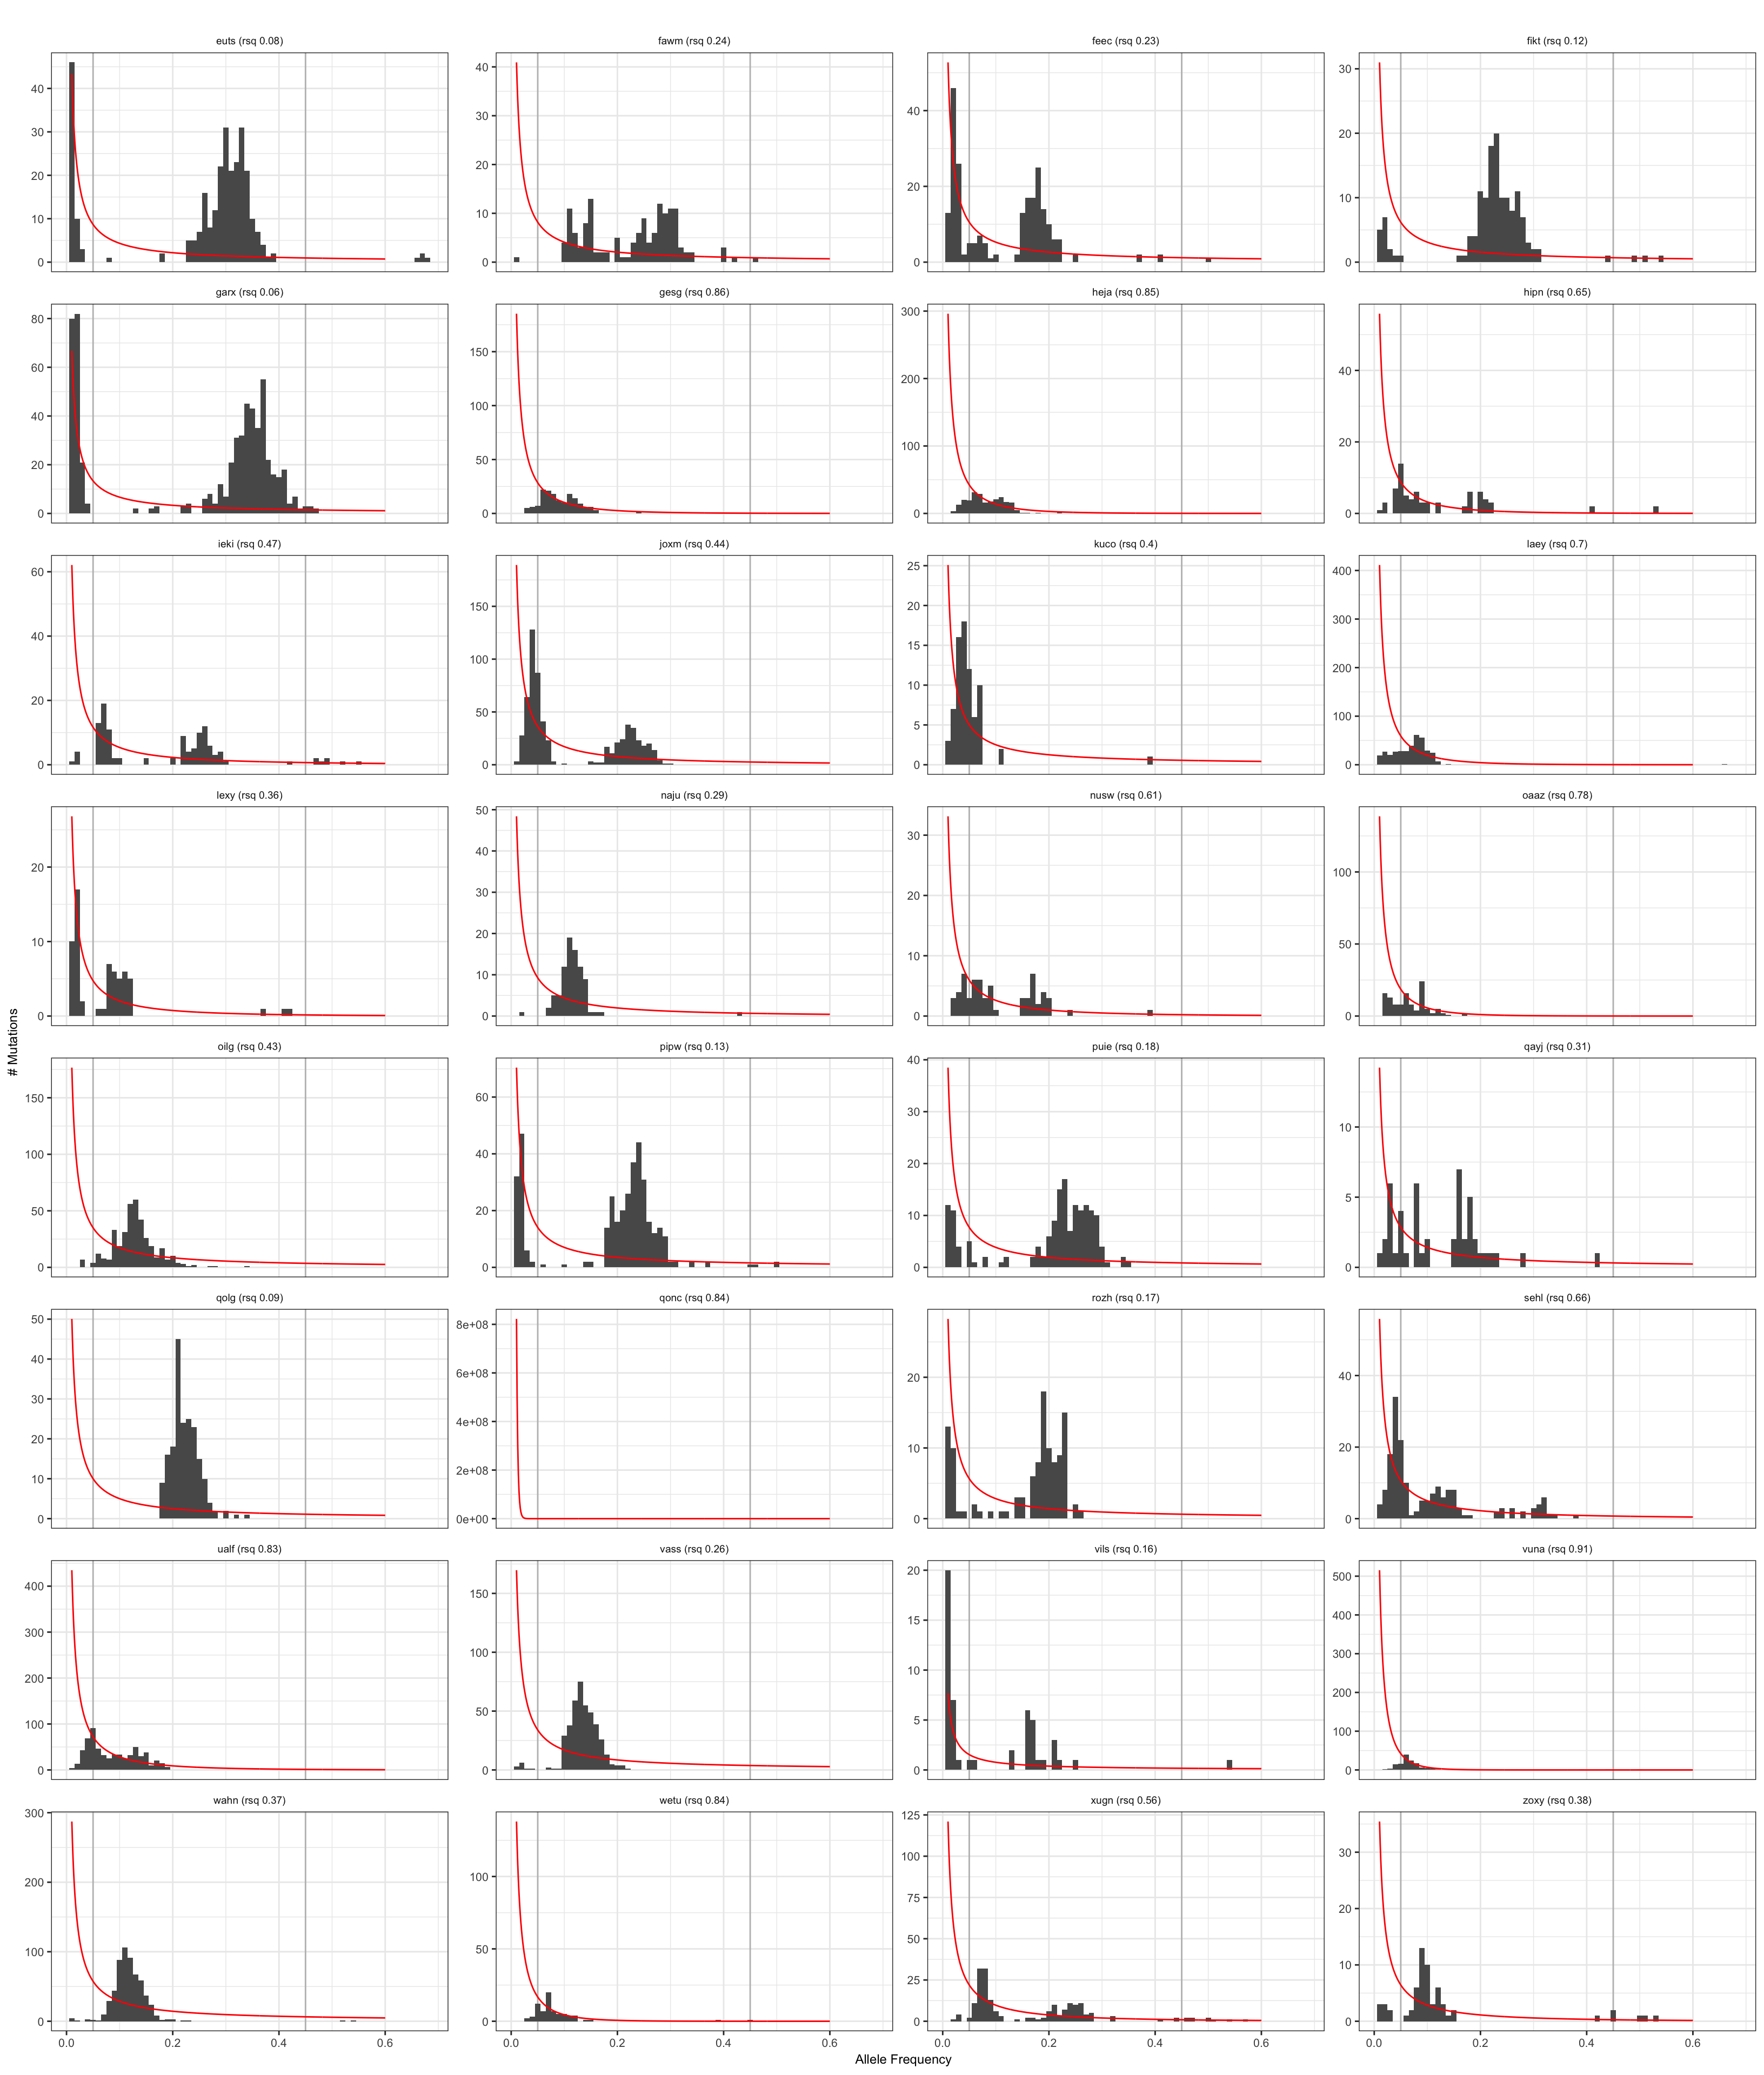
Expand here to see past versions of plot-neg-bin-fit-1.png:
| Version | Author | Date |
|---|---|---|
| 7888ad3 | davismcc | 2018-08-26 |
Visualise results from neutralitytestr
Results from the cumulative mutations model for neutral evolution.
dfntrtestr = read.table("data/selection/neutralitytestr.tsv",
                        stringsAsFactors = FALSE, header = TRUE)

plotSampleCumMut <- function(afDF, dfntrtestr, sampleID, fmin, fmax) {
  # plot cummulative mutations as per Sottoriva & Graham
  afDFsample = afDF[afDF$sampleID == sampleID, ]
  rsq = dfntrtestr$rsq[dfntrtestr$sampleID == sampleID]
  # cumsum with decreasing frequency
  afDFsample = afDFsample[order(afDFsample$af, decreasing = TRUE), ]
  afDFsample$cumsum = 1:length(afDFsample$af)
  afDFsample$inverse_af = 1/afDFsample$af
  plt_cummut = ggplot(afDFsample, aes(x = inverse_af, y = cumsum)) +
    geom_vline(xintercept = c(1/fmin, 1/fmax), colour = "darkgrey") +
    geom_point(size = 0.5) +
    geom_line(data = subset(afDFsample,
                            (inverse_af < 1/fmin) & (inverse_af > 1/fmax)),
              stat = "smooth", method = 'lm', formula = y ~ x, se = FALSE,
              colour = "red", alpha = 0.5, size = 0.8) +
    coord_cartesian(xlim = c(0, 1/0.01)) +
    theme_bw() +
    theme(text = element_text(size = 9), axis.text = element_text(size = 8),
          axis.title = element_text(size = 9),
          plot.title = element_text(size = 9, hjust = 0.5)) +
    labs(x = paste0("Inverse AF"), y = "# Cum Mut") +
    theme(legend.position = "none") +
    # remove unnecessary facet
    theme(strip.background = element_blank()) +
    labs(title = paste0(sampleID, " (rsq ", round(rsq,2), ")"))
  return(plt_cummut)
}


pltsCumMut = cowplot::plot_grid(
  plotSampleCumMut(dfAFpetr, dfntrtestr, donors[1], fmin, fmax),
  plotSampleCumMut(dfAFpetr, dfntrtestr, donors[2], fmin, fmax),
  plotSampleCumMut(dfAFpetr, dfntrtestr, donors[3], fmin, fmax),
  plotSampleCumMut(dfAFpetr, dfntrtestr, donors[4], fmin, fmax),
  plotSampleCumMut(dfAFpetr, dfntrtestr, donors[5], fmin, fmax),
  plotSampleCumMut(dfAFpetr, dfntrtestr, donors[6], fmin, fmax),
  plotSampleCumMut(dfAFpetr, dfntrtestr, donors[7], fmin, fmax),
  plotSampleCumMut(dfAFpetr, dfntrtestr, donors[8], fmin, fmax),
  plotSampleCumMut(dfAFpetr, dfntrtestr, donors[9], fmin, fmax),
  plotSampleCumMut(dfAFpetr, dfntrtestr, donors[10], fmin, fmax),
  plotSampleCumMut(dfAFpetr, dfntrtestr, donors[11], fmin, fmax),
  plotSampleCumMut(dfAFpetr, dfntrtestr, donors[12], fmin, fmax),
  plotSampleCumMut(dfAFpetr, dfntrtestr, donors[13], fmin, fmax),
  plotSampleCumMut(dfAFpetr, dfntrtestr, donors[14], fmin, fmax),
  plotSampleCumMut(dfAFpetr, dfntrtestr, donors[15], fmin, fmax),
  plotSampleCumMut(dfAFpetr, dfntrtestr, donors[16], fmin, fmax),
  plotSampleCumMut(dfAFpetr, dfntrtestr, donors[17], fmin, fmax),
  plotSampleCumMut(dfAFpetr, dfntrtestr, donors[18], fmin, fmax),
  plotSampleCumMut(dfAFpetr, dfntrtestr, donors[19], fmin, fmax),
  plotSampleCumMut(dfAFpetr, dfntrtestr, donors[20], fmin, fmax),
  plotSampleCumMut(dfAFpetr, dfntrtestr, donors[21], fmin, fmax),
  plotSampleCumMut(dfAFpetr, dfntrtestr, donors[22], fmin, fmax),
  plotSampleCumMut(dfAFpetr, dfntrtestr, donors[23], fmin, fmax),
  plotSampleCumMut(dfAFpetr, dfntrtestr, donors[24], fmin, fmax),
  plotSampleCumMut(dfAFpetr, dfntrtestr, donors[25], fmin, fmax),
  plotSampleCumMut(dfAFpetr, dfntrtestr, donors[26], fmin, fmax),
  plotSampleCumMut(dfAFpetr, dfntrtestr, donors[27], fmin, fmax),
  plotSampleCumMut(dfAFpetr, dfntrtestr, donors[28], fmin, fmax),
  plotSampleCumMut(dfAFpetr, dfntrtestr, donors[29], fmin, fmax),
  plotSampleCumMut(dfAFpetr, dfntrtestr, donors[30], fmin, fmax),
  plotSampleCumMut(dfAFpetr, dfntrtestr, donors[31], fmin, fmax),
  plotSampleCumMut(dfAFpetr, dfntrtestr, donors[32], fmin, fmax),
  ncol = 4)

pname = paste0("selection-neutralitytestr")
ppath = paste0("figures/selection/", pname, ".pdf")
ggsave(ppath, plot = pltsCumMut, width = 17, height = 25, units = "cm")
ppath = paste0("figures/selection/", pname, ".png")
ggsave(ppath, plot = pltsCumMut, width = 17, height = 25, dpi = 300,
       units = "cm", limitsize = FALSE)
pltsCumMut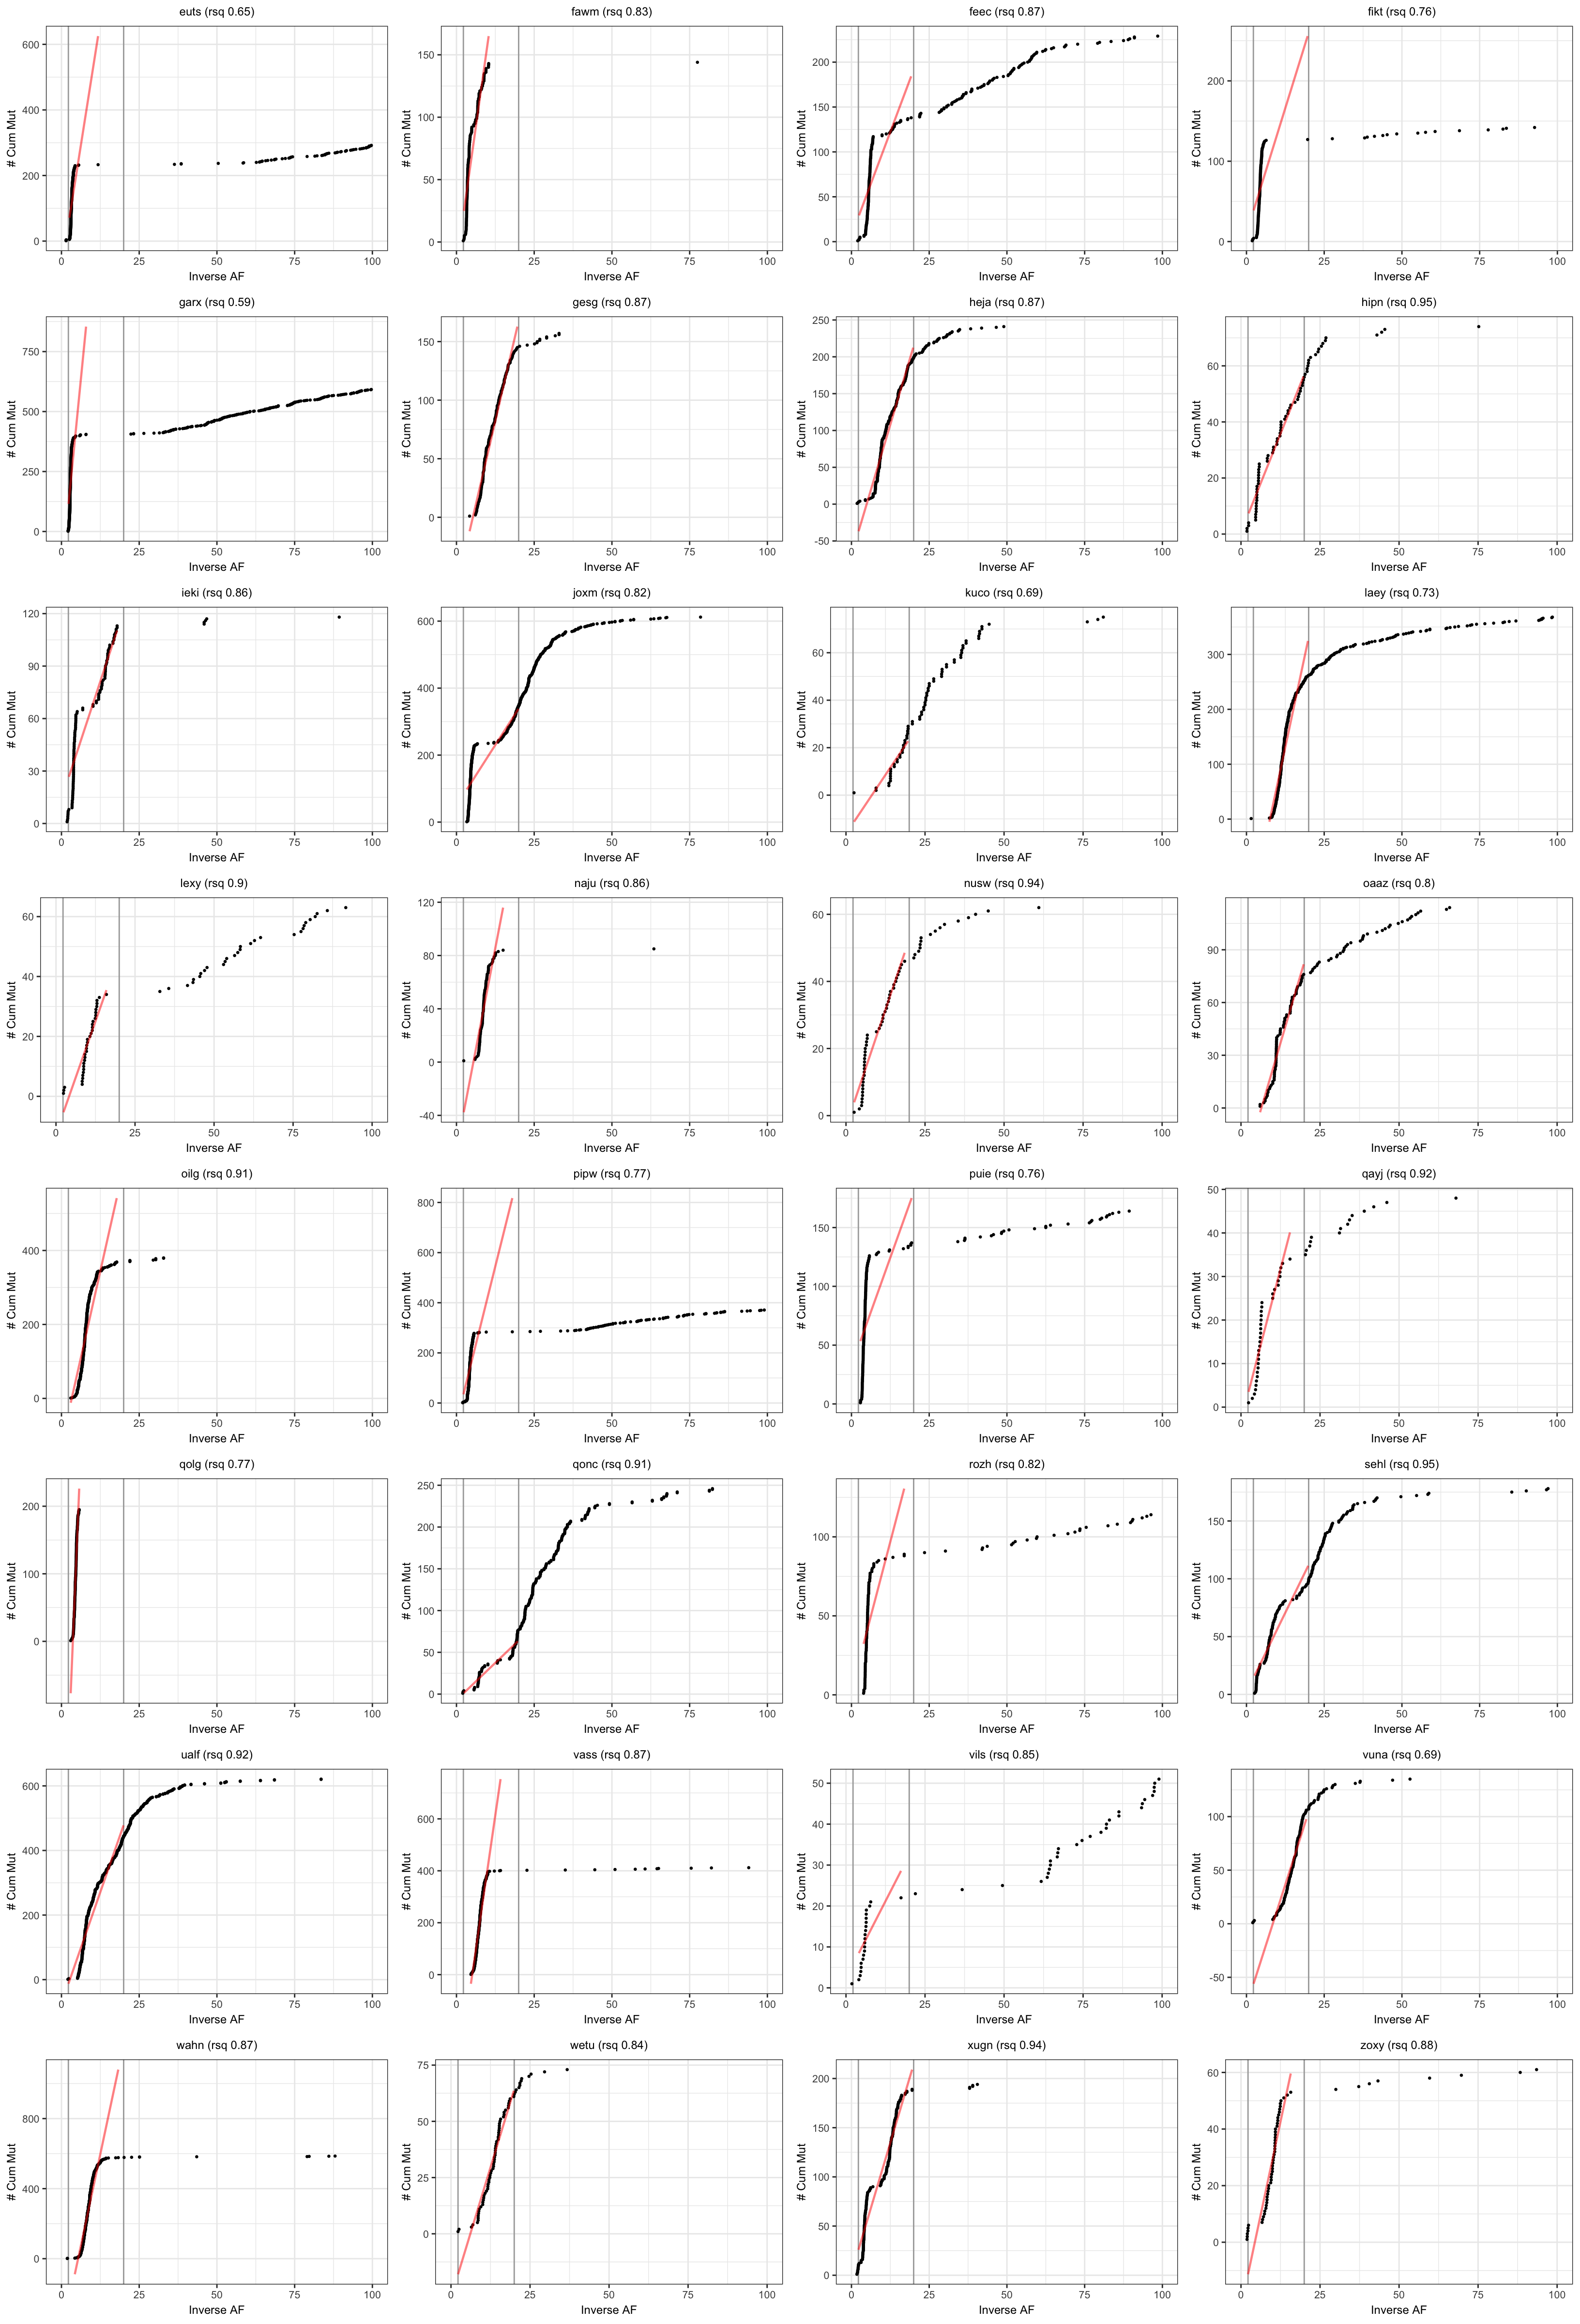
Expand here to see past versions of plot-neutralitytestr-1.png:
| Version | Author | Date |
|---|---|---|
| 7888ad3 | davismcc | 2018-08-26 |
Session information
devtools::session_info()Session info ------------------------------------------------------------- setting value
version R version 3.5.1 (2018-07-02)
system x86_64, darwin15.6.0
ui X11
language (EN)
collate en_GB.UTF-8
tz Europe/London
date 2018-08-29 Packages ----------------------------------------------------------------- package * version date source
assertthat 0.2.0 2017-04-11 CRAN (R 3.5.0)
backports 1.1.2 2017-12-13 CRAN (R 3.5.0)
base * 3.5.1 2018-07-05 local
bindr 0.1.1 2018-03-13 CRAN (R 3.5.0)
bindrcpp * 0.2.2 2018-03-29 CRAN (R 3.5.0)
colorspace 1.3-2 2016-12-14 CRAN (R 3.5.0)
compiler 3.5.1 2018-07-05 local
cowplot * 0.9.3 2018-07-15 CRAN (R 3.5.0)
crayon 1.3.4 2017-09-16 CRAN (R 3.5.0)
datasets * 3.5.1 2018-07-05 local
devtools 1.13.6 2018-06-27 CRAN (R 3.5.0)
digest 0.6.16 2018-08-22 CRAN (R 3.5.0)
dplyr 0.7.6 2018-06-29 CRAN (R 3.5.1)
evaluate 0.11 2018-07-17 CRAN (R 3.5.0)
ggplot2 * 3.0.0 2018-07-03 CRAN (R 3.5.0)
ggrepel * 0.8.0 2018-05-09 CRAN (R 3.5.0)
git2r 0.23.0 2018-07-17 CRAN (R 3.5.0)
glue 1.3.0 2018-07-17 CRAN (R 3.5.0)
graphics * 3.5.1 2018-07-05 local
grDevices * 3.5.1 2018-07-05 local
grid 3.5.1 2018-07-05 local
gridExtra 2.3 2017-09-09 CRAN (R 3.5.0)
gtable 0.2.0 2016-02-26 CRAN (R 3.5.0)
htmltools 0.3.6 2017-04-28 CRAN (R 3.5.0)
knitr 1.20 2018-02-20 CRAN (R 3.5.0)
labeling 0.3 2014-08-23 CRAN (R 3.5.0)
lazyeval 0.2.1 2017-10-29 CRAN (R 3.5.0)
magrittr 1.5 2014-11-22 CRAN (R 3.5.0)
memoise 1.1.0 2017-04-21 CRAN (R 3.5.0)
methods * 3.5.1 2018-07-05 local
munsell 0.5.0 2018-06-12 CRAN (R 3.5.0)
neutralitytestr * 0.0.2 2018-05-21 CRAN (R 3.5.0)
pillar 1.3.0 2018-07-14 CRAN (R 3.5.0)
pkgconfig 2.0.2 2018-08-16 CRAN (R 3.5.0)
plyr * 1.8.4 2016-06-08 CRAN (R 3.5.0)
pracma 2.1.5 2018-08-25 CRAN (R 3.5.1)
purrr 0.2.5 2018-05-29 CRAN (R 3.5.0)
R.methodsS3 1.7.1 2016-02-16 CRAN (R 3.5.0)
R.oo 1.22.0 2018-04-22 CRAN (R 3.5.0)
R.utils 2.6.0 2017-11-05 CRAN (R 3.5.0)
R6 2.2.2 2017-06-17 CRAN (R 3.5.0)
Rcpp 0.12.18 2018-07-23 CRAN (R 3.5.0)
rlang 0.2.2 2018-08-16 CRAN (R 3.5.0)
rmarkdown 1.10 2018-06-11 CRAN (R 3.5.0)
rprojroot 1.3-2 2018-01-03 CRAN (R 3.5.0)
scales 1.0.0 2018-08-09 CRAN (R 3.5.0)
stats * 3.5.1 2018-07-05 local
stringi 1.2.4 2018-07-20 CRAN (R 3.5.0)
stringr 1.3.1 2018-05-10 CRAN (R 3.5.0)
tibble 1.4.2 2018-01-22 CRAN (R 3.5.0)
tidyselect 0.2.4 2018-02-26 CRAN (R 3.5.0)
tools 3.5.1 2018-07-05 local
utils * 3.5.1 2018-07-05 local
viridis * 0.5.1 2018-03-29 CRAN (R 3.5.0)
viridisLite * 0.3.0 2018-02-01 CRAN (R 3.5.0)
whisker 0.3-2 2013-04-28 CRAN (R 3.5.0)
withr 2.1.2 2018-03-15 CRAN (R 3.5.0)
workflowr 1.1.1 2018-07-06 CRAN (R 3.5.0)
yaml 2.2.0 2018-07-25 CRAN (R 3.5.1)This reproducible R Markdown analysis was created with workflowr 1.1.1