Clone prevalence analysis
Davis J. McCarthy
Last updated: 2018-08-27
workflowr checks: (Click a bullet for more information)-
✔ R Markdown file: up-to-date
Great! Since the R Markdown file has been committed to the Git repository, you know the exact version of the code that produced these results.
-
✔ Environment: empty
Great job! The global environment was empty. Objects defined in the global environment can affect the analysis in your R Markdown file in unknown ways. For reproduciblity it’s best to always run the code in an empty environment.
-
✔ Seed:
set.seed(20180807)The command
set.seed(20180807)was run prior to running the code in the R Markdown file. Setting a seed ensures that any results that rely on randomness, e.g. subsampling or permutations, are reproducible. -
✔ Session information: recorded
Great job! Recording the operating system, R version, and package versions is critical for reproducibility.
-
Great! You are using Git for version control. Tracking code development and connecting the code version to the results is critical for reproducibility. The version displayed above was the version of the Git repository at the time these results were generated.✔ Repository version: 678546d
Note that you need to be careful to ensure that all relevant files for the analysis have been committed to Git prior to generating the results (you can usewflow_publishorwflow_git_commit). workflowr only checks the R Markdown file, but you know if there are other scripts or data files that it depends on. Below is the status of the Git repository when the results were generated:
Note that any generated files, e.g. HTML, png, CSS, etc., are not included in this status report because it is ok for generated content to have uncommitted changes.Ignored files: Ignored: .DS_Store Ignored: .Rhistory Ignored: .Rproj.user/ Ignored: .vscode/ Ignored: code/.DS_Store Ignored: data/raw/ Ignored: src/.DS_Store Ignored: src/.ipynb_checkpoints/ Ignored: src/Rmd/.Rhistory Untracked files: Untracked: Snakefile_clonality Untracked: Snakefile_somatic_calling Untracked: code/analysis_for_garx.Rmd Untracked: code/selection/ Untracked: code/yuanhua/ Untracked: data/canopy/ Untracked: data/cell_assignment/ Untracked: data/de_analysis_FTv62/ Untracked: data/donor_info_070818.txt Untracked: data/donor_info_core.csv Untracked: data/donor_neutrality.tsv Untracked: data/exome-point-mutations/ Untracked: data/fdr10.annot.txt.gz Untracked: data/human_H_v5p2.rdata Untracked: data/human_c2_v5p2.rdata Untracked: data/human_c6_v5p2.rdata Untracked: data/neg-bin-rsquared-petr.csv Untracked: data/neutralitytestr-petr.tsv Untracked: data/sce_merged_donors_cardelino_donorid_all_qc_filt.rds Untracked: data/sce_merged_donors_cardelino_donorid_all_with_qc_labels.rds Untracked: data/sce_merged_donors_cardelino_donorid_unstim_qc_filt.rds Untracked: data/sces/ Untracked: data/selection/ Untracked: data/simulations/ Untracked: data/variance_components/ Untracked: figures/ Untracked: output/differential_expression/ Untracked: output/donor_specific/ Untracked: output/line_info.tsv Untracked: output/nvars_by_category_by_donor.tsv Untracked: output/nvars_by_category_by_line.tsv Untracked: output/variance_components/ Untracked: references/ Untracked: tree.txt
Expand here to see past versions:
| File | Version | Author | Date | Message |
|---|---|---|---|---|
| html | 9ec2a59 | davismcc | 2018-08-26 | Build site. |
| html | 36acf15 | davismcc | 2018-08-25 | Build site. |
| Rmd | d618fe5 | davismcc | 2018-08-25 | Updating analyses |
| html | 090c1b9 | davismcc | 2018-08-24 | Build site. |
| html | d2e8b31 | davismcc | 2018-08-19 | Build site. |
| html | 1489d32 | davismcc | 2018-08-17 | Add html files |
| Rmd | a847774 | davismcc | 2018-08-17 | Using “line” instead of “donor” |
| Rmd | 1b44d28 | davismcc | 2018-08-13 | Adding simulation analysis file. |
| Rmd | 1cbadbd | davismcc | 2018-08-10 | Updating analyses. |
| Rmd | 2531565 | davismcc | 2018-08-08 | Tweaking clone prevalences |
| Rmd | 7397e00 | davismcc | 2018-08-08 | Updating stylez and tweaking Rmds |
| Rmd | 5a9a5ba | davismcc | 2018-08-08 | Adding cowplot |
| Rmd | 2a45547 | davismcc | 2018-08-08 | Adding viridis library |
| Rmd | d6b3b74 | davismcc | 2018-08-08 | Adding clone prevalence analysis |
Load libraries and data
knitr::opts_chunk$set(echo = TRUE)
dir.create("figures/clone_prevalences", showWarnings = FALSE, recursive = TRUE)
library(tidyverse)
library(viridis)
library(cowplot)
Load the Canopy clone inference results and the cell assignment results from cardelino for 32 donor fibroblast cell lines.
params <- list()
params$callset <- "filt_lenient.cell_coverage_sites"
fls <- list.files("data/sces")
fls <- fls[grepl(params$callset, fls)]
lines <- gsub(".*ce_([a-z]+)_.*", "\\1", fls)

cell_assign_list <- list()
for (don in lines) {
    cell_assign_list[[don]] <- readRDS(file.path("data/cell_assignment",
        paste0("cardelino_results.", don, ".", params$callset, ".rds")))
    cat(paste("reading", don, "\n"))
}
reading euts
reading fawm
reading feec
reading fikt
reading garx
reading gesg
reading heja
reading hipn
reading ieki
reading joxm
reading kuco
reading laey
reading lexy
reading naju
reading nusw
reading oaaz
reading oilg
reading pipw
reading puie
reading qayj
reading qolg
reading qonc
reading rozh
reading sehl
reading ualf
reading vass
reading vils
reading vuna
reading wahn
reading wetu
reading xugn
reading zoxy canopy_list <- list()
prev_list <- list()
for (don in lines) {
tmp_df <- data_frame(
line = don,
clone = rownames(cell_assign_list[[don]]$tree$P),
prev_canopy = cell_assign_list[[don]]$tree$P[, 1],
prev_cardelino = NA,
n_cells = length(cell_assign_list[[don]]$clone_assigned),
n_assigned = sum(cell_assign_list[[don]]$clone_assigned != "unassigned"),
prop_assigned = n_assigned / n_cells
)
for (i in seq_len(nrow(tmp_df))) {
tmp_df$prev_cardelino[i] <- (sum(
cell_assign_list[[don]]$clone_assigned == tmp_df$clone[i]) /
tmp_df$n_assigned[i])
}
prev_list[[don]] <- tmp_df
}
df_prev <- do.call("rbind", prev_list)
lm_eqn <- function(df) {
m <- lm(prev_cardelino ~ prev_canopy, df);
eq <- substitute(italic(r)^2~"="~r2,
list(a = format(coef(m)[1], digits = 2),
b = format(coef(m)[2], digits = 2),
r2 = format(summary(m)$r.squared, digits = 3)))
as.character(as.expression(eq));
}
## Fit weighted regressions
fits <- df_prev %>%
group_by(clone) %>%
do(fit = lm(prev_cardelino ~ prev_canopy, weights = prop_assigned, data = .))
fits_1grp <- df_prev %>%
do(fit = lm(prev_cardelino ~ prev_canopy, weights = prop_assigned, data = .))
le_lin_fit <- function(dat) {
the_fit <- lm(prev_cardelino ~ prev_canopy, weights = prop_assigned, dat)
setNames(data.frame(t(coef(the_fit))), c("x0", "x1"))
}
fits_me <- df_prev %>%
group_by(clone) %>%
do(le_lin_fit(.))
fits_me_1grp <- df_prev %>%
do(le_lin_fit(.))Plot clone prevalences
Plot the estimated clone fractions from the cells assigned to a clone by cardelino against the estimated clone fractions from Canopy.
fits_1grp %>%
  broom::augment(fit) %>%
  inner_join(., df_prev) %>%
ggplot(aes(x = prev_canopy, y = prev_cardelino, shape = clone,
                    fill = prop_assigned)) +
  geom_abline(slope = 1, intercept = 0, colour = "gray40", linetype = 2) +
  geom_ribbon(aes(ymin = .fitted - 1.645 * .se.fit, ymax = .fitted + 1.645 * .se.fit),
              fill = "gray70", alpha = 0.7) +
  geom_abline(aes(intercept = x0, slope = x1),
              data = fits_me_1grp,
              colour = "firebrick", size = 2) +
  geom_point(size = 3) +
  xlim(0, 1) + ylim(0, 1) +
  geom_text(x = 0.9, y = 0, colour = "black", label = lm_eqn(df_prev),
            size = 5, parse = TRUE, data = df_prev[1,]) +
  scale_fill_viridis(name = "fraction of\ncells assigned", limits = c(0, 1)) +
  scale_shape_manual(values = 21:25) +
  xlab("Estimated clone prevalence (Canopy)") +
  ylab("Assigned clone fraction (cardelino)")
Joining, by = c("prev_cardelino", "prev_canopy")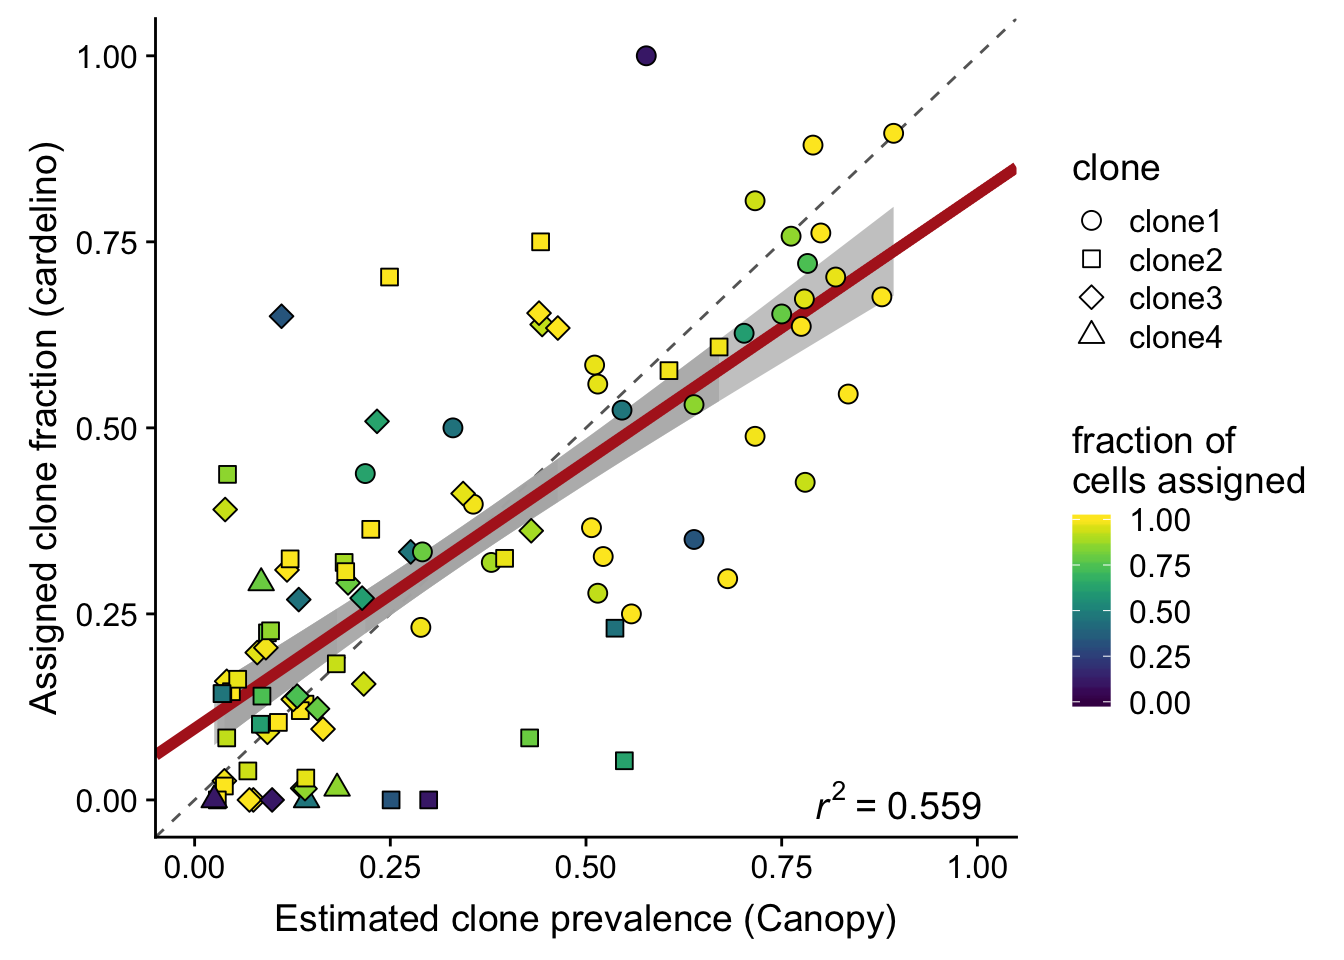
Expand here to see past versions of plot-prev-1.png:
| Version | Author | Date |
|---|---|---|
| d2e8b31 | davismcc | 2018-08-19 |
ggsave("figures/clone_prevalences/clone_prev_scatter.png",
       height = 5, width = 7)
ggsave("figures/clone_prevalences/clone_prev_scatter.pdf",
       height = 5, width = 7)
We can also look at the same plot as above, but now faceted by the different clones.
fits %>%
  broom::augment(fit) %>%
  inner_join(., df_prev) %>%
  ggplot(aes(x = prev_canopy, y = prev_cardelino)) +
  geom_abline(slope = 1, intercept = 0, colour = "gray40", linetype = 2) +
  geom_ribbon(aes(ymin = .fitted - 1.645 * .se.fit, ymax = .fitted + 1.645 * .se.fit),
              fill = "gray70", alpha = 0.7) +
  geom_abline(aes(intercept = x0, slope = x1),
              data = fits_me,
              colour = "firebrick", size = 2) +
  geom_point(aes(fill = prop_assigned), size = 3, shape = 21) +
  xlim(0, 1) + ylim(0, 1) +
  facet_wrap(~clone) +
  scale_fill_viridis(name = "fraction of\ncells assigned", limits = c(0, 1)) +
  scale_shape_manual(values = 21:25) +
  xlab("Estimated clone prevalence (Canopy)") +
  ylab("Assigned clone fraction (cardelino)")
Joining, by = c("clone", "prev_cardelino", "prev_canopy")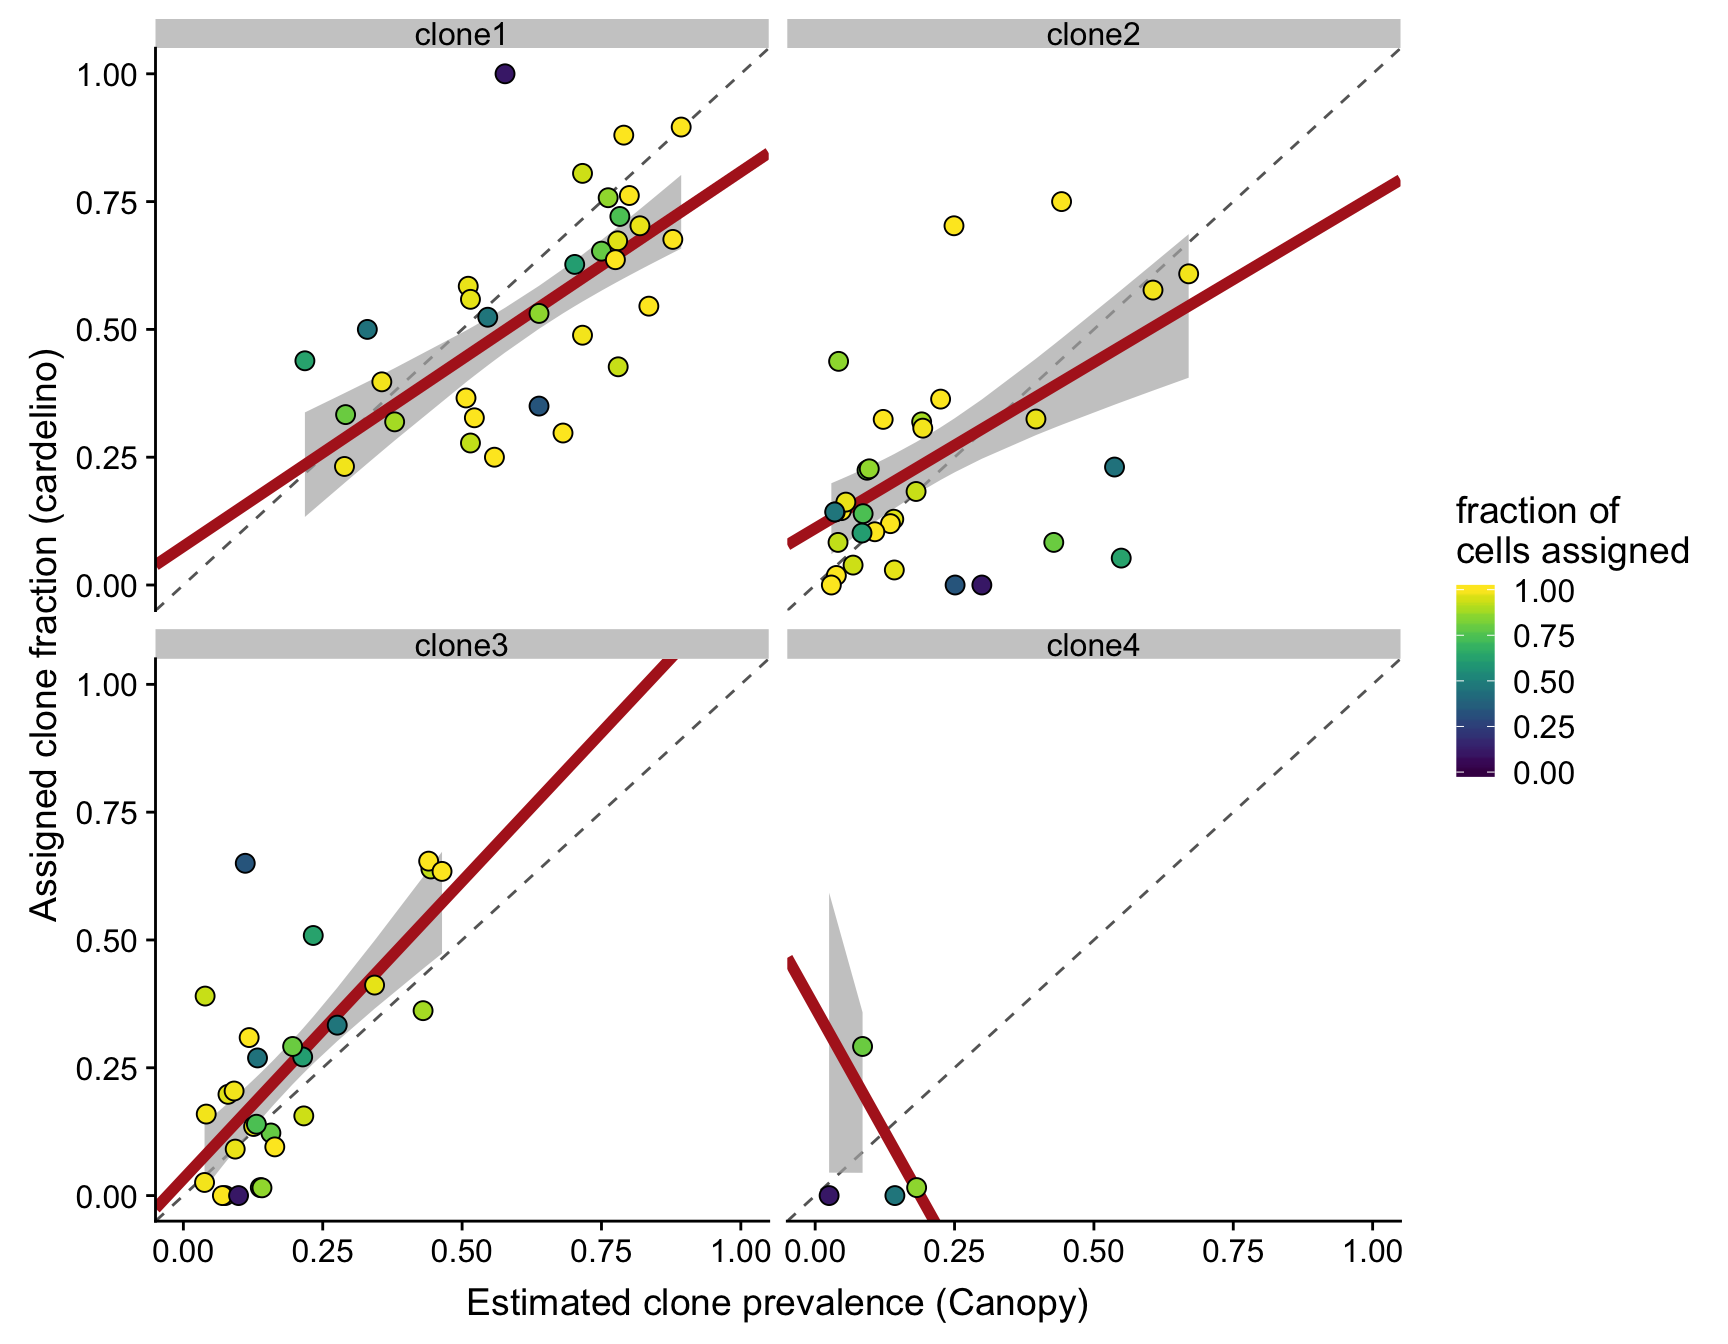
Expand here to see past versions of plot-prev-facet-clone-1.png:
| Version | Author | Date |
|---|---|---|
| d2e8b31 | davismcc | 2018-08-19 |
ggsave("figures/clone_prevalences/clone_prev_scatter_facet_clone.png",
       height = 7, width = 9)
ggsave("figures/clone_prevalences/clone_prev_scatter_facet_clone.pdf",
       height = 7, width = 9)
Since there are so few lines with four clones we can also make a version of the figure above with just clone1, clone2 and clone3 and fitted a weighted regression line, with points weighted by the fraction of cells assigned for the line.
fits %>%
  broom::augment(fit) %>%
  inner_join(., df_prev) %>%
  dplyr::filter(clone != "clone4") %>%
  ggplot(aes(x = prev_canopy, y = prev_cardelino, fill = prop_assigned)) +
  geom_abline(slope = 1, intercept = 0, colour = "gray40", linetype = 2) +
  geom_ribbon(aes(ymin = .fitted - 1.645 * .se.fit, ymax = .fitted + 1.645 * .se.fit),
              fill = "gray70", alpha = 0.7) +
  geom_abline(aes(intercept = x0, slope = x1),
              data = dplyr::filter(fits_me, clone != "clone4"),
              colour = "firebrick", size = 1) +
  geom_point(size = 3, shape = 21) +
  xlim(0, 1) + ylim(0, 1) +
  facet_wrap(~clone, nrow = 1) +
  scale_fill_viridis(name = "fraction of\ncells assigned", limits = c(0, 1)) +
  scale_shape_manual(values = 21:25) +
  xlab("Estimated clone prevalence (Canopy)") +
  ylab("Assigned clone fraction (cardelino)") +
  theme(axis.text = element_text(size = 9))
Joining, by = c("clone", "prev_cardelino", "prev_canopy")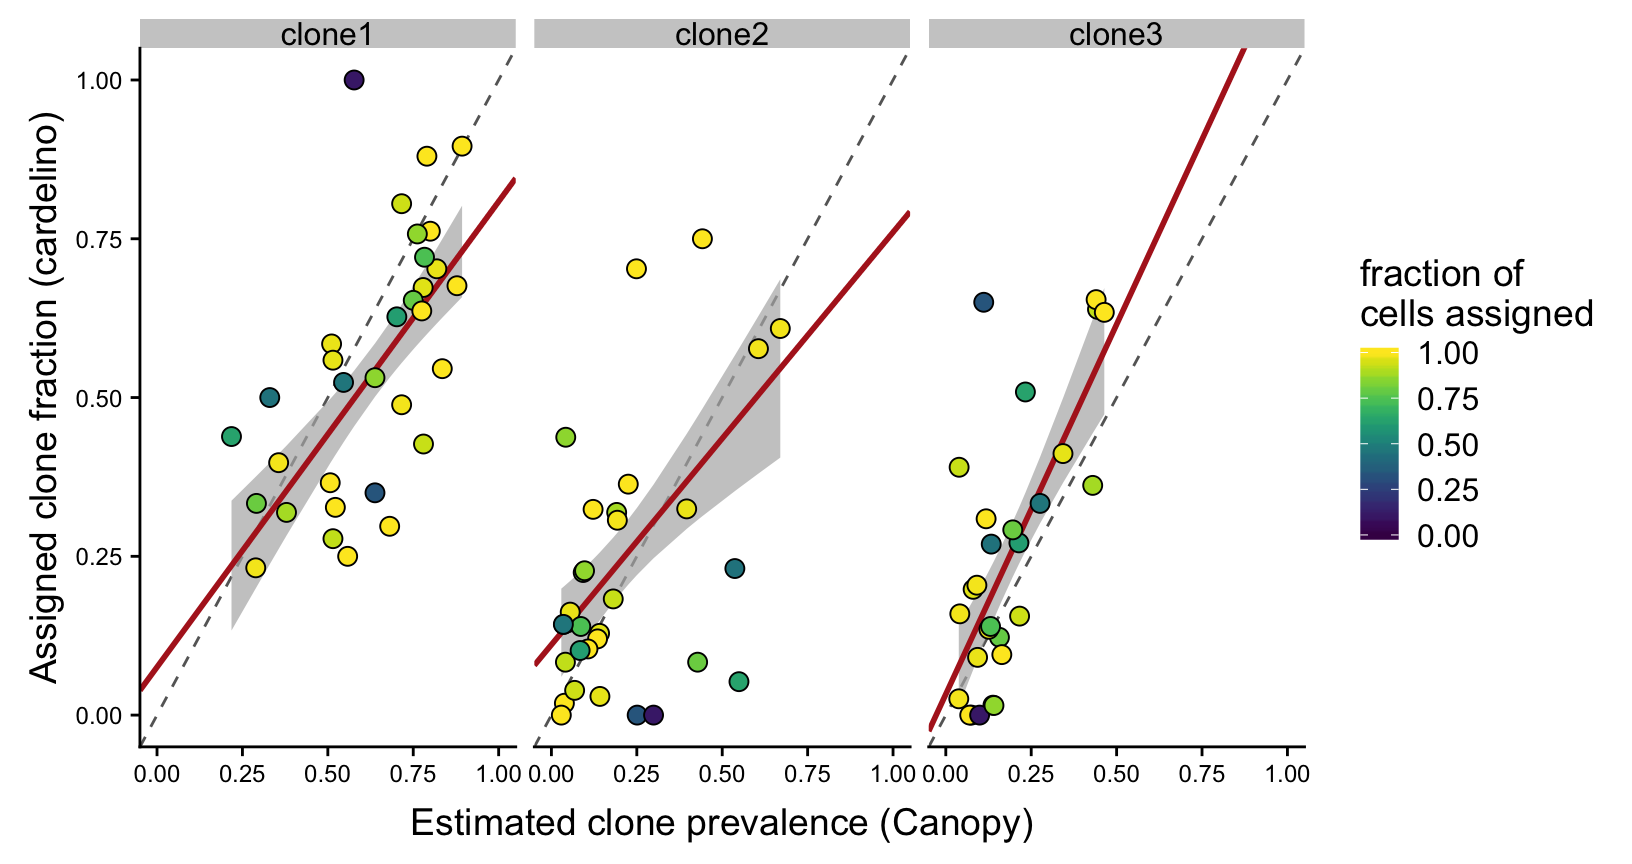
Expand here to see past versions of plot-prev-facet-clone-3clones-1.png:
| Version | Author | Date |
|---|---|---|
| d2e8b31 | davismcc | 2018-08-19 |
ggsave("figures/clone_prevalences/clone_prev_scatter_facet_clone_no_clone4.png",
       height = 4.5, width = 8.5)
ggsave("figures/clone_prevalences/clone_prev_scatter_facet_clone_no_clone4.pdf",
       height = 4.5, width = 8.5)
Also look at what happens if we filter out lines that have fewer than 75% of cells assigned (25 lines).
df_prev %>%
  dplyr::filter(clone != "clone4", prop_assigned > 0.75) %>%
  ggplot(aes(x = prev_canopy, y = prev_cardelino, shape = clone,
             fill = prop_assigned)) +
  geom_abline(slope = 1, intercept = 0, colour = "gray40", linetype = 2) +
  geom_smooth(aes(group = 1), method = "lm", colour = "firebrick") +
  geom_point(size = 3) +
  xlim(0, 1) + ylim(0, 1) +
  facet_wrap(~clone, nrow = 1) +
  scale_fill_viridis(name = "fraction of\ncells assigned", limits = c(0, 1)) +
  scale_shape_manual(values = 21:25) +
  xlab("Estimated clone prevalence (Canopy)") +
  ylab("Assigned clone fraction (cardelino)")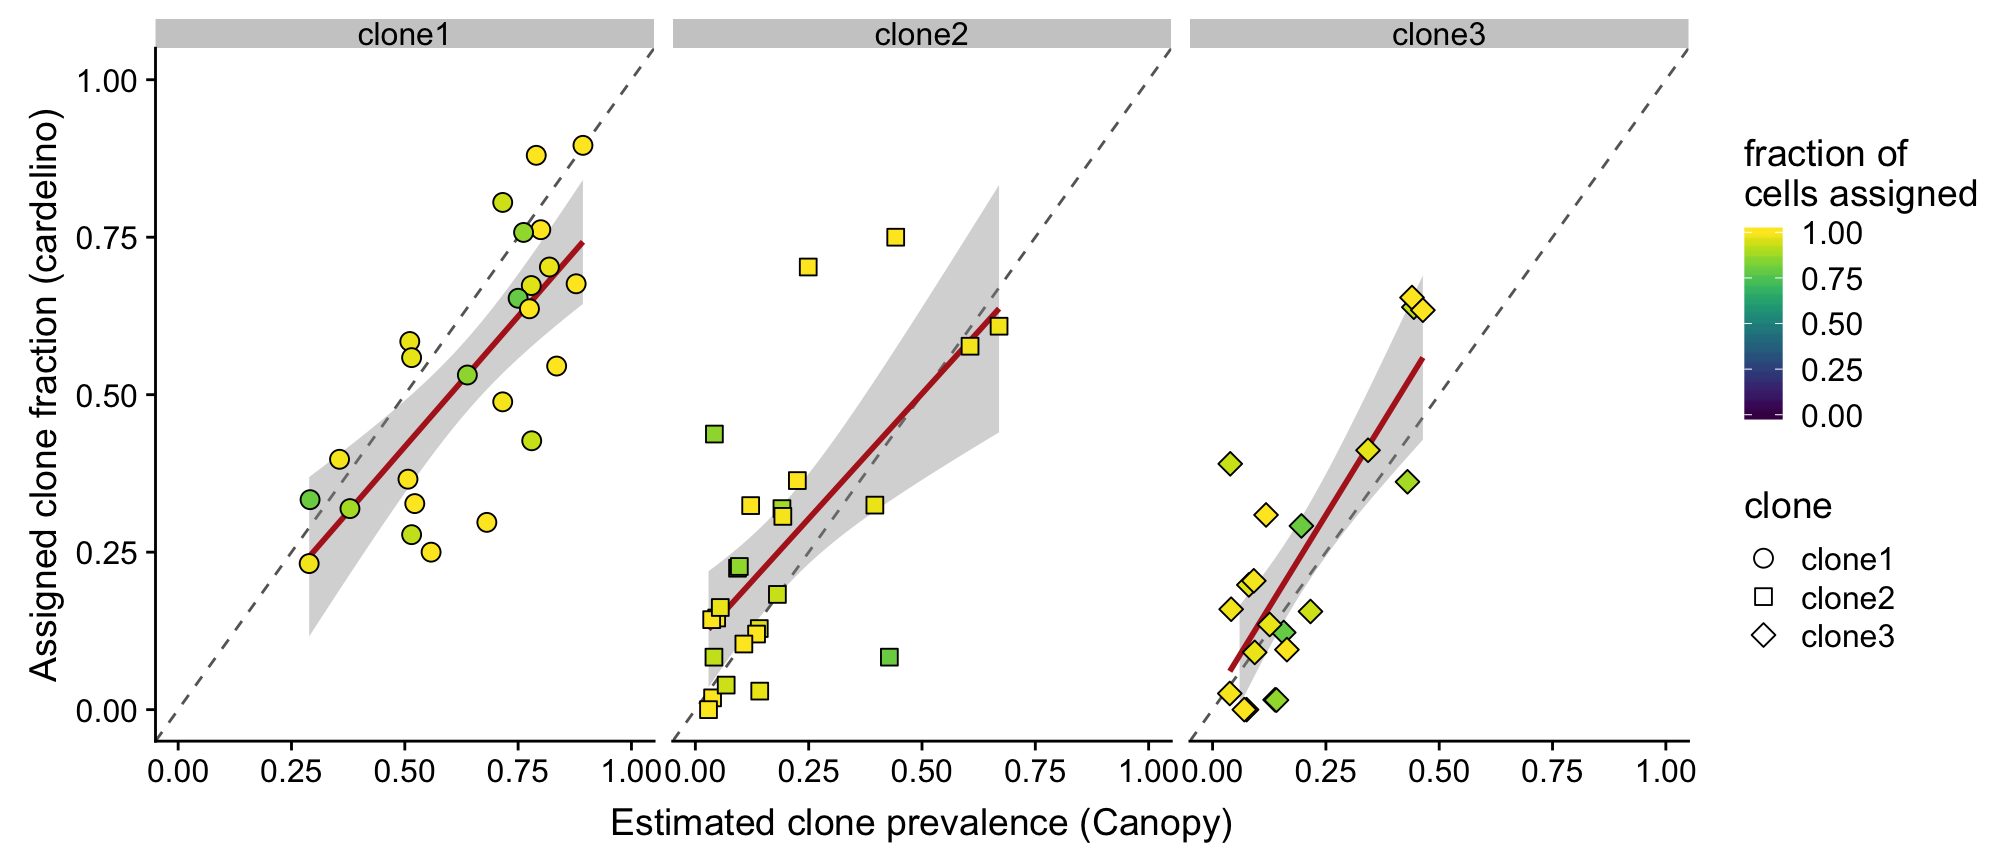
Expand here to see past versions of plot-prev-facet-clone-3clones-linefilt-1.png:
| Version | Author | Date |
|---|---|---|
| d2e8b31 | davismcc | 2018-08-19 |
ggsave("figures/clone_prevalences/clone_prev_scatter_facet_clone_no_clone4_75pctassigned.png",
       height = 4.5, width = 10.5)
ggsave("figures/clone_prevalences/clone_prev_scatter_facet_clone_no_clone4_75pctassigned.pdf",
       height = 4.5, width = 10.5)
Session information
devtools::session_info()Session info ------------------------------------------------------------- setting value
version R version 3.5.1 (2018-07-02)
system x86_64, darwin15.6.0
ui X11
language (EN)
collate en_GB.UTF-8
tz Europe/London
date 2018-08-27 Packages ----------------------------------------------------------------- package * version date source
assertthat 0.2.0 2017-04-11 CRAN (R 3.5.0)
backports 1.1.2 2017-12-13 CRAN (R 3.5.0)
base * 3.5.1 2018-07-05 local
bindr 0.1.1 2018-03-13 CRAN (R 3.5.0)
bindrcpp * 0.2.2 2018-03-29 CRAN (R 3.5.0)
broom 0.5.0 2018-07-17 CRAN (R 3.5.0)
cellranger 1.1.0 2016-07-27 CRAN (R 3.5.0)
cli 1.0.0 2017-11-05 CRAN (R 3.5.0)
colorspace 1.3-2 2016-12-14 CRAN (R 3.5.0)
compiler 3.5.1 2018-07-05 local
cowplot * 0.9.3 2018-07-15 CRAN (R 3.5.0)
crayon 1.3.4 2017-09-16 CRAN (R 3.5.0)
datasets * 3.5.1 2018-07-05 local
devtools 1.13.6 2018-06-27 CRAN (R 3.5.0)
digest 0.6.16 2018-08-22 CRAN (R 3.5.0)
dplyr * 0.7.6 2018-06-29 CRAN (R 3.5.1)
evaluate 0.11 2018-07-17 CRAN (R 3.5.0)
forcats * 0.3.0 2018-02-19 CRAN (R 3.5.0)
ggplot2 * 3.0.0 2018-07-03 CRAN (R 3.5.0)
git2r 0.23.0 2018-07-17 CRAN (R 3.5.0)
glue 1.3.0 2018-07-17 CRAN (R 3.5.0)
graphics * 3.5.1 2018-07-05 local
grDevices * 3.5.1 2018-07-05 local
grid 3.5.1 2018-07-05 local
gridExtra 2.3 2017-09-09 CRAN (R 3.5.0)
gtable 0.2.0 2016-02-26 CRAN (R 3.5.0)
haven 1.1.2 2018-06-27 CRAN (R 3.5.0)
hms 0.4.2 2018-03-10 CRAN (R 3.5.0)
htmltools 0.3.6 2017-04-28 CRAN (R 3.5.0)
httr 1.3.1 2017-08-20 CRAN (R 3.5.0)
jsonlite 1.5 2017-06-01 CRAN (R 3.5.0)
knitr 1.20 2018-02-20 CRAN (R 3.5.0)
labeling 0.3 2014-08-23 CRAN (R 3.5.0)
lattice 0.20-35 2017-03-25 CRAN (R 3.5.1)
lazyeval 0.2.1 2017-10-29 CRAN (R 3.5.0)
lubridate 1.7.4 2018-04-11 CRAN (R 3.5.0)
magrittr 1.5 2014-11-22 CRAN (R 3.5.0)
memoise 1.1.0 2017-04-21 CRAN (R 3.5.0)
methods * 3.5.1 2018-07-05 local
modelr 0.1.2 2018-05-11 CRAN (R 3.5.0)
munsell 0.5.0 2018-06-12 CRAN (R 3.5.0)
nlme 3.1-137 2018-04-07 CRAN (R 3.5.1)
pillar 1.3.0 2018-07-14 CRAN (R 3.5.0)
pkgconfig 2.0.2 2018-08-16 CRAN (R 3.5.0)
plyr 1.8.4 2016-06-08 CRAN (R 3.5.0)
purrr * 0.2.5 2018-05-29 CRAN (R 3.5.0)
R.methodsS3 1.7.1 2016-02-16 CRAN (R 3.5.0)
R.oo 1.22.0 2018-04-22 CRAN (R 3.5.0)
R.utils 2.6.0 2017-11-05 CRAN (R 3.5.0)
R6 2.2.2 2017-06-17 CRAN (R 3.5.0)
Rcpp 0.12.18 2018-07-23 CRAN (R 3.5.0)
readr * 1.1.1 2017-05-16 CRAN (R 3.5.0)
readxl 1.1.0 2018-04-20 CRAN (R 3.5.0)
rlang 0.2.2 2018-08-16 CRAN (R 3.5.0)
rmarkdown 1.10 2018-06-11 CRAN (R 3.5.0)
rprojroot 1.3-2 2018-01-03 CRAN (R 3.5.0)
rstudioapi 0.7 2017-09-07 CRAN (R 3.5.0)
rvest 0.3.2 2016-06-17 CRAN (R 3.5.0)
scales 1.0.0 2018-08-09 CRAN (R 3.5.0)
stats * 3.5.1 2018-07-05 local
stringi 1.2.4 2018-07-20 CRAN (R 3.5.0)
stringr * 1.3.1 2018-05-10 CRAN (R 3.5.0)
tibble * 1.4.2 2018-01-22 CRAN (R 3.5.0)
tidyr * 0.8.1 2018-05-18 CRAN (R 3.5.0)
tidyselect 0.2.4 2018-02-26 CRAN (R 3.5.0)
tidyverse * 1.2.1 2017-11-14 CRAN (R 3.5.0)
tools 3.5.1 2018-07-05 local
utils * 3.5.1 2018-07-05 local
viridis * 0.5.1 2018-03-29 CRAN (R 3.5.0)
viridisLite * 0.3.0 2018-02-01 CRAN (R 3.5.0)
whisker 0.3-2 2013-04-28 CRAN (R 3.5.0)
withr 2.1.2 2018-03-15 CRAN (R 3.5.0)
workflowr 1.1.1 2018-07-06 CRAN (R 3.5.0)
xml2 1.2.0 2018-01-24 CRAN (R 3.5.0)
yaml 2.2.0 2018-07-25 CRAN (R 3.5.1)This reproducible R Markdown analysis was created with workflowr 1.1.1