mouse_alzheimer_annotating
githubz0r
2019-06-6
Last updated: 2019-06-06
Checks: 6 0
Knit directory: SecretUtils/
This reproducible R Markdown analysis was created with workflowr (version 1.3.0). The Checks tab describes the reproducibility checks that were applied when the results were created. The Past versions tab lists the development history.
Great! Since the R Markdown file has been committed to the Git repository, you know the exact version of the code that produced these results.
Great job! The global environment was empty. Objects defined in the global environment can affect the analysis in your R Markdown file in unknown ways. For reproduciblity it’s best to always run the code in an empty environment.
The command set.seed(20190415) was run prior to running the code in the R Markdown file. Setting a seed ensures that any results that rely on randomness, e.g. subsampling or permutations, are reproducible.
Great job! Recording the operating system, R version, and package versions is critical for reproducibility.
Nice! There were no cached chunks for this analysis, so you can be confident that you successfully produced the results during this run.
Great! You are using Git for version control. Tracking code development and connecting the code version to the results is critical for reproducibility. The version displayed above was the version of the Git repository at the time these results were generated.
Note that you need to be careful to ensure that all relevant files for the analysis have been committed to Git prior to generating the results (you can use wflow_publish or wflow_git_commit). workflowr only checks the R Markdown file, but you know if there are other scripts or data files that it depends on. Below is the status of the Git repository when the results were generated:
Ignored files:
    Ignored:    .Rhistory
    Ignored:    .Rproj.user/

Untracked files:
    Untracked:  .Rbuildignore
    Untracked:  R/hello.R
    Untracked:  analysis/make_scanpy_viktor.R
    Untracked:  analysis/mouse_alzheimer_annotating.Rmd
    Untracked:  analysis/mouse_alzheimer_preproc.Rmd
    Untracked:  analysis/paga.Rmd
    Untracked:  analysis/subtype_distances.Rmd
    Untracked:  analysis/subtype_distances2.Rmd
    Untracked:  analysis/subtype_distances4.Rmd
    Untracked:  analysis/subtype_distances_redux.Rmd
    Untracked:  analysis/subtype_distances_revenge.Rmd
    Untracked:  analysis/test_output.Rmd
    Untracked:  analysis/transmute_peters_code.Rmd
    Untracked:  docs/figure/paga.Rmd/
    Untracked:  man/

Unstaged changes:
    Modified:   DESCRIPTION
    Modified:   R/asdf.R
    Modified:   R/peter_code_utils.R
    Modified:   analysis/correlation_stuff.Rmd
    Modified:   analysis/misc_metrics.Rmd
    Modified:   analysis/subtype_distances3.Rmd
    Modified:   analysis/transmute_code_eps.Rmd
    Modified:   analysis/transmute_code_eps_2.Rmd
    Modified:   analysis/visualizations.Rmd
Note that any generated files, e.g. HTML, png, CSS, etc., are not included in this status report because it is ok for generated content to have uncommitted changes.
These are the previous versions of the R Markdown and HTML files. If you’ve configured a remote Git repository (see ?wflow_git_remote), click on the hyperlinks in the table below to view them.
| File | Version | Author | Date | Message |
|---|---|---|---|---|
| Rmd | 056d849 | githubz0r | 2019-06-06 | some new plots |
Load conos, pagoda2 and fuck.
library(conos)Loading required package: MatrixLoading required package: igraph
Attaching package: 'igraph'The following objects are masked from 'package:stats':
decompose, spectrumThe following object is masked from 'package:base':
unionlibrary(tidyverse)── Attaching packages ────────────────────────────────────────────────────────────────────────────────────────────── tidyverse 1.2.1 ──✔ ggplot2 3.1.1 ✔ purrr 0.3.2
✔ tibble 2.1.2 ✔ dplyr 0.8.1
✔ tidyr 0.8.3 ✔ stringr 1.4.0
✔ readr 1.3.1 ✔ forcats 0.4.0── Conflicts ───────────────────────────────────────────────────────────────────────────────────────────────── tidyverse_conflicts() ──
✖ dplyr::as_data_frame() masks tibble::as_data_frame(), igraph::as_data_frame()
✖ purrr::compose() masks igraph::compose()
✖ tidyr::crossing() masks igraph::crossing()
✖ tidyr::expand() masks Matrix::expand()
✖ dplyr::filter() masks stats::filter()
✖ dplyr::groups() masks igraph::groups()
✖ dplyr::lag() masks stats::lag()
✖ purrr::simplify() masks igraph::simplify()devtools::load_all('/home/larsc/SecretUtils')Loading SecretUtilsLoading required package: magrittr
Attaching package: 'magrittr'The following object is masked from 'package:purrr':
set_namesThe following object is masked from 'package:tidyr':
extractLoading required package: reshape2
Attaching package: 'reshape2'The following object is masked from 'package:tidyr':
smithsrequire(pagoda2)Loading required package: pagoda2library(pheatmap)
library(irlba)
library(igraph)
mouse_annot <- read.csv(file.path('/home/larsc/data/mouse_alzheimer/mouse_alzheimers_annotation_filtered_subtypes.csv'))
mouse_annot$subtype_condition <- paste0(mouse_annot$celltype, '.', mouse_annot$condition)load conos object
mouse_con <- readRDS('/home/larsc/data/mouse_alzheimer/mouse_alzheimers_conos_procced_graphed.rds')Rbind panels from conos objects
rbound_panel <- RbindPanel(mouse_con)
# sorting it just in case
rbound_panel <- rbound_panel[order(rbound_panel %>% rownames),]
Make groups for plotting
nr_annot <- setNames(mouse_annot$mouse_nr, mouse_annot$Well_ID)
batch_annot <- setNames(mouse_annot$Amp_batch_ID, mouse_annot$Well_ID)
condition_annot <- setNames(mouse_annot$condition, mouse_annot$Well_ID)
celltype_annot <- setNames(mouse_annot$celltype, mouse_annot$Well_ID)
sub_cond_annot <- setNames(mouse_annot$subtype_condition, mouse_annot$Well_ID)table(nr_annot)nr_annot
AD6m_mouse1 AD6m_mouse2 AD6m_mouse3 WT6m_mouse1 WT6m_mouse2 WT6m_mouse3
1517 2264 2264 1514 2651 2273 table(celltype_annot)celltype_annot
Bcells granulocytes microglia PvascMacro+Mono
723 446 10018 469
T+NKcells
827 Plot graph with different annotations
mouse_con$plotGraph(groups=condition_annot, font.size=3, size=0.3, alpha=0.3, show.legend=T)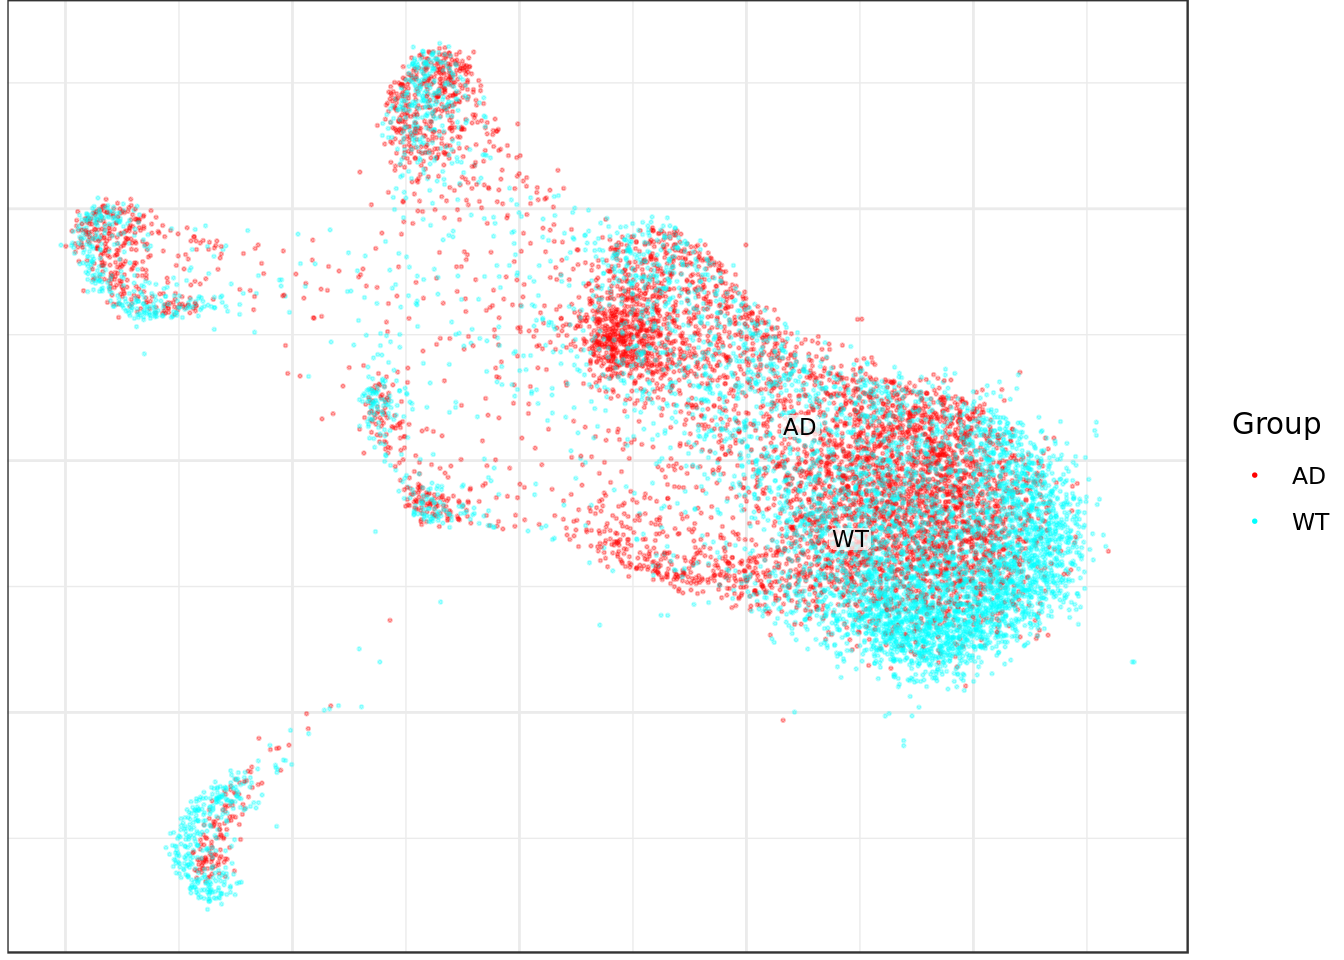
mouse_con$plotGraph(groups=celltype_annot, font.size=3, size=0.3, alpha=0.3, show.legend=T)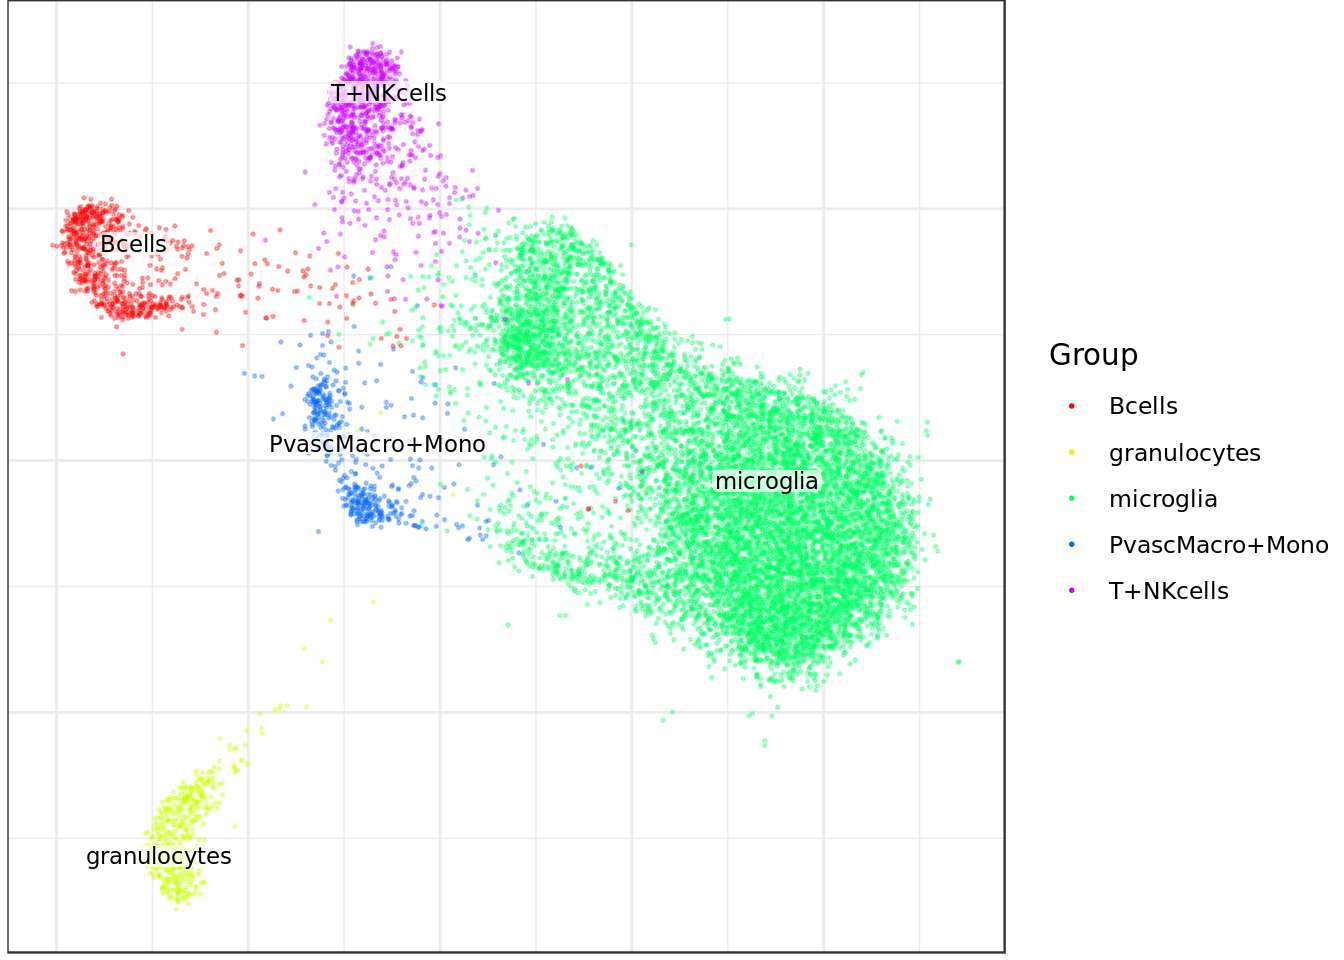
mouse_con$plotGraph(groups=sub_cond_annot, font.size=3, size=0.3, alpha=0.3, show.legend=T)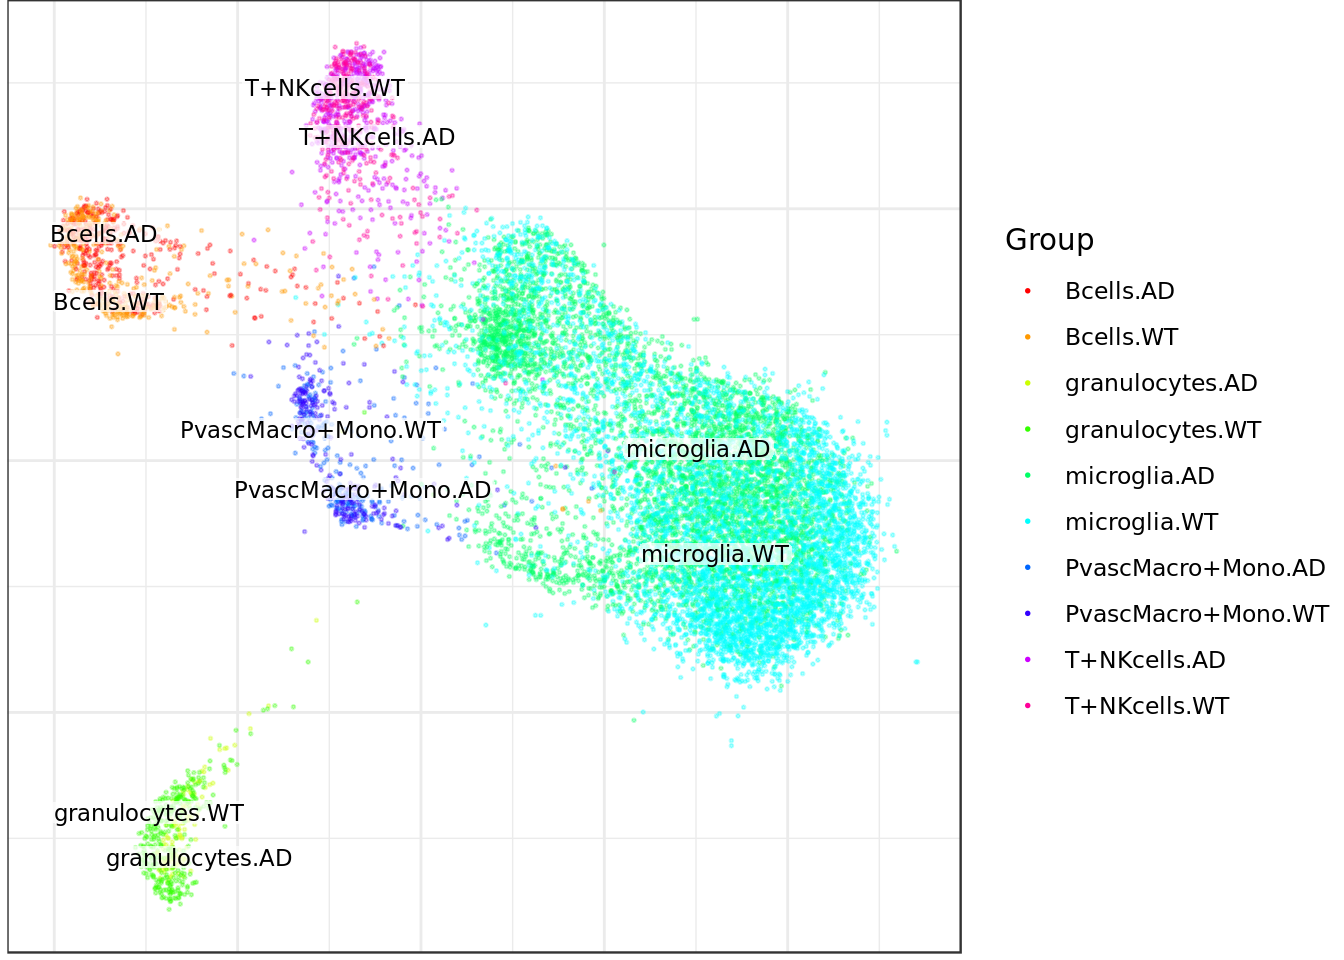
mouse_con$plotGraph(groups=nr_annot, font.size=3, size=0.3, alpha=0.3, show.legend=T)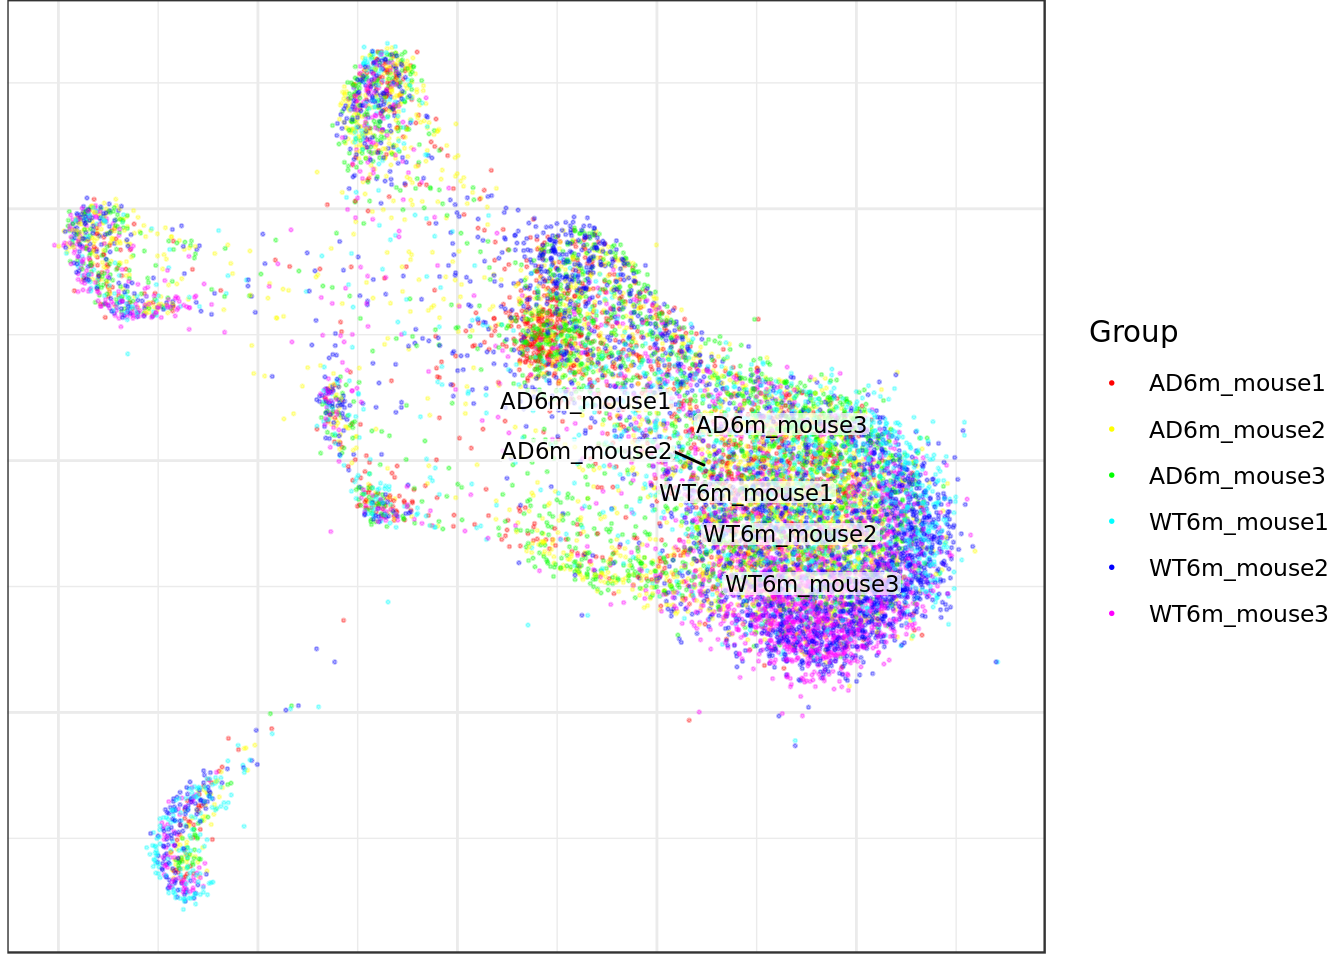
Initiate some variables
od_genes = conos:::getOdGenesUniformly(mouse_con$samples, 3000)
state_split <- split(mouse_annot, mouse_annot$condition, drop=TRUE)
subtype_split <- state_split %>% lapply(function(x){split(x, x$celltype, drop=TRUE)})
Jensen Shannon, overall (microglia has by far the most cells so this will heavily skew the result due to dropout)
wt_probs <- subtype_split$WT %>% GetSampProbs(rbound_panel, od_genes, cellid.col = 1, pseudo.count=10^(-8))
ad_probs <- subtype_split$AD %>% GetSampProbs(rbound_panel, od_genes, cellid.col = 1, pseudo.count=10^(-8))

all_dists <- Map(JensenShannon, wt_probs, ad_probs) %>% as_tibble
all_dists_gathered <- gather(all_dists, key=subtype, value=js_distance)
ggplot(all_dists_gathered, aes(y=js_distance, x=subtype)) +geom_bar(stat='identity') +
  theme(axis.text.x = element_text(angle = -90, hjust = 1))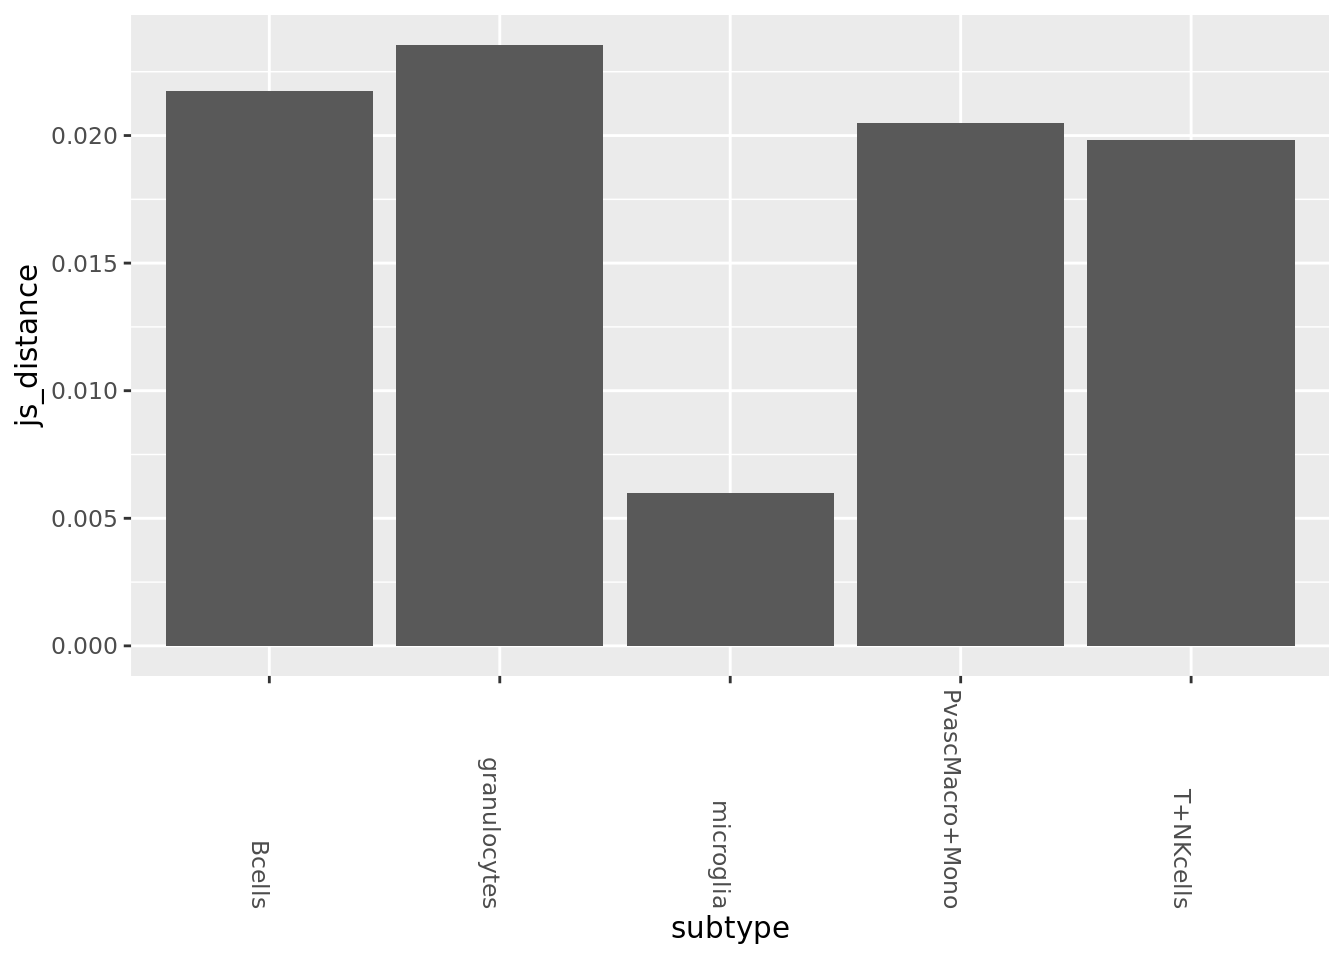
PCA for correlation
pca_cm <- prcomp_irlba(rbound_panel[, od_genes],n=100)
pca_cmat <- pca_cm$x
rownames(pca_cmat) <- rownames(rbound_panel)
pca_genes <- colnames(pca_cmat)
wt_vecs <- subtype_split$WT %>% GetSubMatrices(pca_cmat, pca_genes, cellid.col = 1, avg=T)
ad_vecs <- subtype_split$AD %>% GetSubMatrices(pca_cmat, pca_genes, cellid.col = 1, avg=T)
#ad_vecs <- subtype_split$AD %>% GetSampProbs(pca_cmat, pca_genes, cellid.col = 1, pseudo.count=0) # remember sign
#wt_vecs <- subtype_split$WT %>% GetSampProbs(pca_cmat, pca_genes, cellid.col = 1, pseudo.count=0)
all_dists <- Map(function(x,y){1-cor(x,y)}, wt_vecs, ad_vecs) %>% as_tibble
all_dists_gathered <- gather(all_dists, key=subtype, value=corcomplement)
ggplot(all_dists_gathered, aes(y=corcomplement, x=subtype)) +geom_bar(stat='identity') +
theme(axis.text.x = element_text(angle = -90, hjust = 1))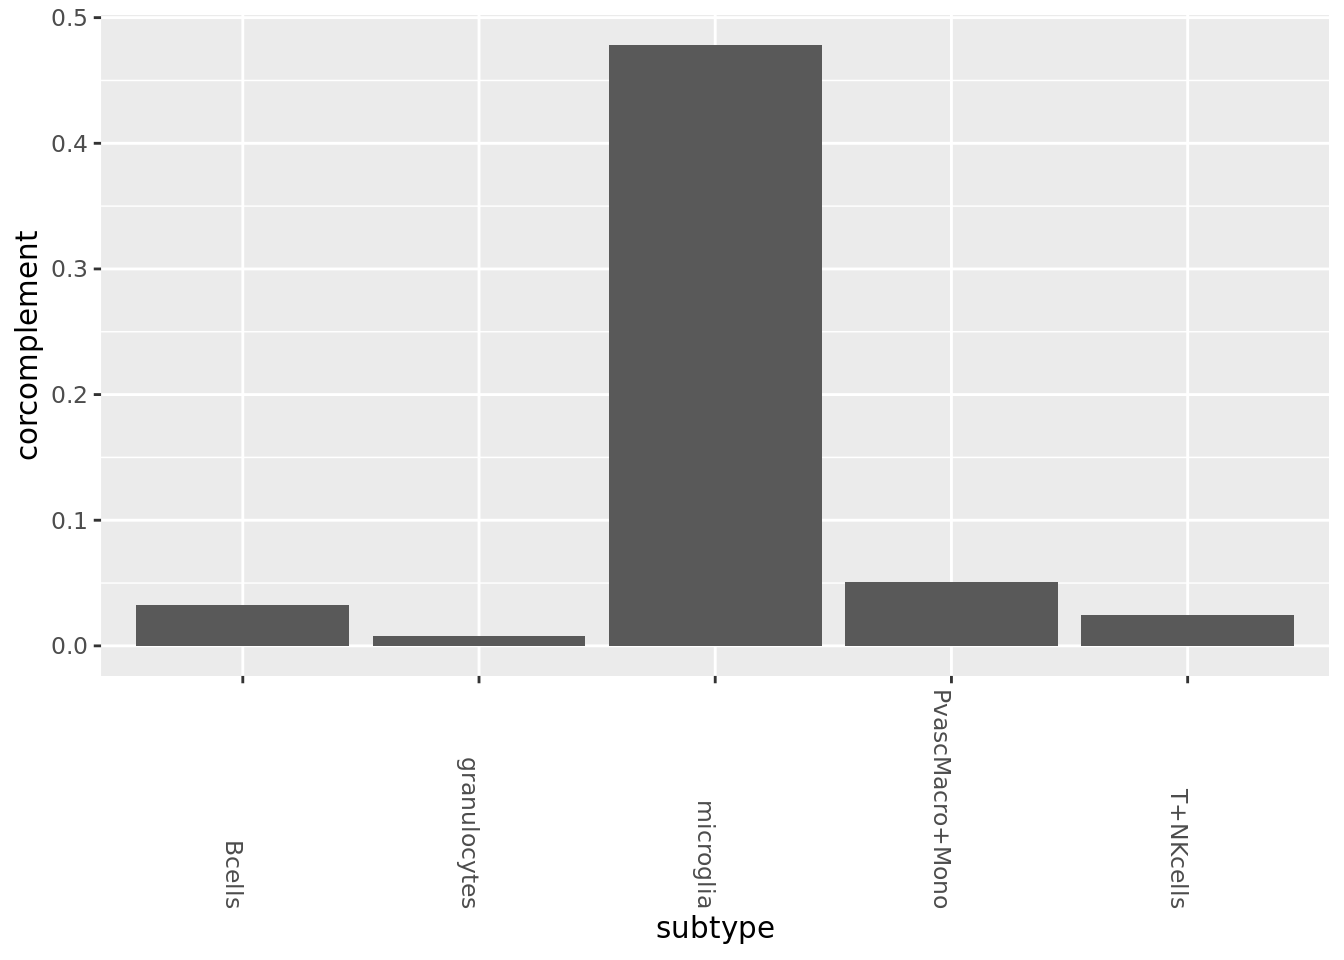 Fractional plot
FractionalPlot(mouse_annot$mouse_nr, mouse_annot$celltype, mouse_annot$condition)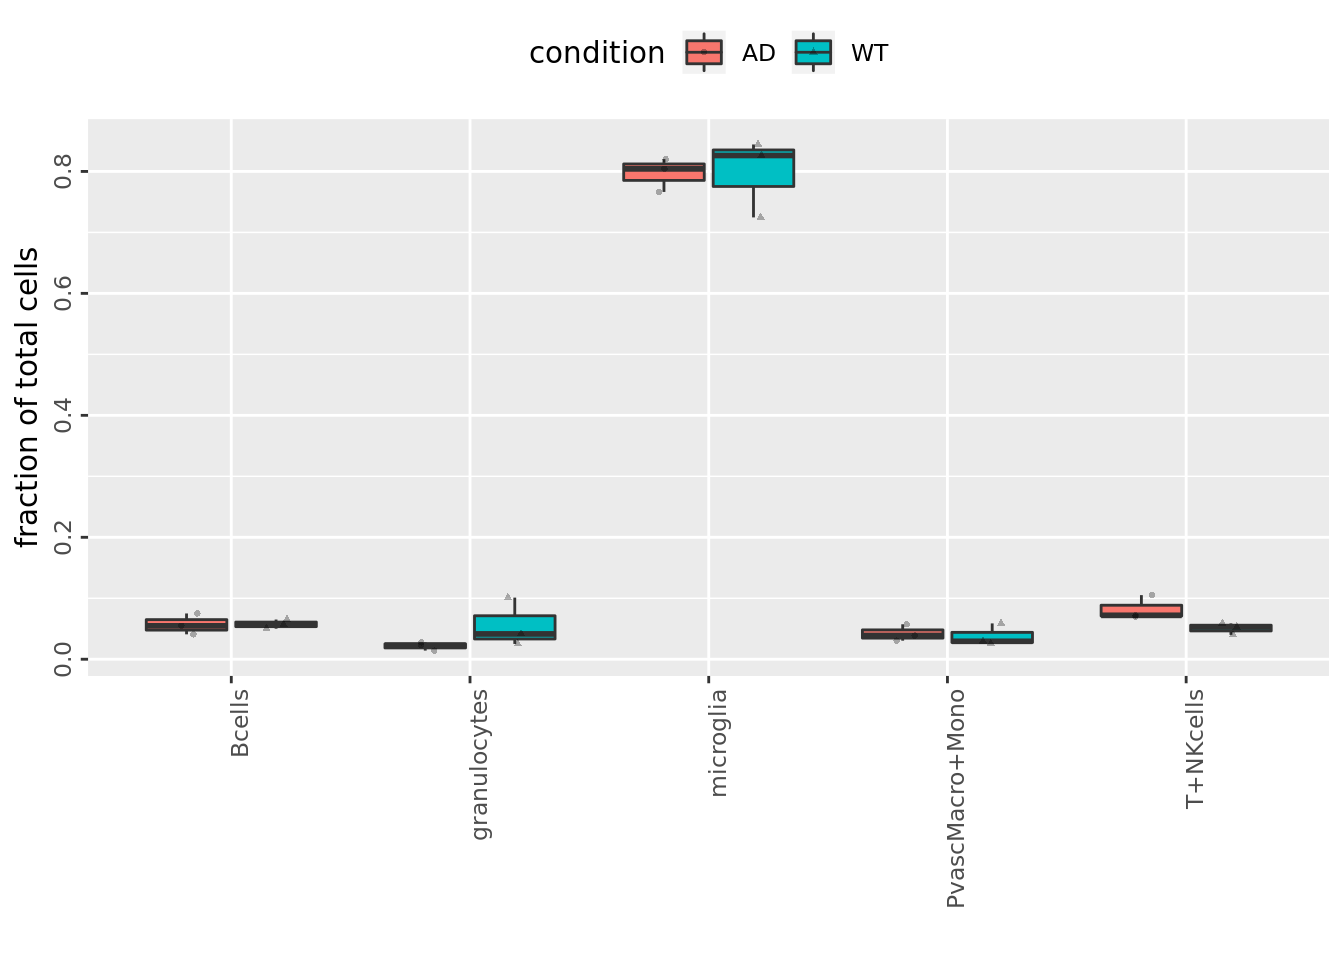
PAGA
conos_distances <- Matrix::readMM('/home/larsc/data/mouse_alzheimer/for_paga/graph_distances.mtx')
mouse_annot$subtype_sample <- paste(mouse_annot$celltype, mouse_annot$mouse_nr, sep='-')

mem_levels <- factor(mouse_annot$subtype_sample) %>% levels
subtype_order <- (paste0(mouse_annot$celltype) %>% unique)[order(paste0(mouse_annot$celltype) %>% unique)]
membership_vec <- as.numeric(factor(mouse_annot$subtype_condition))
membership_levels <- factor(mouse_annot$subtype_sample) %>% levels
membership_vec_subsamp <- as.numeric(factor(mouse_annot$subtype_sample))
connectivities <- GetPagaMatrix(conos_distances, membership_vec, scale=F)
linearized_stats <- seq(1, dim(connectivities)[1], 2) %>% sapply(function(i){connectivities[i,i+1]})
paga_df <- bind_cols(value=linearized_stats, subtype=subtype_order)
ggplot(paga_df, aes(y=-linearized_stats, x=subtype)) +geom_point()+
theme(axis.text.x = element_text(angle = -90, hjust = 1))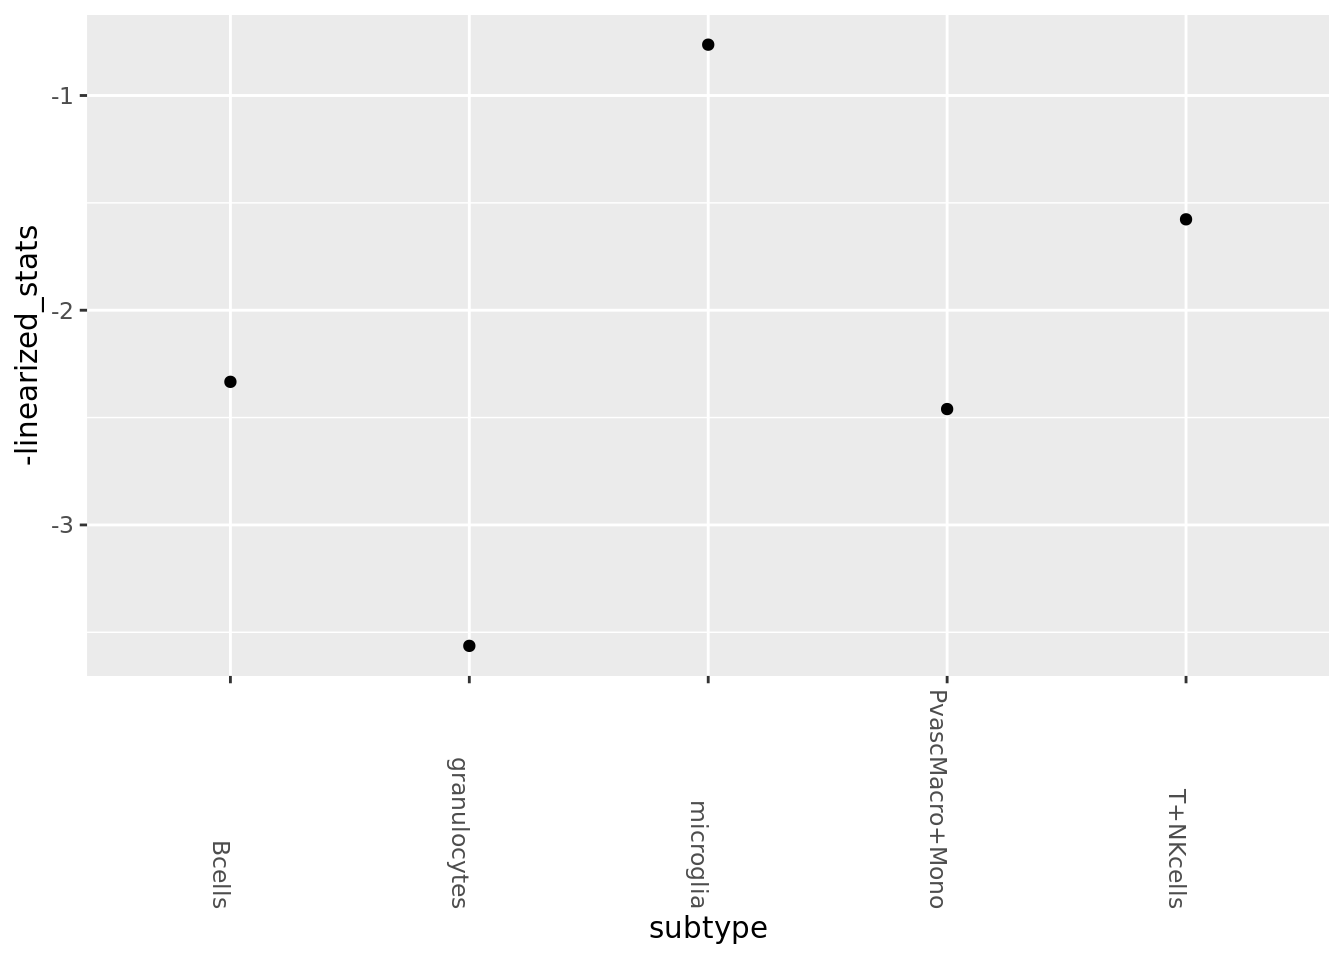
sessionInfo()R version 3.5.3 (2019-03-11)
Platform: x86_64-pc-linux-gnu (64-bit)
Running under: Ubuntu 18.04.2 LTS
Matrix products: default
BLAS: /usr/lib/x86_64-linux-gnu/atlas/libblas.so.3.10.3
LAPACK: /usr/lib/x86_64-linux-gnu/atlas/liblapack.so.3.10.3
locale:
[1] LC_CTYPE=en_US.UTF-8 LC_NUMERIC=C
[3] LC_TIME=en_US.UTF-8 LC_COLLATE=en_US.UTF-8
[5] LC_MONETARY=en_US.UTF-8 LC_MESSAGES=en_US.UTF-8
[7] LC_PAPER=en_US.UTF-8 LC_NAME=C
[9] LC_ADDRESS=C LC_TELEPHONE=C
[11] LC_MEASUREMENT=en_US.UTF-8 LC_IDENTIFICATION=C
attached base packages:
[1] stats graphics grDevices utils datasets methods base
other attached packages:
[1] irlba_2.3.3 pheatmap_1.0.12 pagoda2_0.1.0
[4] SecretUtils_0.1.0 reshape2_1.4.3 magrittr_1.5
[7] forcats_0.4.0 stringr_1.4.0 dplyr_0.8.1
[10] purrr_0.3.2 readr_1.3.1 tidyr_0.8.3
[13] tibble_2.1.2 ggplot2_3.1.1 tidyverse_1.2.1
[16] conos_1.0.0 igraph_1.2.4 Matrix_1.2-17
loaded via a namespace (and not attached):
[1] nlme_3.1-139 fs_1.3.1 usethis_1.5.0
[4] lubridate_1.7.4 devtools_2.0.2 RColorBrewer_1.1-2
[7] httr_1.4.0 rprojroot_1.3-2 tools_3.5.3
[10] backports_1.1.4 R6_2.4.0 lazyeval_0.2.2
[13] colorspace_1.4-1 withr_2.1.2 tidyselect_0.2.5
[16] gridExtra_2.3 prettyunits_1.0.2 processx_3.3.1
[19] compiler_3.5.3 git2r_0.25.2 cli_1.1.0
[22] rvest_0.3.4 xml2_1.2.0 desc_1.2.0
[25] labeling_0.3 triebeard_0.3.0 scales_1.0.0
[28] callr_3.2.0 digest_0.6.18 rmarkdown_1.12
[31] base64enc_0.1-3 pkgconfig_2.0.2 htmltools_0.3.6
[34] sessioninfo_1.1.1 rlang_0.3.4 readxl_1.3.1
[37] rstudioapi_0.10 shiny_1.3.2 generics_0.0.2
[40] jsonlite_1.6 dendextend_1.12.0 Rcpp_1.0.1
[43] munsell_0.5.0 abind_1.4-5 viridis_0.5.1
[46] stringi_1.4.3 whisker_0.3-2 yaml_2.2.0
[49] MASS_7.3-51.3 pkgbuild_1.0.3 Rtsne_0.15
[52] plyr_1.8.4 grid_3.5.3 ggrepel_0.8.1
[55] parallel_3.5.3 promises_1.0.1 crayon_1.3.4
[58] lattice_0.20-38 haven_2.1.0 hms_0.4.2
[61] knitr_1.22 ps_1.3.0 pillar_1.4.1
[64] rjson_0.2.20 pkgload_1.0.2 glue_1.3.1
[67] evaluate_0.13 data.table_1.12.2 remotes_2.0.4
[70] modelr_0.1.4 urltools_1.7.3 httpuv_1.5.1
[73] testthat_2.1.1 cellranger_1.1.0 gtable_0.3.0
[76] assertthat_0.2.1 xfun_0.6 mime_0.6
[79] xtable_1.8-4 broom_0.5.2 later_0.8.0
[82] viridisLite_0.3.0 memoise_1.1.0 workflowr_1.3.0
[85] Rook_1.1-1 brew_1.0-6