Identifying Tissue-resident T cells in lungs
The goal for this analysis is to identify a subset of T-cells, named as tissue-resident memory T cells, in the snATAC-seq data of lung tissues, which would be utilized to improve annotations for Asthma's risk variants.
Dataset:
- snATAC-seq and snRNA-seq data from Wang et al., 2020
- Samples were from small airway region of right middle lobe (RML) lung tissue
- 10 donors at different ages
- Premature born (n=3)
- 4-month-old (n=1)
- three yo (n=3)
- 30 yo (n=3)
Pre-processing snATAC-seq data using ArchR
- Generate fragment files from raw data
- Create Arrow Files based on fragment files, which contain
- metadata
- matrices of insertion counts across genome-wide 5000-bp bins
- Per-cell Quality control
- Doublet inference
Create an ArchR Project for data processing
- Perform QCs on scATAC-Seq data matrix
- Filter out cells identified as doublets
- Create an ArchR Project
- input a list of ArrowFiles and parameters
- define output directory where all results and plots be stored
- Gene/Genome annotations will be stored in the project.
Dimension reduction and clustering
- Perform dimension reduction using Latent Semantic Indexing
- Correct batch effects with Harmony
- Clustering with Seurat's KNN algorithm
- Project high-dimensional data to 2D with UMAP
- Predict gene activity scores using all variants with functional annotations (enhancers)
- Identify clusters based on the gene scores of marker genes
In [ ]:
library("ArchR")
library(Matrix)
library("Seurat")
#Load ArchR object
proj<-loadArchRProject("~/cluster/projects/lung_subset/")
proj.orig<-loadArchRProject("lung_snATAC/")
In [54]:
options(repr.plot.width=14, repr.plot.height=12)
p1 <- plotEmbedding(ArchRProj = proj.orig, colorBy = "cellColData", name = "Clusters", embedding = "UMAP") + ggtitle("Human lung snATAC-seq(74930 nuclei)")
p1

In [ ]:
#predict gene scores for marker genes
markerGenes <- c(
'NCR1','CD8A','CD4','CD74',
'CCR7', 'ITGAE','CD69',
'IL7R', 'ICOS'
)
proj.orig <- addImputeWeights(proj.orig)
#make plots for marker genes
p <- plotEmbedding(
ArchRProj = proj.orig,
colorBy = "GeneScoreMatrix",
name = markerGenes,
embedding = "UMAP",
imputeWeights = getImputeWeights(proj.orig)
)
#Rearrange for grid plotting
p2 <- lapply(p, function(x){
x + guides(color = FALSE, fill = FALSE) +
theme_ArchR(baseSize = 6.5) +
theme(plot.margin = unit(c(0, 0, 0, 0), "cm")) +
theme(
axis.text.x=element_blank(),
axis.ticks.x=element_blank(),
axis.text.y=element_blank(),
axis.ticks.y=element_blank()
)
})
UMAP plots colored with predicted gene scores for sub-clusters of T/NK cells
In [20]:
do.call(cowplot::plot_grid, c(list(ncol = 3),p2))

Sub-clustering on T cells/NK cells (cluster 22-25)
Procedures:
- Take a subset of cells that belong to cluster 22-25
- Perform dimension reduction using Latent Semantic Indexing
- Do clustering with KNN and projection with UMAP
In [21]:
p2 <- plotEmbedding(ArchRProj = proj, colorBy = "cellColData", name = "Clusters", embedding = "UMAP", title="Sub-clustering of T cell/NK cells")
p2

In [ ]:
#predict gene scores for marker genes
markerGenes <- c(
'NCR1','CD8A','CD4','CD74',
'CCR7', 'ITGAE','CD69',
'IL7R', 'ICOS'
)
proj<- addImputeWeights(proj)
#make plots for marker genes
p <- plotEmbedding(
ArchRProj = proj,
colorBy = "GeneScoreMatrix",
name = markerGenes,
embedding = "UMAP",
imputeWeights = getImputeWeights(proj)
)
#Rearrange for grid plotting
p2 <- lapply(p, function(x){
x + guides(color = FALSE, fill = FALSE) +
theme_ArchR(baseSize = 6.5) +
theme(plot.margin = unit(c(0, 0, 0, 0), "cm")) +
theme(
axis.text.x=element_blank(),
axis.ticks.x=element_blank(),
axis.text.y=element_blank(),
axis.ticks.y=element_blank()
)
})
UMAP plots colored with predicted gene scores for sub-clusters of T/NK cells
In [29]:
do.call(cowplot::plot_grid, c(list(ncol = 3),p2))

Integration with scRNA-seq data
- sample QC:
- High fraction of MT reads detected, which implies poor cell quality in the library.
In [34]:
seRNA<-readRDS("~/cluster/projects/lung_others/lung_scRNA/")
seRNA.orig<-readRDS("~/cluster/projects/lung_others/lung_scRNA/lung_Wang2020.rds")
markers<-c("AGER","SFTPA2","NDNF","KCNJ15","GDF15","SCGB3A2","TP63","MUC5B",
"MYB","RIMS2","COL2A1","LAMC3","NTRK3","MYOCD","LTBP2","TCF21","MFAP5",
"BMX","ACKR1","KIT","CA4","ABCB1","RELN","TREM1","PLTP","FCN1","FLT3",
"EPB42","TCF7","PRF1","PAX5","MS4A2")
options(repr.plot.width=12, repr.plot.height=10)
DotPlot(object=seRNA.orig, features=markers) + theme(axis.text.x = element_text(angle=45, vjust = 0.5))

Perform sub-clustering on lung T cells from scRNA-seq dataset
In [38]:
DimPlot(seRNA, reduction="umap", label = T, label.size = 5) + ggtitle("Human lung scRNA-Seq T cells (3209 nuclei)")
DotPlot(object=seRNA, features=markerGenes) + theme(axis.text.x = element_text(angle=45, vjust = 0.5))


All clusters except for cluster 1 were labeled as TRMs
In [39]:
new.clusters.ids<-c("TRM", "non-TRM", "TRM", "TRM", "TRM", 'TRM', "TRM")
names(new.clusters.ids)<-levels(seRNA)
seRNA<-RenameIdents(seRNA, new.clusters.ids)
seRNA[["cell_types"]]<-seRNA@active.ident
DimPlot(seRNA, reduction="umap", label=TRUE)

Define cluster identity using FindTransferAnchors() from Seurat
- Align cells from scRNA-seq with cells from snATAC-seq by comparing the gene score matrix derived from scATAC-seq with the scRNA-seq gene expression matrix
In [ ]:
projInteg <- addGeneIntegrationMatrix(
ArchRProj = proj,
useMatrix = "GeneScoreMatrix",
matrixName = "GeneIntegrationMatrix",
reducedDims = "IterativeLSI",
seRNA = seRNA,
addToArrow = FALSE,
groupRNA = "cell_types",
nameCell = "predictedCell_Un",
nameGroup = "predictedGroup_Un",
nameScore = "predictedScore_Un"
)
In [43]:
#Unconstrained integration
cM <- as.matrix(confusionMatrix(projInteg$Clusters, projInteg$predictedGroup_Un))
preClust <- colnames(cM)[apply(cM, 1 , which.max)]
cbind(preClust, rownames(cM)) #Assignments
In [50]:
cM
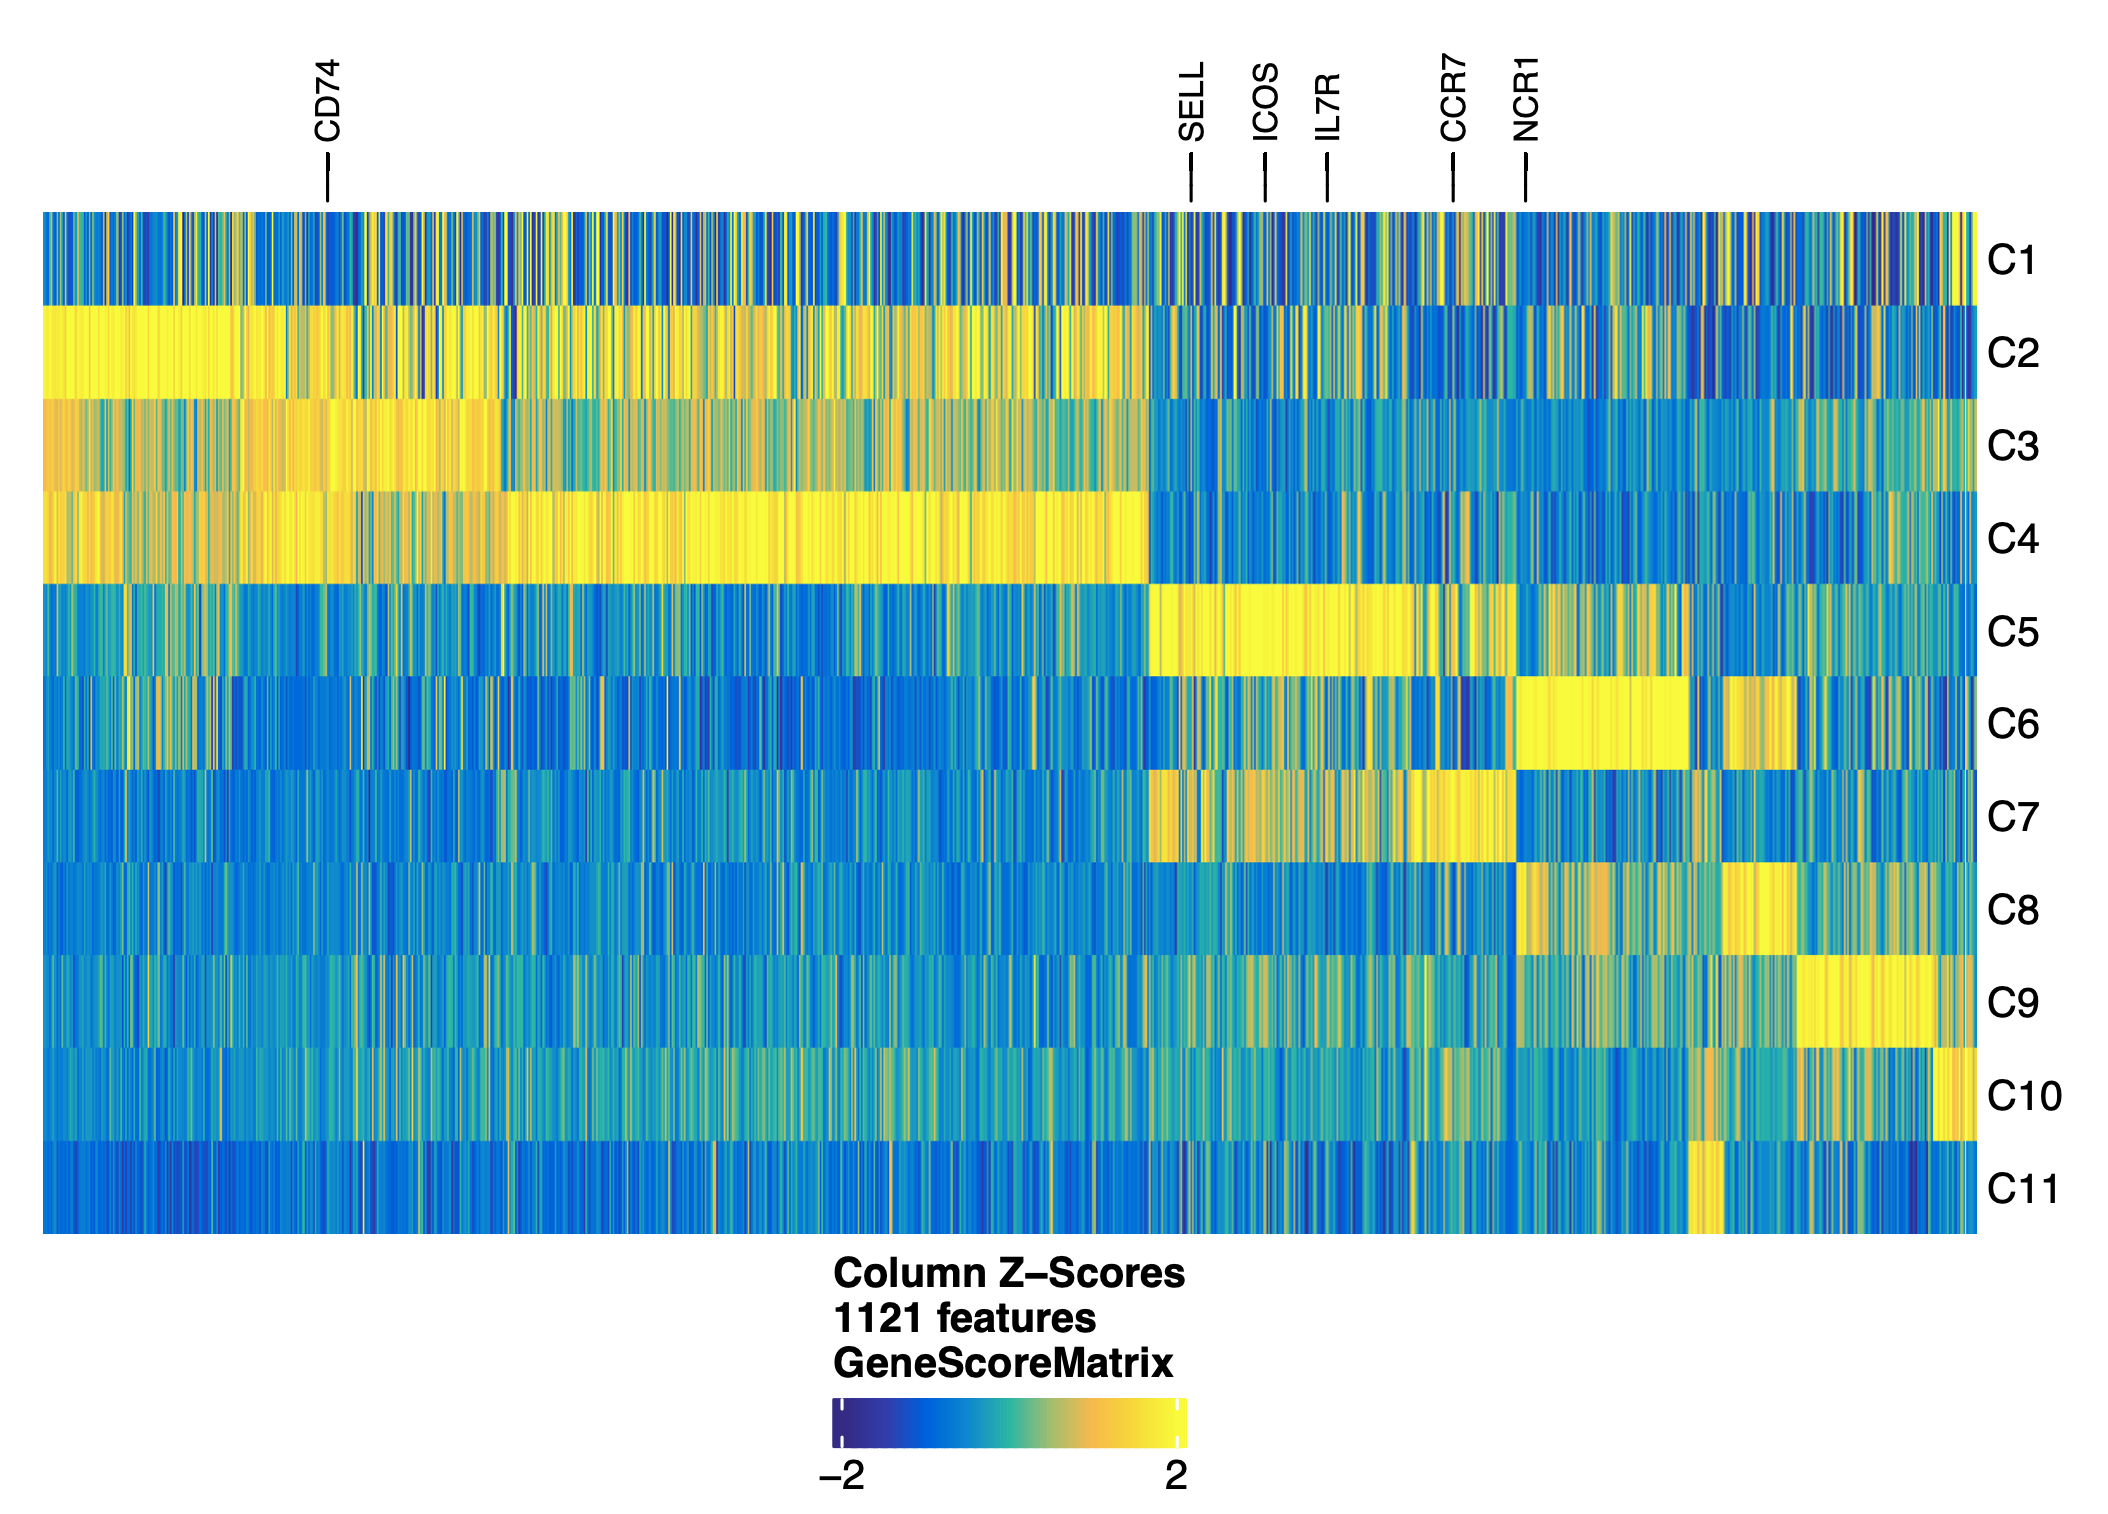
- Based on this attempt, C5 and C7 were more likely to be not matched with TRMs in scRNA-seq data. This is as expected as these clusters have high CCR5 gene expression. C6 and C8 have high expression of NCR1, a marker gene for NK cells. These were not picked up probably due to the subsets of scRNA-seq data not including NK cells.
In [ ]: