Prediction results for a random subset of cells
Joyce Hsiao
Last updated: 2018-07-12
Code version: ef7ae30
Retrieve and combine results
Code for summarizing results
diff_time_wrapper <- function(results_list) {

  methods_list <- sapply(names(results_list),
                         function(x) strsplit(x, split=".", fixed=TRUE)[[1]][2])

  diff_time_list <- do.call(rbind, lapply(1:length(results_list), function(i) {
    diff_time <- results_list[[i]]$diff_time
    diff_mean <- mean(diff_time/2/pi)
#    diff_se <- sd(diff_time/2/pi)/sqrt(ncol(results_list[[1]]$Y))

    return(data.frame(diff_mean=diff_mean,
#                      diff_se=diff_se,
                      methods=methods_list[i]))
  }) )
  return(diff_time_list)
}
Summarizing results
ngenes <- c(5, seq(10,200, by=10))
genes_list <- readRDS("../data/results/results_topgenes.rds")
ll <- sapply(genes_list, length)[1:41]

eval_res <- do.call(rbind, lapply(1:length(ll), function(i) {
  ngene <- ll[i]
#  train_topX <- do.call(rbind, lapply(1:5, function(fold) {
  fl_name <- list.files("../data/results",
                 pattern=paste0("results_eval.top",ngene,".rds"),
                 full.names = TRUE)
  df <- readRDS(fl_name)
  out <- diff_time_wrapper(df)
  out$ngenes <- ngene

  return(out)
}) )

eval_res$train <- "fucci_genes"
saveRDS(eval_res, file = "../output/method-eval.Rmd/diff_time.rds")


#ngenes <- c(5, seq(10,200, by=10))
genes_list <- readRDS("../data/results/results_topgenes.rds")
ll <- sapply(genes_list, length)[1:41]
train_top_permute <- do.call(rbind, lapply(1:length(ll), function(i) {
  ngene <- ll[i]
  fl_name <- list.files("../data/results",
                 pattern=paste0("results_eval_permute_oncyclical.top",ngene,".rds"),
                 full.names = TRUE)
  df <- readRDS(fl_name)
  out <- diff_time_wrapper(df)
  out$ngenes <- ngene

  return(out)
}) )

saveRDS(train_top_permute,
  file = "../output/method-eval.Rmd/diff_time_permute_oncyclical.rds")
Compare seurat with peco
fucci predict random cell times
df <- readRDS("../output/method-eval.Rmd/diff_time_permute_oncyclical.rds")

library(ggplot2)
#eval_res <- readRDS("../output/method-eval.Rmd/diff_time.rds")
ggplot(df,
       aes(x=as.numeric(ngenes), y=diff_mean, color=methods)) +
  geom_point() + geom_line(lty=3) +
  ylab("Error margin (% arc length)") + xlab("Number of cyclical genes") +
  ggtitle("Predict random cell times in the validation sample")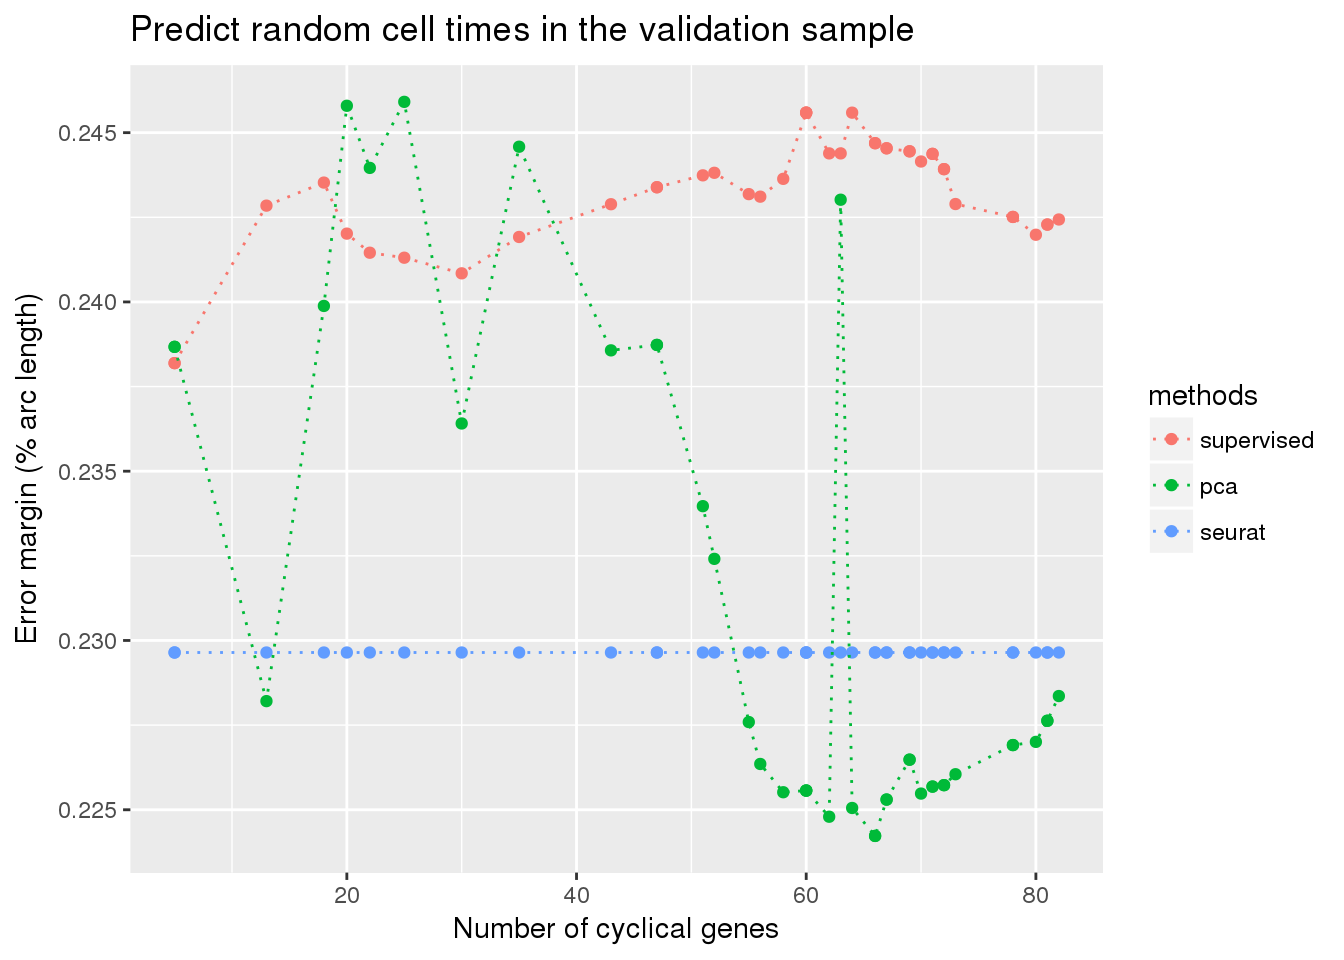
view all results
eval_res <- readRDS("../output/method-eval.Rmd/diff_time.rds")
df <- readRDS("../data/results/results_eval.seuratgenes.rds")
eval_seuratgenes <- diff_time_wrapper(df)
eval_seuratgenes$ngenes <- 97
eval_seuratgenes$train <- "seurat_genes"


eval_sub <- subset(eval_res, methods != "seurat")
eval_combo <- rbind(eval_sub, eval_seuratgenes)
eval_combo$methods_combo <- paste0(eval_combo$methods," using ", eval_combo$train)

library(ggplot2)
#eval_res <- readRDS("../output/method-eval.Rmd/diff_time.rds")
ggplot(eval_combo,
       aes(x=as.numeric(ngenes), y=diff_mean, color=methods_combo)) +
  # geom_errorbar(subset(eval_res, methods == "supervised"),
  #               mapping=aes(ymin=diff_mean-diff_se, ymax=diff_mean+diff_se)) +
  geom_point() + geom_line(lty=3) +
  ylab("Error margin (% arc length)") + xlab("Number of cyclical genes") +
  ggtitle("Prediction error in the validation sample")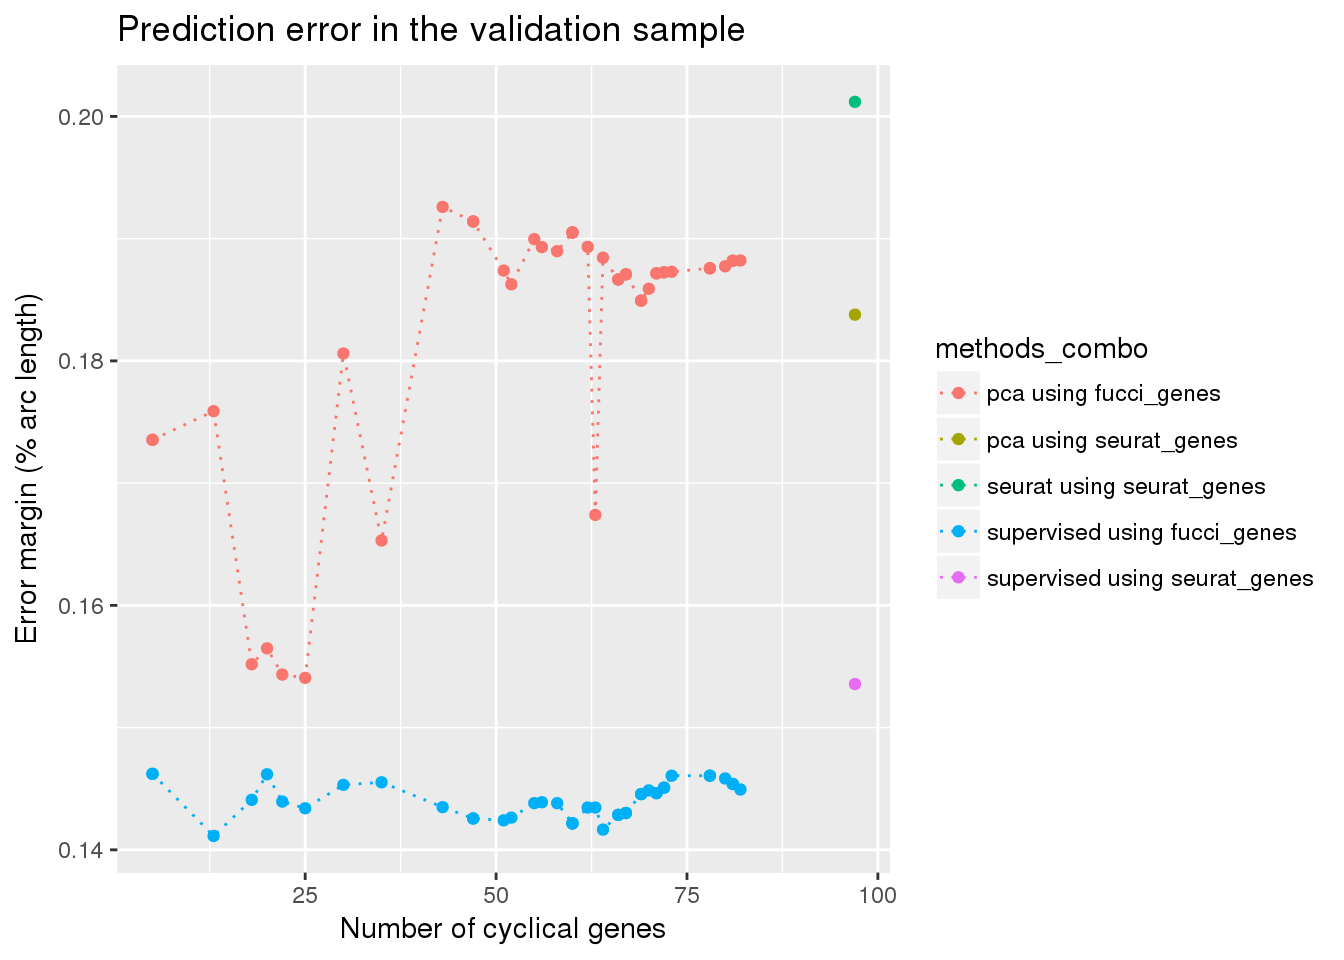
distribution of circular distance
# df <- readRDS("../data/results/results_eval.seuratgenes.rds")
# ggplot(data.frame(time=df$fit.supervised$pred_time_shift),
#        aes(x=time)) +
#   geom_histogram(binwidth=.15) +
#   xlab("predicted time") +
#   ggtitle("Peco prediction using Seurat genes")
df2 <- readRDS("../data/results/results_eval.top20.rds")
ggplot(data.frame(time=df2$fit.supervised$pred_time_shift),
       aes(x=time)) +
  geom_histogram(binwidth=.28) +
  xlab("predicted time") +
  ggtitle("Peco prediction using 20 genes")
distribution of different time
df <- readRDS("../data/results/results_eval.seuratgenes.rds")

plot(x=df$fit.supervised$ref_time,
     y=df$fit.supervised$diff_time,
     col="royalblue", pch=16, cex=.7, ylim=c(0,pi),
     xlab="Fucci time", ylab="Circular distance")
points(x=df$fit.supervised$ref_time,
       y=df$fit.seurat$diff_time,
       col="forestgreen", pch=1, cex=.7)
legend("topright", legend=c("Peco", "Seurat"),
       col=c("royalblue", "forestgreen"), pch=c(16,1))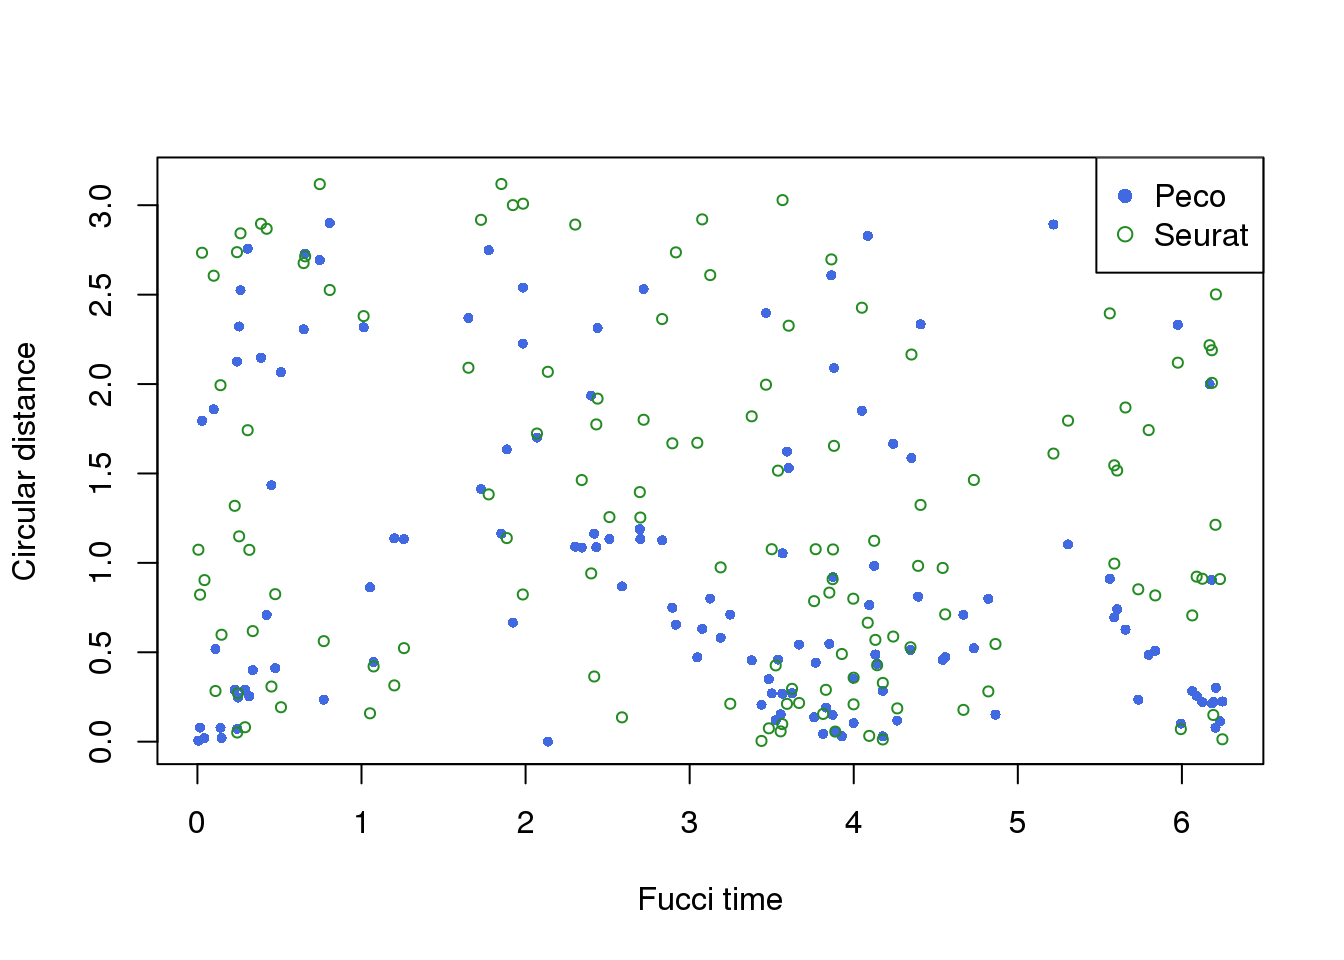
Seurat time vs Seurat classes
tmp <- readRDS("../data/results/results_eval.seuratgenes.rds")
cols <- c("yellow", "orange", "red")
ggplot(data.frame(tmp$fit.seurat), aes(x=assignments,
                           y=pred_time_shift,
                           fill=assignments)) +
  geom_violin(color="gray50") + geom_boxplot(width=.2, color="gray50") +
  scale_fill_manual(values=cols) +
  ylab("Seurat time") + xlab("Seurt assignment") +
  ggtitle("Seurat time by Seurat classes")
peco time vs peco classes
- based on BIC, should be 3 clusters
tmp <- readRDS("../data/results/results_eval.seuratgenes.rds")cluster peco times
library(movMF)
set.seed(21)
mov_res <- lapply(2:7, function(cl) {
  movMF(cbind(cos(tmp$fit.supervised$cell_times_est),
                sin(tmp$fit.supervised$cell_times_est)),
                k=cl,  nruns=20, kappa = list(common = TRUE))
})

saveRDS(mov_res, "../output/method-eval.Rmd/mov_res.rds")
library(movMF)
mov_res <- readRDS("../output/method-eval.Rmd/mov_res.rds")
sapply(mov_res, function(x) BIC(x))[1] -43.32924 -69.94688 -60.16618 -64.13797 -65.95380 -68.47631clusts <- predict(mov_res[[2]])
#table(predict(mov_res[[3]]))
table(clusts)clusts
1 2 3
68 18 47 cols <- c("yellow", "orange", "red")
ggplot(data.frame(class=factor(clusts),
pred_time_shift=tmp$fit.supervised$pred_time_shift),
aes(x=class, y=pred_time_shift,
fill=class)) +
geom_violin(color="gray50") + geom_boxplot(width=.2, color="gray50") +
scale_fill_manual(values=cols) +
ylab("peco time") + xlab("peco assignment") +
ggtitle("Peco time by Peco classes")
table(tmp$fit.seurat$assignments, clusts) clusts
1 2 3
G1 4 2 1
S 59 4 5
G2M 5 12 41Peco cell times by Seurat classes
ggplot(data.frame(class=tmp$fit.seurat$assignments,
                  pred_time_shift=tmp$fit.supervised$pred_time_shift),
                  aes(x=pred_time_shift,
                      group=class)) +
  geom_histogram(aes(fill=class)) +
  facet_wrap(~class) +
  scale_fill_manual(values=cols) +
  xlab("Peco time") +
  ggtitle("Peco time by Seurat classes")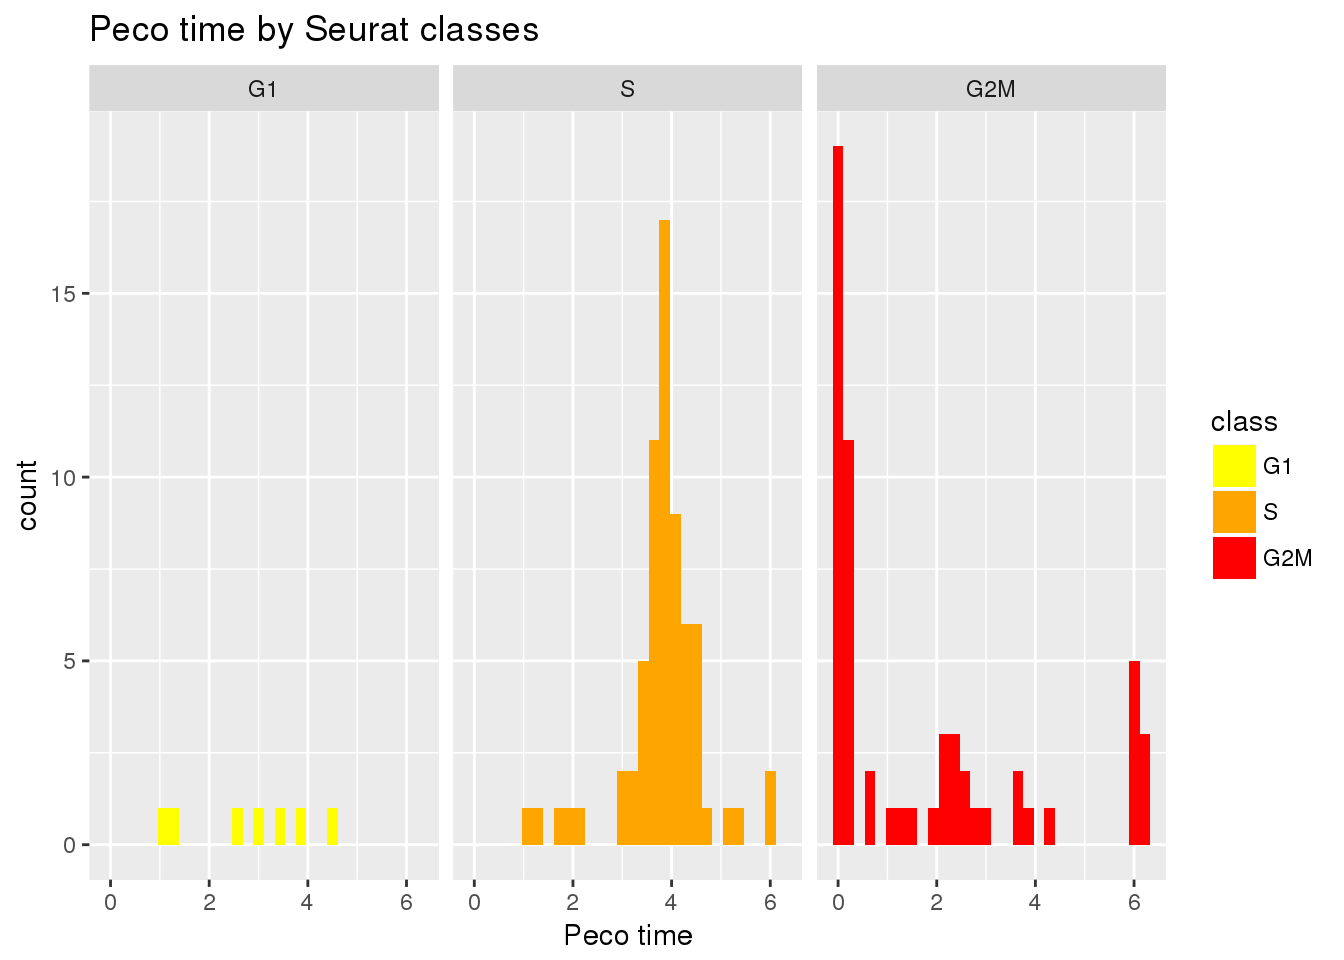
ggplot(data.frame(class=factor(clusts),
                  pred_time_shift=tmp$fit.supervised$pred_time_shift),
                  aes(x=pred_time_shift,
                      group=class)) +
  geom_histogram(aes(fill=class)) +
  facet_wrap(~class) +
  scale_fill_manual(values=cols) +
  xlab("Peco time") +
  ggtitle("Peco time by Peco classes")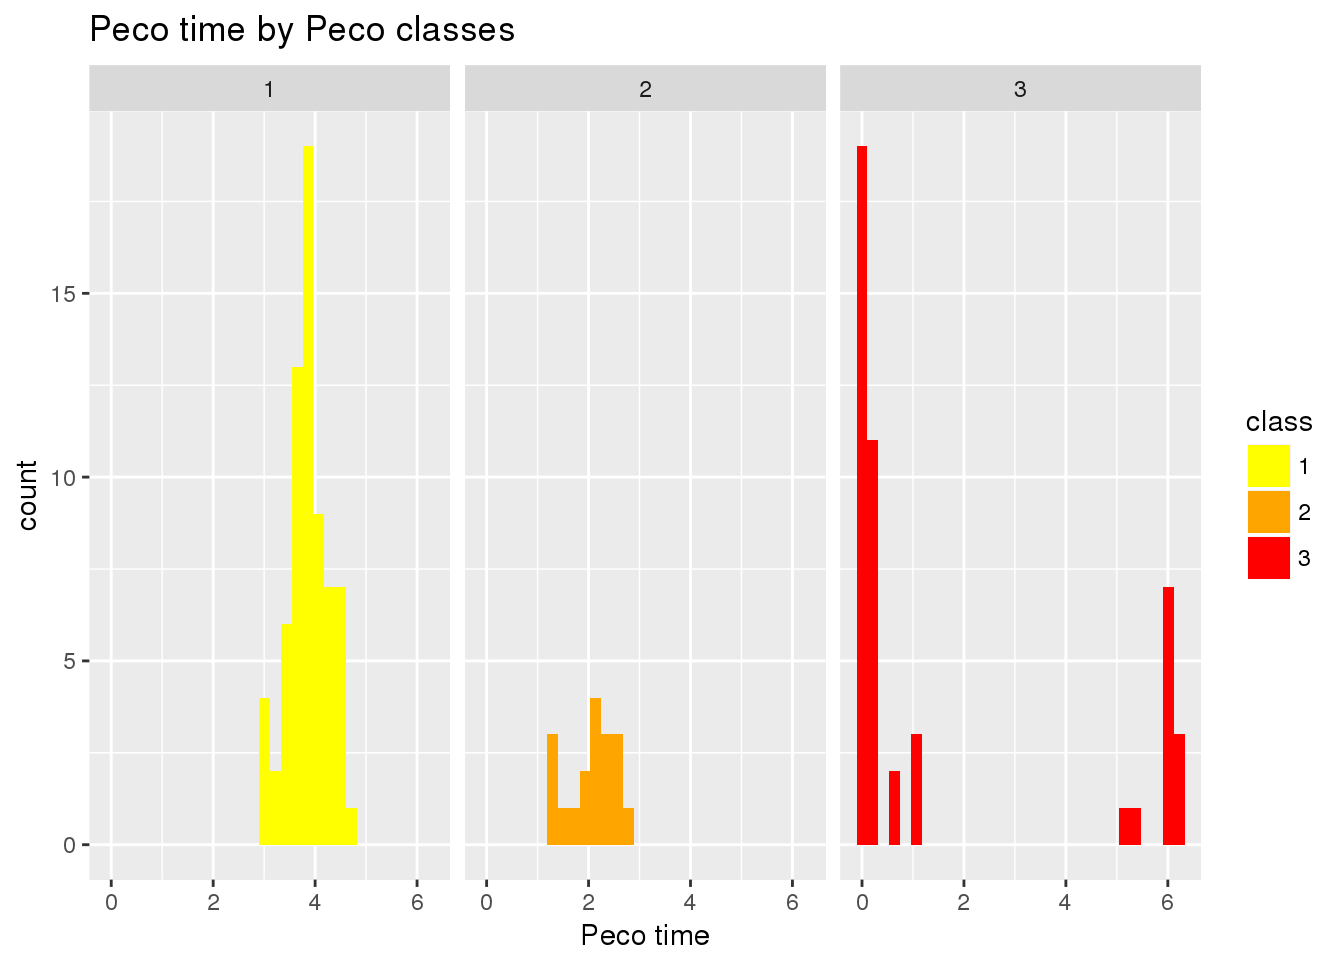
# eval_res <- readRDS("../output/method-eval.Rmd/diff_time.rds")
#
# ggplot(subset(eval_res, methods == "supervised"),
#        aes(x=ngenes, y=diff_mean)) +
#   # geom_errorbar(subset(eval_res, methods == "supervised"),
#   #               mapping=aes(ymin=diff_mean-diff_se, ymax=diff_mean+diff_se),
#   #               color="blue") +
#   geom_point() + geom_line(lty=3) +
#   ylab("Error margin (% arc length)") + xlab("Number of cyclical genes") +
#   ggtitle("Prediction error in validation set")
Confidence on the estimates
eval_res <- readRDS("../data/results/results_eval.seuratgenes.rds")
obj <- eval_res$fit.supervised

#grids <- as.numeric(colnames(obj$prob_per_cell_by_celltimes))
#ncells <- ncol(obj$Y)
#dd <- rep(NULL, ncells)
  #print(j)
post_prob_vector <- obj$prob_per_cell_by_celltimes[1,]

credible_interval <- function(post_prob_vector, alpha=.05, verbose=F) {
  which_max <- which.max(post_prob_vector)
  if (which_max==length(post_prob_vector)) {
    forward_grid_prob <- post_prob_vector[1:(which_max-1)]
    reverse_grid_prob <- post_prob_vector[rev(1:(which_max-1))]
  } else if (which_max==1) {
    forward_grid_prob <- post_prob_vector[2:length(post_prob_vector)]
    reverse_grid_prob <- post_prob_vector[rev(2:length(post_prob_vector))]
  } else {
    forward_grid_prob <- post_prob_vector[c(c((which_max+1):length(post_prob_vector)),
                                            c(1:(which_max-1)))]
    reverse_grid_prob <- post_prob_vector[c(rev(1:(which_max-1)),
                                            rev((which_max+1):length(post_prob_vector)))]
  }

  sum_post_prob_initial <- post_prob_vector[which_max]
  i=1

  while(i<length(forward_grid_prob)) {
    #print(i)
    sum_post_prob_initial <- sum_post_prob_initial + forward_grid_prob[i] + reverse_grid_prob[i]
    sum_post_prob_update <- sum_post_prob_initial

    if (verbose) message("cum. prob:", sum_post_prob_update)
    grid <- i

    if (sum_post_prob_update > (1-alpha)) break
    i=i+1
    sum_post_prob_initial <- sum_post_prob_update

    }

    return(list(iter=i,
                sum_post_prob=sum_post_prob_update,
                forward_boundary=as.numeric(names(forward_grid_prob[grid])),
                reverse_boundary=as.numeric(names(reverse_grid_prob[grid]))))
}


eval_res <- readRDS("../data/results/results_eval.seuratgenes.rds")
obj <- eval_res$fit.supervised

grids <- as.numeric(colnames(obj$prob_per_cell_by_celltimes))
ncells <- ncol(obj$Y)
dd <- rep(NULL, ncells)
for (j in 1:ncells) {
  #print(j)
  post_prob_vector <- obj$prob_per_cell_by_celltimes[j,]
  rr=credible_interval(post_prob_vector, verbose=F)
  which_max <- which.max(post_prob_vector)

  if (rr$forward_boundary < rr$reverse_boundary) {
    dd[j] <- !((obj$ref_time[j] >= rr$forward_boundary &
      obj$ref_time[j] <= rr$reverse_boundary))
  }
  if (rr$forward_boundary > rr$reverse_boundary) {
    dd[j] <- (obj$ref_time[j] >= rr$reverse_boundary &
      obj$ref_time[j] <= rr$forward_boundary)
  }
  dd[j]
}

source("../peco/R/cycle.corr.R")

par(mfrow=c(1,1))
plot(obj$ref_time,
     obj$diff_time/2/pi,
     col=c("red", "gray50")[dd+1],
     pch=c(16,1)[dd+1],
     xlab="fucci time",
     ylab="Prediction error",
     main = "Credible interval and predictions")
abline(h=.15, lty=3, col="black")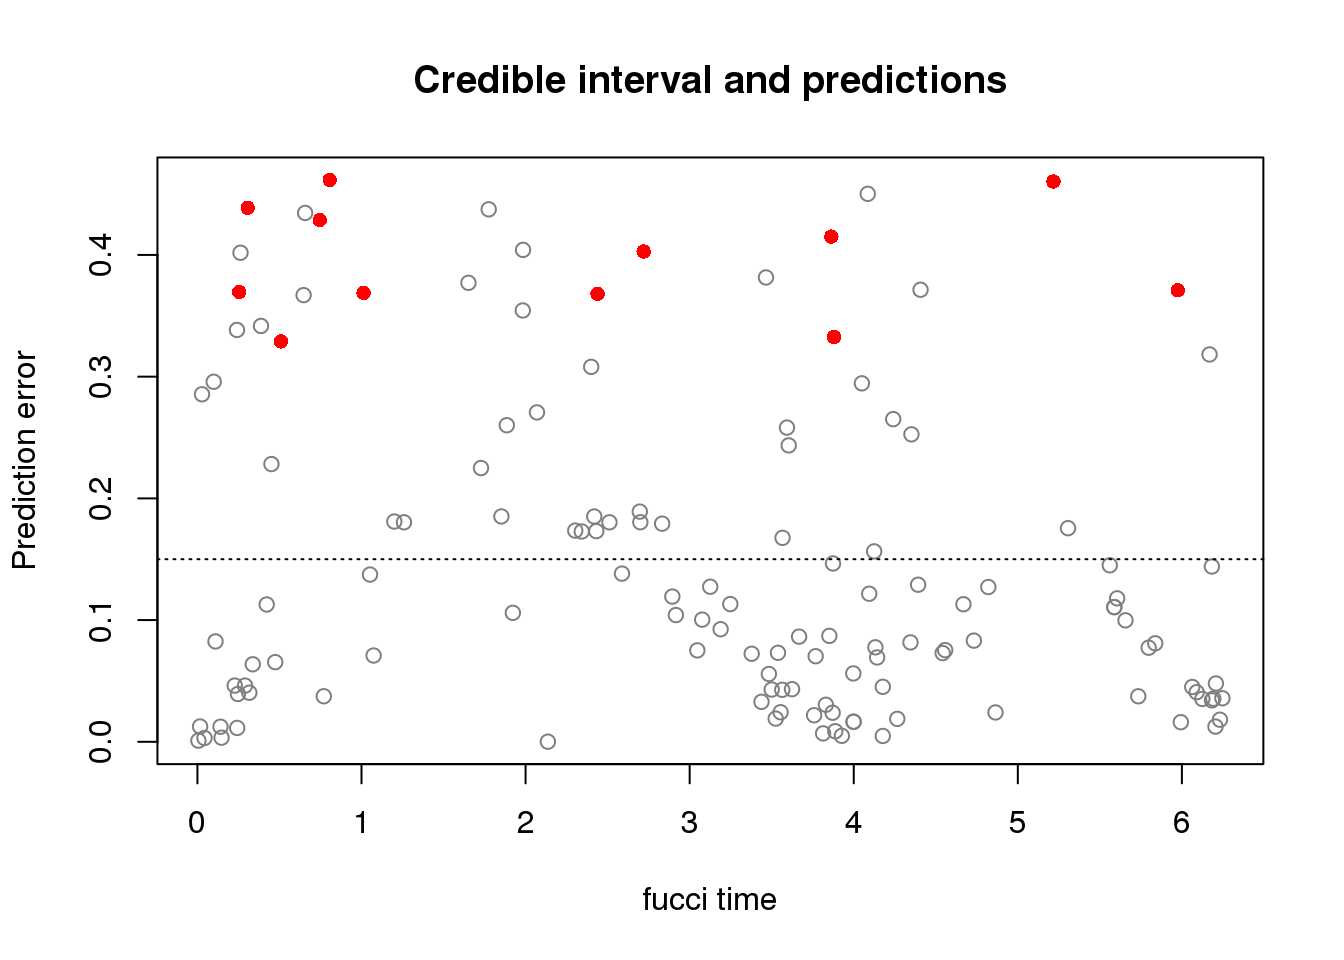
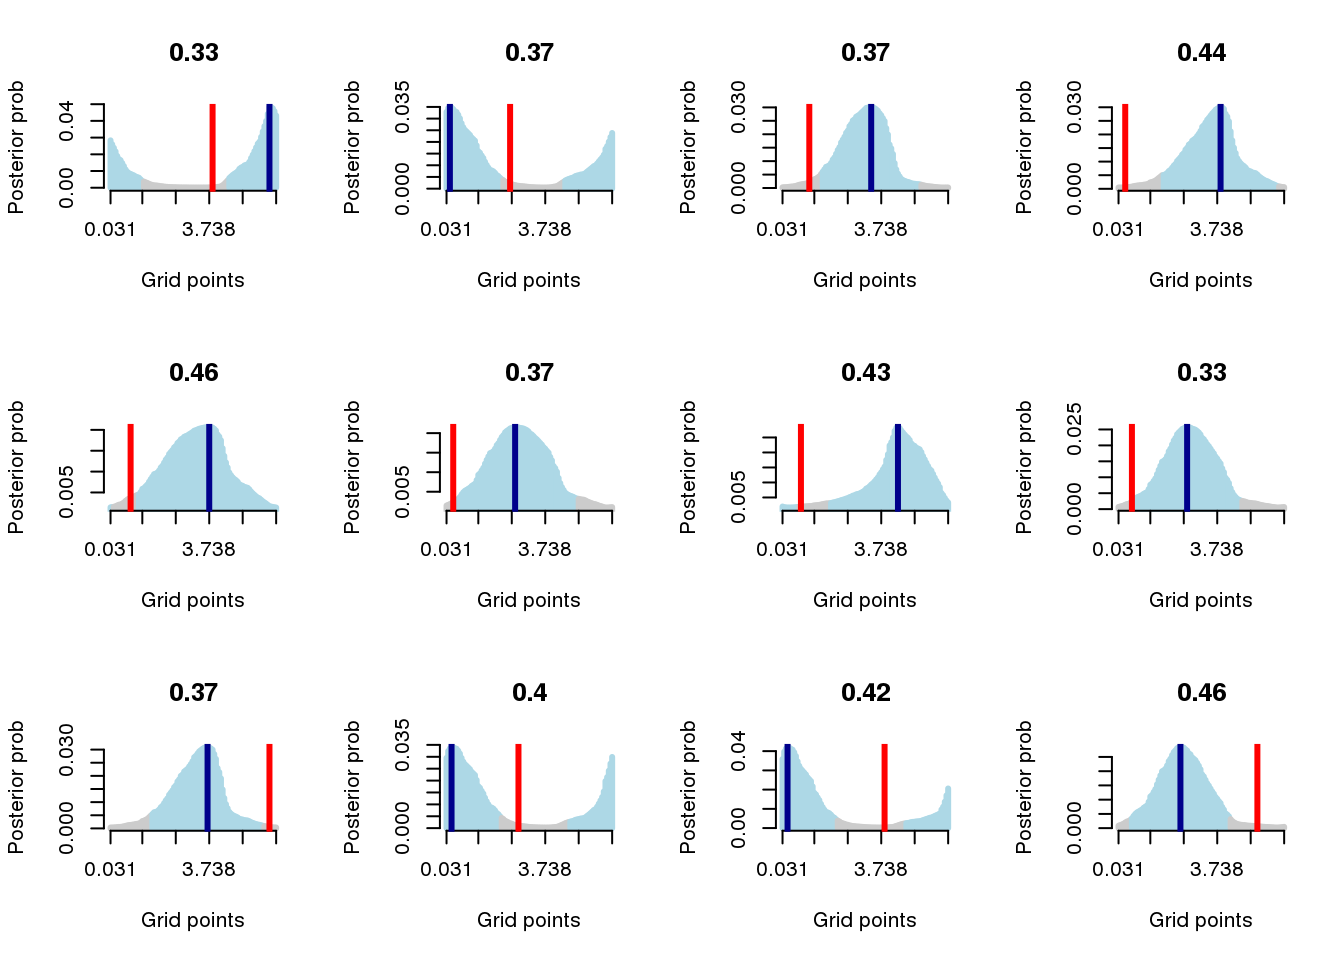
par(mfrow=c(3,4))
for (j in 1:sum(dd==F)) {
  cell_ind <- which(dd==F)[j]
  post_prob_vector <- obj$prob_per_cell_by_celltimes[cell_ind,]
  rr=credible_interval(post_prob_vector, verbose=F)
  which_max <- which.max(post_prob_vector)
  forward_grids <- c(c((which_max+1):length(post_prob_vector)),
                     c(1:(which_max-1)))
  reverse_grids <- c(rev(1:(which_max-1)),
                     rev((which_max+1):length(post_prob_vector)))
  cols <- rep("gray80", 100)
  cols[c(reverse_grids[1:rr$iter])] <- "lightblue"
  cols[c(forward_grids[1:rr$iter])] <- "lightblue"
  cols[which_max] <- "lightblue"
  # grids_outside <- grids[which(cols=="gray80")]
  # if (theta_test[cell_ind] >= min(grids_outside) &
  #     theta_test[cell_ind] <= max(grids_outside))
  plot(obj$prob_per_cell_by_celltimes[cell_ind,], type="h",
       xaxt="n", ylab="Posterior prob", col=cols, axes=F,
       xlab="Grid points", lwd=3)
  axis(1, at=c(1,seq(20, 100, by=20)),
       labels=round(grids[c(1,seq(20, 100, by=20))],3))
  axis(2)
  abline(v=which.max(obj$prob_per_cell_by_celltimes[cell_ind,]),
         col="darkblue", lty=1, lwd=3)
  abline(v=which.min(circ_dist(grids, obj$ref_time[cell_ind])),
         col="red", lty=1, lwd=3)
  title(paste(round(obj$diff_time[cell_ind]/2/pi,2)))
}
print for visual examination
pdf("../output/method-eval.Rmd/uncertainties.pdf")
par(mfrow=c(4,5))
for (cell_ind in 1:133) {
  print(cell_ind)
  #cell_ind <- which(dd==F & obj$diff_time/2/pi < .15)[j]
  post_prob_vector <- obj$prob_per_cell_by_celltimes[cell_ind,]
  rr=credible_interval(post_prob_vector, verbose=F)
  which_max <- which.max(post_prob_vector)
  forward_grids <- c(c((which_max+1):length(post_prob_vector)),
                     c(1:(which_max-1)))
  reverse_grids <- c(rev(1:(which_max-1)),
                     rev((which_max+1):length(post_prob_vector)))
  cols <- rep("gray80", 100)
  cols[c(reverse_grids[1:rr$iter])] <- "lightblue"
  cols[c(forward_grids[1:rr$iter])] <- "lightblue"
  cols[which_max] <- "lightblue"
  # grids_outside <- grids[which(cols=="gray80")]
  # if (theta_test[cell_ind] >= min(grids_outside) &
  #     theta_test[cell_ind] <= max(grids_outside))
  plot(obj$prob_per_cell_by_celltimes[cell_ind,], type="h",
       xaxt="n", ylab="Posterior prob", col=cols, axes=F,
       xlab="Grid points", lwd=3)
  axis(1, at=c(1,seq(20, 100, by=20)),
       labels=round(grids[c(1,seq(20, 100, by=20))],3))
  axis(2)
  abline(v=which.max(obj$prob_per_cell_by_celltimes[cell_ind,]),
         col="darkblue", lty=1, lwd=3)
  abline(v=which.min(circ_dist(grids, obj$ref_time[cell_ind])),
         col="red", lty=1, lwd=3)
  title(paste(round(obj$diff_time[cell_ind]/2/pi,2)))
}
dev.off()
Session information
sessionInfo()R version 3.4.3 (2017-11-30)
Platform: x86_64-pc-linux-gnu (64-bit)
Running under: Scientific Linux 7.4 (Nitrogen)
Matrix products: default
BLAS/LAPACK: /software/openblas-0.2.19-el7-x86_64/lib/libopenblas_haswellp-r0.2.19.so
locale:
[1] LC_CTYPE=en_US.UTF-8 LC_NUMERIC=C
[3] LC_TIME=en_US.UTF-8 LC_COLLATE=en_US.UTF-8
[5] LC_MONETARY=en_US.UTF-8 LC_MESSAGES=en_US.UTF-8
[7] LC_PAPER=en_US.UTF-8 LC_NAME=C
[9] LC_ADDRESS=C LC_TELEPHONE=C
[11] LC_MEASUREMENT=en_US.UTF-8 LC_IDENTIFICATION=C
attached base packages:
[1] stats graphics grDevices utils datasets methods base
other attached packages:
[1] movMF_0.2-2 ggplot2_2.2.1
loaded via a namespace (and not attached):
[1] Rcpp_0.12.17 knitr_1.20 magrittr_1.5 munsell_0.4.3
[5] colorspace_1.3-2 rlang_0.1.6 stringr_1.2.0 plyr_1.8.4
[9] tools_3.4.3 grid_3.4.3 gtable_0.2.0 git2r_0.21.0
[13] htmltools_0.3.6 yaml_2.1.16 lazyeval_0.2.1 rprojroot_1.3-2
[17] digest_0.6.15 tibble_1.4.2 slam_0.1-42 evaluate_0.10.1
[21] rmarkdown_1.10 labeling_0.3 stringi_1.1.6 compiler_3.4.3
[25] pillar_1.1.0 scales_0.5.0 backports_1.1.2 This R Markdown site was created with workflowr