Finalizing the classifer results
Joyce Hsiao
Last updated: 2018-07-12
Code version: a6b5299
Pipeline
Split data to validation samples and training samples.
- The split samples are saved as
data/withheld.rdsanddata/training.rds.
- The code used to generated teh split samples is saved in
code/working/makedata_supervised.R.
- The split samples are saved as
In the training sample, repeat the following 5 times. Each time, take 4/5 of the samples, fit trendfilter and identified the top X cyclical genes, and the compute the prediction error margin as a function of the top X cyclical genes.
code/run_methods.R: runs all methods, including supervised, unsupervised trendfilter, unsupervised bspline, unsupervised lowess, seurat) and compute prediction error margin.
code/working/job_run_methods.train.Rcallscode/run_methods.Rcode/working/job_run_methods.train.sbatchsubmits jobs one fold at a time.
Based on the training sample results, select the top best X genes and fit to the validation sample. Compute and compare the methods’ performance on the validation sample.
Top cyclical genes
Cyclical genes overlaps in the training set
data_training_cyclical_genes.fold.1 <- readRDS("../data/results/data_training_cyclical_genes.fold.1.rds")
data_training_cyclical_genes.fold.2 <- readRDS("../data/results/data_training_cyclical_genes.fold.2.rds")
data_training_cyclical_genes.fold.3 <- readRDS("../data/results/data_training_cyclical_genes.fold.3.rds")
data_training_cyclical_genes.fold.4 <- readRDS("../data/results/data_training_cyclical_genes.fold.4.rds")
data_training_cyclical_genes.fold.5 <- readRDS("../data/results/data_training_cyclical_genes.fold.5.rds")
data_cyclical_list <- list(data_training_cyclical_genes.fold.1,
                           data_training_cyclical_genes.fold.2,
                           data_training_cyclical_genes.fold.3,
                           data_training_cyclical_genes.fold.4,
                           data_training_cyclical_genes.fold.5)


library(gplots)

top100 <- lapply(1:5, function(i) {
  rownames(data_cyclical_list[[i]])[order(data_cyclical_list[[i]]$pve,
                                                      decreasing = T)[1:100]]
})
venn( top100 )

top50 <- lapply(1:5, function(i) {
  rownames(data_cyclical_list[[i]])[order(data_cyclical_list[[i]]$pve,
                                                      decreasing = T)[1:50]]
})
venn( top50)

top10 <- lapply(1:5, function(i) {
  rownames(data_cyclical_list[[i]])[order(data_cyclical_list[[i]]$pve,
                                                      decreasing = T)[1:10]]
})
venn( top10)

top5 <- lapply(1:5, function(i) {
  rownames(data_cyclical_list[[i]])[order(data_cyclical_list[[i]]$pve,
                                                      decreasing = T)[1:5]]
})
venn( top5)


top260 <- lapply(1:5, function(i) {
  rownames(data_cyclical_list[[i]])[order(data_cyclical_list[[i]]$pve,
                                                      decreasing = T)[1:260]]
})
venn(top260)

library(gplots)
ngenes <- c(5, seq(10, nrow(data_cyclical_list[[1]]), 10))
genes_list <- lapply(1:length(ngenes), function(i) {
  ngene <- ngenes[i]
  tmp <- lapply(1:5, function(fold) {
    rownames(data_cyclical_list[[fold]])[order(data_cyclical_list[[fold]]$pve,
                                                        decreasing = T)[1:ngene]]
  })
  parts <- venn(tmp, show.plot = F)
  unlist(attr(parts, "intersections")$`A:B:C:D:E`)
})
names(genes_list) <- ngenes

saveRDS(genes_list,
        file = "../data/results/results_topgenes.rds")
Given permuted labels, Cyclical genes overlaps in the training set
data_training_cyclical_genes.fold.1 <- readRDS("../data/results/data_training_cyclical_genes_permute.fold.1.rds")
data_training_cyclical_genes.fold.2 <- readRDS("../data/results/data_training_cyclical_genes_permute.fold.2.rds")
data_training_cyclical_genes.fold.3 <- readRDS("../data/results/data_training_cyclical_genes_permute.fold.3.rds")
data_training_cyclical_genes.fold.4 <- readRDS("../data/results/data_training_cyclical_genes_permute.fold.4.rds")
data_training_cyclical_genes.fold.5 <- readRDS("../data/results/data_training_cyclical_genes_permute.fold.5.rds")
data_cyclical_list <- list(data_training_cyclical_genes.fold.1,
                           data_training_cyclical_genes.fold.2,
                           data_training_cyclical_genes.fold.3,
                           data_training_cyclical_genes.fold.4,
                           data_training_cyclical_genes.fold.5)

library(gplots)

top100 <- lapply(1:5, function(i) {
  rownames(data_cyclical_list[[i]])[order(data_cyclical_list[[i]]$pve,
                                                      decreasing = T)[1:100]]
})
venn( top100 )

top50 <- lapply(1:5, function(i) {
  rownames(data_cyclical_list[[i]])[order(data_cyclical_list[[i]]$pve,
                                                      decreasing = T)[1:50]]
})
venn( top50)

top10 <- lapply(1:5, function(i) {
  rownames(data_cyclical_list[[i]])[order(data_cyclical_list[[i]]$pve,
                                                      decreasing = T)[1:10]]
})
venn( top10)

top5 <- lapply(1:5, function(i) {
  rownames(data_cyclical_list[[i]])[order(data_cyclical_list[[i]]$pve,
                                                      decreasing = T)[1:5]]
})
venn( top5)

library(gplots)
ngenes <- c(5, seq(10, nrow(data_cyclical_list[[1]]), 10))
genes_list <- lapply(1:length(ngenes), function(i) {
  ngene <- ngenes[i]
  tmp <- lapply(1:5, function(fold) {
    rownames(data_cyclical_list[[fold]])[order(data_cyclical_list[[fold]]$pve,
                                                        decreasing = T)[1:ngene]]
  })
  parts <- venn(tmp, show.plot = F)
  unlist(attr(parts, "intersections")$`A:B:C:D:E`)
})
names(genes_list) <- ngenes

#sapply(genes_list, function(x) length(x))
saveRDS(genes_list,
        file = "../data/results/results_topgenes_permute.rds")
Intersetions across training sets
genes_list <- readRDS(file = "../data/results/results_topgenes.rds")
genes_list_permute <- readRDS(file = "../data/results/results_topgenes_permute.rds")
ngenes <- as.numeric(names(genes_list))
plot(x=ngenes[1:41],
y=sapply(genes_list, function(x) length(x))[1:41],
xlab="Top X cyclical genes in training set",
ylab="Number of shared cyclical genes",
main = "Shared cyclical genes across the five training sets",
xlim=c(0,410), pch=16, cex=.7, col="gray50")
abline(v=260, col="gray50")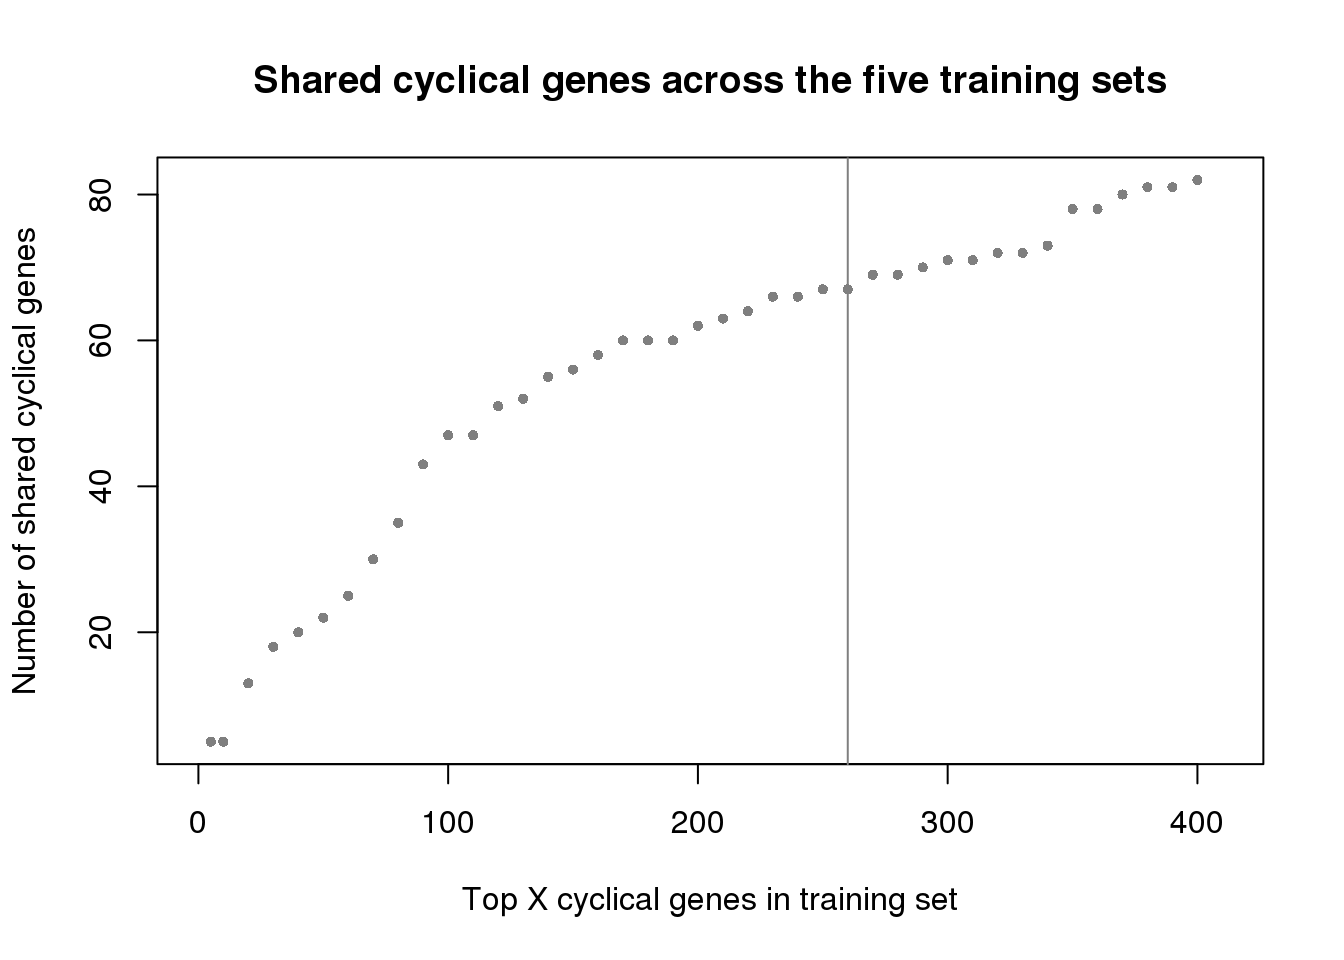
ngenes <- as.numeric(names(genes_list))
plot(x=ngenes,
     y=sapply(genes_list, function(x) length(x)),
     xlab="Top X cyclical genes in training set",
     ylab="Number of shared cyclical genes",
     main = "Shared cyclical genes across the five training sets",
     xlim=c(0,11100), pch=16, cex=.7, col="gray50")
points(x=ngenes,
       y=sapply(genes_list_permute, function(x) length(x)),
       pch=16, cex=.7, col="blue")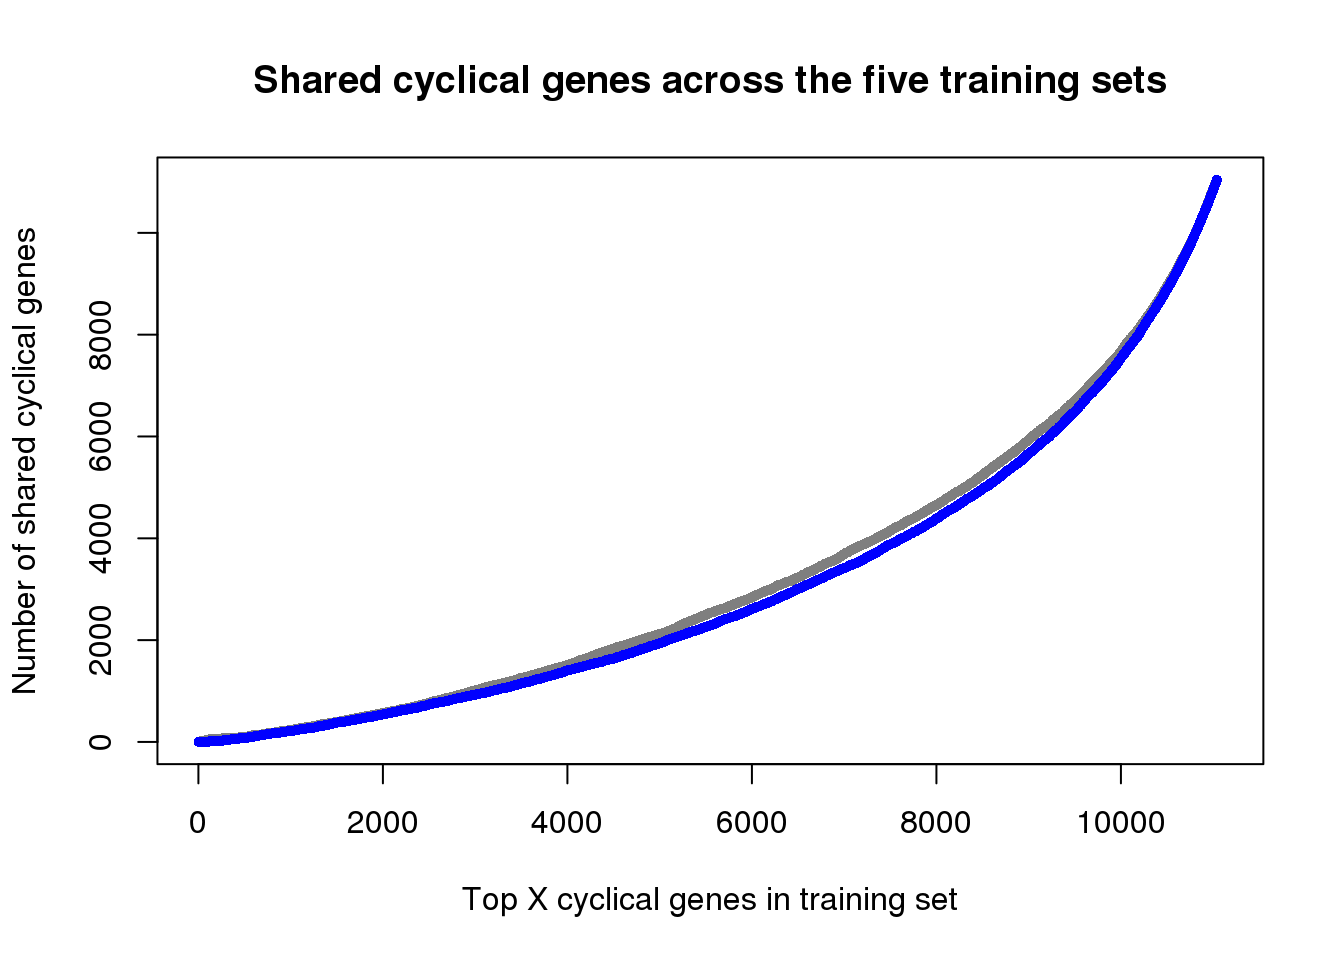
# ngenes <- as.numeric(names(genes_list))
# plot(x=ngenes,
#      y=sapply(genes_list, function(x) length(x)),
#      xlab="Top X cyclical genes in training set",
#      ylab="Number of shared cyclical genes",
#      main = "Shared cyclical genes in top 1000",
#      xlim=c(0,1000), pch=16, cex=.7, col="gray50", ylim=c(1,250))
# points(x=ngenes,
#        y=sapply(genes_list_permute, function(x) length(x)),
#        pch=16, cex=.7, col="blue")


ngenes <- as.numeric(names(genes_list))
plot(x=ngenes,
     y=sapply(genes_list, function(x) length(x)),
     xlab="Top X cyclical genes in training set",
     ylab="Number of shared cyclical genes",
     main = "Shared genes in top 400 cyclical",
     xlim=c(0,400), pch=16, cex=.7, col="gray50", ylim=c(1,110))
points(x=ngenes,
       y=sapply(genes_list_permute, function(x) length(x)),
       pch=16, cex=.7, col="blue")
abline(v=260, col="gray50")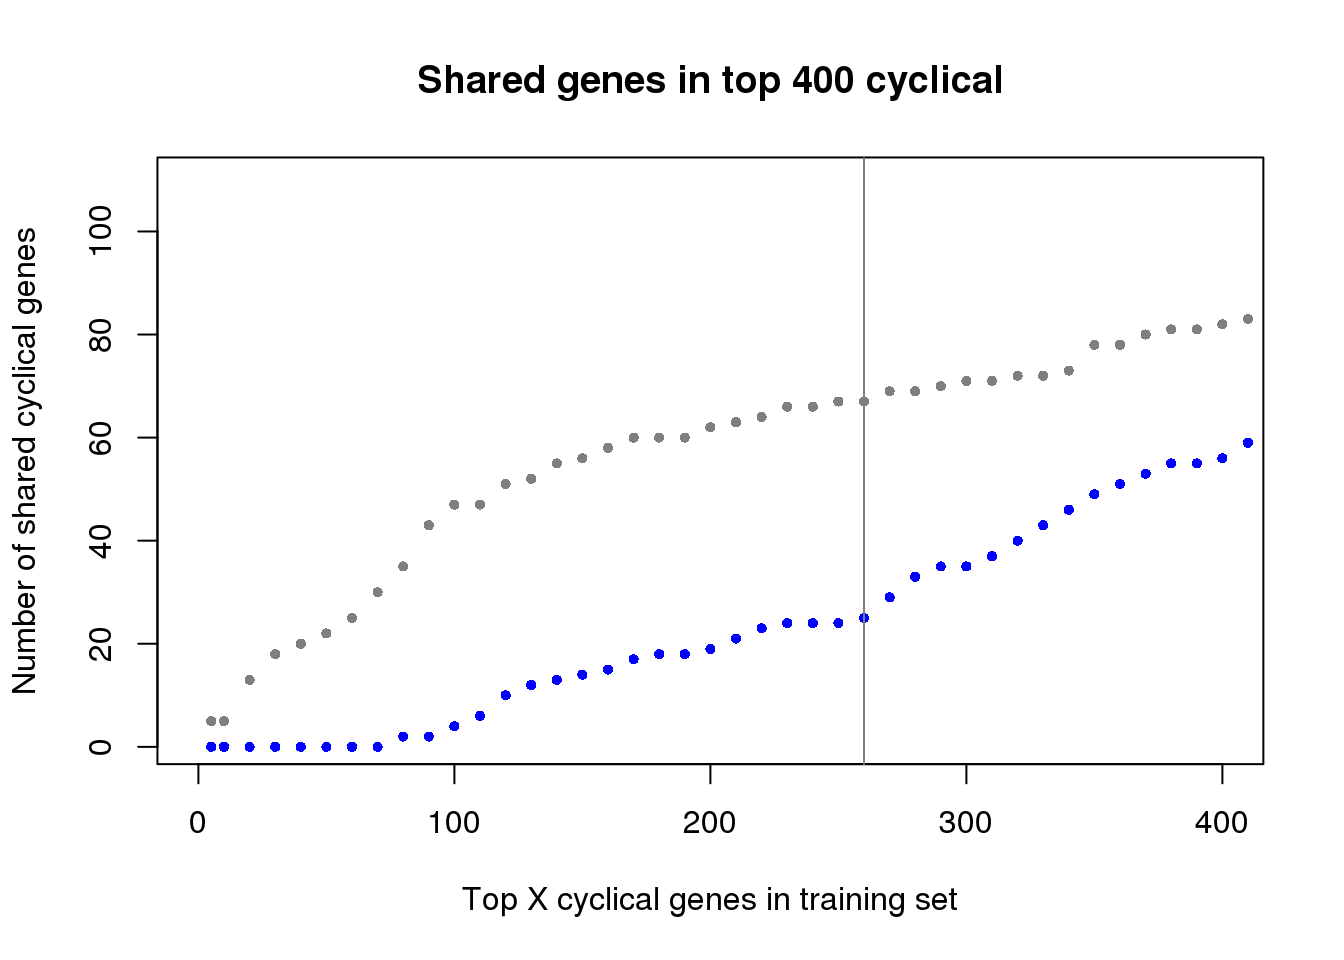
fdr <- sapply(1:length(genes_list), function(i) {
  a <- unlist(genes_list[i])
  b <- unlist(genes_list_permute[i])
  ll <- length(intersect(b,a))
  ll/length(a)
})
names(fdr) <- names(genes_list)

saveRDS(fdr, file = "../output/method-train-classifiers-all.Rmd/fdr.rds")
fdr <- readRDS(file = "../output/method-train-classifiers-all.Rmd/fdr.rds")
plot(as.numeric(names(fdr)), fdr,
xlab="Top X cyclical genes",
ylab="Fraction of permuted in observed",
main="False discovery rate (fraction of permuted in observed",
pch=16, cex=.7)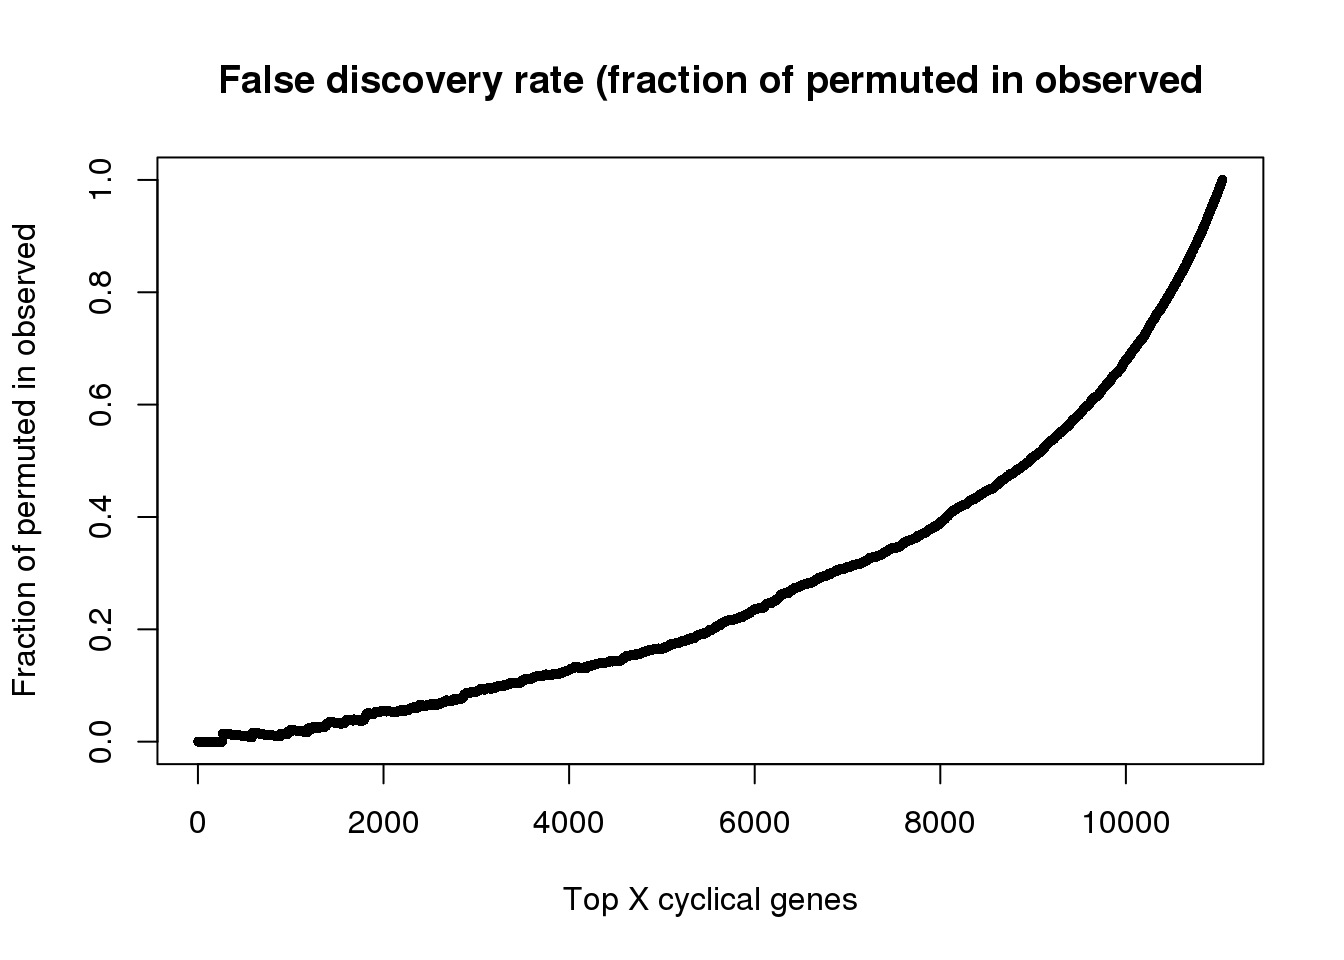
plot(as.numeric(names(fdr))[1:1000], fdr[1:1000],
     xlab="Top X cyclical genes",
     ylab="Fraction of permuted in observed",
     main="False discovery rate in top 1000",
     pch=16, cex=.7,
     xlim=c(1,1000), ylim=c(0,.05))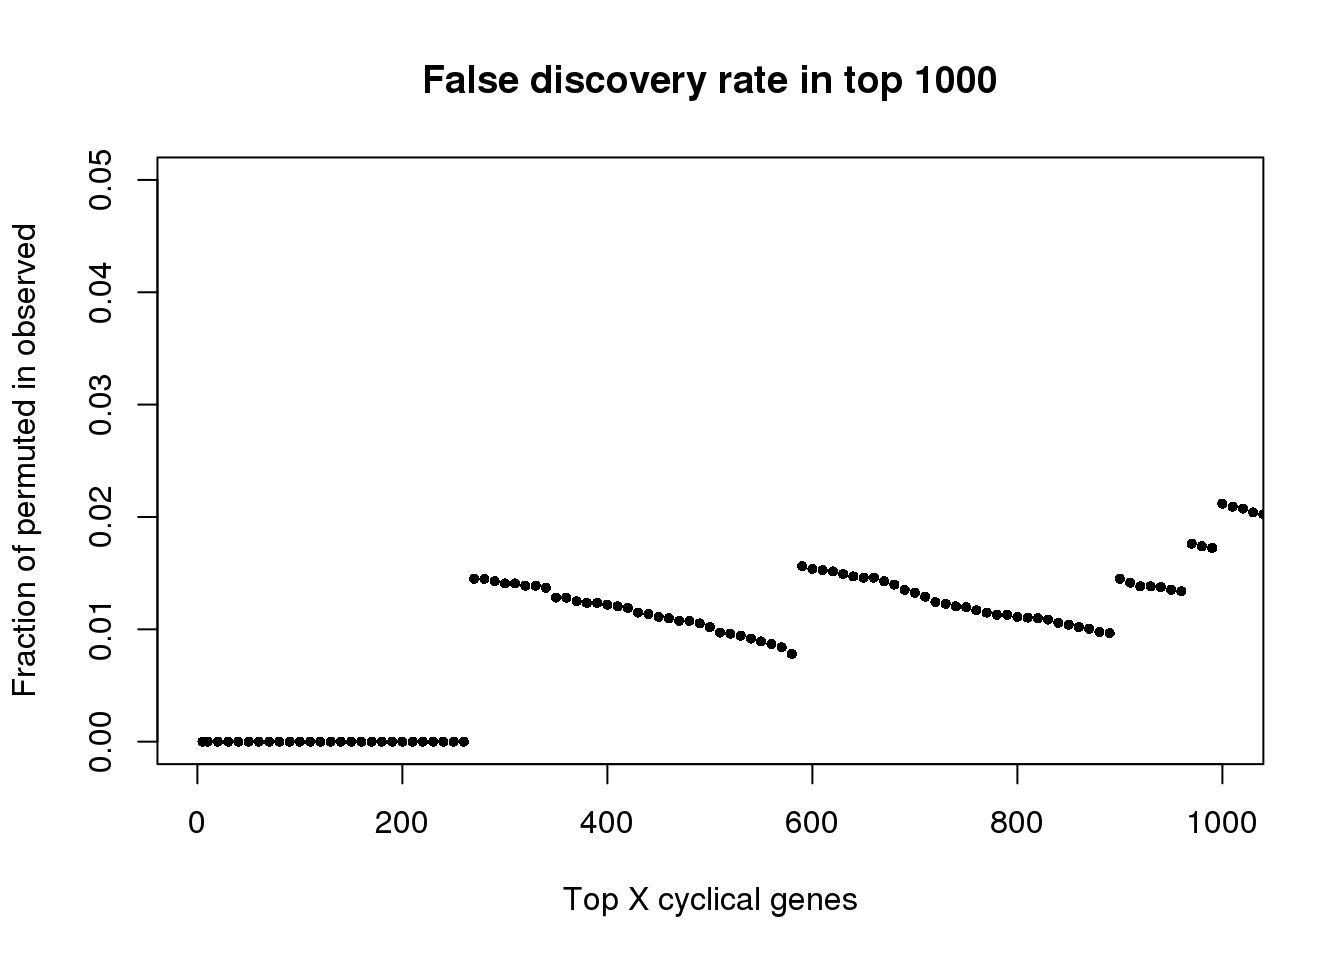
plot(as.numeric(names(fdr))[1:400], fdr[1:400],
     xlab="Top X cyclical genes",
     ylab="Fraction of permuted in observed",
     main="False discovery rate in top 400",
     pch=16, cex=.7,
     xlim=c(1,400), ylim=c(0,.06))
abline(v=260, col="gray50")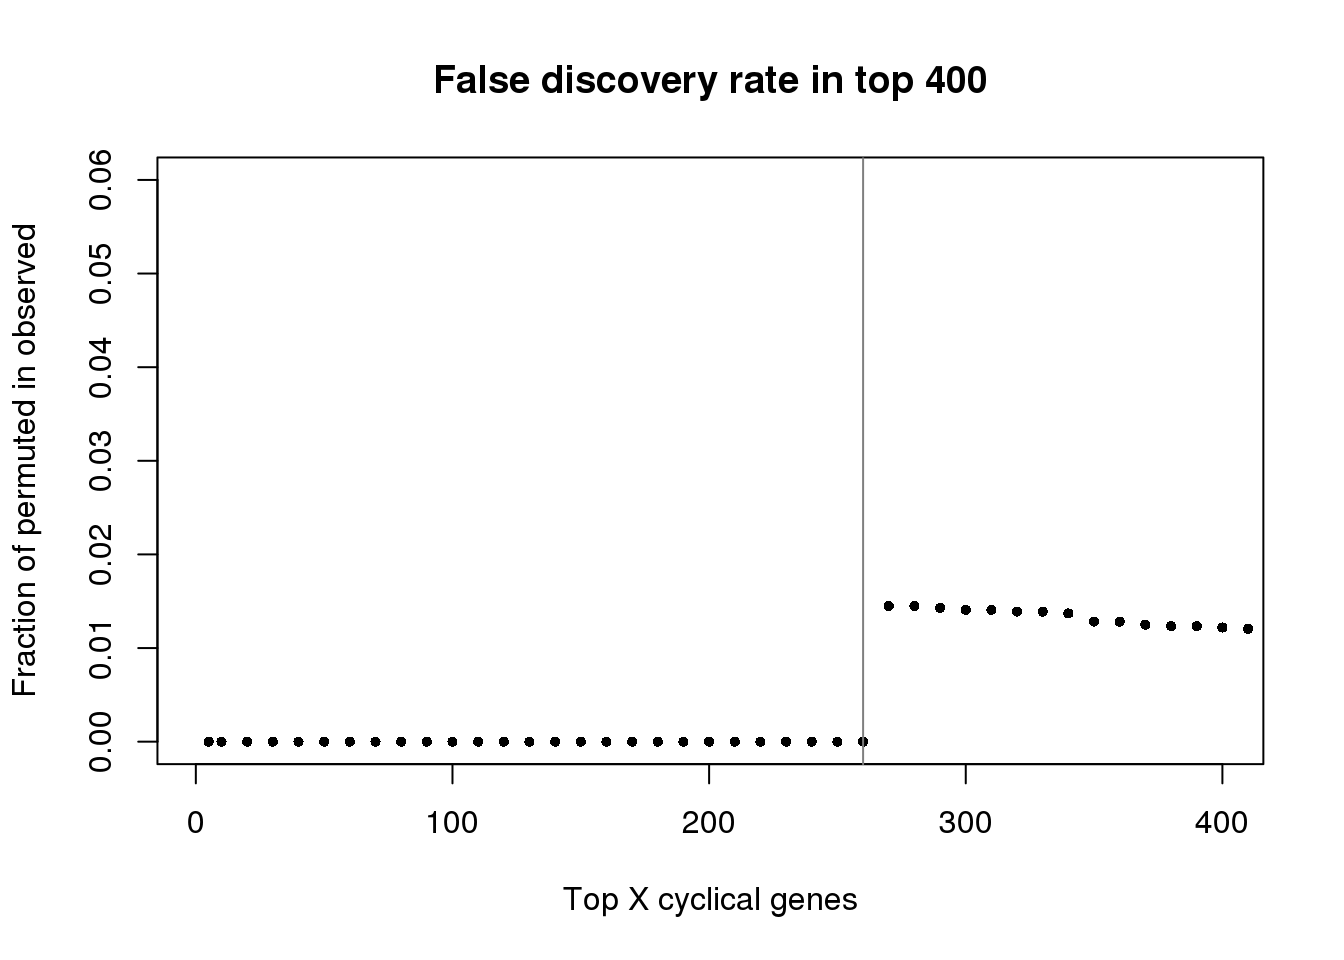
Prediction error by top X cyclical genes
code for summarize results
diff_time_wrapper <- function(results_list) {

  methods_list <- sapply(names(results_list),
                         function(x) strsplit(x, split=".", fixed=TRUE)[[1]][2])

  diff_time_list <- do.call(rbind, lapply(1:length(results_list), function(i) {
    diff_time <- results_list[[i]]$diff_time
    diff_mean <- mean(diff_time/2/pi)
#    diff_se <- sd(diff_time/2/pi)/sqrt(ncol(results_list[[1]]$Y))

    return(data.frame(diff_mean=diff_mean,
#                      diff_se=diff_se,
                      methods=methods_list[i]))
  }) )
  return(diff_time_list)
}
summarize results
# ngenes <- c(5, seq(10,400, by=10))
# train_top <- lapply(1:length(ngenes), function(i) {
#   ngene <- ngenes[i]
#   train_topX <- unlist(lapply(1:5, function(fold) {
#     fl_name <- list.files("../data/results",
#                    pattern=paste0("results_train.fold.",fold,".top",ngene,".rds"),
#                    full.names = TRUE)
#     return(fl_name)
#   }) )
#   return(train_topX)
# })

ngenes <- c(5, seq(10,400, by=10))
train_top <- do.call(rbind, lapply(1:length(ngenes), function(i) {
  ngene <- ngenes[i]
  train_topX <- do.call(rbind, lapply(1:5, function(fold) {
    fl_name <- paste0("../data/results/results_train.fold.",fold,".top",ngene,".rds")
    df <- readRDS(fl_name)
    out <- diff_time_wrapper(df$fit.test)
    out$fold <- fold
    return(out)
  }) )
  train_topX$ngenes <- ngene
  #return(train_topX)
  agg_mn <- aggregate(diff_mean ~ methods,
                    data=train_topX, FUN=mean)
  agg_sd <- aggregate(diff_mean ~ methods,
                    data=train_topX, FUN=sd)

  obj <- data.frame(methods=agg_mn$methods,
                    diff_mean=agg_mn$diff_mean,
                    diff_se=agg_sd$diff_mean/sqrt(5))
  obj$ngenes <- ngene
  return(obj)
}) )

saveRDS(train_top, file = "../output/method-train-classifiers-all.Rmd/diff_time_all.rds")


ngenes <- c(5, seq(10,200, by=10))
train_top_permute <- do.call(rbind, lapply(1:length(ngenes), function(i) {
  ngene <- ngenes[i]
  train_topX <- do.call(rbind, lapply(1:5, function(fold) {
    fl_name <- paste0("../data/results/results_train_permute.fold.",
                      fold,".top",ngene,".rds")
    df <- readRDS(fl_name)
    out <- diff_time_wrapper(df$fit.test)
    out$fold <- fold
    return(out)
  }) )
  train_topX$ngenes <- ngene
  #return(train_topX)
  agg_mn <- aggregate(diff_mean ~ methods,
                    data=train_topX, FUN=mean)
  agg_sd <- aggregate(diff_mean ~ methods,
                    data=train_topX, FUN=sd)

  obj <- data.frame(methods=agg_mn$methods,
                    diff_mean=agg_mn$diff_mean,
                    diff_se=agg_sd$diff_mean/sqrt(5))
  obj$ngenes <- ngene
  return(obj)
}) )

saveRDS(train_top_permute,
        file = "../output/method-train-classifiers-all.Rmd/diff_time_all_permute.rds")


ngenes <- c(5, seq(10,200, by=10))
train_top_permute <- do.call(rbind, lapply(1:length(ngenes), function(i) {
  ngene <- ngenes[i]
  train_topX <- do.call(rbind, lapply(1:5, function(fold) {
    fl_name <- paste0("../data/results/results_train_permute_onrandom.fold.",
                      fold,".top",ngene,".rds")
    df <- readRDS(fl_name)
    out <- diff_time_wrapper(df$fit.test)
    out$fold <- fold
    return(out)
  }) )
  train_topX$ngenes <- ngene
  #return(train_topX)
  agg_mn <- aggregate(diff_mean ~ methods,
                    data=train_topX, FUN=mean)
  agg_sd <- aggregate(diff_mean ~ methods,
                    data=train_topX, FUN=sd)

  obj <- data.frame(methods=agg_mn$methods,
                    diff_mean=agg_mn$diff_mean,
                    diff_se=agg_sd$diff_mean/sqrt(5))
  obj$ngenes <- ngene
  return(obj)
}) )

saveRDS(train_top_permute,
        file = "../output/method-train-classifiers-all.Rmd/diff_time_rando_on_fucci.rds")


ngenes <- c(5, seq(10,200, by=10))
train_top_permute <- do.call(rbind, lapply(1:length(ngenes), function(i) {
  ngene <- ngenes[i]
  train_topX <- do.call(rbind, lapply(1:5, function(fold) {
    fl_name <- paste0("../data/results/results_train_permute_oncyclical.fold.",
                      fold,".top",ngene,".rds")
    df <- readRDS(fl_name)
    out <- diff_time_wrapper(df$fit.test)
    out$fold <- fold
    return(out)
  }) )
  train_topX$ngenes <- ngene
  #return(train_topX)
  agg_mn <- aggregate(diff_mean ~ methods,
                    data=train_topX, FUN=mean)
  agg_sd <- aggregate(diff_mean ~ methods,
                    data=train_topX, FUN=sd)

  obj <- data.frame(methods=agg_mn$methods,
                    diff_mean=agg_mn$diff_mean,
                    diff_se=agg_sd$diff_mean/sqrt(5))
  obj$ngenes <- ngene
  return(obj)
}) )

saveRDS(train_top_permute,
        file = "../output/method-train-classifiers-all.Rmd/diff_time_fucci_on_rando.rds")
fucci time labels
train_top <- readRDS("../output/method-train-classifiers-all.Rmd/diff_time_all.rds")

library(ggplot2)

ggplot(train_top,
       aes(x=ngenes, y=diff_mean, color=methods)) +
  geom_errorbar(subset(train_top, methods == "supervised"),
                mapping=aes(ymin=diff_mean-diff_se, ymax=diff_mean+diff_se)) +
  geom_point() + geom_line(lty=3) +
  ylab("Error margin (% arc length)") + xlab("Top X cyclical genes") +
  ggtitle("Prediction error in the training set")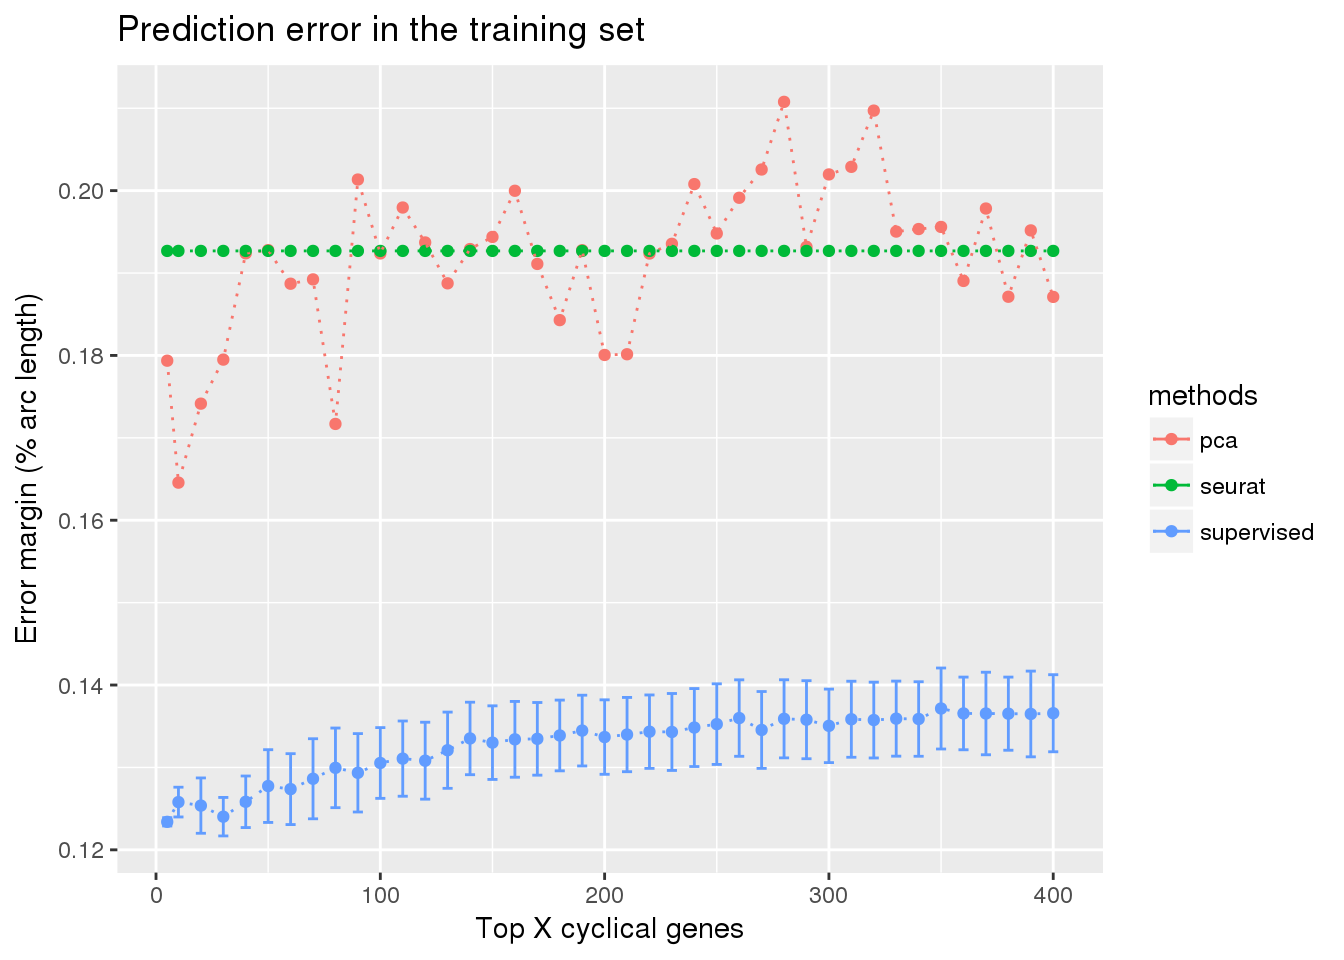
ggplot(subset(train_top, methods == "supervised"),
       aes(x=ngenes, y=diff_mean)) +
  geom_errorbar(subset(train_top, methods == "supervised"),
                mapping=aes(ymin=diff_mean-diff_se, ymax=diff_mean+diff_se),
                color="blue") +
  geom_point() + geom_line(lty=3) +
  ylab("Error margin (% arc length)") + xlab("Top X cyclical genes") +
  ggtitle("Prediction error in the training set")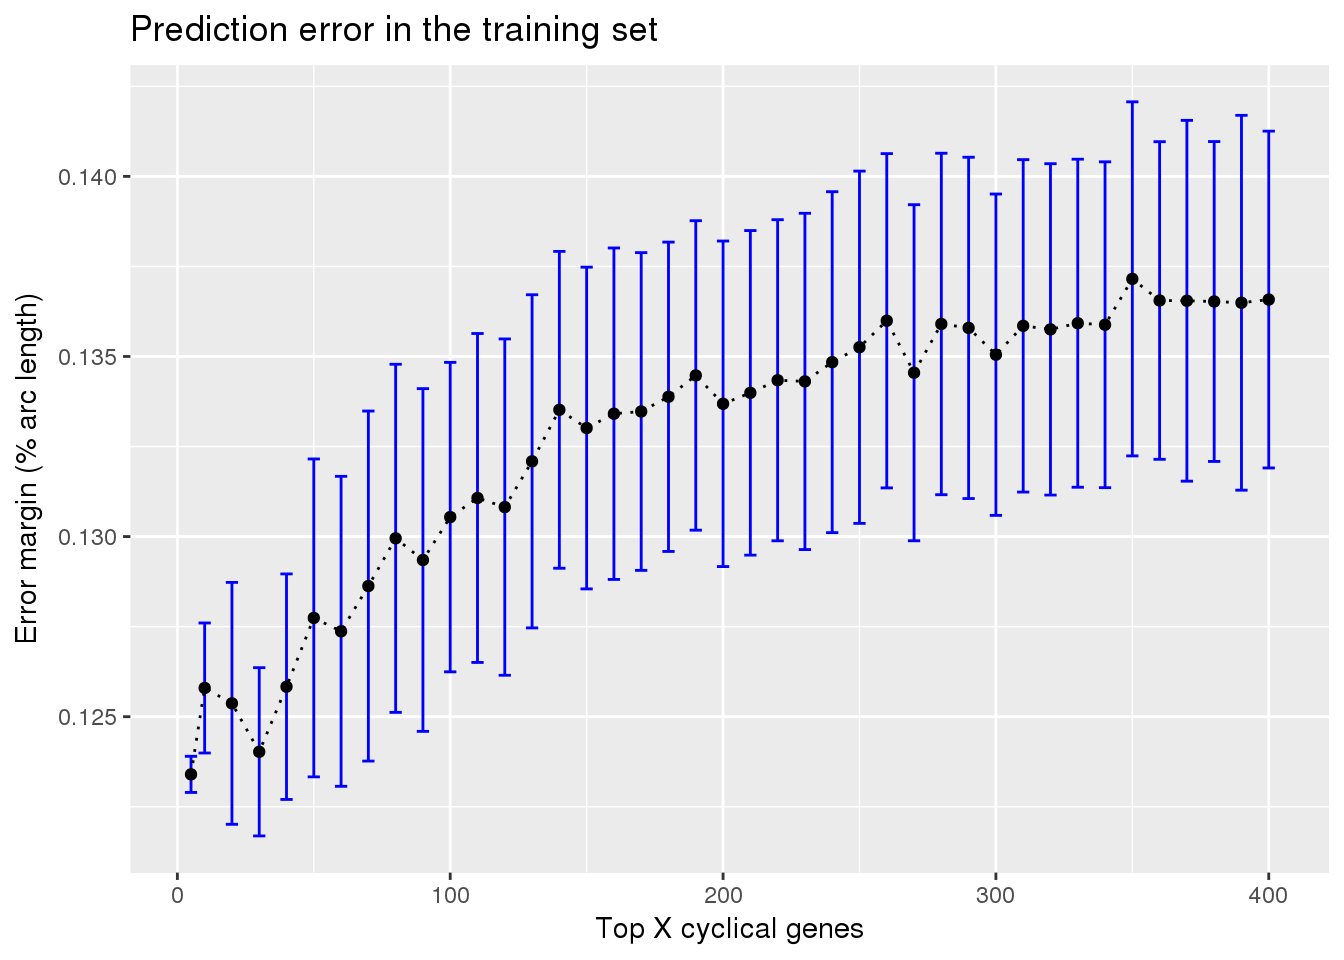
Check between 5 genes and 100 genes
#ngenes <- c(5, seq(10,400, by=10))
ngenes <- c(5, 10, 20, 100)
train_top <- lapply(1:length(ngenes), function(i) {
  ngene <- ngenes[i]
  train_topX <- do.call(rbind, lapply(1:5, function(fold) {
    fl_name <- paste0("../data/results/results_train.fold.",fold,".top",ngene,".rds")
    df <- readRDS(fl_name)
    out <- diff_time_wrapper(df$fit.test)
    out$fold <- fold
    return(out)
    }) )
  train_topX$ngenes <- ngene
  return(data.frame(train_topX))
})

tmp <- do.call(cbind, train_top)
tmp <- tmp[tmp$methods== "supervised",]
tmp <- tmp[,c(3,1,5, 9, 13)]
colnames(tmp) <- c("fold", paste0("top",c(5, 10, 20, 100)))
random cyclical on random time
train_top_permute <- readRDS("../output/method-train-classifiers-all.Rmd/diff_time_all_permute.rds")

library(ggplot2)

ggplot(train_top_permute,
       aes(x=ngenes, y=diff_mean, color=methods)) +
  geom_errorbar(subset(train_top_permute, methods == "supervised"),
                mapping=aes(ymin=diff_mean-diff_se, ymax=diff_mean+diff_se)) +
  geom_point() + geom_line(lty=3) +
  ylab("Error margin (% arc length)") + xlab("Top X cyclical genes") +
  ggtitle("Prediction error in the training set")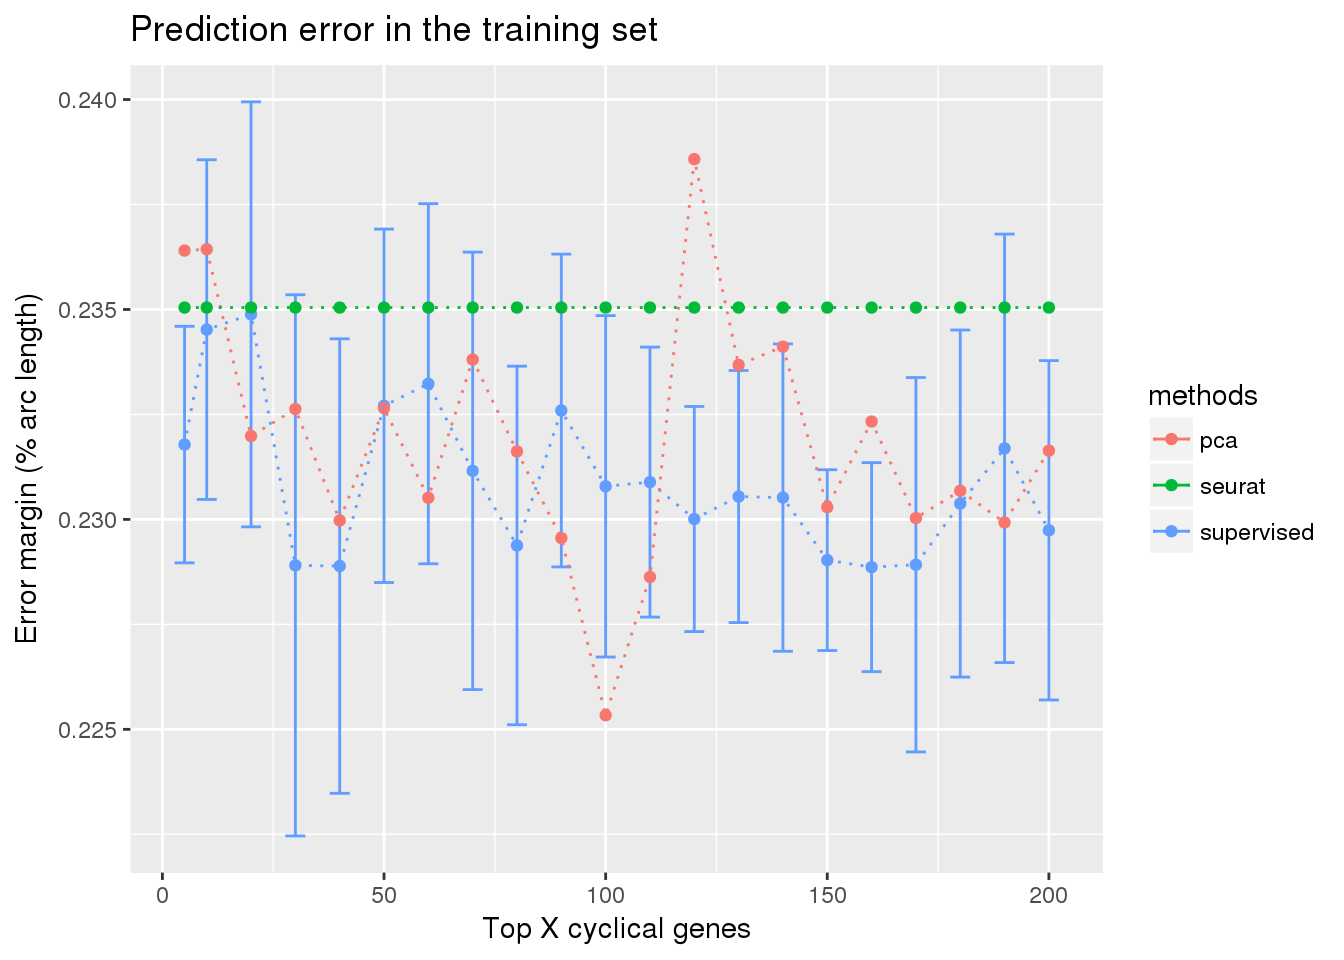
ggplot(subset(train_top_permute, methods == "supervised"),
       aes(x=ngenes, y=diff_mean)) +
  geom_errorbar(subset(train_top_permute, methods == "supervised"),
                mapping=aes(ymin=diff_mean-diff_se, ymax=diff_mean+diff_se),
                color="blue") +
  geom_point() + geom_line(lty=3) +
  ylab("Error margin (% arc length)") + xlab("Top X cyclical genes") +
  ggtitle("Prediction error in the training set")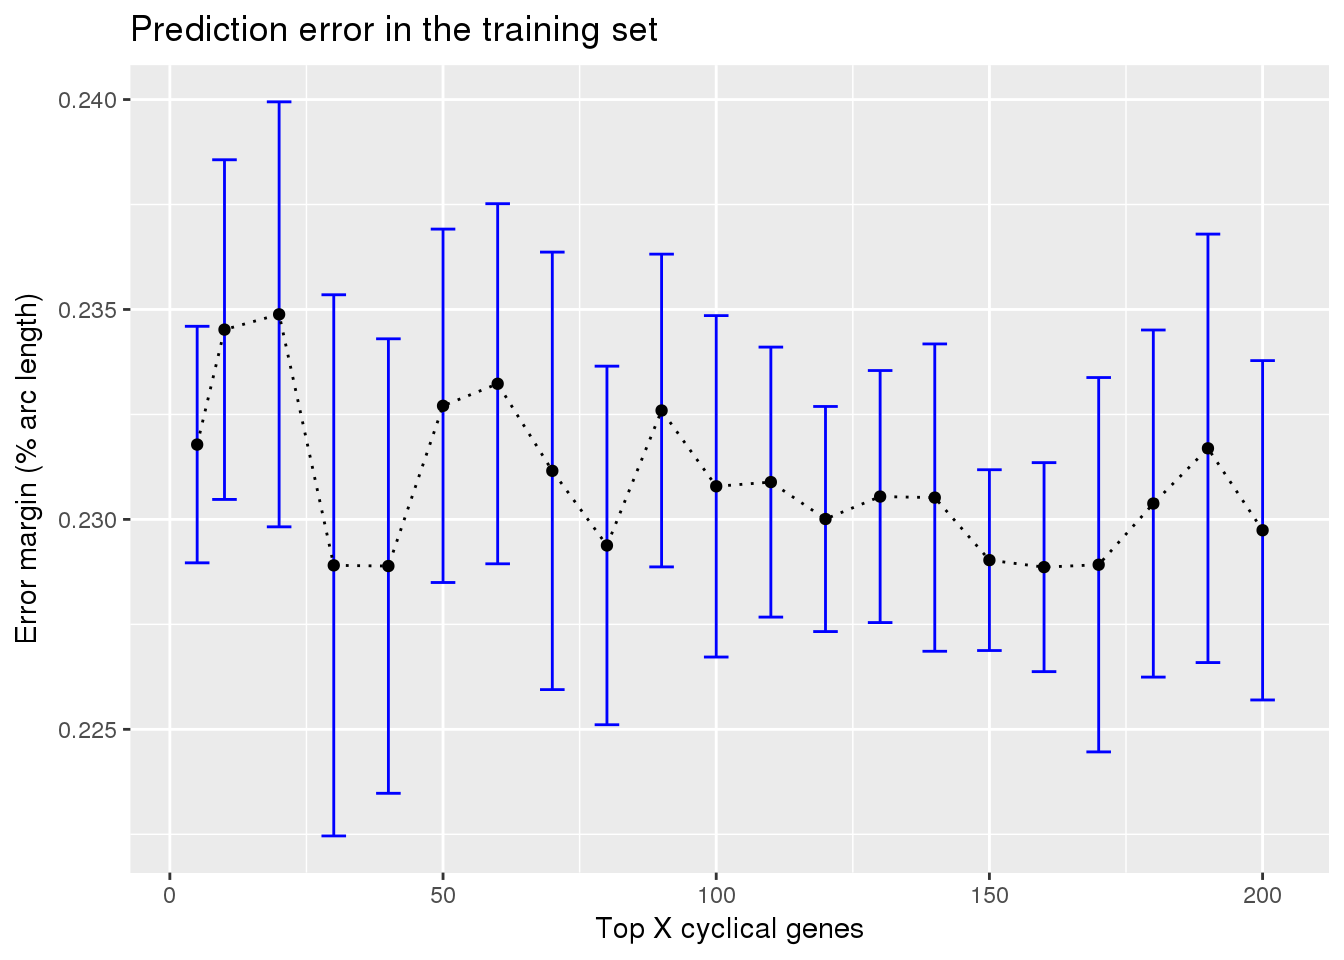
random cyclical on fucci time
train_rando_on_fucci <- readRDS("../output/method-train-classifiers-all.Rmd/diff_time_rando_on_fucci.rds")

library(ggplot2)

ggplot(subset(train_rando_on_fucci, methods == "supervised"),
       aes(x=ngenes, y=diff_mean)) +
  geom_errorbar(subset(train_rando_on_fucci, methods == "supervised"),
                mapping=aes(ymin=diff_mean-diff_se, ymax=diff_mean+diff_se),
                color="blue") +
  geom_point() + geom_line(lty=3) +
  ylab("Error margin (% arc length)") + xlab("Top X cyclical genes") +
  ggtitle("Random cyclical genes predicting fucci times")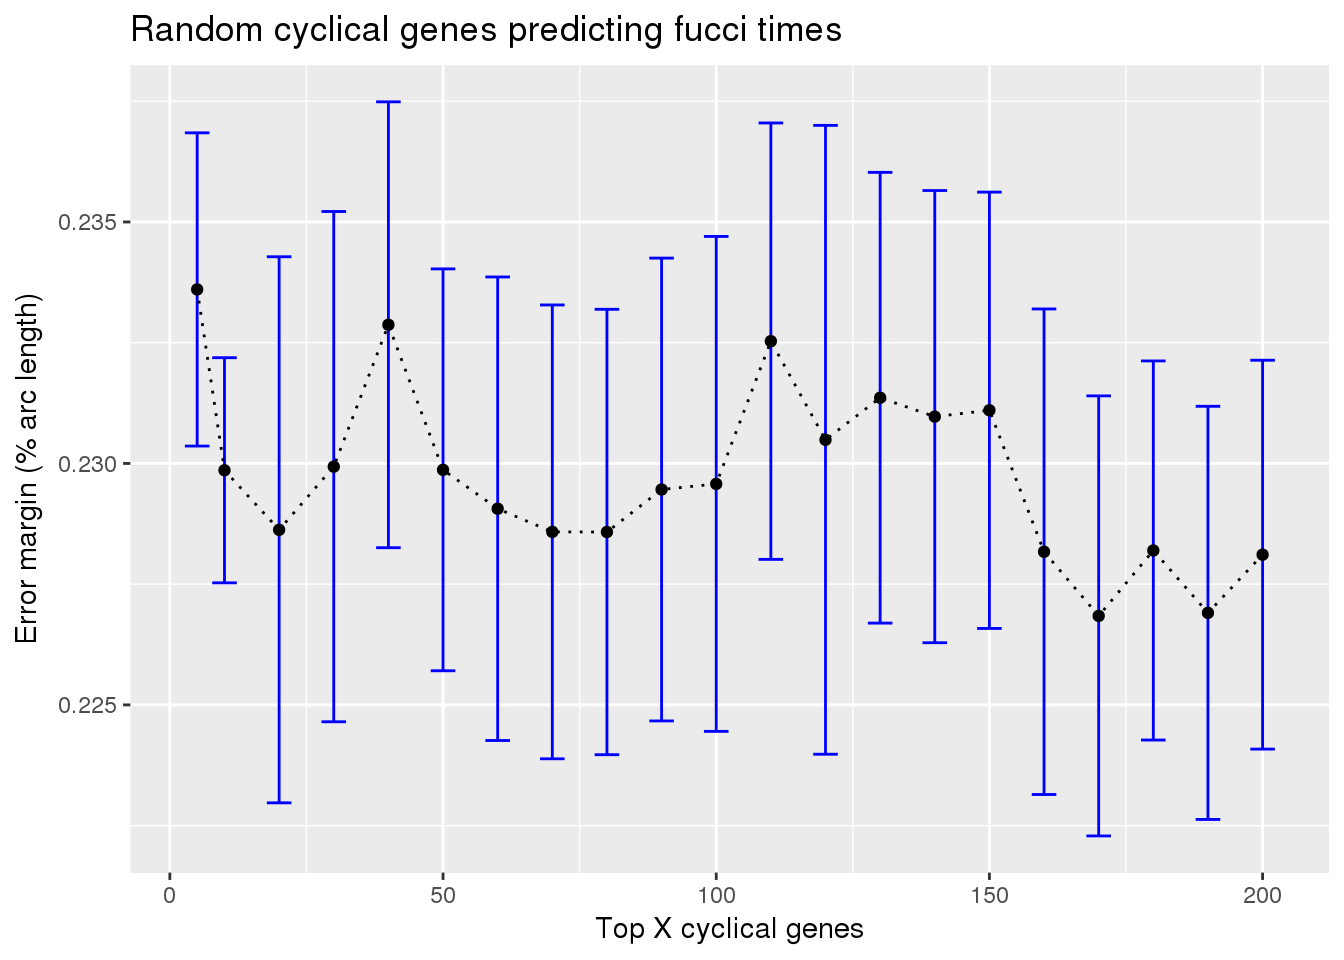
fucci on random cyclical
train_fucci_on_rando <- readRDS("../output/method-train-classifiers-all.Rmd/diff_time_fucci_on_rando.rds")

ggplot(subset(train_fucci_on_rando, methods == "supervised"),
       aes(x=ngenes, y=diff_mean)) +
  geom_errorbar(subset(train_fucci_on_rando, methods == "supervised"),
                mapping=aes(ymin=diff_mean-diff_se, ymax=diff_mean+diff_se),
                color="blue") +
  geom_point() + geom_line(lty=3) +
  ylab("Error margin (% arc length)") + xlab("Top X cyclical genes") +
  ggtitle("fucci cyclical genes predicting random times")
Session information
sessionInfo()R version 3.4.3 (2017-11-30)
Platform: x86_64-pc-linux-gnu (64-bit)
Running under: Scientific Linux 7.4 (Nitrogen)
Matrix products: default
BLAS/LAPACK: /software/openblas-0.2.19-el7-x86_64/lib/libopenblas_haswellp-r0.2.19.so
locale:
[1] LC_CTYPE=en_US.UTF-8 LC_NUMERIC=C
[3] LC_TIME=en_US.UTF-8 LC_COLLATE=en_US.UTF-8
[5] LC_MONETARY=en_US.UTF-8 LC_MESSAGES=en_US.UTF-8
[7] LC_PAPER=en_US.UTF-8 LC_NAME=C
[9] LC_ADDRESS=C LC_TELEPHONE=C
[11] LC_MEASUREMENT=en_US.UTF-8 LC_IDENTIFICATION=C
attached base packages:
[1] stats graphics grDevices utils datasets methods base
other attached packages:
[1] ggplot2_2.2.1
loaded via a namespace (and not attached):
[1] Rcpp_0.12.17 digest_0.6.15 rprojroot_1.3-2 plyr_1.8.4
[5] grid_3.4.3 gtable_0.2.0 backports_1.1.2 git2r_0.21.0
[9] magrittr_1.5 scales_0.5.0 evaluate_0.10.1 pillar_1.1.0
[13] rlang_0.1.6 stringi_1.1.6 lazyeval_0.2.1 rmarkdown_1.10
[17] labeling_0.3 tools_3.4.3 stringr_1.2.0 munsell_0.4.3
[21] yaml_2.1.16 compiler_3.4.3 colorspace_1.3-2 htmltools_0.3.6
[25] knitr_1.20 tibble_1.4.2 This R Markdown site was created with workflowr