Finalizing the classifer results: cell times based on fucci and dapi
Joyce Hsiao
- Pipeline
- Explore top cyclical genes
- Prediction error by top X cyclical genes
- Results: fucci expression predicting fucci time labels
- Results: fucci experssion patterns predicting random time labels
- Result: combine fucci expression predicting fucci labels with fucci experssion predicting random cell time labels
- Session information
Last updated: 2018-07-16
Code version: 462c268
Pipeline
Split data to validation samples and training samples.
- The split samples are saved as
data/withheld.rdsanddata/training.rds.
- The code used to generated the split samples is saved in
code/working/makedata_supervised.R.
- The split samples are saved as
In the training sample, repeat the following 5 times. Each time, take 4/5 of the samples selected at random, fit trendfilter and identified the top X cyclical genes, and the compute the prediction error margin as a function of the top X cyclical genes.
code/run_methods.R: runs all methods, including supervised, unsupervised trendfilter, unsupervised bspline, unsupervised lowess, seurat) and compute prediction error margin.
code/working/job_run_methods.train.Rcallscode/run_methods.Rcode/working/job_run_methods.train.sbatchsubmits jobs one fold at a time.
Based on the training sample results, select the top best X genes and fit to the validation sample. Compute and compare the methods’ performance on the validation sample.
About the prediction error margin under the null or when predicting random cells, I permuted the cell labels in the training samples. Then, in each training set, I use cyclical gene expression patterns learned from the fucci time to predict the random cell time labels. The margin of error at randomis about 25%, that is, 50% of the half arc length. In our analysis, I found it to be slower lower than 25%; an possible explanation is that before computing the prediction margin, we shift and flip the estimated cell time so that the prediction margin is minimized.
Explore top cyclical genes
Choose across the 5 folds (training sets), the genes that appear among the top X cyclical genes in at least 4 training sets.
data_training_cyclical_genes.fold.1 <- readRDS("../data/results/triple_data_training_cyclical_genes.fold.1.rds")
data_training_cyclical_genes.fold.2 <- readRDS("../data/results/triple_data_training_cyclical_genes.fold.2.rds")
data_training_cyclical_genes.fold.3 <- readRDS("../data/results/triple_data_training_cyclical_genes.fold.3.rds")
data_training_cyclical_genes.fold.4 <- readRDS("../data/results/triple_data_training_cyclical_genes.fold.4.rds")
data_training_cyclical_genes.fold.5 <- readRDS("../data/results/triple_data_training_cyclical_genes.fold.5.rds")
data_cyclical_list <- list(data_training_cyclical_genes.fold.1,
                           data_training_cyclical_genes.fold.2,
                           data_training_cyclical_genes.fold.3,
                           data_training_cyclical_genes.fold.4,
                           data_training_cyclical_genes.fold.5)


library(gplots)
top100 <- lapply(1:5, function(i) {
  rownames(data_cyclical_list[[i]])[order(data_cyclical_list[[i]]$pve,
                                                      decreasing = T)[1:100]]
})
venn( top100 )

top100_list <- do.call(cbind, lapply(1:5, function(i) {
  top_list <- rownames(data_cyclical_list[[i]])[order(data_cyclical_list[[i]]$pve,
                                                      decreasing = T)[1:100]]
  rownames(data_cyclical_list[[i]]) %in% top_list
}) )
rownames(top100_list) <- rownames(data_cyclical_list[[1]])
which_100 <- rownames(top100_list)[which(rowSums(top100_list)>=4)]


library(gplots)
ngenes <- c(5, seq(10, nrow(data_cyclical_list[[1]]), 10))
genes_list <- lapply(1:length(ngenes), function(i) {
  ngene <- ngenes[i]
  tmp <- do.call(cbind, lapply(1:5, function(fold) {
    top_list <- rownames(data_cyclical_list[[fold]])[order(data_cyclical_list[[fold]]$pve,
                                                        decreasing = T)[1:ngene]]
    rownames(data_cyclical_list[[fold]]) %in% top_list
  }) )
  rownames(tmp) <- rownames(data_cyclical_list[[fold]])
  return(rownames(tmp)[rowSums(tmp)>=4])
})
names(genes_list) <- ngenes

saveRDS(genes_list,
        file = "../data/results/triple_results_topgenes.rds")
genes_list <- readRDS(file = "../data/results/triple_results_topgenes.rds")
par(mfrow=c(1,2))
plot(names(genes_list)[1:40],
sapply(genes_list, length)[1:40],
main = "Number of genes selected at each cutoff (<=400)",
xlab = "Top X cyclical genes",
ylab = "Number of genes selected (appear in 4 or more training sets)")
plot(names(genes_list)[1:10],
sapply(genes_list, length)[1:10],
main = "Number of genes selected at each cutoff (<=90)",
xlab = "Top X cyclical genes",
ylab = "Number of genes selected (appear in 4 or more training sets)")
Intersetions across training sets
genes_list <- readRDS(file = "../data/results/triple_results_topgenes.rds")par(mfrow=c(1,2))
ngenes <- as.numeric(names(genes_list))
plot(x=ngenes,
y=sapply(genes_list, length),
xlab="Top X cyclical genes in training set",
ylab="Number of selected genes",
main = "Genes selected from top 400 cyclical",
xlim=c(0,400), pch=16, cex=.7, col="gray50", ylim=c(1,110))
ngenes <- as.numeric(names(genes_list))
plot(x=ngenes,
y=sapply(genes_list, length),
xlab="Top X cyclical genes in training set",
ylab="Number of selected genes",
main = "Genes selected from top 100 cyclical",
xlim=c(0,100), pch=16, cex=.7, col="gray50", ylim=c(1,60))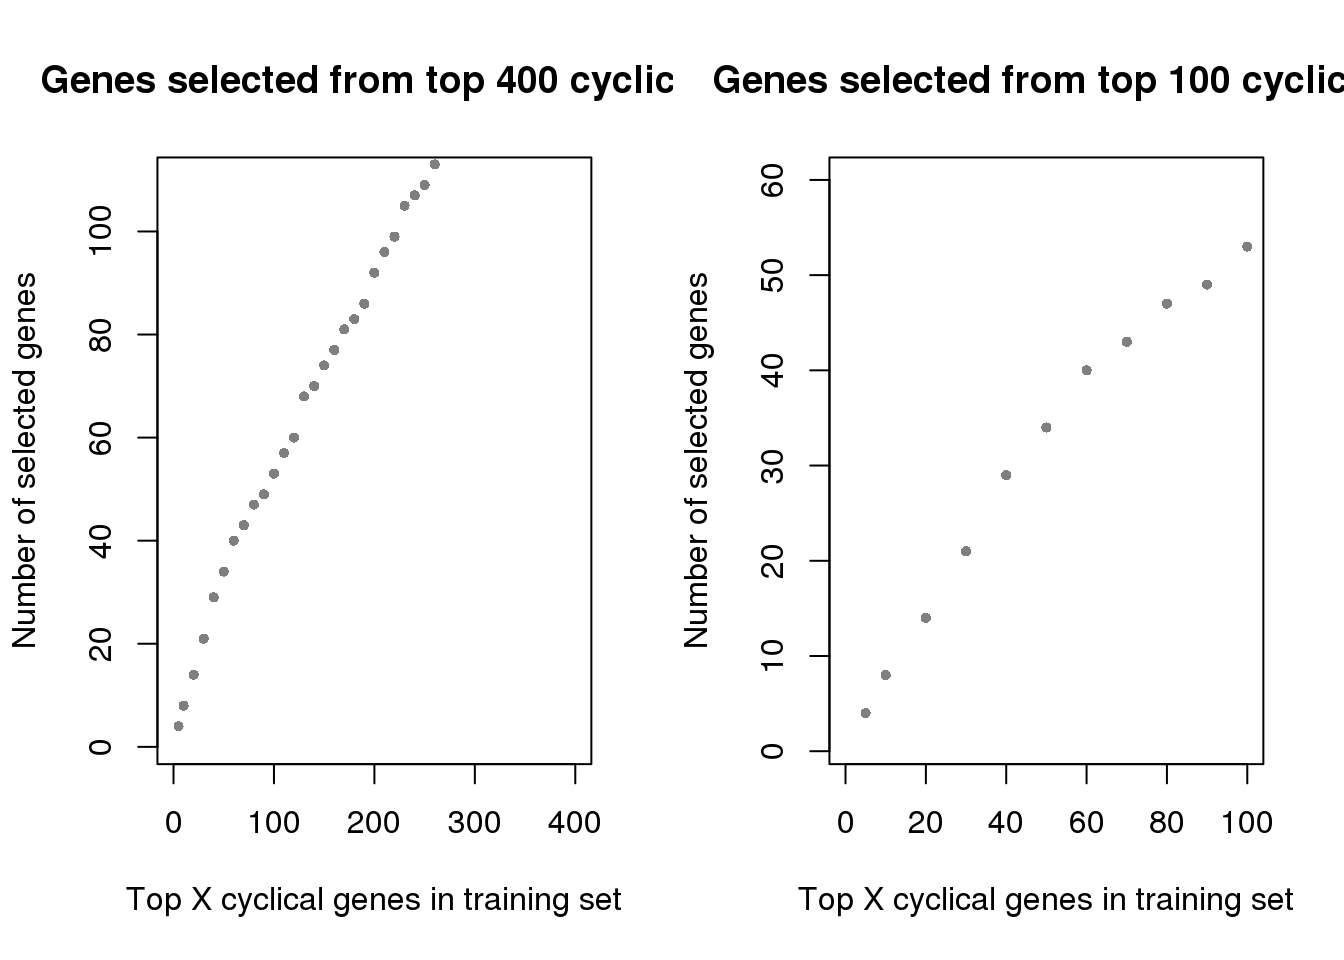
Prediction error by top X cyclical genes
code for summarize results
diff_time_wrapper <- function(results_list) {

  methods_list <- sapply(names(results_list),
                         function(x) strsplit(x, split=".", fixed=TRUE)[[1]][2])

  diff_time_list <- do.call(rbind, lapply(1:length(results_list), function(i) {
    diff_time <- results_list[[i]]$diff_time
    diff_mean <- mean(diff_time/2/pi)

    return(data.frame(diff_mean=diff_mean,
#                      diff_se=diff_se,
                      methods=methods_list[i]))
  }) )
  return(diff_time_list)
}
summarize results
fucci cyclical expression predicting cell time
fucci cyclical expression patterns predicting random cell times
ngenes <- c(5, seq(10,200, by=10))
train_top <- do.call(rbind, lapply(1:length(ngenes), function(i) {
  ngene <- ngenes[i]
  train_topX <- do.call(rbind, lapply(1:5, function(fold) {
    fl_name <- paste0("../data/results/triple_results_train.fold.",fold,".top",ngene,".rds")
    df <- readRDS(fl_name)
    out <- diff_time_wrapper(df$fit.test)
    out$fold <- fold
    return(out)
  }) )
  train_topX$ngenes <- ngene
  #return(train_topX)
  agg_mn <- aggregate(diff_mean ~ methods,
                    data=train_topX, FUN=mean)
  agg_sd <- aggregate(diff_mean ~ methods,
                    data=train_topX, FUN=sd)

  obj <- data.frame(methods=agg_mn$methods,
                    diff_mean=agg_mn$diff_mean,
                    diff_se=agg_sd$diff_mean/sqrt(5))
  obj$ngenes <- ngene
  return(obj)
}) )

saveRDS(train_top, file = "../output/method-train-triple.Rmd/diff_time_all.rds")


ngenes <- c(5, seq(10,200, by=10))
train_top_permute <- do.call(rbind, lapply(1:length(ngenes), function(i) {
  ngene <- ngenes[i]
  train_topX <- do.call(rbind, lapply(1:5, function(fold) {
    fl_name <- paste0("../data/results/triple_results_train_permute_oncyclical.fold.",
                      fold,".top",ngene,".rds")
    df <- readRDS(fl_name)
    out <- diff_time_wrapper(df$fit.test)
    out$fold <- fold
    return(out)
  }) )
  train_topX$ngenes <- ngene
  #return(train_topX)
  agg_mn <- aggregate(diff_mean ~ methods,
                    data=train_topX, FUN=mean)
  agg_sd <- aggregate(diff_mean ~ methods,
                    data=train_topX, FUN=sd)

  obj <- data.frame(methods=agg_mn$methods,
                    diff_mean=agg_mn$diff_mean,
                    diff_se=agg_sd$diff_mean/sqrt(5))
  obj$ngenes <- ngene
  return(obj)
}) )

saveRDS(train_top_permute,
        file = "../output/method-train-triple.Rmd/diff_time_fucci_on_rando.rds")
Results: fucci expression predicting fucci time labels
train_top <- readRDS("../output/method-train-triple.Rmd/diff_time_all.rds")

library(ggplot2)
ggplot(subset(train_top, methods == "supervised"),
       aes(x=ngenes, y=diff_mean)) +
  geom_errorbar(subset(train_top, methods == "supervised"),
                mapping=aes(ymin=diff_mean-diff_se, ymax=diff_mean+diff_se),
                color="blue") +
  geom_point() + geom_line(lty=3) +
  ylab("Error margin (% arc length)") + xlab("Top X cyclical genes") +
  ggtitle("Prediction error in the training set")
Results: fucci experssion patterns predicting random time labels
train_fucci_on_rando <- readRDS("../output/method-train-triple.Rmd/diff_time_fucci_on_rando.rds")

ggplot(subset(train_fucci_on_rando, methods == "supervised"),
       aes(x=ngenes, y=diff_mean)) +
  geom_errorbar(subset(train_fucci_on_rando, methods == "supervised"),
                mapping=aes(ymin=diff_mean-diff_se, ymax=diff_mean+diff_se),
                color="blue") +
  geom_point() + geom_line(lty=3) +
  ylab("Error margin (% arc length)") + xlab("Top X cyclical genes") +
  ggtitle("fucci cyclical genes predicting random times")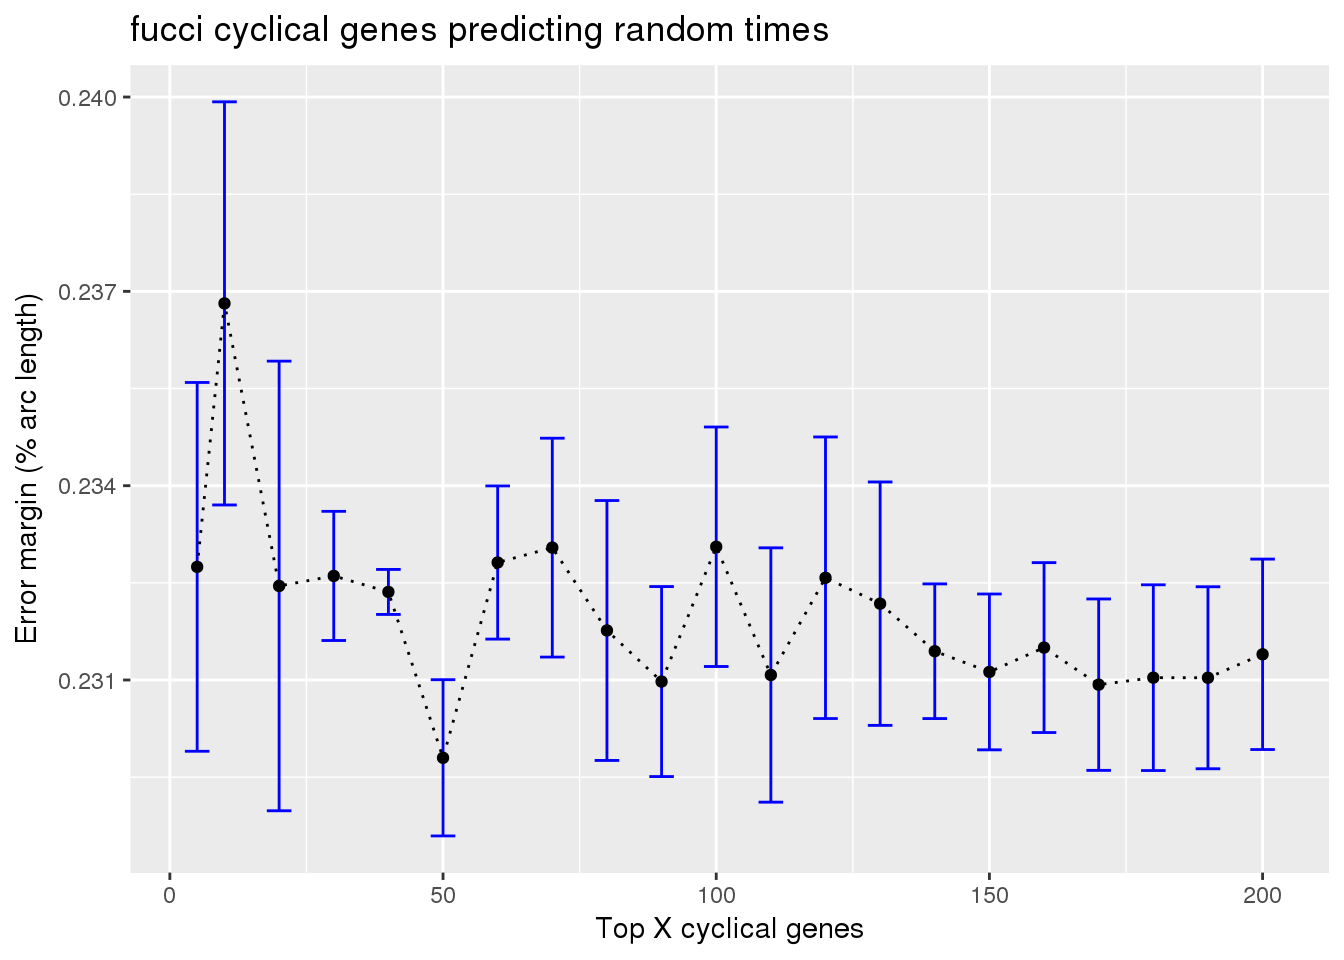
Result: combine fucci expression predicting fucci labels with fucci experssion predicting random cell time labels
train_fucci_on_rando <- readRDS("../output/method-train-triple.Rmd/diff_time_fucci_on_rando.rds")
train_top <- readRDS("../output/method-train-triple.Rmd/diff_time_all.rds")

library(ggplot2)

df <- rbind(data.frame(subset(train_top, methods == "supervised"),
                       type="obs_time"),
            data.frame(subset(train_fucci_on_rando, methods == "supervised"),
                       type="rando_time"))
ggplot(df,
       aes(x=ngenes, y=diff_mean, group=type)) +
  geom_errorbar(df,
                mapping=aes(ymin=diff_mean-diff_se, ymax=diff_mean+diff_se,
                            color=type)) +
  geom_point(aes(color=type)) + geom_line(lty=3) +
  ylab("Error margin (% arc length)") + xlab("Top X cyclical genes") +
  ggtitle("Prediction error in the training set") +
ylim(0,.25) 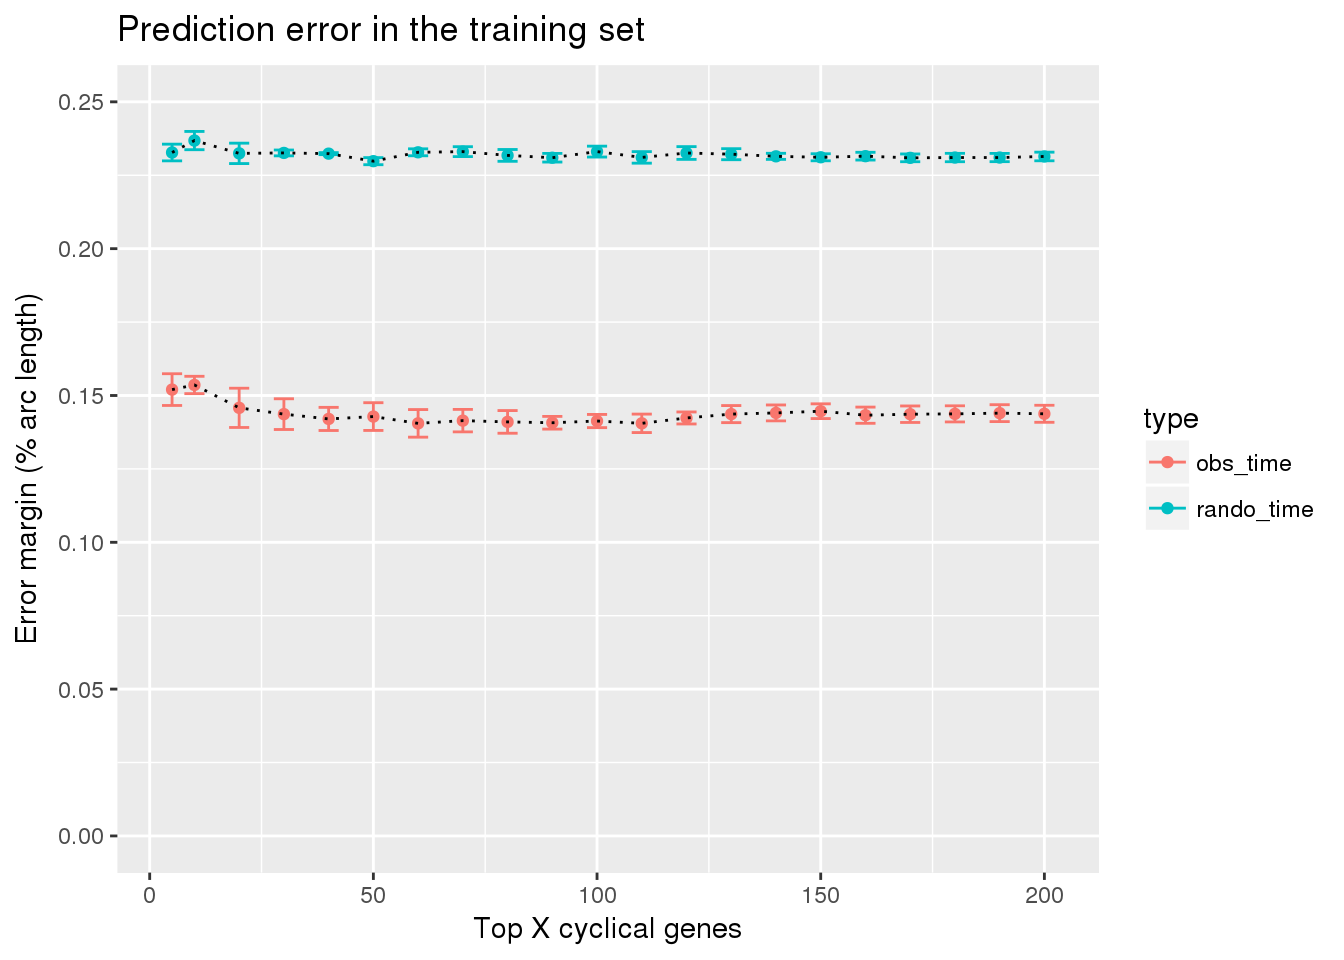
Session information
sessionInfo()R version 3.4.3 (2017-11-30)
Platform: x86_64-pc-linux-gnu (64-bit)
Running under: Scientific Linux 7.4 (Nitrogen)
Matrix products: default
BLAS/LAPACK: /software/openblas-0.2.19-el7-x86_64/lib/libopenblas_haswellp-r0.2.19.so
locale:
[1] LC_CTYPE=en_US.UTF-8 LC_NUMERIC=C
[3] LC_TIME=en_US.UTF-8 LC_COLLATE=en_US.UTF-8
[5] LC_MONETARY=en_US.UTF-8 LC_MESSAGES=en_US.UTF-8
[7] LC_PAPER=en_US.UTF-8 LC_NAME=C
[9] LC_ADDRESS=C LC_TELEPHONE=C
[11] LC_MEASUREMENT=en_US.UTF-8 LC_IDENTIFICATION=C
attached base packages:
[1] stats graphics grDevices utils datasets methods base
other attached packages:
[1] ggplot2_2.2.1
loaded via a namespace (and not attached):
[1] Rcpp_0.12.17 digest_0.6.15 rprojroot_1.3-2 plyr_1.8.4
[5] grid_3.4.3 gtable_0.2.0 backports_1.1.2 git2r_0.21.0
[9] magrittr_1.5 scales_0.5.0 evaluate_0.10.1 pillar_1.1.0
[13] rlang_0.1.6 stringi_1.1.6 lazyeval_0.2.1 rmarkdown_1.10
[17] labeling_0.3 tools_3.4.3 stringr_1.2.0 munsell_0.4.3
[21] yaml_2.1.16 compiler_3.4.3 colorspace_1.3-2 htmltools_0.3.6
[25] knitr_1.20 tibble_1.4.2 This R Markdown site was created with workflowr