Investigate intensities against transgenes
Joyce Hsiao
Last updated: 2017-12-23
Code version: 0604a0e
Introduction/Summary
Here I combine image intensity data with sequencing data on the FUCCI transgenes, focusing on the subset of samples that are identified as single nucleus (1,264 samples).
Results
There are more reads mapped to EGFP than to mCherry. The regions in the transgenes statring from 5’ end: promoter region -> EGFP -> 20 bp linker -> mCherry. We don’t yet have an explanation on the low number of reads mapped to mCherry… We decided to use EGFP to determine if the transgene is silenced at all.
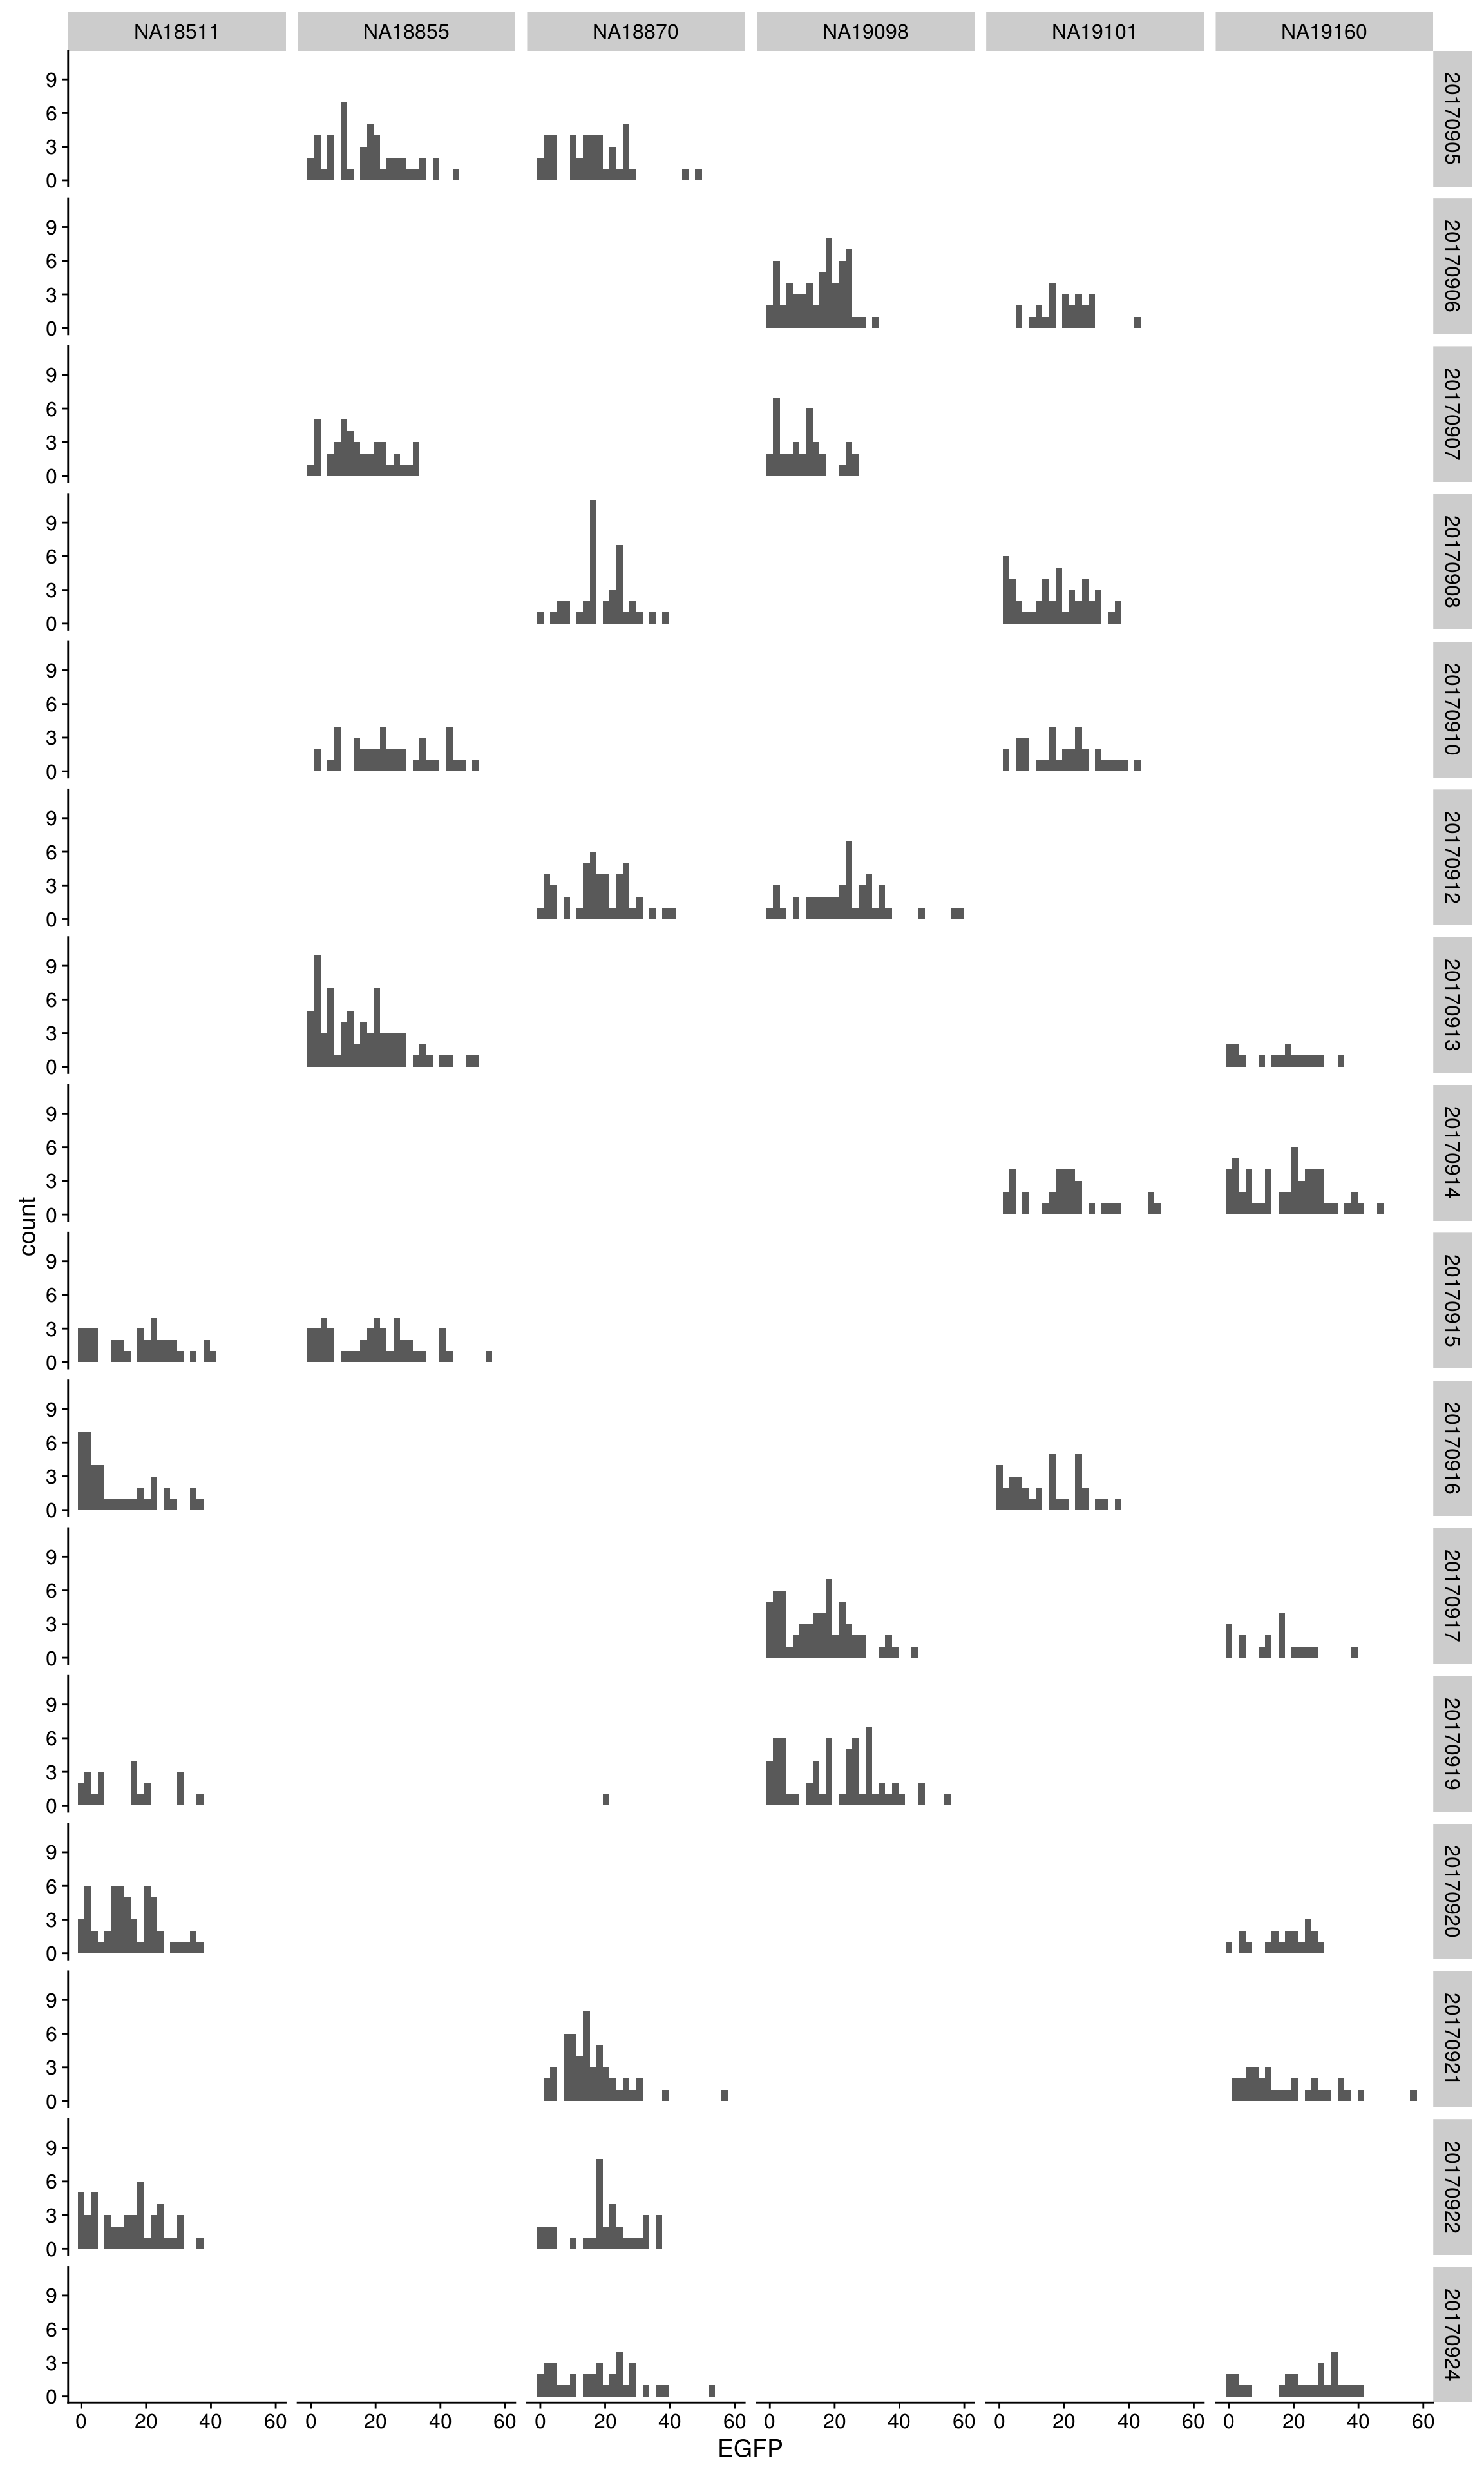
Consistent with image intensity data, there are more variation between batches of C1 plates than between individuals. Fortunatley, given our balanced design, technical variation between batches are spread out across individuals. The main concern here would be the inflated within individual variation due to differences between the C1 plates.
Considering the relationship between intensity and transgene molecule count: samples with no EGFP molecules also have lower than average (z-score < 0) GFP and RFP intensity.
Packages
library(ggplot2)
library(cellcycleR)
library(data.table)
library(dplyr)
library(cowplot)
library(wesanderson)
library(RColorBrewer)
library(Biobase)
Data
Import sequencing data.
fname <- Sys.glob("../data/eset/*.rds")
eset <- Reduce(combine, Map(readRDS, fname))

pdata <- pData(eset)
pdata$unique <- paste(pdata$image_individual, sprintf("%05d", pdata$image_label), sep="_")

transgenes <- data.frame(t(exprs(eset)[c("EGFP", "mCherry"),]))
Imort intensity data for samples with single nucleus. For source of the intensity data, see [combine-intensity-data.R][/project2/gilad/joycehsiao/fucci-seq/code/combine-intensity-data.R].
ints <- readRDS(file="/project2/gilad/joycehsiao/fucci-seq/data/intensity.rds")
ints$rfp.z <- scale(ints$rfp.median.log10sum, center=TRUE, scale=TRUE)
ints$gfp.z <- scale(ints$gfp.median.log10sum, center=TRUE, scale=TRUE)
ints$dapi.z <- scale(ints$dapi.median.log10sum, center=TRUE, scale=TRUE)

ints_tmp <- data.frame(unique=ints$unique,
                       rfp.z=ints$rfp.z,
                       gfp.z=ints$gfp.z,
                       dapi.z=ints$dapi.z,
                       stringsAsFactors = F)
Combine intensities with sequencing data. This includes 1,264 samples with single nucleus.
combo <- ints_tmp
combo$EGFP <- transgenes$EGFP[match(combo$unique, pdata$unique)]
combo$mCherry <- transgenes$mCherry[match(combo$unique, pdata$unique)]
combo$chip_id <- pdata$chip_id[match(combo$unique, pdata$unique)]
combo$experiment <- pdata$experiment[match(combo$unique, pdata$unique)]
\(~\)
Transgene count
Results: there are more reads mapped to EGFP than to mCherry. The regions in the transgenes statring from 5’ end: promoter region -> EGFP -> 20 bp linker -> mCherry. We don’t yet have an explanation on the low number of reads mapped to mCherry… We decided to use EGFP to determine if the transgene is silenced at all.
summary(combo$EGFP) Min. 1st Qu. Median Mean 3rd Qu. Max.
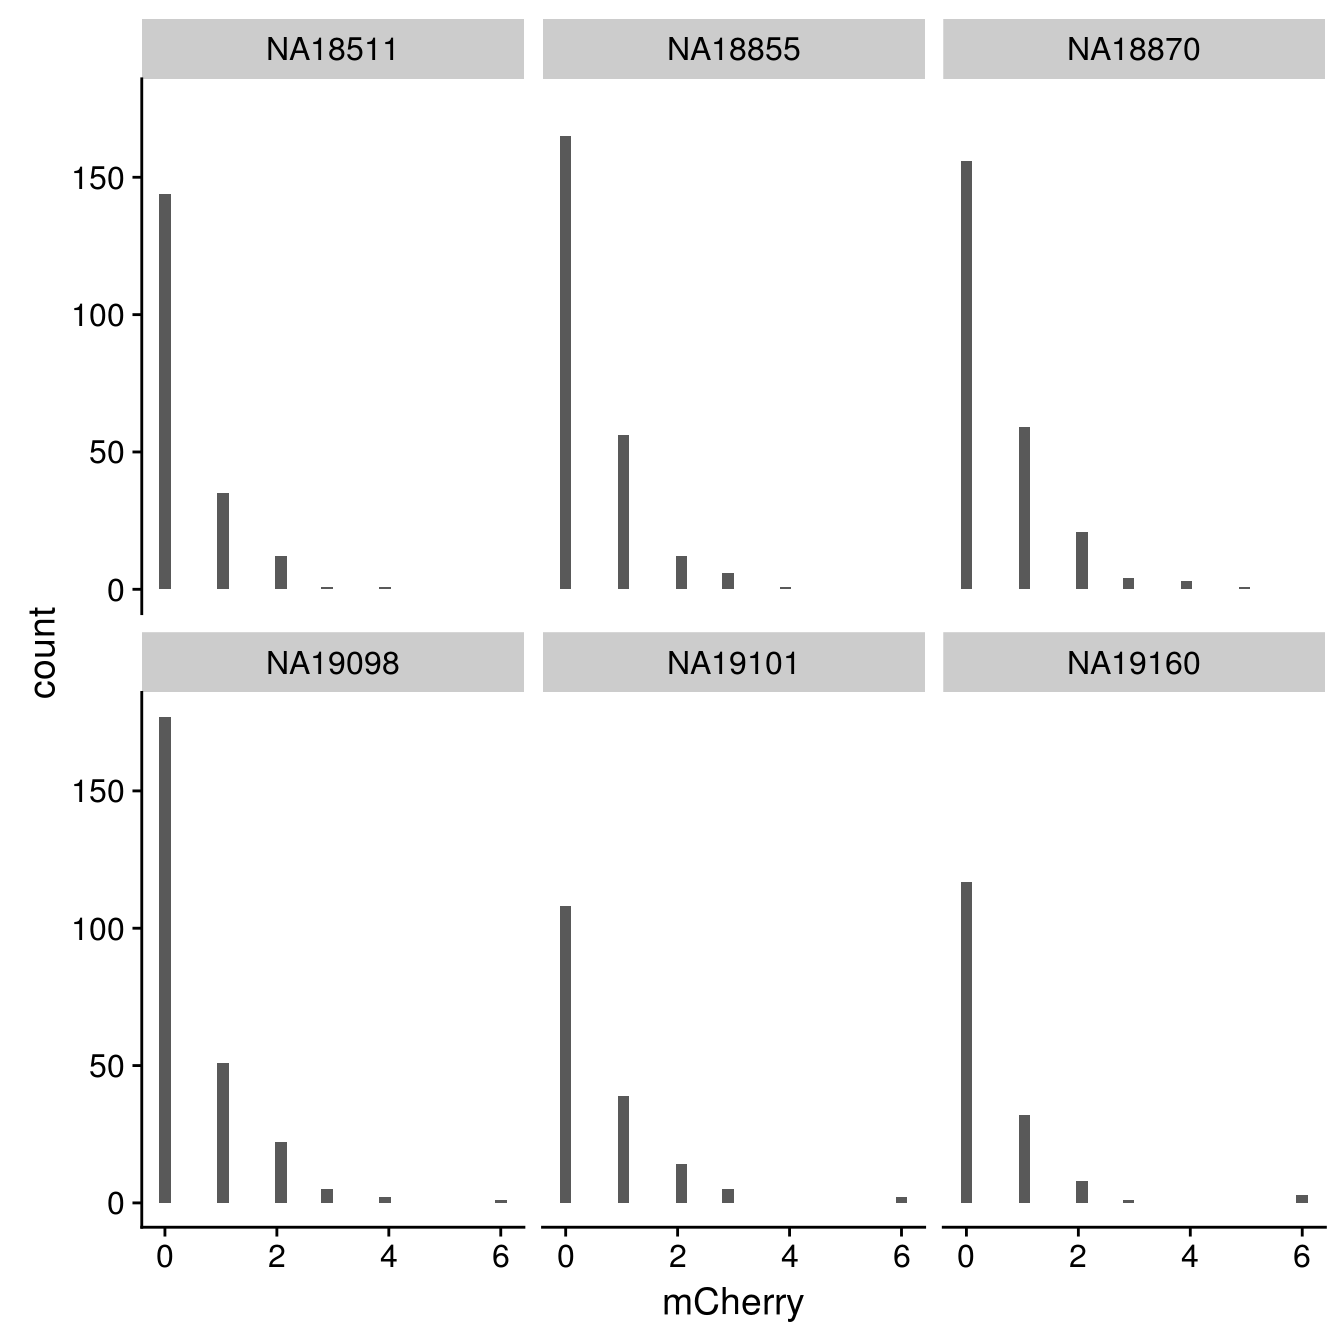
0.00 8.00 17.00 17.34 25.00 59.00 summary(combo$mCherry) Min. 1st Qu. Median Mean 3rd Qu. Max.
0.0000 0.0000 0.0000 0.4628 1.0000 6.0000 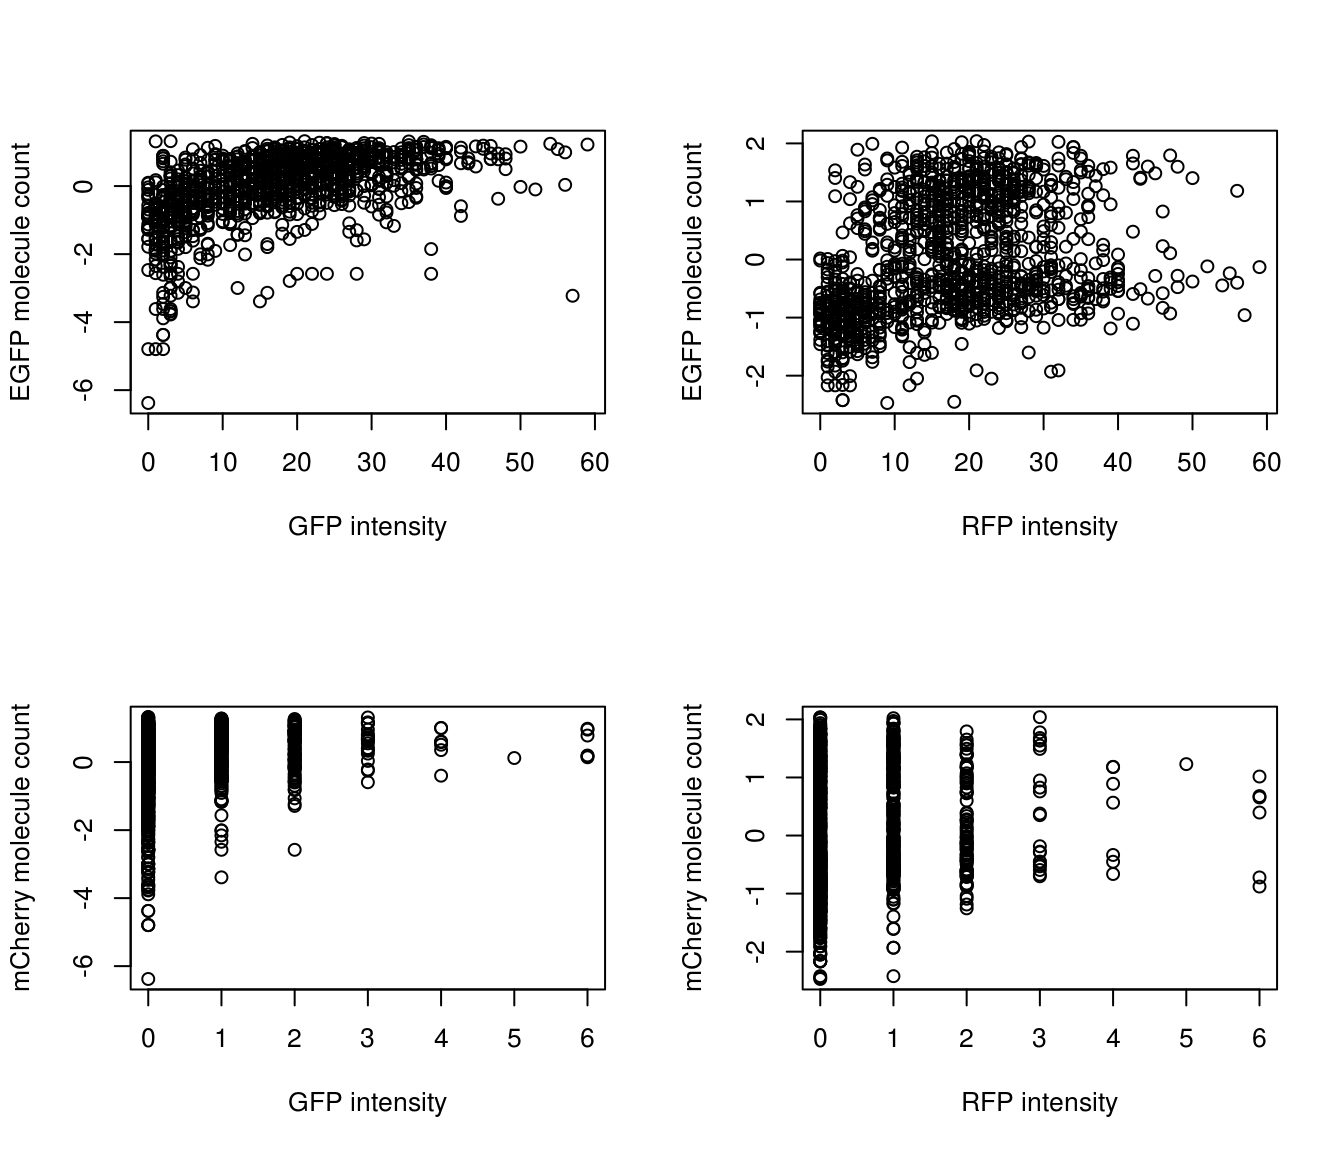
\(~\)
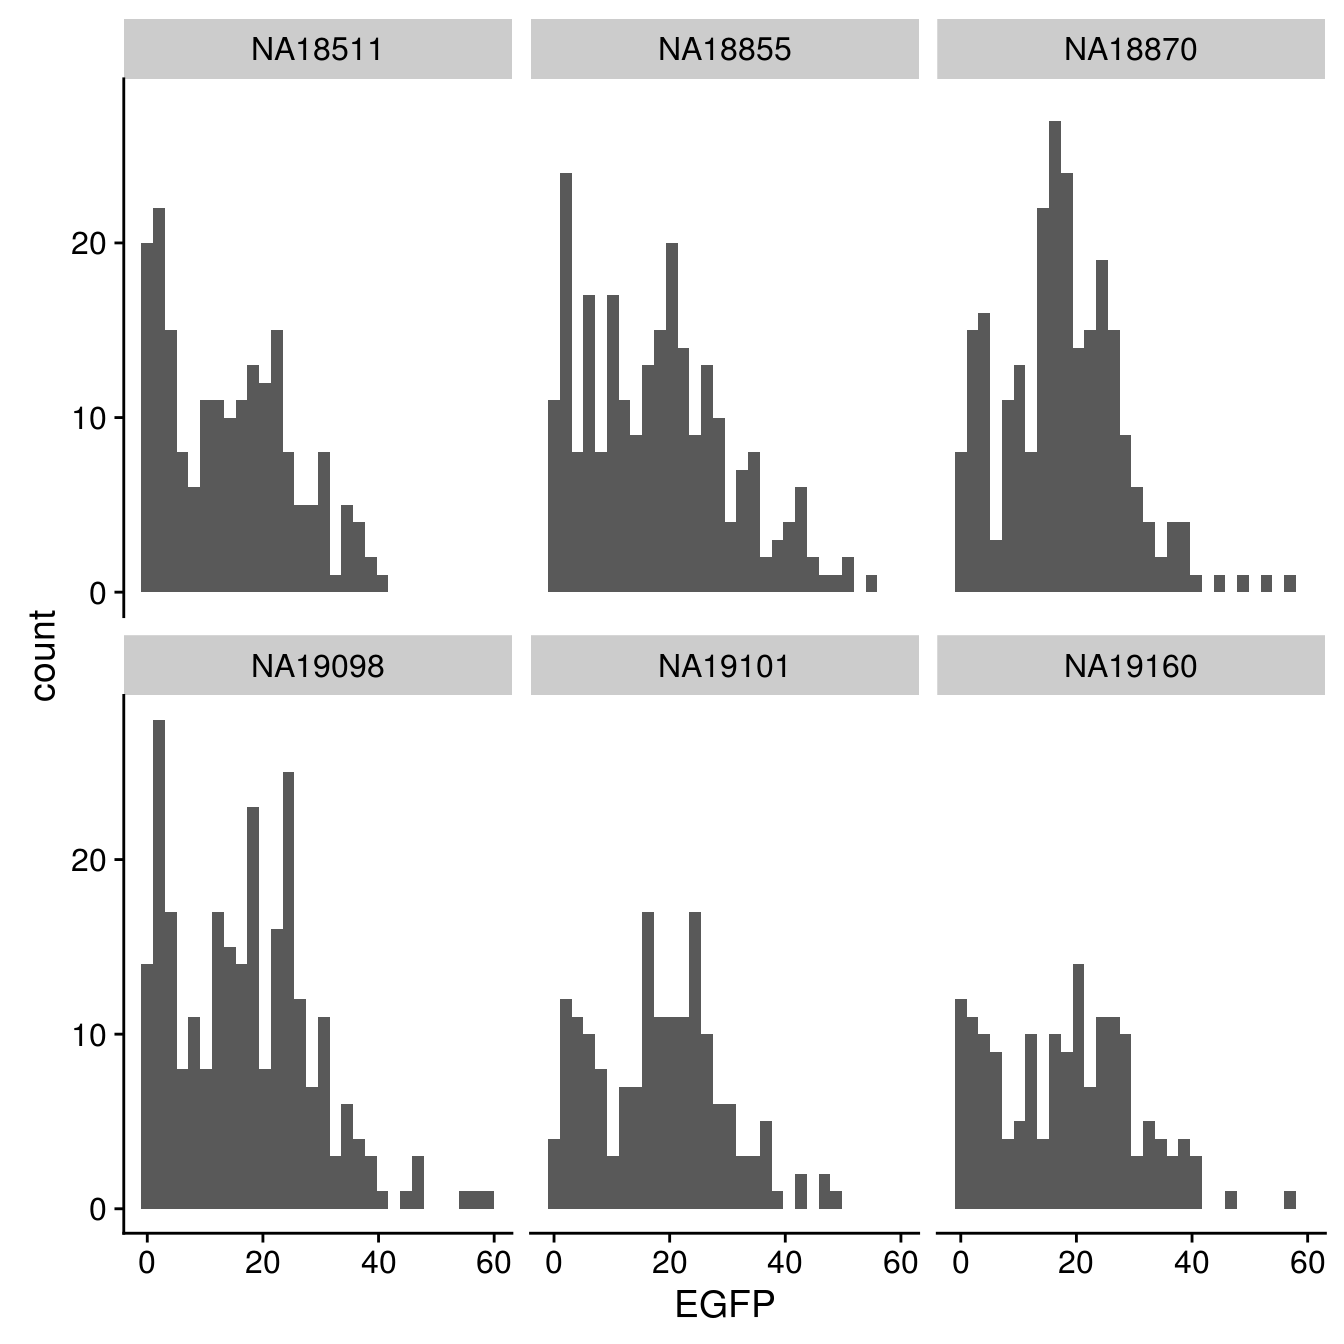
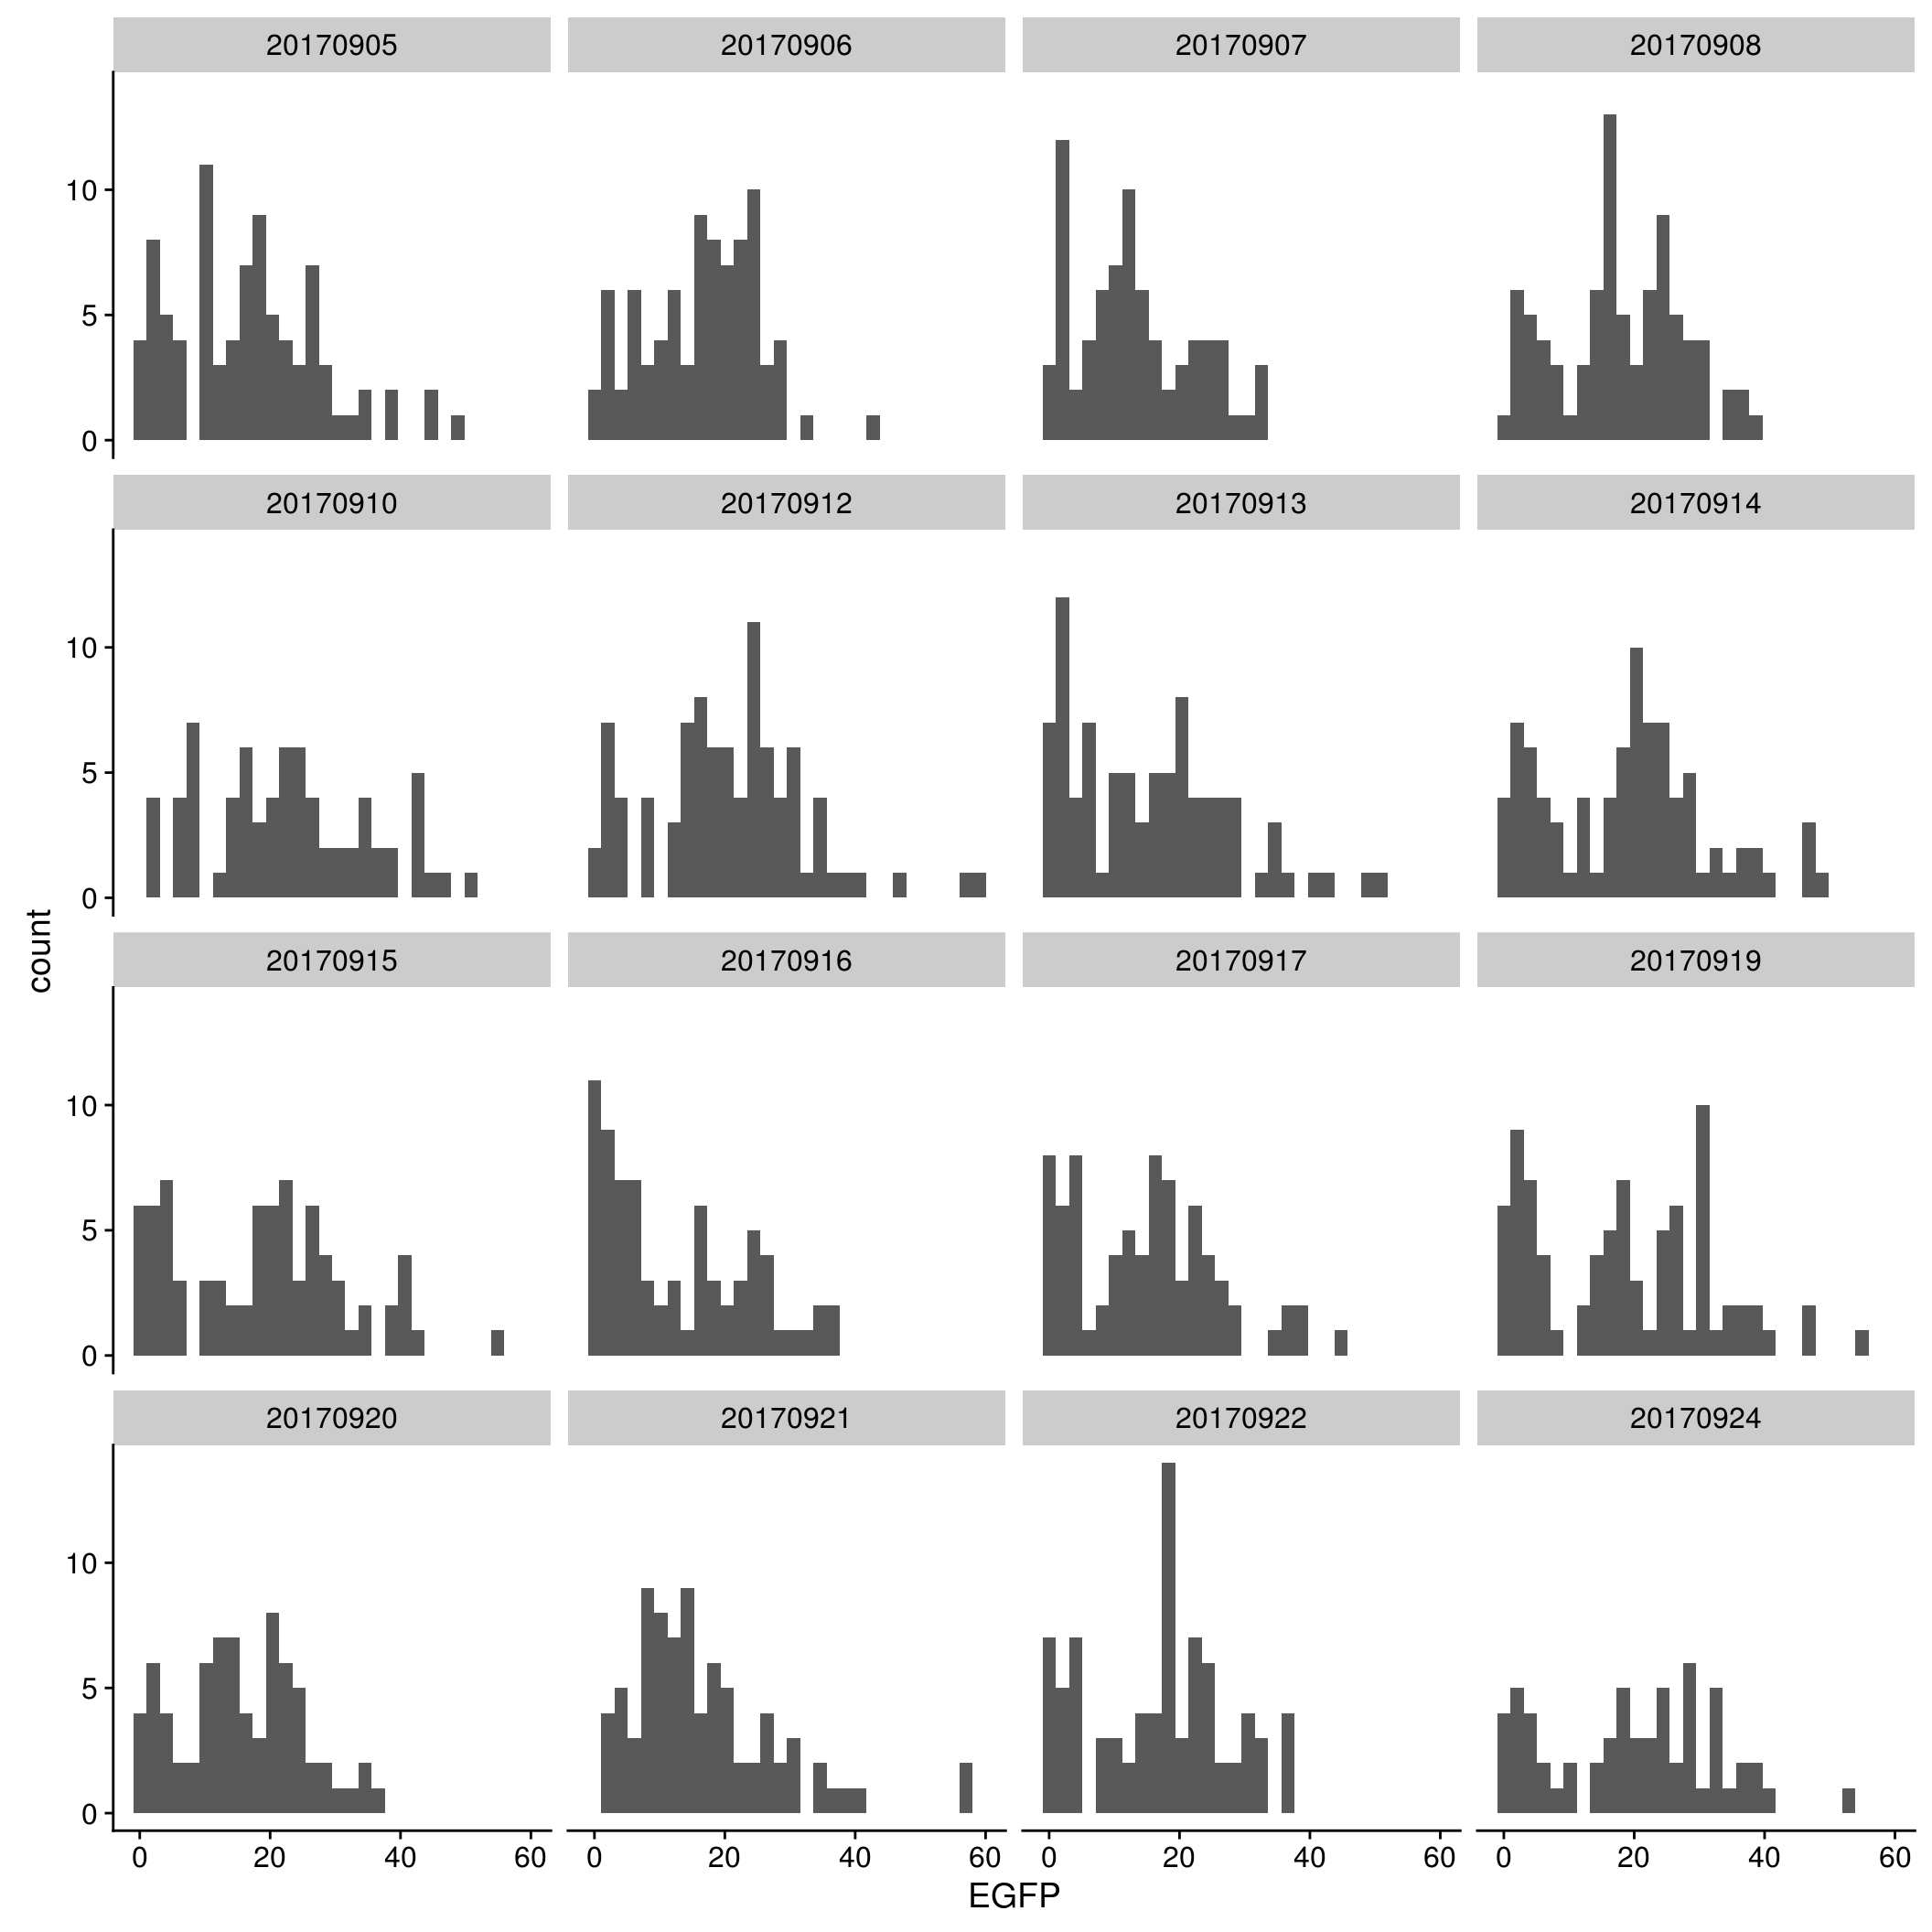
EGFP
By individual
\(~\)
By C1 plate
\(~\)
By individual and C1 plate
\(~\)
mCherry
By individual
\(~\)
By C1 plate
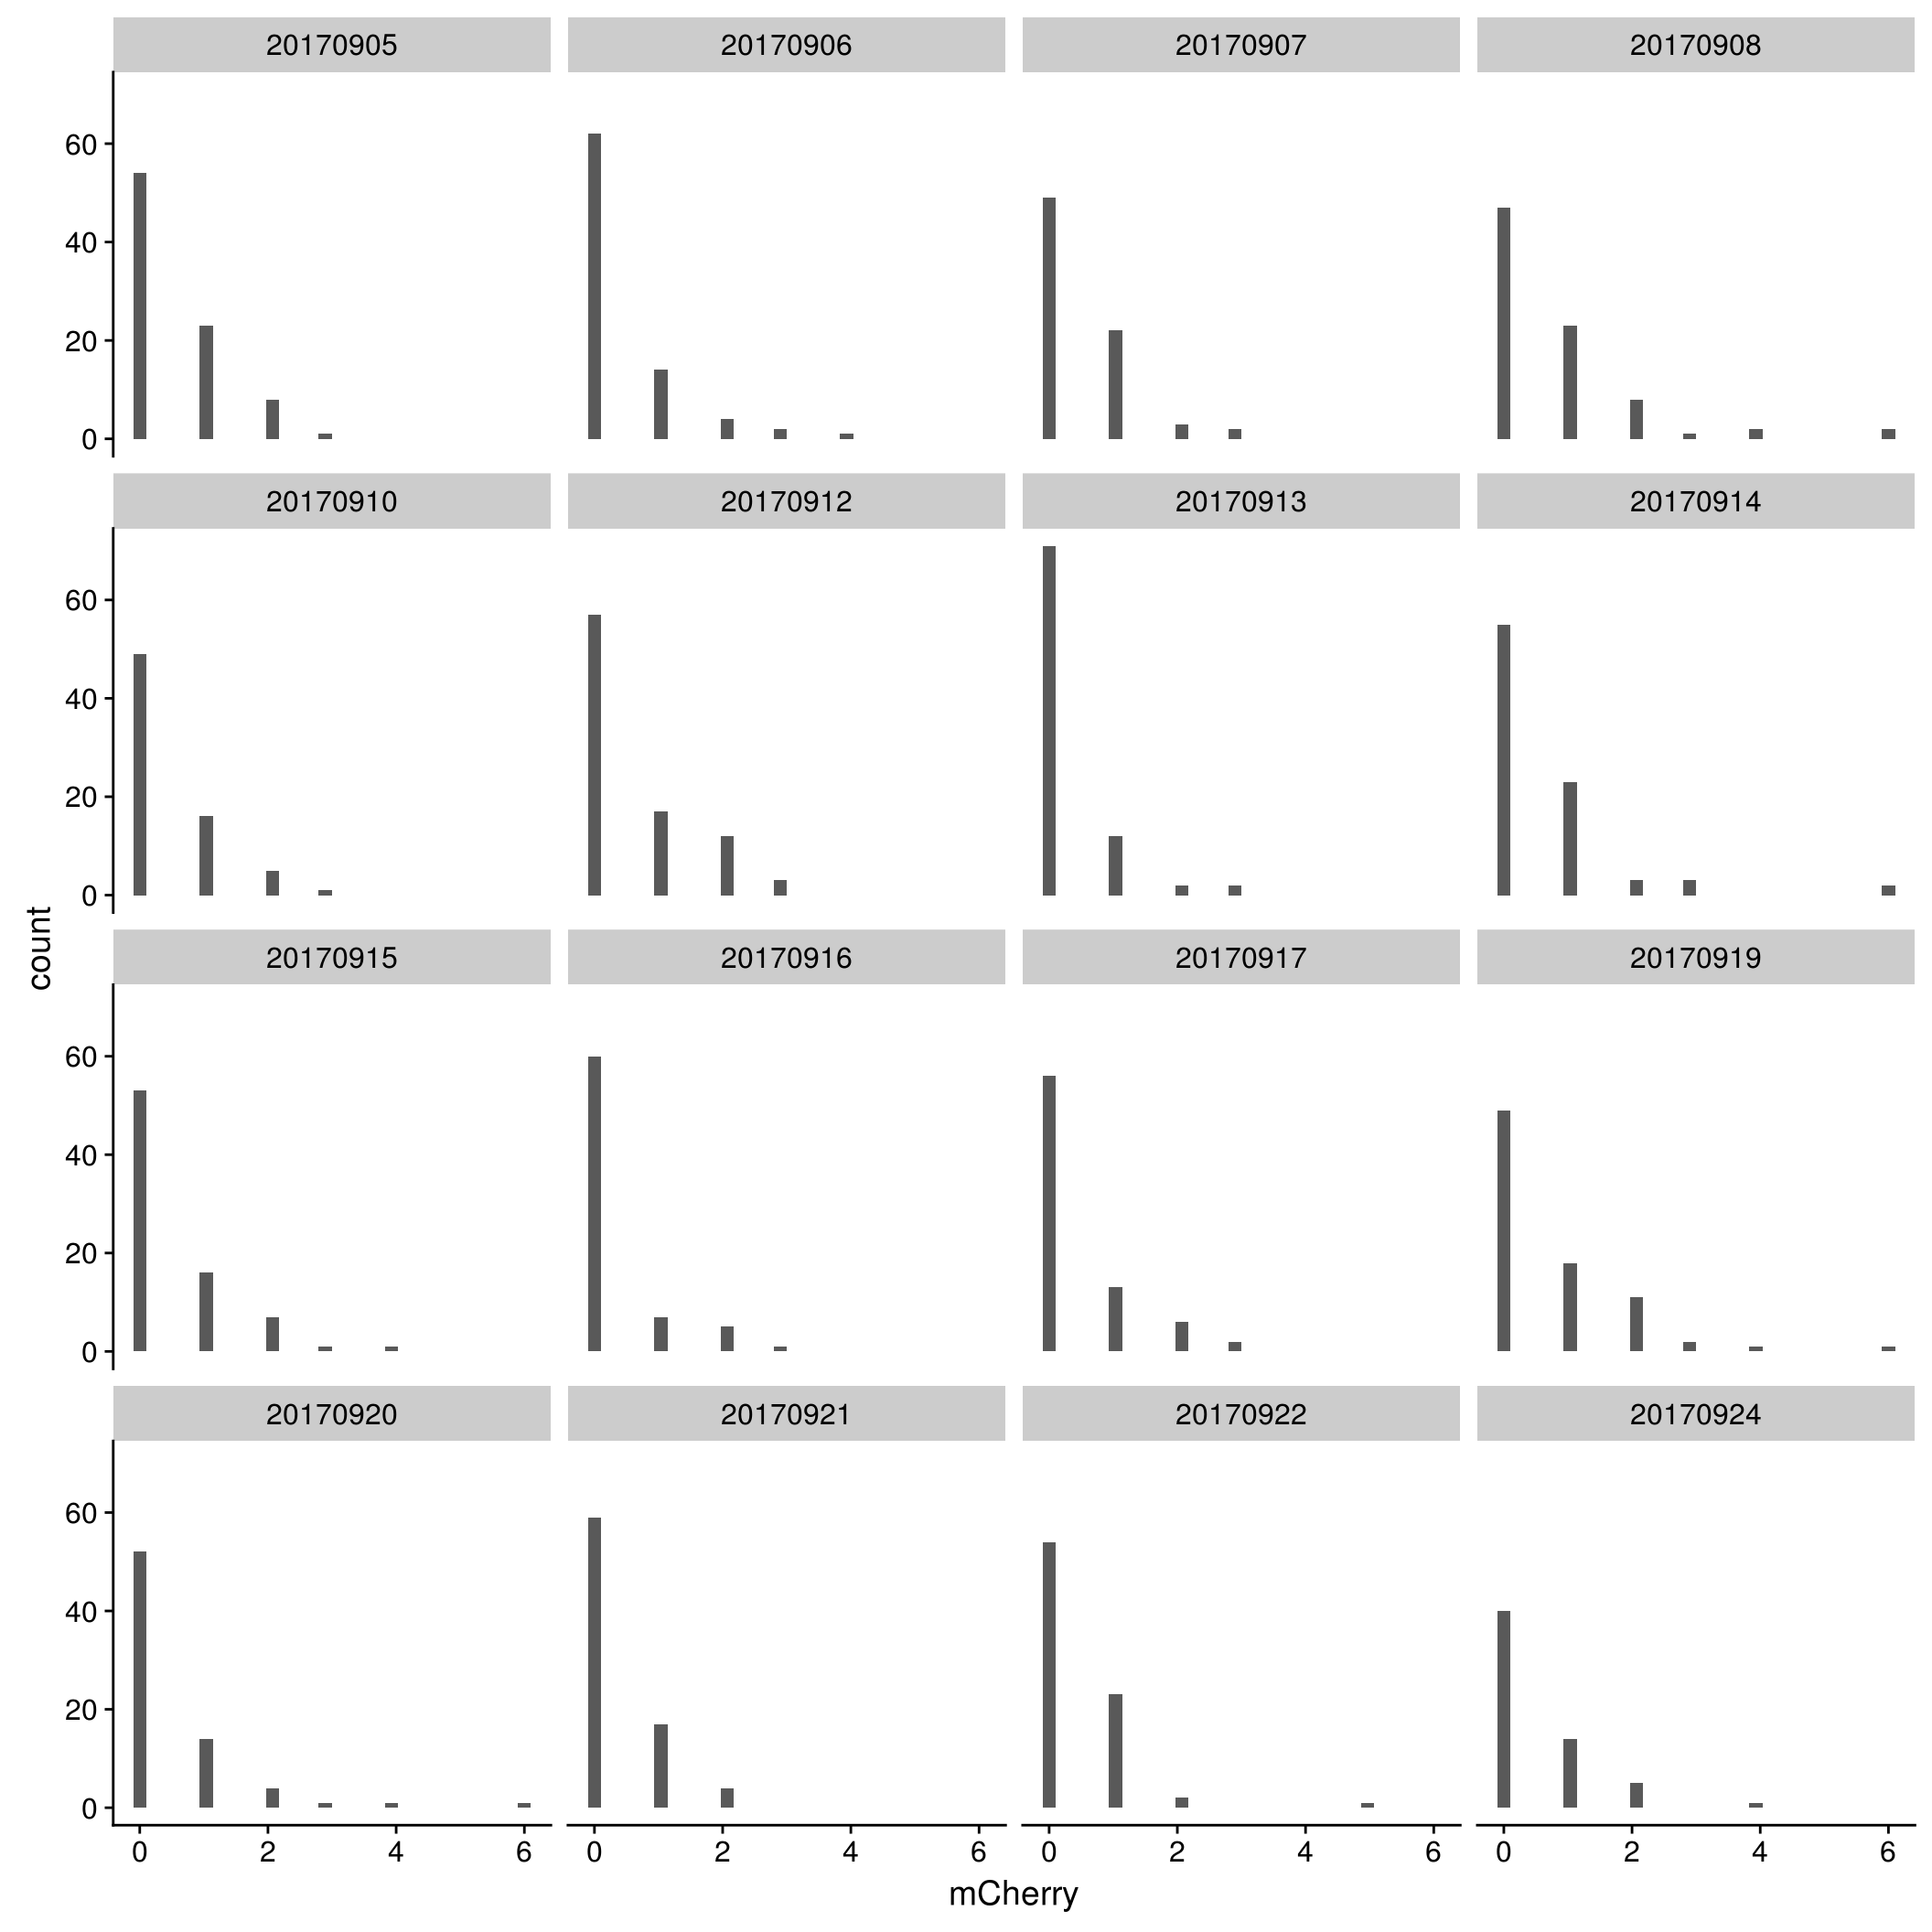
\(~\)
By individual and C1 plate
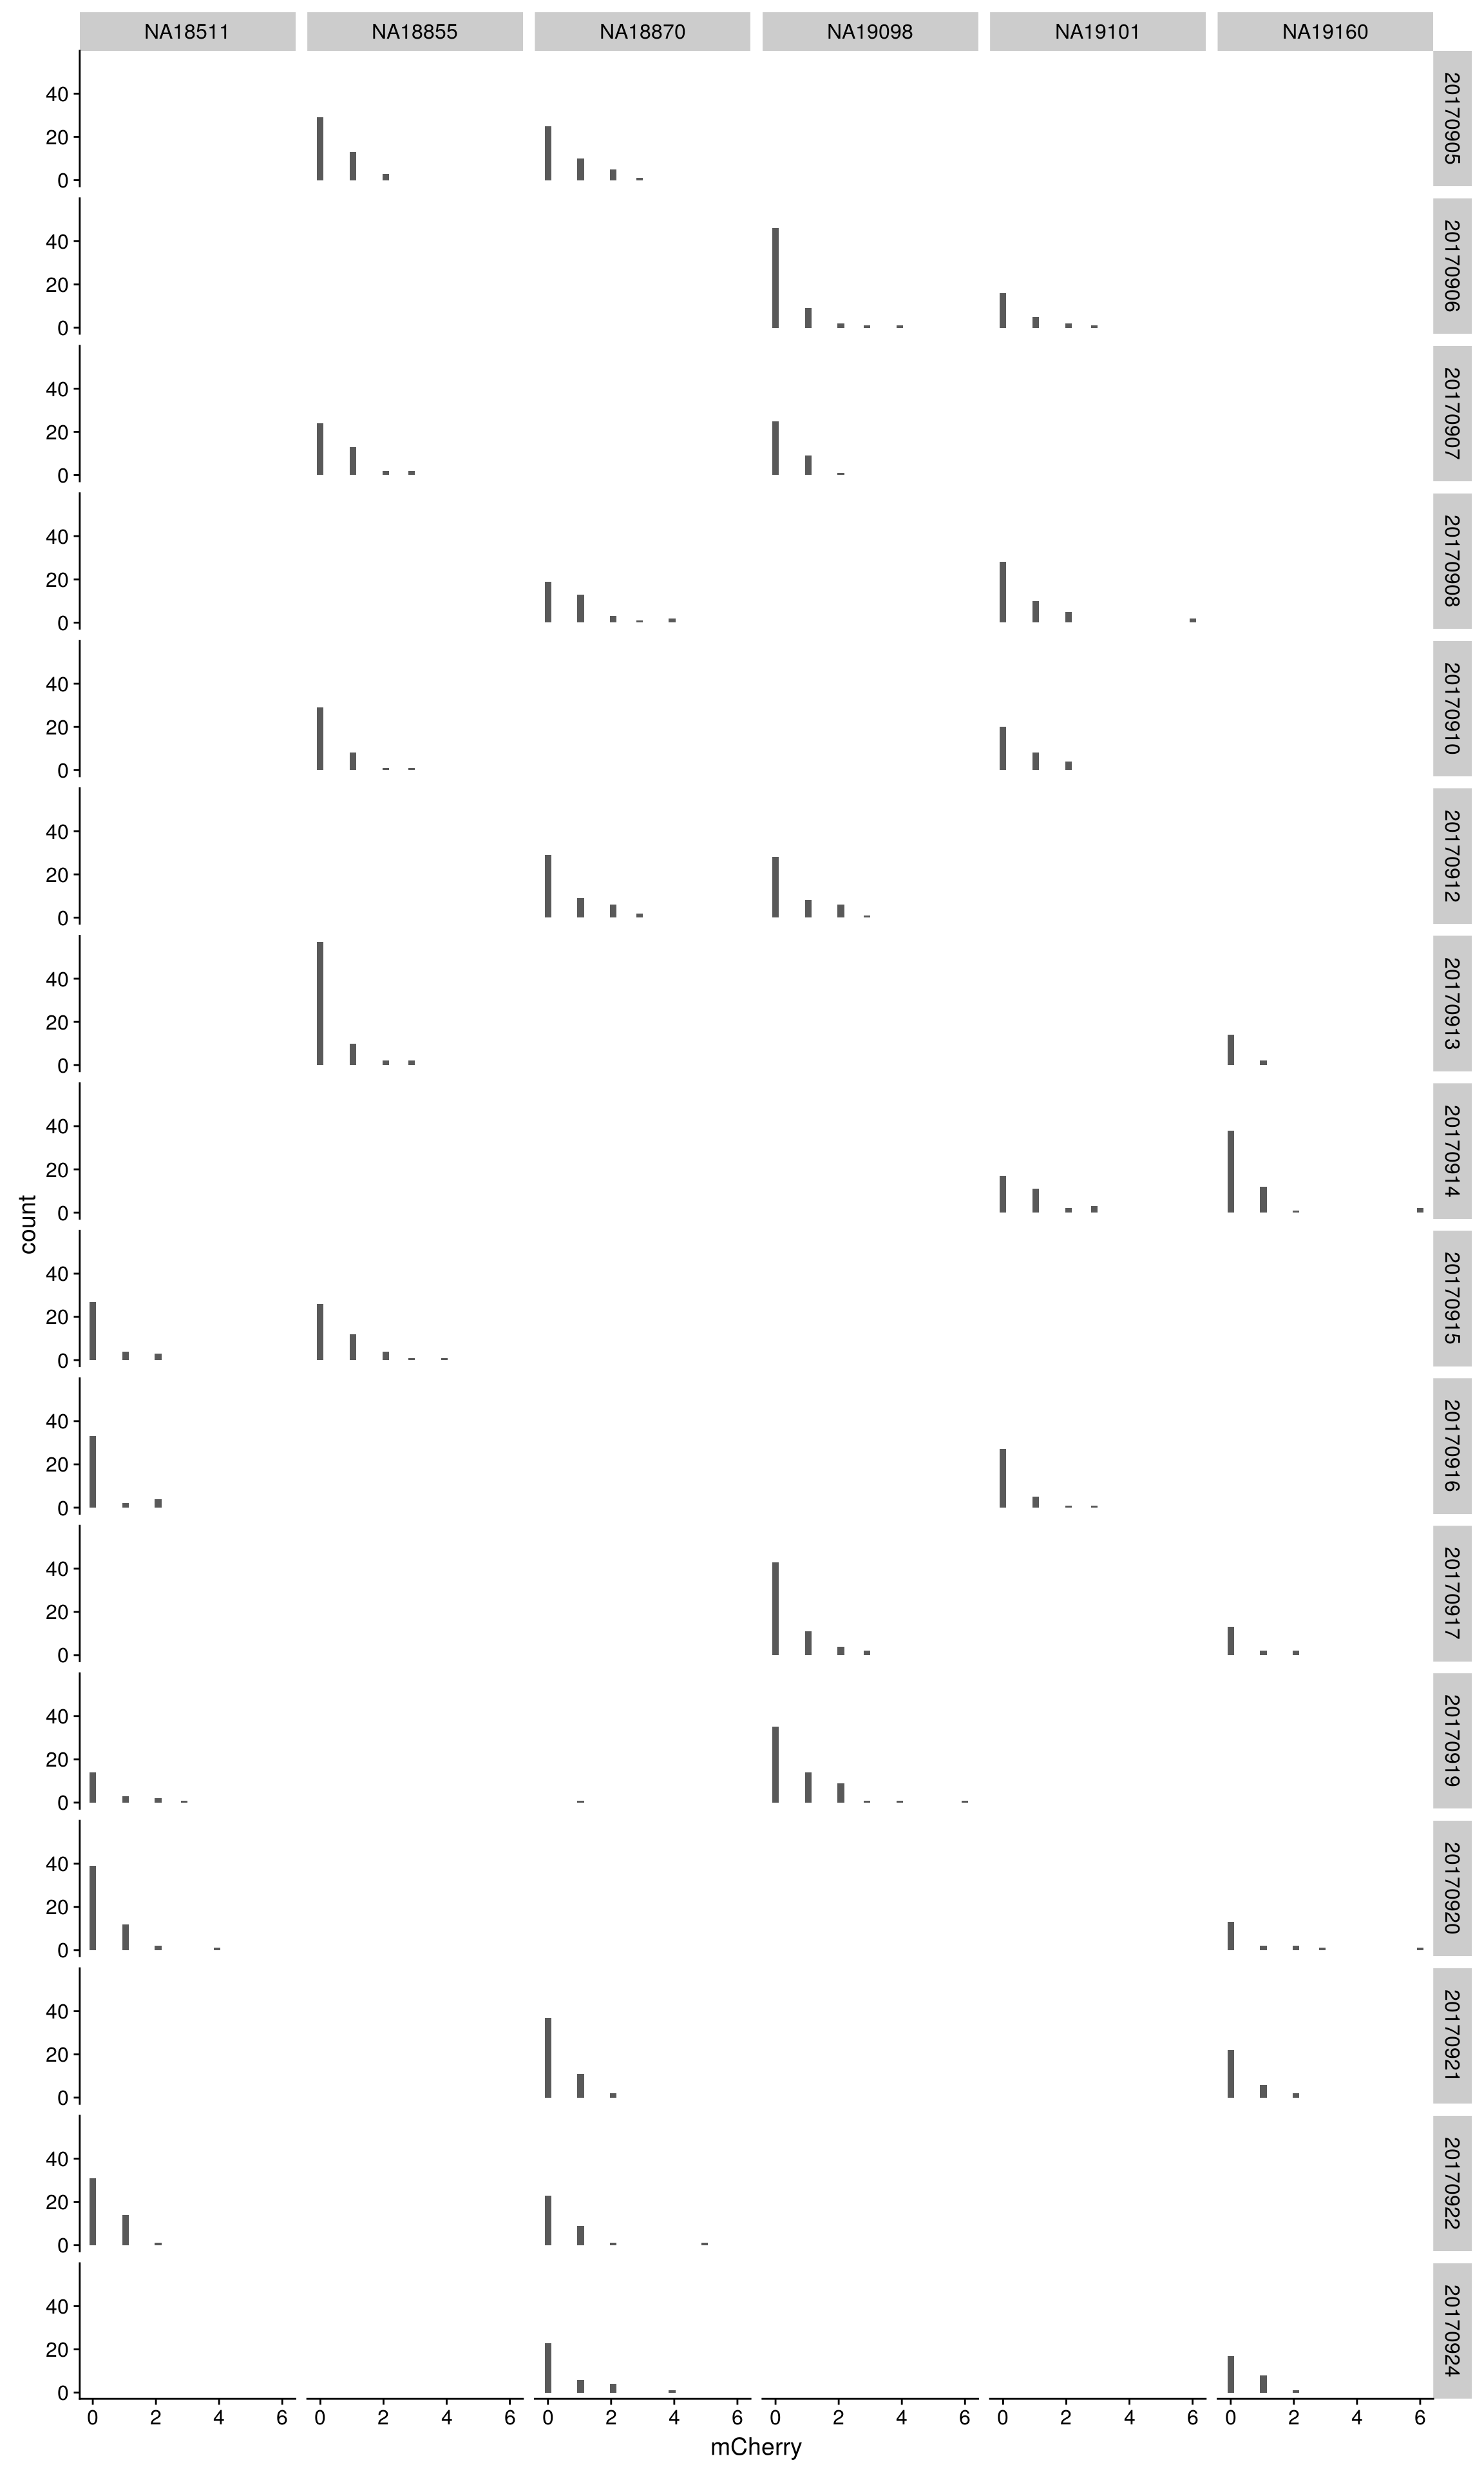
\(~\)
Session information
R version 3.4.1 (2017-06-30)
Platform: x86_64-pc-linux-gnu (64-bit)
Running under: Scientific Linux 7.2 (Nitrogen)

Matrix products: default
BLAS: /home/joycehsiao/miniconda3/envs/fucci-seq/lib/R/lib/libRblas.so
LAPACK: /home/joycehsiao/miniconda3/envs/fucci-seq/lib/R/lib/libRlapack.so

locale:
 [1] LC_CTYPE=en_US.UTF-8       LC_NUMERIC=C
 [3] LC_TIME=en_US.UTF-8        LC_COLLATE=en_US.UTF-8
 [5] LC_MONETARY=en_US.UTF-8    LC_MESSAGES=en_US.UTF-8
 [7] LC_PAPER=en_US.UTF-8       LC_NAME=C
 [9] LC_ADDRESS=C               LC_TELEPHONE=C
[11] LC_MEASUREMENT=en_US.UTF-8 LC_IDENTIFICATION=C

attached base packages:
[1] parallel  stats     graphics  grDevices utils     datasets  methods
[8] base

other attached packages:
 [1] Biobase_2.38.0      BiocGenerics_0.24.0 RColorBrewer_1.1-2
 [4] wesanderson_0.3.2   cowplot_0.8.0       dplyr_0.7.0
 [7] data.table_1.10.4   cellcycleR_0.1.2    zoo_1.8-0
[10] binhf_1.0-1         adlift_1.3-3        EbayesThresh_1.4-12
[13] wavethresh_4.6.8    MASS_7.3-47         ggplot2_2.2.1

loaded via a namespace (and not attached):
 [1] Rcpp_0.12.14     compiler_3.4.1   git2r_0.19.0     plyr_1.8.4
 [5] tools_3.4.1      digest_0.6.12    evaluate_0.10.1  tibble_1.3.3
 [9] gtable_0.2.0     lattice_0.20-34  rlang_0.1.4.9000 yaml_2.1.16
[13] stringr_1.2.0    knitr_1.17       rprojroot_1.2    grid_3.4.1
[17] glue_1.1.1       R6_2.2.2         rmarkdown_1.8    reshape2_1.4.2
[21] magrittr_1.5     backports_1.0.5  scales_0.4.1     htmltools_0.3.6
[25] assertthat_0.2.0 colorspace_1.3-2 labeling_0.3     stringi_1.1.2
[29] lazyeval_0.2.0   munsell_0.4.3
This R Markdown site was created with workflowr