 gdp_per_capita   inflation_rate    life_expectancy
 Min.   :   303   Min.   : -6.687   Min.   :18.82
 1st Qu.:  2899   1st Qu.:  5.362   1st Qu.:67.79
 Median :  7656   Median :  7.985   Median :74.16
 Mean   : 21143   Mean   : 12.645   Mean   :73.11
 3rd Qu.: 28360   3rd Qu.: 12.260   3rd Qu.:78.53
 Max.   :226052   Max.   :171.205   Max.   :85.75
 NA's   :8        NA's   :39
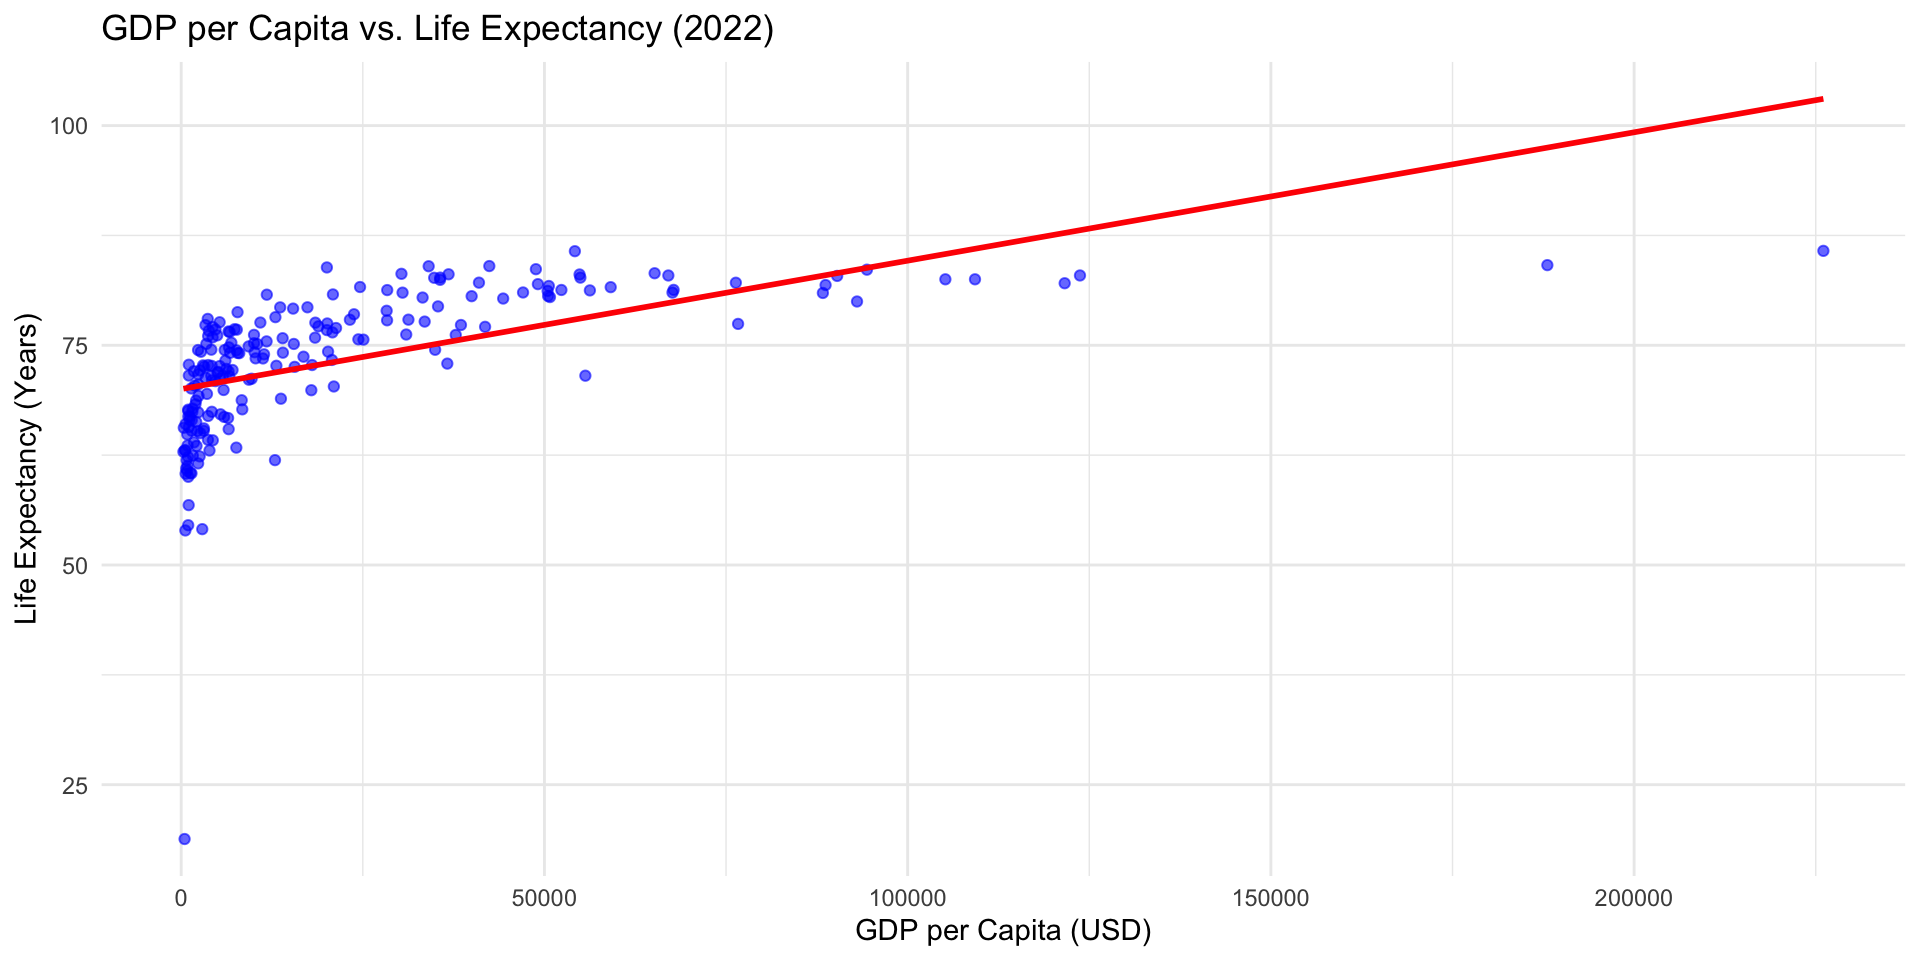
Wealth vs. Health
Figure 1: Relationship between GDP per Capita and Life Expectancy.(Source:WDI, 2022)
Findings: The scatter plot shows a clear positive relationship between GDP per capita and life expectancy in 2022. Countries with higher GDP per capita generally have higher life expectancy. The upward-sloping regression line indicates that as income increases, life expectancy tends to increase as well. However, the relationship appears to flatten at higher income levels
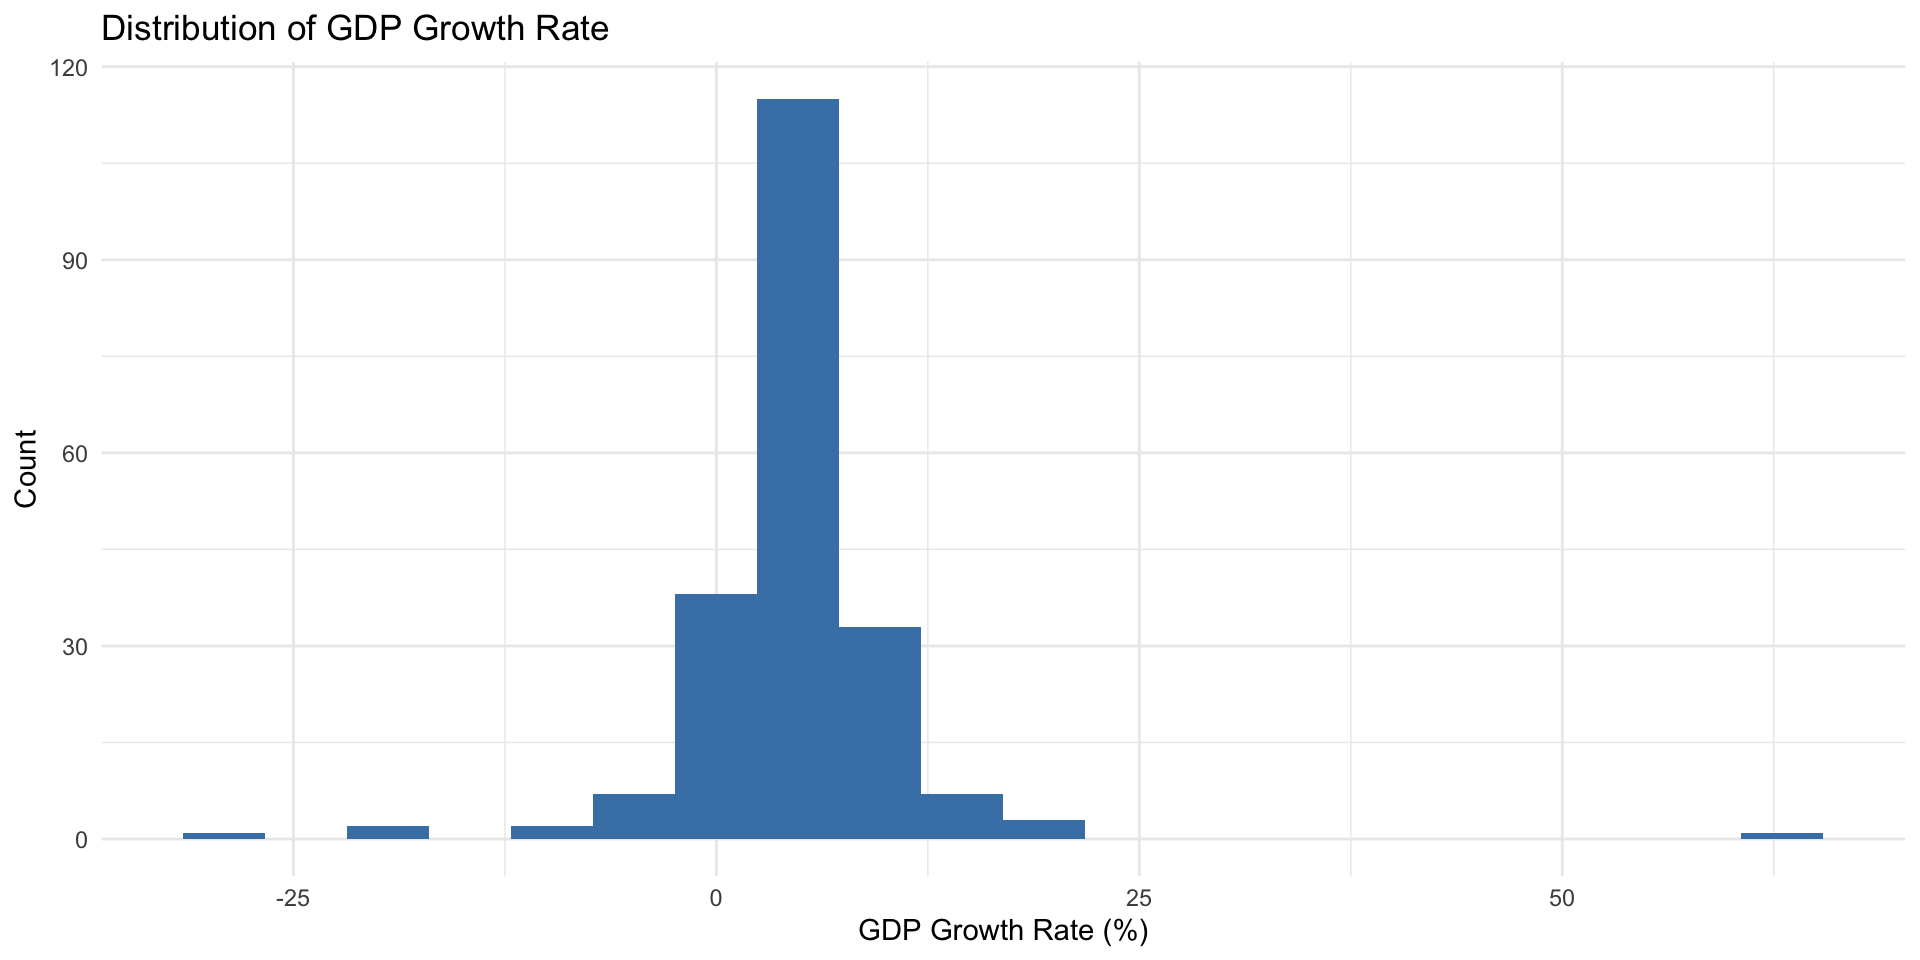
Distribution of GDP Growth Rate
Figure 2: Distribution of GDP Growth Rate (Source:WDI, 2022)
Findings: The histogram of GDP growth rates shows that most countries cluster around modest positive growth between approximately –5% and 10%. However, the distribution has small number of countries experiencing extremely high growth rates (above 20% and even near 60%) and a few cases of severe economic contraction (around –30%).
Key Variable table
Table 1: Average Global Indicators for 2022
Avg_GDP_Capita
Avg_GDP_Growth
Avg_Inflation
Avg_Life_Exp
21142.75
4.51
12.65
73.11
Citation
The data for this analysis is sourced from the @worldbank2022. The second research by @rosling2011 shows that the historical gap between wealth and health outcomes is gradually closing as shown in Figure 1.
Conclusion
Economic Impact: Countries with higher GDP per capita generally show better health outcomes, as seen in the positive trend of life expectancy.
Economic Stability: While the vast majority of the world experienced typical, modest economic growth in 2022, the overall global picture includes extreme outliers.