Overview
We report gene set enrichment analysis of the topics from Jason’s NMF and SNMF of the Deng et al. data set.
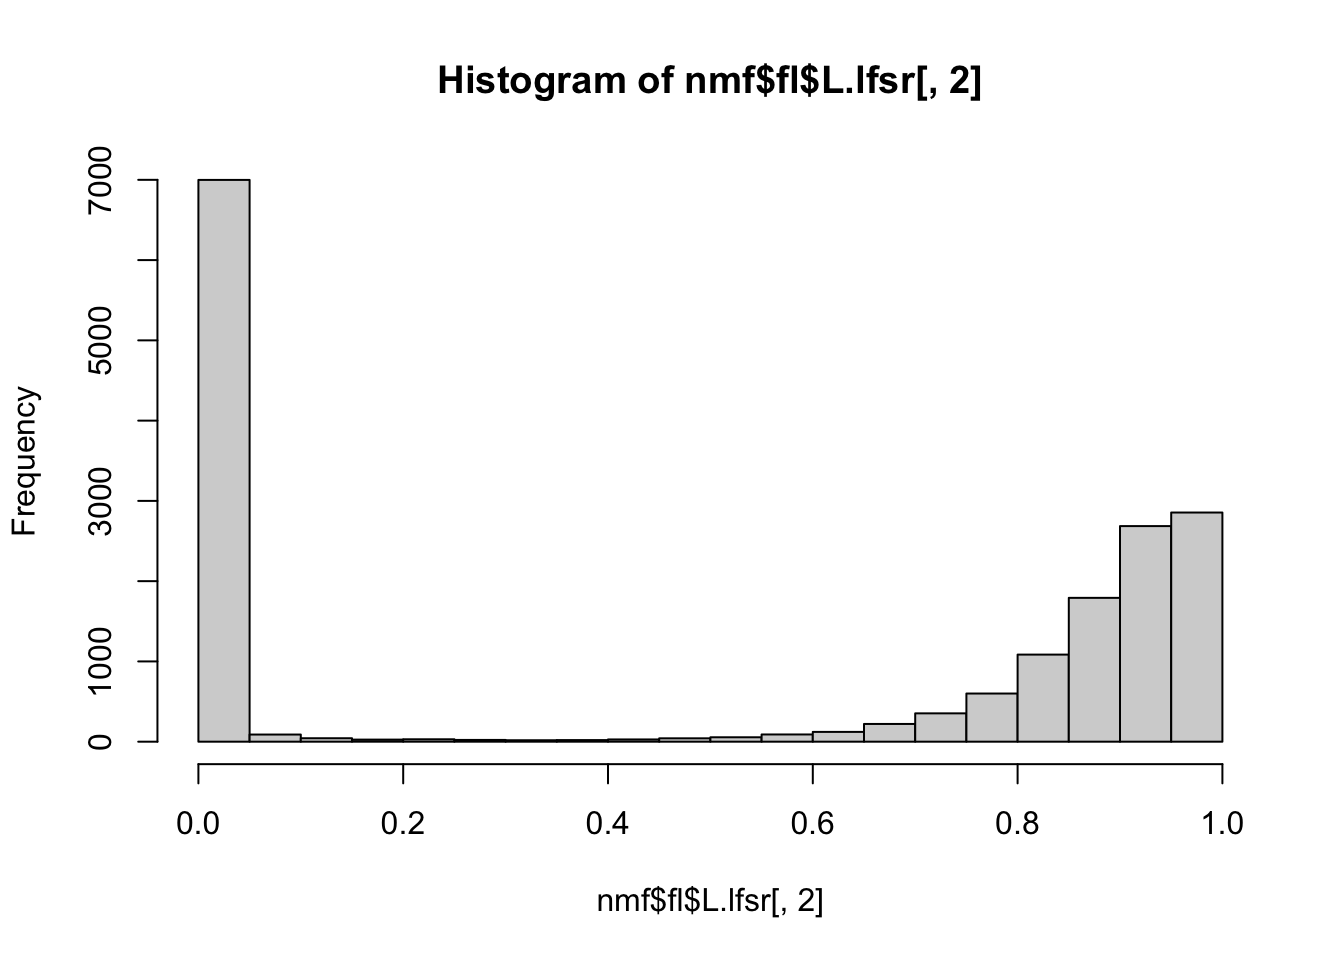
For each topic we construct a binary gene list by thresholding on local false sign rates output from flash. Here, I pick \(lfsr} <- 1e-5\) .
#library(GSEABenchmarkeR)
#library(EnrichmentBrowser)
library(susieR)
library(DT)
library(kableExtra)
library(tidyverse)
library(Matrix)


source('code/load_gene_sets.R')
source('code/utils.R')
source('code/logistic_susie_vb.R')
source('code/susie_gsea_queries.R')
source('code/html_tables.R')

#source('code/latent_logistic_susie.R')
# load nmf models
nmf <- readRDS('data/deng/nmf.rds')
snmf <- readRDS('data/deng/snmf.rds')
# load genesets
gobp <- loadGeneSetX('geneontology_Biological_Process', min.size=50) # just huge number of gene sets
#gobp_nr <- loadGeneSetX('geneontology_Biological_Process_noRedundant', min.size=1)
gomf <- loadGeneSetX('geneontology_Molecular_Function', min.size=1)
kegg <- loadGeneSetX('pathway_KEGG', min.size=1)
#reactome <- loadGeneSetX('pathway_Reactome', min.size=1)
#wikipathway_cancer <- loadGeneSetX('pathway_Wikipathway_cancer', min.size=1)
#wikipathway <- loadGeneSetX('pathway_Wikipathway', min.size=1)
genesets <- list(
gobp=gobp,
#gobp_nr=gobp_nr,
gomf=gomf,
kegg=kegg
#reactome=reactome,
#wikipathway_cancer=wikipathway_cancer,
#wikipathway=wikipathway
)convert_labels <- function(y, from='SYMBOL', to='ENTREZID'){
hs <- org.Hs.eg.db::org.Hs.eg.db
gene_symbols <- names(y)
if(from == 'SYMBOL'){
gene_symbols <- purrr::map_chr(gene_symbols, toupper)
names(y) <- gene_symbols
}
symbol2entrez <- AnnotationDbi::select(hs, keys=gene_symbols, columns=c(to, from), keytype = from)
symbol2entrez <- symbol2entrez[!duplicated(symbol2entrez[[from]]),]
symbol2entrez <- symbol2entrez[!is.na(symbol2entrez[[to]]),]
symbol2entrez <- symbol2entrez[!is.na(symbol2entrez[[from]]),]
rownames(symbol2entrez) <- symbol2entrez[[from]]
ysub <- y[names(y) %in% symbol2entrez[[from]]]
names(ysub) <- symbol2entrez[names(ysub),][[to]]
return(ysub)
}
convert_labels = partial(convert_labels, from='SYMBOL')
#' makes a binary with threshold, convert labels
get_y = function(L, thresh){
y <- convert_labels(L <= thresh) %>%
{mode(.) <- "integer"; .}
return(y)
}#' fit logistic susie, and hypergeometric test
do_logistic_susie = function(y, db, susie.args=NULL){
gs <- genesets[[db]]
u <- process_input(gs$X, y) # subset to common genes
if(is.null(susie.args)){
susie.args = list(
L=10, init.intercept=0, verbose=1, maxit=100, standardize=TRUE)
}
logistic.susie(u$X, u$y, L=1)
vb.fit <- exec(logistic.susie, u$X, u$y, !!!susie.args)
#' hypergeometric test
ora <- tibble(
geneSet = colnames(u$X),
geneListSize = sum(u$y),
geneSetSize = colSums(u$X),
overlap = (u$y %*% u$X)[1,],
nGenes = length(u$y),
propInList = overlap / geneListSize,
propInSet = overlap / geneSetSize,
oddsRatio = (overlap / (geneListSize - overlap)) / (
(geneSetSize - overlap) / (nGenes - geneSetSize + overlap)),
pValueHypergeometric = phyper(
overlap-1, geneListSize, nGenes - geneListSize, geneSetSize, lower.tail= FALSE),
db = db
) %>%
left_join(gs$geneSet$geneSetDes)
return(list(fit = vb.fit, ora = ora, db=db))
}
get_credible_set_summary = function(res){
gs <- genesets[[res$db]]
#' report top 50 elements in cs
beta <- t(res$fit$mu) %>%
data.frame() %>%
rownames_to_column(var='geneSet') %>%
rename_with(~str_replace(., 'X', 'L')) %>%
rename(L1 = 2) %>% # rename deals with L=1 case
pivot_longer(starts_with('L'), names_to='component', values_to = 'beta')
se <- t(sqrt(res$fit$mu2 - res$fit$mu^2)) %>%
data.frame() %>%
rownames_to_column(var='geneSet') %>%
rename_with(~str_replace(., 'X', 'L')) %>%
rename(L1 = 2) %>% # rename deals with L=1 case
pivot_longer(starts_with('L'), names_to='component', values_to = 'beta.se')
credible.set.summary <- t(res$fit$alpha) %>%
data.frame() %>%
rownames_to_column(var='geneSet') %>%
rename_with(~str_replace(., 'X', 'L')) %>%
rename(L1 = 2) %>% # rename deals with L=1 case
pivot_longer(starts_with('L'), names_to='component', values_to = 'alpha') %>%
left_join(beta) %>%
left_join(se) %>%
arrange(component, desc(alpha)) %>%
dplyr::group_by(component) %>%
filter(row_number() < 50) %>%
mutate(alpha_rank = row_number(), cumalpha = c(0, head(cumsum(alpha), -1))) %>%
mutate(in_cs = cumalpha < 0.95) %>%
mutate(active_cs = component %in% names(res$fit$sets$cs)) %>%
left_join(res$ora) %>%
left_join(gs$geneSet$geneSetDes)
return(credible.set.summary)
}
get_gene_set_summary = function(res){
gs <- genesets[[res$db]]
#' map each gene set to the component with top alpha
#' report pip
res$fit$pip %>%
as_tibble(rownames='geneSet') %>%
rename(pip=value) %>%
mutate(beta=colSums(res$fit$alpha * res$fit$mu)) %>%
left_join(res$ora) %>%
left_join(gs$geneSet$geneSetDes)
}
pack_group = function(tbl){
components <- tbl$component
unique.components <- unique(components)
start <- match(unique.components, components)
end <- c(tail(start, -1) - 1, length(components))
res <- tbl %>% select(-c(component)) %>% kbl()
for(i in 1:length(unique.components)){
res <- pack_rows(res, unique.components[i], start[i], end[i])
}
return(res)
}
report_susie_credible_sets = function(tbl,
target_coverage=0.95,
max_coverage=0.99,
max_sets=10){
tbl_filtered <-
tbl %>%
group_by(db, component) %>%
arrange(db, component, desc(alpha)) %>%
filter(cumalpha <= max_coverage, alpha_rank <= max_sets) %>%
mutate(in_cs = cumalpha <= target_coverage) %>% ungroup()
tbl_filtered %>%
select(component, geneSet, description, alpha, beta, beta.se, pValueHypergeometric, overlap, geneSetSize, oddsRatio) %>%
dplyr::mutate_if(is.numeric, funs(as.character(signif(., 3)))) %>%
pack_group %>%
column_spec(c(4), color=ifelse(tbl_filtered$beta >0, 'green', 'red')) %>%
kableExtra::kable_styling()
}
NMF
ix  <- order(nmf$fl$pve[-1], decreasing = T) + 1  # exclude first topic
Y <- purrr::map(ix[1:5], ~get_y(nmf$fl$L.lfsr[,.x], 1e-5))
names(Y) = paste0('topic_', ix[1:5])

nmf.gobp <- xfun::cache_rds({
  susie.args <- list(L=10, maxit=200, verbose=T)
  purrr::map(Y, ~do_logistic_susie(.x, 'gobp', susie.args = susie.args))},
  dir = 'cache/deng_example/', file='nmf.gobp')

nmf.gomf <- xfun::cache_rds({
  susie.args <- list(L=10, maxit=200, verbose=T)
  purrr::map(Y, ~do_logistic_susie(.x, 'gomf', susie.args = susie.args))},
  dir = 'cache/deng_example/', file='nmf.gomf')

nmf.kegg <- xfun::cache_rds({
  susie.args <- list(L=10, maxit=200, verbose=T)
  purrr::map(Y, ~do_logistic_susie(.x, 'kegg', susie.args = susie.args))},
  dir = 'cache/deng_example/', file='nmf.kegg')

remove(nmf.fits)
nmf.fits <- mget(ls(pattern='^nmf.+'))
names(nmf.fits) <- purrr::map_chr(names(nmf.fits), ~str_split(.x, '\\.')[[1]][2])
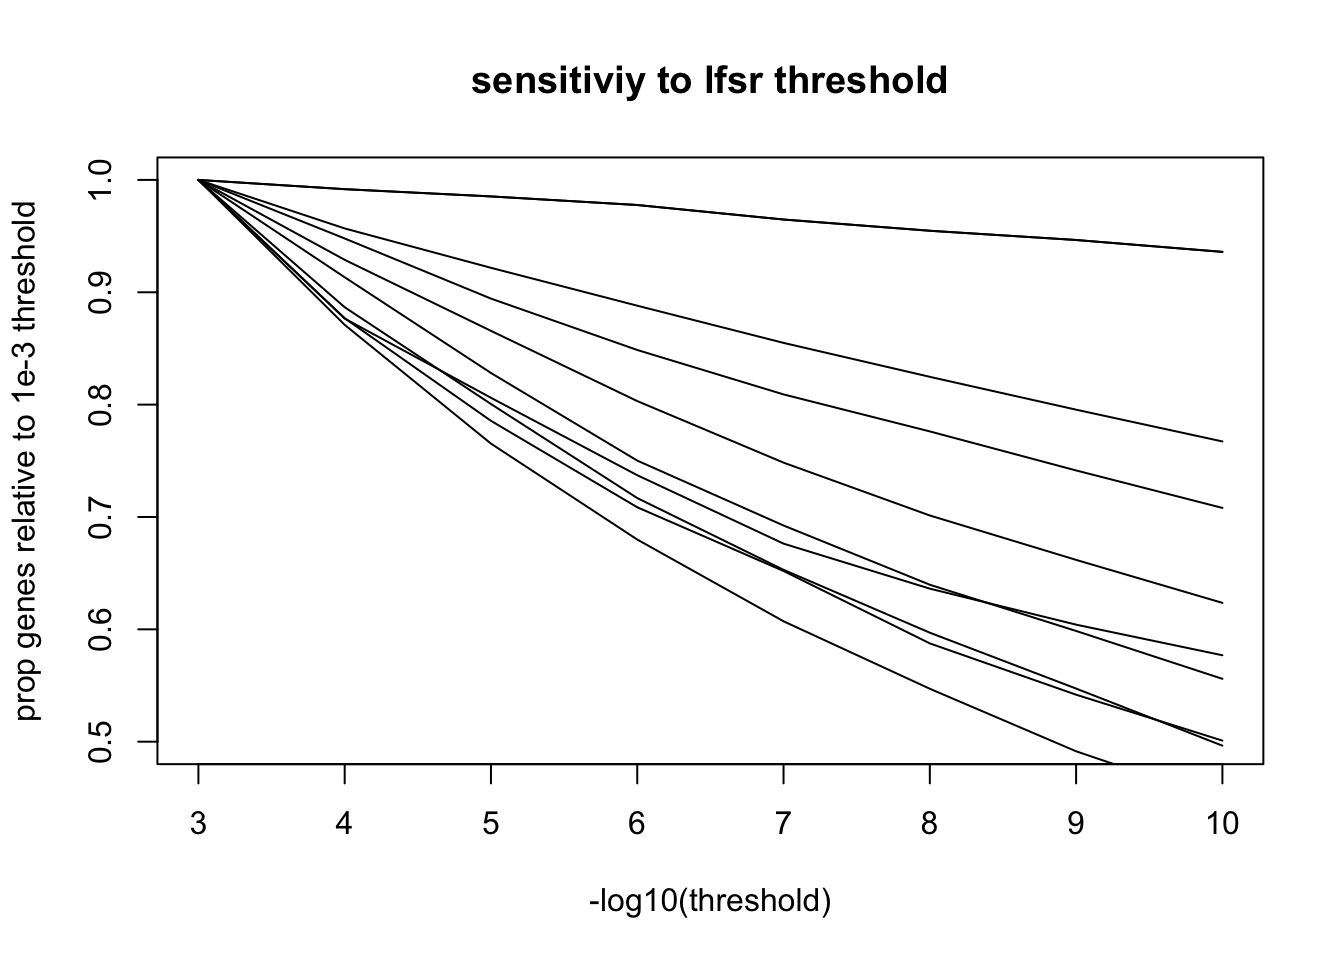
Thresholds
mean.gene.prop = function(l){
  purrr::map_dbl(3:10, ~get_y(l, 10^(-.x)) %>% mean())
}

y.mean.thresh <- purrr::map(2:10, ~mean.gene.prop(nmf$fl$L.lfsr[,.x]))

plot(3:10, y.mean.thresh[[2]]/y.mean.thresh[[2]][1],
  type='line',
  ylim = c(0.5, 1),
  main = 'sensitiviy to lfsr threshold',
  ylab = 'prop genes relative to 1e-3 threshold',
  xlab = '-log10(threshold)')

for(i in 1:length(y.mean.thresh)){
  lines(3:10, y.mean.thresh[[i]]/y.mean.thresh[[i]][1])
}
library(htmltools)

make_susie_html_table = function(fits, db, topic){
  fits %>%
    pluck(db) %>%
    pluck(topic) %>%
    get_credible_set_summary() %>%
    filter(active_cs, in_cs) %>%
    report_susie_credible_sets(target_coverage = 0.95, max_coverage = 0.95)
}

possibly_make_susie_html_table = possibly(
  make_susie_html_table, otherwise="nothing to report...")

for(topic in names(Y)){
  cat("\n")
  cat("###", topic, "\n") # Create second level headings with the names.

  for(db in names(genesets)){
    cat("####", db, "\n") # Create second level headings with the names.
    possibly_make_susie_html_table(nmf.fits, db, topic) %>% print()
    cat("\n")
  }
}
topic_3
gobp
geneSet
description
alpha
beta
beta.se
pValueHypergeometric
overlap
geneSetSize
oddsRatio
L1
GO:0032501
multicellular organismal process
1
-0.212
0.0164
1
511
5120
0.721
L10
GO:0006283
transcription-coupled nucleotide-excision repair
0.997
0.124
0.0188
4.01e-10
31
70
5.91
L2
GO:0006412
translation
1
0.492
0.0194
2.15e-76
242
527
7.14
L3
GO:0006119
oxidative phosphorylation
0.868
0.265
0.0196
7.93e-38
65
88
21.5
GO:0042773
ATP synthesis coupled electron transport
0.0659
0.26
0.0195
1.52e-36
55
67
34.7
GO:0042775
mitochondrial ATP synthesis coupled electron transport
0.0659
0.26
0.0195
1.52e-36
55
67
34.7
L4
GO:0045047
protein targeting to ER
0.812
0.185
0.0212
1.49e-55
84
102
36
GO:0006613
cotranslational protein targeting to membrane
0.0844
0.181
0.0215
2.91e-55
81
96
41.5
GO:0072599
establishment of protein localization to endoplasmic reticulum
0.0827
0.179
0.0212
5.83e-53
84
106
29.4
L5
GO:0006457
protein folding
1
0.136
0.019
2.38e-12
61
179
3.89
L6
GO:0006417
regulation of translation
1
-0.261
0.0197
8.31e-07
69
284
2.41
L7
GO:0070585
protein localization to mitochondrion
0.94
0.17
0.0188
7.31e-17
53
117
6.23
GO:0072655
establishment of protein localization to mitochondrion
0.0589
0.164
0.0188
8.37e-16
51
115
5.98
L8
GO:0022613
ribonucleoprotein complex biogenesis
1
0.158
0.0193
2.08e-29
140
391
4.37
L9
GO:0043312
neutrophil degranulation
0.398
0.168
0.0192
2.63e-10
96
374
2.62
GO:0002283
neutrophil activation involved in immune response
0.283
0.167
0.0192
3.59e-10
96
376
2.6
GO:0042119
neutrophil activation
0.141
0.166
0.0192
7.69e-10
96
381
2.56
GO:0036230
granulocyte activation
0.0839
0.165
0.0192
1.2e-09
96
384
2.53
GO:0002446
neutrophil mediated immunity
0.0607
0.164
0.0193
1.61e-09
96
386
2.51
gomf
geneSet
description
alpha
beta
beta.se
pValueHypergeometric
overlap
geneSetSize
oddsRatio
L1
GO:0003735
structural constituent of ribosome
1
0.387
0.0214
8.73e-99
135
152
63.8
L10
GO:0000981
DNA-binding transcription factor activity, RNA polymerase II-specific
0.975
-0.228
0.0224
1
52
927
0.418
L2
GO:0060089
molecular transducer activity
0.963
-0.306
0.0239
1
26
751
0.251
L3
GO:0003954
NADH dehydrogenase activity
0.333
0.238
0.0222
8.88e-26
33
36
82.6
GO:0008137
NADH dehydrogenase (ubiquinone) activity
0.333
0.238
0.0222
8.88e-26
33
36
82.6
GO:0050136
NADH dehydrogenase (quinone) activity
0.333
0.238
0.0222
8.88e-26
33
36
82.6
L4
GO:0008324
cation transmembrane transporter activity
0.989
-0.202
0.0232
1
33
487
0.525
L5
GO:0003723
RNA binding
1
0.264
0.0186
4.15e-64
408
1370
3.87
L6
GO:0004129
cytochrome-c oxidase activity
0.31
0.15
0.0189
7.66e-08
14
22
13
GO:0015002
heme-copper terminal oxidase activity
0.31
0.15
0.0189
7.66e-08
14
22
13
GO:0016676
oxidoreductase activity, acting on a heme group of donors, oxygen as acceptor
0.31
0.15
0.0189
7.66e-08
14
22
13
GO:0016675
oxidoreductase activity, acting on a heme group of donors
0.0691
0.147
0.019
1.71e-07
14
23
11.5
L7
GO:0045296
cadherin binding
1
0.166
0.0189
2.06e-19
97
282
4.04
L8
GO:0004298
threonine-type endopeptidase activity
0.5
0.117
0.019
2.28e-09
15
21
18.6
GO:0070003
threonine-type peptidase activity
0.5
0.117
0.019
2.28e-09
15
21
18.6
L9
GO:0016679
oxidoreductase activity, acting on diphenols and related substances as donors
0.331
0.161
0.0282
8.49e-07
7
7
Inf
GO:0008121
ubiquinol-cytochrome-c reductase activity
0.331
0.161
0.0282
8.49e-07
7
7
Inf
GO:0016681
oxidoreductase activity, acting on diphenols and related substances as donors, cytochrome as acceptor
0.331
0.161
0.0282
8.49e-07
7
7
Inf
kegg
geneSet
description
alpha
beta
beta.se
pValueHypergeometric
overlap
geneSetSize
oddsRatio
L1
hsa03010
Ribosome
1
0.611
0.0316
2.05e-74
116
129
57.6
L10
hsa04080
Neuroactive ligand-receptor interaction
1
-0.529
0.0422
1
1
163
0.034
L2
hsa00190
Oxidative phosphorylation
0.999
0.221
0.0282
2.01e-29
67
97
13.6
L4
hsa03050
Proteasome
1
0.303
0.0297
1.74e-20
36
44
26.5
L5
hsa05130
Pathogenic Escherichia coli infection
0.983
0.133
0.0271
0.000136
19
46
4.05
L6
hsa03040
Spliceosome
1
0.185
0.0272
5.23e-07
44
121
3.35
L7
hsa04010
MAPK signaling pathway
1
-0.208
0.0331
1
15
257
0.341
L8
hsa05016
Huntington disease
1
0.234
0.0279
4.04e-28
84
146
8.34
L9
hsa04060
Cytokine-cytokine receptor interaction
1
-0.385
0.0387
1
3
173
0.0972
topic_17
gobp
geneSet
description
alpha
beta
beta.se
pValueHypergeometric
overlap
geneSetSize
oddsRatio
L1
GO:0006457
protein folding
1
0.145
0.0194
5.85e-10
49
179
3.56
L10
GO:0043933
protein-containing complex subunit organization
1
0.246
0.0189
2.02e-36
349
1710
2.86
L2
GO:0022613
ribonucleoprotein complex biogenesis
1
0.173
0.0185
8.38e-51
154
391
6.65
L3
GO:0042327
positive regulation of phosphorylation
0.406
-0.181
0.0228
1
45
797
0.532
GO:0010562
positive regulation of phosphorus metabolic process
0.264
-0.179
0.0226
1
50
851
0.555
GO:0045937
positive regulation of phosphate metabolic process
0.264
-0.179
0.0226
1
50
851
0.555
GO:0001934
positive regulation of protein phosphorylation
0.065
-0.176
0.0228
1
42
759
0.522
L4
GO:0034641
cellular nitrogen compound metabolic process
1
0.415
0.016
3.15e-67
798
4670
3.39
L6
GO:0071426
ribonucleoprotein complex export from nucleus
0.633
0.142
0.0188
3.47e-22
54
117
8.17
GO:0071166
ribonucleoprotein complex localization
0.255
0.139
0.0188
5.74e-22
54
118
8.04
GO:0006405
RNA export from nucleus
0.0365
0.135
0.0189
2.43e-21
55
125
7.49
GO:0006406
mRNA export from nucleus
0.0268
0.133
0.0188
1.04e-16
43
99
7.26
L7
GO:0043687
post-translational protein modification
1
0.177
0.0197
1.62e-09
70
310
2.77
L8
GO:0032501
multicellular organismal process
1
-0.289
0.0171
1
402
5120
0.68
L9
GO:0006259
DNA metabolic process
1
0.136
0.019
6.05e-31
197
794
3.4
gomf
geneSet
description
alpha
beta
beta.se
pValueHypergeometric
overlap
geneSetSize
oddsRatio
L1
GO:0003723
RNA binding
1
0.419
0.0182
1.22e-87
396
1370
4.92
L2
GO:0022857
transmembrane transporter activity
0.907
-0.157
0.0233
1
32
779
0.374
GO:0015075
ion transmembrane transporter activity
0.0444
-0.147
0.0235
1
26
660
0.36
L3
GO:0038023
signaling receptor activity
1
-0.437
0.0263
1
11
697
0.138
L4
GO:0046872
metal ion binding
0.821
-0.157
0.0196
1
227
2810
0.756
GO:0043169
cation binding
0.179
-0.153
0.0196
1
234
2870
0.765
L5
GO:0051082
unfolded protein binding
0.999
0.109
0.0187
4.98e-12
37
99
5.56
L6
GO:0030545
receptor regulator activity
0.998
-0.326
0.0268
1
4
281
0.129
L7
GO:0005515
protein binding
1
0.321
0.0109
5.13e-26
1100
8650
3.27
L8
GO:0036402
proteasome-activating ATPase activity
0.977
0.138
0.0272
1.75e-06
6
6
Inf
L9
GO:0004298
threonine-type endopeptidase activity
0.494
0.0952
0.0185
3.4e-07
12
21
12.2
GO:0070003
threonine-type peptidase activity
0.494
0.0952
0.0185
3.4e-07
12
21
12.2
kegg
geneSet
description
alpha
beta
beta.se
pValueHypergeometric
overlap
geneSetSize
oddsRatio
L1
hsa05200
Pathways in cancer
0.999
-0.192
0.0327
1
28
451
0.475
L10
hsa05016
Huntington disease
0.996
0.156
0.0285
0.000653
34
146
2.34
L2
hsa03013
RNA transport
1
0.283
0.0274
4.21e-23
66
139
7.35
L3
hsa03040
Spliceosome
1
0.302
0.0272
2.62e-22
60
121
7.94
L4
hsa05142
Chagas disease (American trypanosomiasis)
1
-0.237
0.0398
1
1
84
0.0889
L5
hsa03050
Proteasome
1
0.27
0.028
6.25e-17
30
44
16.7
L6
hsa04110
Cell cycle
1
0.24
0.0278
6.64e-09
40
118
4.01
L7
hsa01200
Carbon metabolism
1
0.194
0.0275
1.72e-07
33
98
3.93
L8
hsa03008
Ribosome biogenesis in eukaryotes
1
0.177
0.0276
7.18e-11
31
68
6.51
L9
hsa03420
Nucleotide excision repair
0.984
0.142
0.0274
1.62e-05
17
43
4.99
topic_4
gobp
geneSet
description
alpha
beta
beta.se
pValueHypergeometric
overlap
geneSetSize
oddsRatio
L1
GO:0006396
RNA processing
1
0.254
0.0189
4.54e-81
539
757
7.24
L10
GO:0098781
ncRNA transcription
0.971
0.139
0.0202
4.39e-17
72
88
12
L2
GO:0032501
multicellular organismal process
1
-0.219
0.0144
1
1600
5120
1.3
L3
GO:0051276
chromosome organization
1
0.212
0.0182
6.92e-48
562
924
4.51
L4
GO:0043604
amide biosynthetic process
0.883
0.182
0.0185
6.01e-31
390
651
4.2
GO:0006412
translation
0.0819
0.18
0.0187
4.87e-35
338
527
4.99
L5
GO:0042254
ribosome biogenesis
1
0.217
0.021
2.93e-58
215
247
18.5
L6
GO:0070647
protein modification by small protein conjugation or removal
1
0.184
0.018
2.62e-27
486
876
3.54
L7
GO:0046907
intracellular transport
0.999
0.213
0.0176
2.28e-23
753
1510
2.93
L8
GO:0051049
regulation of transport
0.926
-0.138
0.0181
1
414
1380
1.14
GO:0032879
regulation of localization
0.0714
-0.127
0.0174
1
629
2050
1.19
L9
GO:0007049
cell cycle
1
0.186
0.0176
9.91e-40
776
1430
3.55
gomf
geneSet
description
alpha
beta
beta.se
pValueHypergeometric
overlap
geneSetSize
oddsRatio
L1
GO:0003723
RNA binding
1
0.281
0.0178
1.45e-88
865
1370
5.35
L10
GO:0005515
protein binding
1
0.191
0.00958
4.41e-21
3530
8650
4.81
L2
GO:0004888
transmembrane signaling receptor activity
1
-0.291
0.0209
1
62
527
0.339
L3
GO:0022803
passive transmembrane transporter activity
0.522
-0.187
0.0208
1
41
324
0.373
GO:0015267
channel activity
0.414
-0.187
0.0208
1
41
323
0.374
GO:0022838
substrate-specific channel activity
0.0368
-0.181
0.0209
1
38
304
0.368
L4
GO:0030545
receptor regulator activity
0.949
-0.204
0.0204
1
41
281
0.441
GO:0048018
receptor ligand activity
0.0507
-0.199
0.0205
1
37
258
0.433
L5
GO:0005509
calcium ion binding
1
-0.142
0.0194
1
103
491
0.686
L6
GO:0140098
catalytic activity, acting on RNA
0.998
0.131
0.0188
2.88e-25
184
265
6.15
L7
GO:0003735
structural constituent of ribosome
1
0.129
0.0195
2.8e-23
118
152
9.28
L8
GO:0005201
extracellular matrix structural constituent
1
-0.176
0.0221
1
10
124
0.227
L9
GO:0042393
histone binding
0.955
0.111
0.0185
3.24e-13
108
163
5.23
kegg
geneSet
description
alpha
beta
beta.se
pValueHypergeometric
overlap
geneSetSize
oddsRatio
L1
hsa03010
Ribosome
1
0.302
0.029
1.3e-22
104
129
11.2
L10
hsa00982
Drug metabolism
0.998
-0.211
0.0355
1
1
34
0.0774
L2
hsa04080
Neuroactive ligand-receptor interaction
1
-0.364
0.0334
1
10
163
0.164
L3
hsa03008
Ribosome biogenesis in eukaryotes
1
0.26
0.0312
2.69e-17
60
68
19.8
L4
hsa04060
Cytokine-cytokine receptor interaction
1
-0.218
0.03
1
24
173
0.407
L5
hsa03013
RNA transport
1
0.209
0.0283
7.47e-17
102
139
7.39
L6
hsa03040
Spliceosome
1
0.2
0.0278
4.52e-13
86
121
6.54
L7
hsa04110
Cell cycle
0.997
0.157
0.027
1.13e-07
74
118
4.44
L8
hsa03020
RNA polymerase
1
0.211
0.0326
7.34e-09
25
27
32.5
topic_7
gobp
geneSet
description
alpha
beta
beta.se
pValueHypergeometric
overlap
geneSetSize
oddsRatio
L1
GO:0098655
cation transmembrane transport
0.705
-0.129
0.019
1
138
616
0.737
GO:0006812
cation transport
0.227
-0.123
0.0187
1
204
836
0.825
GO:0098660
inorganic ion transmembrane transport
0.026
-0.118
0.0189
1
142
608
0.78
L10
GO:0044281
small molecule metabolic process
0.995
0.132
0.0173
3.04e-06
676
1540
2.21
L2
GO:0006396
RNA processing
1
0.229
0.0181
5.66e-39
465
757
4.47
L3
GO:0007049
cell cycle
0.998
0.164
0.0175
2.4e-36
774
1430
3.46
L4
GO:0032501
multicellular organismal process
1
-0.213
0.0143
1
1660
5120
1.37
L5
GO:0006996
organelle organization
1
0.214
0.0161
9.95e-38
1450
2980
3.13
L6
GO:0007186
G protein-coupled receptor signaling pathway
1
-0.177
0.0197
1
104
572
0.564
L7
GO:0033554
cellular response to stress
0.987
0.134
0.0174
1.5e-20
772
1560
2.84
L8
GO:0007155
cell adhesion
0.593
-0.108
0.0183
1
282
1050
0.95
GO:0022610
biological adhesion
0.395
-0.107
0.0183
1
285
1050
0.957
L9
GO:0010469
regulation of signaling receptor activity
1
-0.13
0.02
1
56
330
0.522
gomf
geneSet
description
alpha
beta
beta.se
pValueHypergeometric
overlap
geneSetSize
oddsRatio
L1
GO:0004888
transmembrane signaling receptor activity
1
-0.273
0.0206
1
70
527
0.384
L10
GO:0005515
protein binding
1
0.193
0.00954
1.12e-16
3560
8650
4.68
L2
GO:0003723
RNA binding
1
0.213
0.0175
1.17e-35
745
1370
3.49
L3
GO:0005261
cation channel activity
0.962
-0.181
0.0214
1
24
231
0.294
L4
GO:0048018
receptor ligand activity
0.985
-0.217
0.0208
1
33
258
0.372
L6
GO:0005509
calcium ion binding
1
-0.15
0.0193
1
105
491
0.692
L7
GO:0003824
catalytic activity
1
0.197
0.0146
7.87e-32
2070
4550
3.12
kegg
geneSet
description
alpha
beta
beta.se
pValueHypergeometric
overlap
geneSetSize
oddsRatio
L1
hsa04060
Cytokine-cytokine receptor interaction
1
-0.348
0.032
1
15
173
0.231
L2
hsa04080
Neuroactive ligand-receptor interaction
1
-0.379
0.0331
1
11
163
0.176
L3
hsa03440
Homologous recombination
0.994
0.167
0.0307
1.72e-08
29
33
18.3
L5
hsa04610
Complement and coagulation cascades
1
-0.189
0.0325
1
4
52
0.206
L8
hsa04514
Cell adhesion molecules (CAMs)
0.982
-0.142
0.0289
1
17
95
0.539
topic_2
gobp
geneSet
description
alpha
beta
beta.se
pValueHypergeometric
overlap
geneSetSize
oddsRatio
L1
GO:0007049
cell cycle
0.999
0.142
0.0173
1.09e-27
698
1430
3.01
L10
GO:0050794
regulation of cellular process
0.995
0.15
0.0114
1.16e-27
2870
7290
3.65
L3
GO:0051641
cellular localization
0.999
0.123
0.0166
2.94e-16
1010
2350
2.46
L4
GO:0007264
small GTPase mediated signal transduction
0.986
0.109
0.018
1.48e-13
247
477
3.14
L6
GO:0070647
protein modification by small protein conjugation or removal
0.998
0.112
0.0177
1.21e-12
410
876
2.63
L7
GO:0032543
mitochondrial translation
0.632
-0.11
0.0205
1
14
119
0.372
GO:0140053
mitochondrial gene expression
0.343
-0.106
0.0203
1
19
139
0.441
gomf
geneSet
description
alpha
beta
beta.se
pValueHypergeometric
overlap
geneSetSize
oddsRatio
L1
GO:0022857
transmembrane transporter activity
0.82
-0.101
0.0183
1
204
779
0.984
GO:0005215
transporter activity
0.0939
-0.0929
0.0181
1
262
939
1.08
GO:0015318
inorganic molecular entity transmembrane transporter activity
0.0331
-0.0908
0.0185
1
160
612
0.982
GO:0015075
ion transmembrane transporter activity
0.0298
-0.0902
0.0185
1
175
660
1
L3
GO:0051020
GTPase binding
0.989
0.123
0.0179
4.93e-12
274
548
2.9
L4
GO:0140101
catalytic activity, acting on a tRNA
0.953
-0.101
0.0201
1
11
79
0.448
L5
GO:1901363
heterocyclic compound binding
0.841
0.138
0.0148
6.17e-09
1690
4300
2.34
GO:0097159
organic cyclic compound binding
0.159
0.134
0.0147
2.69e-08
1710
4360
2.33
L6
GO:0036459
thiol-dependent ubiquitinyl hydrolase activity
0.4
0.0992
0.0184
6.43e-08
58
91
4.93
GO:0101005
ubiquitinyl hydrolase activity
0.4
0.0992
0.0184
6.43e-08
58
91
4.93
GO:0019783
ubiquitin-like protein-specific protease activity
0.182
0.0965
0.0184
1.72e-07
62
101
4.46
L7
GO:0003735
structural constituent of ribosome
0.997
-0.109
0.0195
1
29
152
0.652
kegg
geneSet
description
alpha
beta
beta.se
pValueHypergeometric
overlap
geneSetSize
oddsRatio
L1
hsa01100
Metabolic pathways
1
-0.147
0.0251
1
293
1020
1.16
SNMF
ix  <- order(snmf$fl$pve[-1], decreasing = T) + 1  # exclude first topic
Y.snmf <- purrr::map(ix[1:5], ~get_y(snmf$fl$L.lfsr[,.x], 1e-5))
names(Y.snmf) = paste0('topic_', ix[1:5])

snmf.gobp <- xfun::cache_rds({
  susie.args <- list(L=10, maxit=200, verbose=T)
  purrr::map(Y.snmf, ~do_logistic_susie(.x, 'gobp', susie.args = susie.args))},
  dir = 'cache/deng_example/', file='snmf.gobp')

snmf.gomf <- xfun::cache_rds({
  susie.args <- list(L=10, maxit=200, verbose=T)
  purrr::map(Y.snmf, ~do_logistic_susie(.x, 'gomf', susie.args = susie.args))},
  dir = 'cache/deng_example/', file='snmf.gomf')

snmf.kegg <- xfun::cache_rds({
  susie.args <- list(L=10, maxit=200, verbose=T)
  purrr::map(Y.snmf, ~do_logistic_susie(.x, 'kegg', susie.args = susie.args))},
  dir = 'cache/deng_example/', file='snmf.kegg')

snmf.fits <- mget(ls(pattern='^snmf.+'))
names(snmf.fits) <- purrr::map_chr(names(snmf.fits), ~str_split(.x, '\\.')[[1]][2])
for(topic in names(Y.snmf)){
cat("\n")
cat("###", topic, "\n") # Create second level headings with the names.
for(db in names(genesets)){
cat("####", db, "\n") # Create second level headings with the names.
possibly_make_susie_html_table(snmf.fits, db, topic) %>% print()
cat("\n")
}
}
topic_2
gobp
geneSet
description
alpha
beta
beta.se
pValueHypergeometric
overlap
geneSetSize
oddsRatio
L1
GO:0006614
SRP-dependent cotranslational protein targeting to membrane
0.5
0.181
0.0203
1.52e-19
79
92
15.3
GO:0045047
protein targeting to ER
0.247
0.178
0.0202
3.53e-19
85
102
12.6
GO:0006613
cotranslational protein targeting to membrane
0.164
0.178
0.0203
5.19e-19
81
96
13.6
GO:0072599
establishment of protein localization to endoplasmic reticulum
0.0877
0.175
0.0201
9.61e-19
87
106
11.6
L3
GO:0042773
ATP synthesis coupled electron transport
0.43
0.0915
0.0186
7.01e-07
47
67
5.88
GO:0042775
mitochondrial ATP synthesis coupled electron transport
0.43
0.0915
0.0186
7.01e-07
47
67
5.88
GO:0006119
oxidative phosphorylation
0.0721
0.0841
0.0185
2.89e-06
57
88
4.6
GO:0022904
respiratory electron transport chain
0.0115
0.0763
0.0185
3.12e-05
52
83
4.2
GO:0045333
cellular respiration
0.0102
0.0751
0.0183
2.57e-05
83
145
3.36
gomf
geneSet
description
alpha
beta
beta.se
pValueHypergeometric
overlap
geneSetSize
oddsRatio
L1
GO:0003735
structural constituent of ribosome
1
0.2
0.0196
3.39e-23
121
152
9.88
kegg
geneSet
description
alpha
beta
beta.se
pValueHypergeometric
overlap
geneSetSize
oddsRatio
L1
hsa03010
Ribosome
1
0.315
0.0296
1.03e-23
108
129
13.1
L2
hsa05012
Parkinson disease
0.936
0.165
0.0274
5.98e-09
73
106
5.51
hsa05016
Huntington disease
0.0373
0.148
0.0271
1.55e-07
91
146
4.14
L4
hsa03050
Proteasome
0.998
0.144
0.0283
1.14e-06
34
44
8.36
topic_3
gobp
geneSet
description
alpha
beta
beta.se
pValueHypergeometric
overlap
geneSetSize
oddsRatio
L2
GO:0006613
cotranslational protein targeting to membrane
0.794
0.206
0.0196
9.16e-39
74
96
20.7
GO:0006614
SRP-dependent cotranslational protein targeting to membrane
0.206
0.204
0.0196
1.53e-38
72
92
22.2
L3
GO:0042773
ATP synthesis coupled electron transport
0.499
0.196
0.0191
3.66e-23
48
67
15.4
GO:0042775
mitochondrial ATP synthesis coupled electron transport
0.499
0.196
0.0191
3.66e-23
48
67
15.4
L5
GO:0070646
protein modification by small protein removal
0.838
0.127
0.0186
7.39e-13
88
249
3.35
GO:0016579
protein deubiquitination
0.162
0.123
0.0186
5.82e-12
82
233
3.33
L6
GO:0006412
translation
0.903
0.171
0.0188
2.82e-30
195
527
3.77
GO:0043043
peptide biosynthetic process
0.0812
0.166
0.0188
1.47e-28
196
545
3.6
L8
GO:0051276
chromosome organization
1
0.142
0.0186
8.88e-12
233
924
2.14
gomf
geneSet
description
alpha
beta
beta.se
pValueHypergeometric
overlap
geneSetSize
oddsRatio
L1
GO:0003735
structural constituent of ribosome
1
0.214
0.0188
1.65e-41
100
152
11.9
L10
GO:0004298
threonine-type endopeptidase activity
0.495
0.0958
0.0187
5.38e-07
14
21
11.9
GO:0070003
threonine-type peptidase activity
0.495
0.0958
0.0187
5.38e-07
14
21
11.9
L2
GO:0004888
transmembrane signaling receptor activity
1
-0.194
0.0222
1
34
527
0.397
L3
GO:0003954
NADH dehydrogenase activity
0.333
0.18
0.0203
4.05e-18
30
36
30
GO:0008137
NADH dehydrogenase (ubiquinone) activity
0.333
0.18
0.0203
4.05e-18
30
36
30
GO:0050136
NADH dehydrogenase (quinone) activity
0.333
0.18
0.0203
4.05e-18
30
36
30
L5
GO:0003723
RNA binding
1
0.179
0.0182
2.85e-31
392
1370
2.72
L6
GO:0031625
ubiquitin protein ligase binding
0.779
0.0988
0.0188
1.26e-07
77
257
2.59
GO:0044389
ubiquitin-like protein ligase binding
0.206
0.094
0.0189
6.36e-07
78
271
2.44
L8
GO:0016679
oxidoreductase activity, acting on diphenols and related substances as donors
0.333
0.152
0.0281
3.95e-06
7
7
Inf
GO:0008121
ubiquinol-cytochrome-c reductase activity
0.333
0.152
0.0281
3.95e-06
7
7
Inf
GO:0016681
oxidoreductase activity, acting on diphenols and related substances as donors, cytochrome as acceptor
0.333
0.152
0.0281
3.95e-06
7
7
Inf
L9
GO:0045296
cadherin binding
0.978
0.104
0.0187
7.64e-10
89
282
2.81
kegg
geneSet
description
alpha
beta
beta.se
pValueHypergeometric
overlap
geneSetSize
oddsRatio
L1
hsa03010
Ribosome
1
0.397
0.0279
5.06e-39
92
129
14.2
L2
hsa05012
Parkinson disease
1
0.331
0.0277
1.67e-28
72
106
11.9
L3
hsa04110
Cell cycle
0.997
0.149
0.0271
1.5e-05
42
118
2.98
L4
hsa03050
Proteasome
1
0.191
0.0273
6.79e-10
27
44
8.52
topic_9
gobp
geneSet
description
alpha
beta
beta.se
pValueHypergeometric
overlap
geneSetSize
oddsRatio
L4
GO:0006996
organelle organization
1
0.171
0.0166
2.85e-12
799
2980
1.94
L5
GO:0030154
cell differentiation
0.912
-0.105
0.017
1
587
3040
1.1
GO:0048869
cellular developmental process
0.0703
-0.097
0.0169
1
633
3180
1.15
L6
GO:0099537
trans-synaptic signaling
0.297
-0.125
0.0202
1
69
521
0.678
GO:0099536
synaptic signaling
0.248
-0.124
0.0202
1
70
526
0.682
GO:0007268
chemical synaptic transmission
0.228
-0.124
0.0202
1
68
514
0.677
GO:0098916
anterograde trans-synaptic signaling
0.228
-0.124
0.0202
1
68
514
0.677
L7
GO:0044281
small molecule metabolic process
1
0.156
0.0178
3.03e-12
449
1540
2.04
L8
GO:0006401
RNA catabolic process
0.737
0.111
0.0184
1.44e-08
110
304
2.62
GO:0006402
mRNA catabolic process
0.17
0.106
0.0184
5.48e-08
101
279
2.62
GO:0000184
nuclear-transcribed mRNA catabolic process, nonsense-mediated decay
0.0536
0.102
0.0185
3.35e-08
52
115
3.77
L9
GO:1990823
response to leukemia inhibitory factor
0.481
0.0885
0.0182
5.04e-07
41
89
3.89
GO:1990830
cellular response to leukemia inhibitory factor
0.481
0.0885
0.0182
5.04e-07
41
89
3.89
gomf
geneSet
description
alpha
beta
beta.se
pValueHypergeometric
overlap
geneSetSize
oddsRatio
L1
GO:0004888
transmembrane signaling receptor activity
0.675
-0.118
0.0202
1
66
527
0.633
GO:0038023
signaling receptor activity
0.313
-0.113
0.0198
1
97
697
0.715
L2
GO:0022836
gated channel activity
0.437
-0.115
0.0211
1
23
244
0.462
GO:0022839
ion gated channel activity
0.396
-0.115
0.0211
1
22
237
0.455
GO:0005216
ion channel activity
0.0914
-0.107
0.0207
1
32
295
0.54
GO:0022838
substrate-specific channel activity
0.0302
-0.103
0.0207
1
35
304
0.578
L4
GO:0003723
RNA binding
0.985
0.104
0.0178
1e-08
388
1370
1.92
kegg
geneSet
description
alpha
beta
beta.se
pValueHypergeometric
overlap
geneSetSize
oddsRatio
L4
hsa04080
Neuroactive ligand-receptor interaction
1
-0.231
0.0323
1
12
163
0.321
topic_10
gobp
geneSet
description
alpha
beta
beta.se
pValueHypergeometric
overlap
geneSetSize
oddsRatio
L1
GO:0043299
leukocyte degranulation
0.187
0.101
0.0188
4.82e-08
110
406
2.3
GO:0002446
neutrophil mediated immunity
0.175
0.101
0.0188
7.84e-08
105
386
2.31
GO:0002444
myeloid leukocyte mediated immunity
0.162
0.101
0.0188
7.17e-08
113
423
2.26
GO:0042119
neutrophil activation
0.11
0.0996
0.0188
1.46e-07
103
381
2.29
GO:0043312
neutrophil degranulation
0.0916
0.099
0.0188
2.04e-07
101
374
2.29
GO:0002275
myeloid cell activation involved in immune response
0.0789
0.0985
0.0188
1.45e-07
110
414
2.24
GO:0036230
granulocyte activation
0.0779
0.0984
0.0188
2.21e-07
103
384
2.27
GO:0002283
neutrophil activation involved in immune response
0.0739
0.0982
0.0188
2.69e-07
101
376
2.27
L3
GO:0006614
SRP-dependent cotranslational protein targeting to membrane
0.569
0.152
0.0184
3.34e-12
44
92
5.61
GO:0006613
cotranslational protein targeting to membrane
0.356
0.152
0.0185
4.59e-12
45
96
5.4
GO:0045047
protein targeting to ER
0.0686
0.149
0.0186
1.44e-11
46
102
5.03
L4
GO:0030029
actin filament-based process
0.987
0.161
0.0185
2.43e-17
183
609
2.74
L5
GO:0048013
ephrin receptor signaling pathway
0.978
0.0947
0.0184
2.73e-10
36
75
5.63
L6
GO:0006396
RNA processing
0.998
-0.133
0.0207
1
80
757
0.697
gomf
geneSet
description
alpha
beta
beta.se
pValueHypergeometric
overlap
geneSetSize
oddsRatio
L1
GO:0038023
signaling receptor activity
0.853
-0.125
0.0206
1
73
697
0.689
GO:0060089
molecular transducer activity
0.0922
-0.117
0.0205
1
84
751
0.744
GO:0004888
transmembrane signaling receptor activity
0.0545
-0.117
0.0208
1
52
527
0.647
L2
GO:0045296
cadherin binding
1
0.175
0.0184
3.57e-19
109
282
3.94
L3
GO:0140098
catalytic activity, acting on RNA
0.998
-0.121
0.0217
1
21
265
0.51
kegg
geneSet
description
alpha
beta
beta.se
pValueHypergeometric
overlap
geneSetSize
oddsRatio
L1
hsa04080
Neuroactive ligand-receptor interaction
1
-0.316
0.0359
1
5
163
0.165
L2
hsa04530
Tight junction
1
0.165
0.027
9.63e-10
58
144
3.76
L3
hsa03010
Ribosome
0.998
0.137
0.027
3.37e-06
46
129
3.05
L4
hsa05100
Bacterial invasion of epithelial cells
0.981
0.128
0.0269
1.53e-07
30
63
4.97
topic_8
gobp
geneSet
description
alpha
beta
beta.se
pValueHypergeometric
overlap
geneSetSize
oddsRatio
L2
GO:0006614
SRP-dependent cotranslational protein targeting to membrane
0.915
0.301
0.0206
4.41e-56
78
92
46.2
GO:0006613
cotranslational protein targeting to membrane
0.0843
0.298
0.0206
9.03e-55
79
96
38.6
L4
GO:0006414
translational elongation
0.909
0.148
0.0187
5.9e-14
48
121
5.32
GO:0070125
mitochondrial translational elongation
0.0517
0.14
0.0186
2.46e-12
37
86
6.07
L5
GO:0022613
ribonucleoprotein complex biogenesis
1
0.169
0.0192
9.1e-25
126
391
4
L6
GO:0022900
electron transport chain
1
0.145
0.0187
5.98e-11
49
147
4.04
L7
GO:2000145
regulation of cell motility
0.597
-0.126
0.0216
1
47
686
0.565
GO:0030334
regulation of cell migration
0.344
-0.124
0.0217
1
44
644
0.564
GO:0051270
regulation of cellular component movement
0.0298
-0.113
0.0215
1
58
749
0.647
L9
GO:0072655
establishment of protein localization to mitochondrion
0.453
0.117
0.0189
3.83e-08
37
115
3.8
GO:0070585
protein localization to mitochondrion
0.277
0.115
0.0189
6.36e-08
37
117
3.71
GO:0006626
protein targeting to mitochondrion
0.268
0.114
0.0188
2.5e-08
31
86
4.51
gomf
geneSet
description
alpha
beta
beta.se
pValueHypergeometric
overlap
geneSetSize
oddsRatio
L1
GO:0003735
structural constituent of ribosome
1
0.274
0.019
2.09e-60
106
152
19.5
L2
GO:0004888
transmembrane signaling receptor activity
1
-0.219
0.0235
1
22
527
0.333
L5
GO:0003723
RNA binding
1
0.189
0.0187
1.27e-32
322
1370
2.83
L7
GO:0003954
NADH dehydrogenase activity
0.325
0.106
0.0184
6.24e-08
18
36
7.96
GO:0008137
NADH dehydrogenase (ubiquinone) activity
0.325
0.106
0.0184
6.24e-08
18
36
7.96
GO:0050136
NADH dehydrogenase (quinone) activity
0.325
0.106
0.0184
6.24e-08
18
36
7.96
kegg
geneSet
description
alpha
beta
beta.se
pValueHypergeometric
overlap
geneSetSize
oddsRatio
L1
hsa03010
Ribosome
1
0.467
0.0284
3.24e-55
98
129
23.5
L4
hsa00190
Oxidative phosphorylation
0.992
0.208
0.0271
9.62e-11
41
97
5.01
L5
hsa04060
Cytokine-cytokine receptor interaction
1
-0.309
0.037
1
4
173
0.151
L6
hsa03013
RNA transport
0.998
0.14
0.0276
0.000144
38
139
2.54
L7
hsa03050
Proteasome
0.985
0.126
0.0271
0.000128
17
44
4.2
hist(nmf$fl$L.lfsr[,2])
sessionInfo()R version 4.1.2 (2021-11-01)
Platform: x86_64-apple-darwin17.0 (64-bit)
Running under: macOS Big Sur 10.16
Matrix products: default
BLAS: /Library/Frameworks/R.framework/Versions/4.1/Resources/lib/libRblas.0.dylib
LAPACK: /Library/Frameworks/R.framework/Versions/4.1/Resources/lib/libRlapack.dylib
locale:
[1] en_US.UTF-8/en_US.UTF-8/en_US.UTF-8/C/en_US.UTF-8/en_US.UTF-8
attached base packages:
[1] stats graphics grDevices datasets utils methods base
other attached packages:
[1] htmltools_0.5.2 Matrix_1.4-0 forcats_0.5.1 stringr_1.4.0
[5] dplyr_1.0.8 purrr_0.3.4 readr_2.1.2 tidyr_1.2.0
[9] tibble_3.1.6 ggplot2_3.3.5 tidyverse_1.3.1 kableExtra_1.3.4
[13] DT_0.21.2 susieR_0.11.92
loaded via a namespace (and not attached):
[1] colorspace_2.0-3 ellipsis_0.3.2 rprojroot_2.0.2
[4] XVector_0.34.0 fs_1.5.2 rstudioapi_0.13
[7] bit64_4.0.5 AnnotationDbi_1.56.2 fansi_1.0.2
[10] lubridate_1.8.0 xml2_1.3.3 codetools_0.2-18
[13] doParallel_1.0.17 cachem_1.0.6 knitr_1.38
[16] jsonlite_1.8.0 workflowr_1.7.0 apcluster_1.4.9
[19] WebGestaltR_0.4.4 broom_0.7.12 dbplyr_2.1.1
[22] png_0.1-7 BiocManager_1.30.16 compiler_4.1.2
[25] httr_1.4.2 backports_1.4.1 assertthat_0.2.1
[28] fastmap_1.1.0 cli_3.2.0 later_1.3.0
[31] tools_4.1.2 igraph_1.2.11 GenomeInfoDbData_1.2.7
[34] gtable_0.3.0 glue_1.6.2 doRNG_1.8.2
[37] Rcpp_1.0.8.2 Biobase_2.54.0 cellranger_1.1.0
[40] jquerylib_0.1.4 vctrs_0.3.8 Biostrings_2.62.0
[43] svglite_2.1.0 iterators_1.0.14 xfun_0.30
[46] rvest_1.0.2 lifecycle_1.0.1 irlba_2.3.5
[49] renv_0.15.4 rngtools_1.5.2 org.Hs.eg.db_3.14.0
[52] zlibbioc_1.40.0 scales_1.1.1 vroom_1.5.7
[55] hms_1.1.1 promises_1.2.0.1 parallel_4.1.2
[58] yaml_2.3.5 curl_4.3.2 memoise_2.0.1
[61] sass_0.4.0 reshape_0.8.8 stringi_1.7.6
[64] RSQLite_2.2.10 highr_0.9 S4Vectors_0.32.3
[67] foreach_1.5.2 BiocGenerics_0.40.0 GenomeInfoDb_1.30.1
[70] bitops_1.0-7 rlang_1.0.2 pkgconfig_2.0.3
[73] systemfonts_1.0.4 matrixStats_0.61.0 evaluate_0.15
[76] lattice_0.20-45 htmlwidgets_1.5.4 bit_4.0.4
[79] tidyselect_1.1.2 plyr_1.8.6 magrittr_2.0.2
[82] R6_2.5.1 IRanges_2.28.0 generics_0.1.2
[85] DBI_1.1.2 pillar_1.7.0 haven_2.4.3
[88] whisker_0.4 withr_2.5.0 KEGGREST_1.34.0
[91] RCurl_1.98-1.6 mixsqp_0.3-43 modelr_0.1.8
[94] crayon_1.5.0 utf8_1.2.2 tzdb_0.2.0
[97] rmarkdown_2.13 grid_4.1.2 readxl_1.3.1
[100] blob_1.2.2 git2r_0.29.0 reprex_2.0.1
[103] digest_0.6.29 webshot_0.5.2 httpuv_1.6.5
[106] stats4_4.1.2 munsell_0.5.0 viridisLite_0.4.0
[109] bslib_0.3.1