Single-cell PBMC Example
karltayeb
2022-03-16
Last updated: 2022-03-29
Checks: 7 0
Knit directory: logistic-susie-gsea/
This reproducible R Markdown analysis was created with workflowr (version 1.7.0). The Checks tab describes the reproducibility checks that were applied when the results were created. The Past versions tab lists the development history.
Great! Since the R Markdown file has been committed to the Git repository, you know the exact version of the code that produced these results.
Great job! The global environment was empty. Objects defined in the global environment can affect the analysis in your R Markdown file in unknown ways. For reproduciblity it’s best to always run the code in an empty environment.
The command set.seed(20220105) was run prior to running the code in the R Markdown file. Setting a seed ensures that any results that rely on randomness, e.g. subsampling or permutations, are reproducible.
Great job! Recording the operating system, R version, and package versions is critical for reproducibility.
Nice! There were no cached chunks for this analysis, so you can be confident that you successfully produced the results during this run.
Great job! Using relative paths to the files within your workflowr project makes it easier to run your code on other machines.
Great! You are using Git for version control. Tracking code development and connecting the code version to the results is critical for reproducibility.
The results in this page were generated with repository version 6143c44. See the Past versions tab to see a history of the changes made to the R Markdown and HTML files.
Note that you need to be careful to ensure that all relevant files for the analysis have been committed to Git prior to generating the results (you can use wflow_publish or wflow_git_commit). workflowr only checks the R Markdown file, but you know if there are other scripts or data files that it depends on. Below is the status of the Git repository when the results were generated:
Ignored files:
    Ignored:    .DS_Store
    Ignored:    .RData
    Ignored:    .Rhistory
    Ignored:    .Rproj.user/
    Ignored:    library/
    Ignored:    renv/library/
    Ignored:    renv/staging/
    Ignored:    staging/

Untracked files:
    Untracked:  _targets.R
    Untracked:  _targets.html
    Untracked:  _targets.md
    Untracked:  _targets/
    Untracked:  _targets_r/
    Untracked:  analysis/fetal_reference_cellid_gsea.Rmd
    Untracked:  analysis/fixed_intercept.Rmd
    Untracked:  analysis/iDEA_examples.Rmd
    Untracked:  analysis/latent_gene_list.Rmd
    Untracked:  analysis/latent_logistic_susie.Rmd
    Untracked:  analysis/libra_setup.Rmd
    Untracked:  analysis/linear_method_failure_modes.Rmd
    Untracked:  analysis/linear_regression_failure_regime.Rmd
    Untracked:  analysis/logistic_susie_veb_boost_vs_vb.Rmd
    Untracked:  analysis/references.bib
    Untracked:  analysis/simulations.Rmd
    Untracked:  analysis/test.Rmd
    Untracked:  analysis/wenhe_baboon_example.Rmd
    Untracked:  build_site.R
    Untracked:  cache/
    Untracked:  code/latent_logistic_susie.R
    Untracked:  code/marginal_sumstat_gsea_collapsed.R
    Untracked:  data/adipose_2yr_topsnp.txt
    Untracked:  data/fetal_reference_cellid_gene_sets.RData
    Untracked:  data/pbmc-purified/
    Untracked:  docs.zip
    Untracked:  index.md
    Untracked:  latent_logistic_susie_cache/
    Untracked:  simulation_targets/
    Untracked:  single_cell_pbmc_cache/
    Untracked:  summary_stat_gsea_exploration_cache/

Unstaged changes:
    Modified:   _simulation_targets.R
    Modified:   _targets.Rmd
    Modified:   analysis/gseabenchmark_tcga.Rmd
    Modified:   code/fit_baselines.R
    Modified:   code/fit_logistic_susie.R
    Modified:   code/fit_mr_ash.R
    Modified:   code/fit_susie.R
    Modified:   code/load_gene_sets.R
    Modified:   code/marginal_sumstat_gsea.R
    Modified:   code/simulate_gene_lists.R
    Modified:   code/utils.R
    Modified:   target_components/factories.R
    Modified:   target_components/methods.R
Note that any generated files, e.g. HTML, png, CSS, etc., are not included in this status report because it is ok for generated content to have uncommitted changes.
These are the previous versions of the repository in which changes were made to the R Markdown (analysis/single_cell_pbmc.Rmd) and HTML (docs/single_cell_pbmc.html) files. If you’ve configured a remote Git repository (see ?wflow_git_remote), click on the hyperlinks in the table below to view the files as they were in that past version.
| File | Version | Author | Date | Message |
|---|---|---|---|---|
| Rmd | 6143c44 | karltayeb | 2022-03-29 | wflow_publish(“analysis/single_cell_pbmc.Rmd”) |
| html | 56f8130 | karltayeb | 2022-03-29 | Build site. |
| html | a2bdb56 | karltayeb | 2022-03-29 | Build site. |
| Rmd | 122deec | karltayeb | 2022-03-29 | wflow_publish(pages) |
Introduction
Our goals here are to run Logistic SuSiE on differential expression results from TCGA. We want to assess:
- If the resulting enrichment results look good/interpretable across multiple/concatenated gene sets
- Assess sensitivity to a range of p-value thresholds
- Evaluate the potential of the summary stat latent model
library(GSEABenchmarkeR)
library(EnrichmentBrowser)
library(tidyverse)
library(susieR)
library(DT)
source('code/load_gene_sets.R')
source('code/utils.R')
source('code/logistic_susie_vb.R')
source('code/logistic_susie_veb_boost.R')
source('code/latent_logistic_susie.R')
Setup
Load Gene Sets
loadGeneSetX uniformly formats gene sets and generates the \(X\) matrix We can source any gene set from WebGestaltR::listGeneSet()
gs_list <- WebGestaltR::listGeneSet()
gobp <- loadGeneSetX('geneontology_Biological_Process', min.size=50)  # just huge number of gene sets
gobp_nr <- loadGeneSetX('geneontology_Biological_Process_noRedundant', min.size=1)
gomf <- loadGeneSetX('geneontology_Molecular_Function', min.size=1)
kegg <- loadGeneSetX('pathway_KEGG', min.size=1)
reactome <- loadGeneSetX('pathway_Reactome', min.size=1)
wikipathway_cancer <- loadGeneSetX('pathway_Wikipathway_cancer', min.size=1)
wikipathway <- loadGeneSetX('pathway_Wikipathway', min.size=1)

genesets <- list(
  gobp=gobp,
  gobp_nr=gobp_nr,
  gomf=gomf,
  kegg=kegg,
  reactome=reactome,
  wikipathway_cancer=wikipathway_cancer,
  wikipathway=wikipathway
)
load('data/pbmc-purified/deseq2-pbmc-purified.RData')
convert_labels <- function(y, from='SYMBOL', to='ENTREZID'){
hs <- org.Hs.eg.db::org.Hs.eg.db
gene_symbols <- names(y)
symbol2entrez <- AnnotationDbi::select(hs, keys=gene_symbols, columns=c(to, from), keytype = from)
symbol2entrez <- symbol2entrez[!duplicated(symbol2entrez[[from]]),]
symbol2entrez <- symbol2entrez[!is.na(symbol2entrez[[to]]),]
symbol2entrez <- symbol2entrez[!is.na(symbol2entrez[[from]]),]
rownames(symbol2entrez) <- symbol2entrez[[from]]
ysub <- y[names(y) %in% symbol2entrez[[from]]]
names(ysub) <- symbol2entrez[names(ysub),][[to]]
return(ysub)
}
par(mfrow=c(1,1))
deseq$`CD19+ B` %>% .$padj %>% hist(main='CD19+B p-values')Loading required package: DESeq2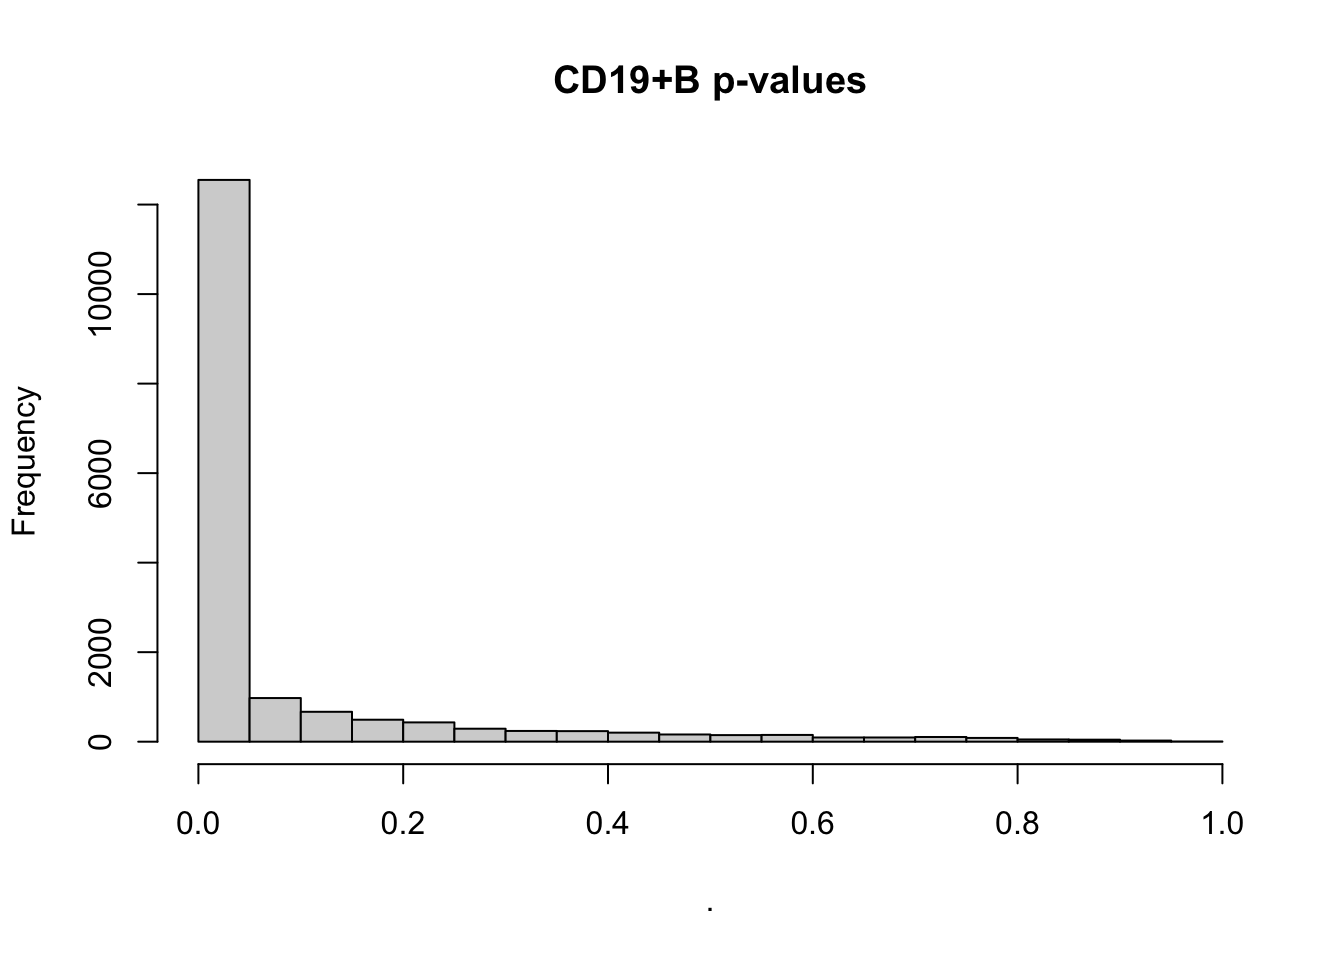
| Version | Author | Date |
|---|---|---|
| a2bdb56 | karltayeb | 2022-03-29 |
Fit logistic SuSiE
logistic_susie_driver = function(db, celltype, thresh){
  gs <- genesets[[db]]
  data <- deseq[[celltype]]

  # set up binary y
  y <- data %>%
    as.data.frame %>%
    rownames_to_column('gene') %>%
    dplyr::select(gene, padj) %>%
    filter(!is.na(padj)) %>%
    mutate(y = as.integer(padj < thresh)) %>%
    select(gene, y) %>%
    tibble2namedlist %>%
    convert_labels('ENSEMBL')

  u <- process_input(gs$X, y)  # subset to common genes
  vb.fit <- logistic.susie(  # fit model
    u$X, u$y, L=10, init.intercept = 0, verbose=1, maxit=100)

  # summarise results
  set.summary <- vb.fit$pip %>%
    as_tibble(rownames='geneSet') %>%
    rename(pip=value) %>%
    mutate(
      top_component = apply(vb.fit$alpha, 2, which.max),
      active_set = top_component %in% vb.fit$sets$cs_index,
      top_component = paste0('L', top_component),
      cs = purrr::map(top_component, ~tryCatch(
        colnames(gs$X)[get(.x, vb.fit$sets$cs)], error = function(e) list())),
      in_cs = geneSet %in% cs,
      beta = colSums(vb.fit$mu * vb.fit$alpha),
      geneListSize = sum(u$y),
      geneSetSize = colSums(u$X),
      overlap = (u$y %*% u$X)[1,],
      nGenes = length(u$y),
      propSetInList = overlap / geneSetSize,
      oddsRatio = (overlap / (geneListSize - overlap)) / (
        (geneSetSize - overlap) / (nGenes - geneSetSize + overlap)),
    pValueHypergeometric = phyper(
      overlap-1, geneListSize, nGenes, geneSetSize, lower.tail= FALSE),
    db = db,
    celltype = celltype,
    thresh = thresh
    ) %>% left_join(gs$geneSet$geneSetDes)
  return(list(fit = vb.fit, set.summary=set.summary))
}
For each celltype, we fit logistic SuSiE using multiple gene set sources at various threshold of padj.
celltypes <- names(deseq)
pthresh <- c(0.1, 0.01, 0.001, 0.0001, 0.00001, 0.000001)
db_name <- names(genesets)
crossed <- cross3(db_name, celltypes, pthresh)

pbmc_res <- xfun::cache_rds({
  res <- purrr::map(crossed, purrr::lift_dl(logistic_susie_driver))
  for (i in 1:length(res)){  # save some space
    res[[i]]$fit$dat <- NULL
  }
  res
  }, file = 'logistic_susie_pbmc_genesets_pthresh.rds'
)

pbmc_res_set_summary <- dplyr::bind_rows(purrr::map(pbmc_res, ~ pluck(.x, 'set.summary')))
Summary functions
Just a few functions to help streamline looking at output
pval_focussed_table = function(thresh=1e-3, filter_db=NULL, filter_celltype=NULL, top.n=50){
  pbmc_res_set_summary %>%
  filter(
    case_when(
      is.null(filter_db) ~ TRUE,
      !is.null(filter_db) ~ db %in% filter_db
    ) &
    thresh == thresh &
    case_when(
      is.null(filter_celltype) ~ TRUE,
      !is.null(filter_celltype) ~ celltype %in% filter_celltype
    )
  )  %>%
  dplyr::arrange(celltype, db, pValueHypergeometric) %>%
  group_by(celltype, db) %>% slice(1:top.n) %>%
  select(celltype, db, geneSet, description, pip, top_component, oddsRatio, propSetInList, pValueHypergeometric) %>%
  mutate_at(vars(celltype, db), factor) %>%
  datatable(filter = 'top')
}

set_focussed_table = function(thresh=1e-3, filter_db=NULL, filter_celltype=NULL){
  pbmc_res_set_summary %>%
  filter(
    case_when(
      is.null(filter_db) ~ TRUE,
      !is.null(filter_db) ~ db %in% filter_db
    ) &
    thresh == 1e-3 &
    in_cs & active_set &
    case_when(
      is.null(filter_celltype) ~ TRUE,
      !is.null(filter_celltype) ~ celltype %in% filter_celltype
    )
  )  %>%
  dplyr::arrange(celltype, db, desc(pip)) %>%
  select(celltype, db, geneSet, description, pip, top_component, oddsRatio, propSetInList, pValueHypergeometric) %>%
  mutate_at(vars(celltype, geneSet, db), factor) %>%
  datatable(filter = 'top')
}
Results/Explore enrichments
Our goal is to assess 1. The quality of the gene set enrichments we get from each celltype - do reported gene set enrichments seem celltype specific/celltype relevant? - how much “interesting” marginal enrichment do we fail to capture in the multivariate model - how sensitive are we to the choice of pvalue threshold
Results
Lets take a look at what enrichment we’re getting across cell-types.
CD19+ B
pbmc_res_set_summary %>%
  filter(active_set, in_cs, thresh == 1e-4, celltype == 'CD19+ B') %>%
  select(
    geneSet, description, top_component, pip,
    beta, geneListSize, geneSetSize, propSetInList, pValueHypergeometric)
# A tibble: 17 × 9
geneSet description top_component pip beta geneListSize geneSetSize
<chr> <chr> <chr> <dbl> <dbl> <int> <dbl>
1 GO:0001775 cell activa… L5 0.978 0.467 6911 1128
2 GO:0002376 immune syst… L1 1.00 0.508 6911 2228
3 GO:0045047 protein tar… L2 0.962 2.46 6911 105
4 GO:0002764 immune resp… L5 0.996 0.565 6327 411
5 GO:0009123 nucleoside … L4 0.984 0.742 6327 286
6 GO:0070972 protein loc… L2 1.00 1.63 6327 132
7 GO:0003723 RNA binding L1 1.00 0.353 6975 1483
8 GO:0000981 DNA-binding… L2 0.995 -0.657 6975 1161
9 GO:0003735 structural … L6 0.995 0.964 6975 152
10 hsa00190 Oxidative p… L1 0.998 1.46 3273 120
11 hsa03010 Ribosome L3 1.00 1.41 3273 129
12 hsa04640 Hematopoiet… L2 1.00 1.50 3273 80
13 R-HSA-168256 Immune Syst… L1 1 0.749 4620 1627
14 R-HSA-983168 Antigen pro… L5 0.997 -1.07 4620 280
15 WP619 Type II int… L1 1.00 2.49 966 30
16 WP111 Electron Tr… L2 1.00 1.64 3220 101
17 WP477 Cytoplasmic… L1 1.00 2.40 3220 85
# … with 2 more variables: propSetInList <dbl>, pValueHypergeometric <dbl>CD56+ NK
pbmc_res_set_summary %>%
  filter(active_set, in_cs, thresh == 1e-4, celltype == 'CD56+ NK') %>%
  select(
    geneSet, description, top_component, pip,
    beta, geneListSize, geneSetSize, propSetInList, pValueHypergeometric)
# A tibble: 16 × 9
geneSet description top_component pip beta geneListSize geneSetSize
<chr> <chr> <chr> <dbl> <dbl> <int> <dbl>
1 GO:0002376 immune sys… L1 1.00 0.653 7231 2228
2 GO:0006119 oxidative … L4 0.982 1.32 7231 118
3 GO:0006413 translatio… L2 0.995 1.16 6598 182
4 GO:0009123 nucleoside… L4 0.982 0.674 6598 286
5 GO:0042110 T cell act… L3 0.986 0.591 6598 389
6 GO:0042113 B cell act… L5 0.997 0.842 6598 198
7 GO:0000981 DNA-bindin… L2 0.997 -0.734 7305 1161
8 GO:0003735 structural… L1 1.00 1.90 7305 152
9 hsa03010 Ribosome L1 1.00 1.78 3406 129
10 hsa04640 Hematopoie… L3 0.998 1.31 3406 80
11 hsa05012 Parkinson … L2 1.00 1.56 3406 126
12 R-HSA-168256 Immune Sys… L1 1.00 0.689 4855 1627
13 R-HSA-8878171 Transcript… L5 0.971 0.966 4855 189
14 R-HSA-163200 Respirator… L4 0.993 1.32 4855 121
15 WP111 Electron T… L2 0.991 1.32 3316 101
16 WP477 Cytoplasmi… L1 1 2.97 3316 85
# … with 2 more variables: propSetInList <dbl>, pValueHypergeometric <dbl>T cell
pbmc_res_set_summary %>%
  filter(active_set, in_cs, thresh == 1e-4, celltype == 'T cell') %>%
  select(
    geneSet, description, top_component, pip,
    beta, geneListSize, geneSetSize, propSetInList, pValueHypergeometric)
# A tibble: 8 × 9
geneSet description top_component pip beta geneListSize geneSetSize
<chr> <chr> <chr> <dbl> <dbl> <int> <dbl>
1 GO:0001775 cell activat… L1 0.998 0.753 8802 1127
2 GO:0002376 immune syste… L5 0.998 0.424 8802 2227
3 GO:0006119 oxidative ph… L2 0.999 1.79 8802 118
4 GO:0042110 T cell activ… L2 1.00 0.921 7959 389
5 GO:0070972 protein loca… L3 1.00 1.33 7959 132
6 GO:0005515 protein bind… L1 1.00 0.370 8880 9033
7 hsa05010 Alzheimer di… L1 1.00 1.68 3983 154
8 R-HSA-6798695 Neutrophil d… L1 1.00 1.37 5790 431
# … with 2 more variables: propSetInList <dbl>, pValueHypergeometric <dbl>CD14+ Monocyte
pbmc_res_set_summary %>%
  filter(active_set, in_cs, thresh == 1e-4, celltype == 'CD14+ Monocyte') %>%
  select(
    geneSet, description, top_component, pip,
    beta, geneListSize, geneSetSize, propSetInList, pValueHypergeometric)
# A tibble: 17 × 9
geneSet description top_component pip beta geneListSize geneSetSize
<chr> <chr> <chr> <dbl> <dbl> <int> <dbl>
1 GO:0016192 vesicle-me… L4 0.985 0.324 6633 1605
2 GO:0006119 oxidative … L3 0.999 1.79 6633 118
3 GO:0006413 translatio… L2 1.00 1.21 6073 182
4 GO:0009123 nucleoside… L3 0.988 0.905 6073 286
5 GO:0036230 granulocyt… L1 0.976 1.17 6073 450
6 GO:0003723 RNA binding L1 1.00 0.416 6697 1480
7 GO:0000981 DNA-bindin… L2 1.00 -0.633 6697 1160
8 GO:0003735 structural… L4 1.00 1.61 6697 152
9 hsa03010 Ribosome L1 1.00 1.75 3110 129
10 hsa05012 Parkinson … L2 1.00 1.70 3110 125
11 R-HSA-6798695 Neutrophil… L1 1.00 1.21 4451 431
12 R-HSA-198933 Immunoregu… L6 0.997 1.19 4451 103
13 R-HSA-72766 Translation L2 1.00 1.66 4451 286
14 R-HSA-163200 Respirator… L3 1.00 1.71 4451 121
15 R-HSA-379726 Mitochondr… L7 0.997 -2.40 4451 21
16 WP111 Electron T… L2 1.00 1.76 3062 100
17 WP477 Cytoplasmi… L1 1.00 2.53 3062 85
# … with 2 more variables: propSetInList <dbl>, pValueHypergeometric <dbl>CD34+
pbmc_res_set_summary %>%
  filter(active_set, in_cs, thresh == 1e-4, celltype == 'CD34+') %>%
  select(
    geneSet, description, top_component, pip,
    beta, geneListSize, geneSetSize, propSetInList, pValueHypergeometric)
# A tibble: 13 × 9
geneSet description top_component pip beta geneListSize geneSetSize
<chr> <chr> <chr> <dbl> <dbl> <int> <dbl>
1 GO:0001775 cell activa… L1 0.987 0.731 8363 1128
2 GO:0006119 oxidative p… L3 0.999 1.56 8363 118
3 GO:0006413 translation… L2 1.00 1.07 7544 182
4 GO:0005515 protein bin… L2 1.00 0.337 8421 9031
5 GO:0003735 structural … L1 1.00 1.76 8421 152
6 hsa00190 Oxidative p… L1 0.992 1.51 3772 120
7 hsa03010 Ribosome L2 1.00 1.52 3772 129
8 R-HSA-6798695 Neutrophil … L2 0.986 0.779 5481 432
9 R-HSA-198933 Immunoregul… L4 1.00 1.43 5481 103
10 R-HSA-163200 Respiratory… L3 0.998 1.57 5481 121
11 R-HSA-72764 Eukaryotic … L1 0.993 3.41 5481 90
12 WP111 Electron Tr… L2 1.00 2.13 3698 101
13 WP477 Cytoplasmic… L1 1 3.25 3698 85
# … with 2 more variables: propSetInList <dbl>, pValueHypergeometric <dbl>knitr::knit_exit()