Clustering of TDP-HA experiment and the D96 samples
Katharina Hembach
28/01/2021
Last updated: 2021-03-11
Checks: 6 1
Knit directory: neural_scRNAseq/
This reproducible R Markdown analysis was created with workflowr (version 1.6.2). The Checks tab describes the reproducibility checks that were applied when the results were created. The Past versions tab lists the development history.
Great! Since the R Markdown file has been committed to the Git repository, you know the exact version of the code that produced these results.
Great job! The global environment was empty. Objects defined in the global environment can affect the analysis in your R Markdown file in unknown ways. For reproduciblity it's best to always run the code in an empty environment.
The command set.seed(20200522) was run prior to running the code in the R Markdown file. Setting a seed ensures that any results that rely on randomness, e.g. subsampling or permutations, are reproducible.
Great job! Recording the operating system, R version, and package versions is critical for reproducibility.
- clustering
- dimension-reduction
- dr-individual-clusters
- dr-plots
- DR-QC
- merge-so
- read-data
- session-info-chunk-inserted-by-workflowr
- unnamed-chunk-1
- unnamed-chunk-2
- unnamed-chunk-3
- unnamed-chunk-4
- variable-features-scaling
To ensure reproducibility of the results, delete the cache directory TDP-08-00-clustering-HA-D96_cache and re-run the analysis. To have workflowr automatically delete the cache directory prior to building the file, set delete_cache = TRUE when running wflow_build() or wflow_publish().
Great job! Using relative paths to the files within your workflowr project makes it easier to run your code on other machines.
Great! You are using Git for version control. Tracking code development and connecting the code version to the results is critical for reproducibility.
The results in this page were generated with repository version 864cc2d. See the Past versions tab to see a history of the changes made to the R Markdown and HTML files.
Note that you need to be careful to ensure that all relevant files for the analysis have been committed to Git prior to generating the results (you can use wflow_publish or wflow_git_commit). workflowr only checks the R Markdown file, but you know if there are other scripts or data files that it depends on. Below is the status of the Git repository when the results were generated:
Ignored files:
    Ignored:    .DS_Store
    Ignored:    .Rhistory
    Ignored:    .Rproj.user/
    Ignored:    ._.DS_Store
    Ignored:    ._Rplots.pdf
    Ignored:    ._Unfiltered.pdf
    Ignored:    .__workflowr.yml
    Ignored:    ._coverage.pdf
    Ignored:    ._coverage_sashimi.pdf
    Ignored:    ._coverage_sashimi.png
    Ignored:    ._neural_scRNAseq.Rproj
    Ignored:    ._pbDS_cell_level.pdf
    Ignored:    ._pbDS_top_expr_umap.pdf
    Ignored:    ._pbDS_upset.pdf
    Ignored:    ._sashimi.pdf
    Ignored:    ._stmn2.pdf
    Ignored:    ._tdp.pdf
    Ignored:    analysis/.DS_Store
    Ignored:    analysis/.Rhistory
    Ignored:    analysis/._.DS_Store
    Ignored:    analysis/._01-preprocessing.Rmd
    Ignored:    analysis/._01-preprocessing.html
    Ignored:    analysis/._02.1-SampleQC.Rmd
    Ignored:    analysis/._03-filtering.Rmd
    Ignored:    analysis/._04-clustering.Rmd
    Ignored:    analysis/._04-clustering.knit.md
    Ignored:    analysis/._04.1-cell_cycle.Rmd
    Ignored:    analysis/._05-annotation.Rmd
    Ignored:    analysis/._Lam-0-NSC_no_integration.Rmd
    Ignored:    analysis/._Lam-01-NSC_integration.Rmd
    Ignored:    analysis/._Lam-02-NSC_annotation.Rmd
    Ignored:    analysis/._NSC-1-clustering.Rmd
    Ignored:    analysis/._NSC-2-annotation.Rmd
    Ignored:    analysis/.__site.yml
    Ignored:    analysis/._additional_filtering.Rmd
    Ignored:    analysis/._additional_filtering_clustering.Rmd
    Ignored:    analysis/._index.Rmd
    Ignored:    analysis/._organoid-01-1-qualtiy-control.Rmd
    Ignored:    analysis/._organoid-01-clustering.Rmd
    Ignored:    analysis/._organoid-02-integration.Rmd
    Ignored:    analysis/._organoid-03-cluster_analysis.Rmd
    Ignored:    analysis/._organoid-04-group_integration.Rmd
    Ignored:    analysis/._organoid-04-stage_integration.Rmd
    Ignored:    analysis/._organoid-05-group_integration_cluster_analysis.Rmd
    Ignored:    analysis/._organoid-05-stage_integration_cluster_analysis.Rmd
    Ignored:    analysis/._organoid-06-1-prepare-sce.Rmd
    Ignored:    analysis/._organoid-06-conos-analysis-Seurat.Rmd
    Ignored:    analysis/._organoid-06-conos-analysis-function.Rmd
    Ignored:    analysis/._organoid-06-conos-analysis.Rmd
    Ignored:    analysis/._organoid-06-group-integration-conos-analysis.Rmd
    Ignored:    analysis/._organoid-07-conos-visualization.Rmd
    Ignored:    analysis/._organoid-07-group-integration-conos-visualization.Rmd
    Ignored:    analysis/._organoid-08-conos-comparison.Rmd
    Ignored:    analysis/._organoid-0x-sample_integration.Rmd
    Ignored:    analysis/01-preprocessing_cache/
    Ignored:    analysis/02-1-SampleQC_cache/
    Ignored:    analysis/02-quality_control_cache/
    Ignored:    analysis/02.1-SampleQC_cache/
    Ignored:    analysis/03-filtering_cache/
    Ignored:    analysis/04-clustering_cache/
    Ignored:    analysis/04.1-cell_cycle_cache/
    Ignored:    analysis/05-annotation_cache/
    Ignored:    analysis/06-clustering-all-timepoints_cache/
    Ignored:    analysis/07-cluster-analysis-all-timepoints_cache/
    Ignored:    analysis/Lam-01-NSC_integration_cache/
    Ignored:    analysis/Lam-02-NSC_annotation_cache/
    Ignored:    analysis/NSC-1-clustering_cache/
    Ignored:    analysis/NSC-2-annotation_cache/
    Ignored:    analysis/TDP-01-preprocessing_cache/
    Ignored:    analysis/TDP-02-quality_control_cache/
    Ignored:    analysis/TDP-03-filtering_cache/
    Ignored:    analysis/TDP-04-clustering_cache/
    Ignored:    analysis/TDP-05-00-filtering-plasmid-QC_cache/
    Ignored:    analysis/TDP-05-plasmid_expression_cache/
    Ignored:    analysis/TDP-06-cluster_analysis_cache/
    Ignored:    analysis/TDP-07-01-STMN2_expression_cache/
    Ignored:    analysis/TDP-07-cluster_12_cache/
    Ignored:    analysis/TDP-08-00-clustering-HA-D96_cache/
    Ignored:    analysis/TDP-08-01-HA-D96-expression-changes_cache/
    Ignored:    analysis/TDP-08-clustering-timeline-HA_cache/
    Ignored:    analysis/additional_filtering_cache/
    Ignored:    analysis/additional_filtering_clustering_cache/
    Ignored:    analysis/figure/
    Ignored:    analysis/organoid-01-1-qualtiy-control_cache/
    Ignored:    analysis/organoid-01-clustering_cache/
    Ignored:    analysis/organoid-02-integration_cache/
    Ignored:    analysis/organoid-03-cluster_analysis_cache/
    Ignored:    analysis/organoid-04-group_integration_cache/
    Ignored:    analysis/organoid-04-stage_integration_cache/
    Ignored:    analysis/organoid-05-group_integration_cluster_analysis_cache/
    Ignored:    analysis/organoid-05-stage_integration_cluster_analysis_cache/
    Ignored:    analysis/organoid-06-conos-analysis_cache/
    Ignored:    analysis/organoid-06-conos-analysis_test_cache/
    Ignored:    analysis/organoid-06-group-integration-conos-analysis_cache/
    Ignored:    analysis/organoid-07-conos-visualization_cache/
    Ignored:    analysis/organoid-07-group-integration-conos-visualization_cache/
    Ignored:    analysis/organoid-08-conos-comparison_cache/
    Ignored:    analysis/organoid-0x-sample_integration_cache/
    Ignored:    analysis/sample5_QC_cache/
    Ignored:    analysis/timepoints-01-organoid-integration_cache/
    Ignored:    data/.DS_Store
    Ignored:    data/._.DS_Store
    Ignored:    data/._.smbdeleteAAA17ed8b4b
    Ignored:    data/._Lam_figure2_markers.R
    Ignored:    data/._Reactive_astrocytes_markers.xlsx
    Ignored:    data/._known_NSC_markers.R
    Ignored:    data/._known_cell_type_markers.R
    Ignored:    data/._metadata.csv
    Ignored:    data/._virus_cell_tropism_markers.R
    Ignored:    data/._~$Reactive_astrocytes_markers.xlsx
    Ignored:    data/data_sushi/
    Ignored:    data/filtered_feature_matrices/
    Ignored:    output/.DS_Store
    Ignored:    output/._.DS_Store
    Ignored:    output/._NSC_cluster2_marker_genes.txt
    Ignored:    output/._TDP-06-no_integration_cluster12_marker_genes.txt
    Ignored:    output/._TDP-06-no_integration_cluster13_marker_genes.txt
    Ignored:    output/._organoid_integration_cluster1_marker_genes.txt
    Ignored:    output/Lam-01-clustering.rds
    Ignored:    output/NSC_1_clustering.rds
    Ignored:    output/NSC_cluster1_marker_genes.txt
    Ignored:    output/NSC_cluster2_marker_genes.txt
    Ignored:    output/NSC_cluster3_marker_genes.txt
    Ignored:    output/NSC_cluster4_marker_genes.txt
    Ignored:    output/NSC_cluster5_marker_genes.txt
    Ignored:    output/NSC_cluster6_marker_genes.txt
    Ignored:    output/NSC_cluster7_marker_genes.txt
    Ignored:    output/TDP-06-no_integration_cluster0_marker_genes.txt
    Ignored:    output/TDP-06-no_integration_cluster10_marker_genes.txt
    Ignored:    output/TDP-06-no_integration_cluster11_marker_genes.txt
    Ignored:    output/TDP-06-no_integration_cluster12_marker_genes.txt
    Ignored:    output/TDP-06-no_integration_cluster13_marker_genes.txt
    Ignored:    output/TDP-06-no_integration_cluster14_marker_genes.txt
    Ignored:    output/TDP-06-no_integration_cluster15_marker_genes.txt
    Ignored:    output/TDP-06-no_integration_cluster16_marker_genes.txt
    Ignored:    output/TDP-06-no_integration_cluster17_marker_genes.txt
    Ignored:    output/TDP-06-no_integration_cluster1_marker_genes.txt
    Ignored:    output/TDP-06-no_integration_cluster2_marker_genes.txt
    Ignored:    output/TDP-06-no_integration_cluster3_marker_genes.txt
    Ignored:    output/TDP-06-no_integration_cluster4_marker_genes.txt
    Ignored:    output/TDP-06-no_integration_cluster5_marker_genes.txt
    Ignored:    output/TDP-06-no_integration_cluster6_marker_genes.txt
    Ignored:    output/TDP-06-no_integration_cluster7_marker_genes.txt
    Ignored:    output/TDP-06-no_integration_cluster8_marker_genes.txt
    Ignored:    output/TDP-06-no_integration_cluster9_marker_genes.txt
    Ignored:    output/TDP-06_scran_markers.rds
    Ignored:    output/additional_filtering.rds
    Ignored:    output/conos/
    Ignored:    output/conos_organoid-06-conos-analysis.rds
    Ignored:    output/conos_organoid-06-group-integration-conos-analysis.rds
    Ignored:    output/figures/
    Ignored:    output/organoid_integration_cluster10_marker_genes.txt
    Ignored:    output/organoid_integration_cluster11_marker_genes.txt
    Ignored:    output/organoid_integration_cluster12_marker_genes.txt
    Ignored:    output/organoid_integration_cluster13_marker_genes.txt
    Ignored:    output/organoid_integration_cluster14_marker_genes.txt
    Ignored:    output/organoid_integration_cluster15_marker_genes.txt
    Ignored:    output/organoid_integration_cluster16_marker_genes.txt
    Ignored:    output/organoid_integration_cluster17_marker_genes.txt
    Ignored:    output/organoid_integration_cluster1_marker_genes.txt
    Ignored:    output/organoid_integration_cluster2_marker_genes.txt
    Ignored:    output/organoid_integration_cluster3_marker_genes.txt
    Ignored:    output/organoid_integration_cluster4_marker_genes.txt
    Ignored:    output/organoid_integration_cluster5_marker_genes.txt
    Ignored:    output/organoid_integration_cluster6_marker_genes.txt
    Ignored:    output/organoid_integration_cluster7_marker_genes.txt
    Ignored:    output/organoid_integration_cluster8_marker_genes.txt
    Ignored:    output/organoid_integration_cluster9_marker_genes.txt
    Ignored:    output/sce_01_preprocessing.rds
    Ignored:    output/sce_02_quality_control.rds
    Ignored:    output/sce_03_filtering.rds
    Ignored:    output/sce_03_filtering_all_genes.rds
    Ignored:    output/sce_06-1-prepare-sce.rds
    Ignored:    output/sce_TDP_01_preprocessing.rds
    Ignored:    output/sce_TDP_02_quality_control.rds
    Ignored:    output/sce_TDP_03_filtering.rds
    Ignored:    output/sce_TDP_03_filtering_all_genes.rds
    Ignored:    output/sce_organoid-01-clustering.rds
    Ignored:    output/sce_preprocessing.rds
    Ignored:    output/so_04-group_integration.rds
    Ignored:    output/so_04-stage_integration.rds
    Ignored:    output/so_04_1_cell_cycle.rds
    Ignored:    output/so_04_clustering.rds
    Ignored:    output/so_06-clustering_all_timepoints.rds
    Ignored:    output/so_08-00_clustering_HA_D96.rds
    Ignored:    output/so_08-clustering_timeline_HA.rds
    Ignored:    output/so_0x-sample_integration.rds
    Ignored:    output/so_TDP-06-cluster-analysis.rds
    Ignored:    output/so_TDP_04_clustering.rds
    Ignored:    output/so_TDP_05_plasmid_expression.rds
    Ignored:    output/so_additional_filtering_clustering.rds
    Ignored:    output/so_integrated_organoid-02-integration.rds
    Ignored:    output/so_merged_organoid-02-integration.rds
    Ignored:    output/so_organoid-01-clustering.rds
    Ignored:    output/so_sample_organoid-01-clustering.rds
    Ignored:    scripts/.DS_Store
    Ignored:    scripts/._.DS_Store
    Ignored:    scripts/._bu_Rcode.R
    Ignored:    scripts/._plasmid_expression.sh

Untracked files:
    Untracked:  Filtered.pdf
    Untracked:  Rplots.pdf
    Untracked:  Unfiltered
    Untracked:  Unfiltered.pdf
    Untracked:  analysis/Lam-0-NSC_no_integration.Rmd
    Untracked:  analysis/TDP-07-01-STMN2_expression copy.Rmd
    Untracked:  analysis/additional_filtering.Rmd
    Untracked:  analysis/additional_filtering_clustering.Rmd
    Untracked:  analysis/organoid-01-1-qualtiy-control.Rmd
    Untracked:  analysis/organoid-06-conos-analysis-Seurat.Rmd
    Untracked:  analysis/organoid-06-conos-analysis-function.Rmd
    Untracked:  analysis/organoid-07-conos-visualization.Rmd
    Untracked:  analysis/organoid-07-group-integration-conos-visualization.Rmd
    Untracked:  analysis/organoid-08-conos-comparison.Rmd
    Untracked:  analysis/organoid-0x-sample_integration.Rmd
    Untracked:  analysis/sample5_QC.Rmd
    Untracked:  coverage.pdf
    Untracked:  coverage_sashimi.pdf
    Untracked:  coverage_sashimi.png
    Untracked:  data/Homo_sapiens.GRCh38.98.sorted.gtf
    Untracked:  data/Kanton_et_al/
    Untracked:  data/Lam_et_al/
    Untracked:  data/Sep2020/
    Untracked:  data/reference/
    Untracked:  data/virus_cell_tropism_markers.R
    Untracked:  data/~$Reactive_astrocytes_markers.xlsx
    Untracked:  pbDS_cell_level.pdf
    Untracked:  pbDS_heatmap.pdf
    Untracked:  pbDS_top_expr_umap.pdf
    Untracked:  pbDS_upset.pdf
    Untracked:  sashimi.pdf
    Untracked:  scripts/bu_Rcode.R
    Untracked:  scripts/salmon-latest_linux_x86_64/
    Untracked:  stmn2.pdf
    Untracked:  tdp.pdf

Unstaged changes:
    Modified:   analysis/05-annotation.Rmd
    Modified:   analysis/Lam-02-NSC_annotation.Rmd
    Modified:   analysis/TDP-04-clustering.Rmd
    Modified:   analysis/TDP-06-cluster_analysis.Rmd
    Modified:   analysis/TDP-08-01-HA-D96-expression-changes.Rmd
    Modified:   analysis/_site.yml
    Modified:   analysis/organoid-02-integration.Rmd
    Modified:   analysis/organoid-04-group_integration.Rmd
    Modified:   analysis/organoid-06-conos-analysis.Rmd
    Modified:   analysis/timepoints-01-organoid-integration.Rmd
Note that any generated files, e.g. HTML, png, CSS, etc., are not included in this status report because it is ok for generated content to have uncommitted changes.
These are the previous versions of the repository in which changes were made to the R Markdown (analysis/TDP-08-00-clustering-HA-D96.Rmd) and HTML (docs/TDP-08-00-clustering-HA-D96.html) files. If you've configured a remote Git repository (see ?wflow_git_remote), click on the hyperlinks in the table below to view the files as they were in that past version.
| File | Version | Author | Date | Message |
|---|---|---|---|---|
| Rmd | 864cc2d | khembach | 2021-03-11 | DR with cells colored by individual clustering |
| html | d20fa77 | khembach | 2021-01-28 | Build site. |
| Rmd | e6766a6 | khembach | 2021-01-28 | cluster TDP experiment together with D96 samples |
Load packages
library(BiocParallel)
library(ggplot2)
library(dplyr)
library(cowplot)
library(ggplot2)
library(Seurat)
library(SingleCellExperiment)
library(future)
library(ComplexHeatmap)
library(RColorBrewer)
library(viridis)
Load data
## Seurat objects with normalized data
so_tdp <- readRDS(file.path("output", "so_TDP_05_plasmid_expression.rds"))
so_tdp$group_id <- "TDP"
# so_timeline <- readRDS(file.path("output", "so_06-clustering_all_timepoints.rds"))

so_d96 <- readRDS(file.path("output", "so_04_clustering.rds"))
## select only the D96 cells
so_d96 <- subset(so_d96, subset = group_id == "D96")
We merge the samples from the two data sets into a Seurat object.
## merge the two Seurat objects
so <- merge(so_tdp, y = so_d96, add.cell.ids = c("tdp_ha", "D96"),
            project = "neural_cultures", merge.data = TRUE)
so$group_id <- factor(so$group_id, levels = c("D96", "TDP"))
Variable features
so <- FindVariableFeatures(so, nfeatures = 2000,
    selection.method = "vst", verbose = FALSE)
so <- ScaleData(so, verbose = FALSE, vars.to.regress = c("sum",
                                                         "subsets_Mt_percent"))
Dimension reduction
We perform dimension reduction with t-SNE and UMAP based on PCA results.
so <- RunPCA(so, npcs = 30, verbose = FALSE)
so <- RunTSNE(so, reduction = "pca", dims = seq_len(20),
    seed.use = 1, do.fast = TRUE, verbose = FALSE)
so <- RunUMAP(so, reduction = "pca", dims = seq_len(20),
    seed.use = 1, verbose = FALSE)
Plot PCA results
# top genes that are associated with the first two PCs
VizDimLoadings(so, dims = 1:2, reduction = "pca")
## PCA plot
DimPlot(so, reduction = "pca", group.by = "sample_id")
# elbow plot with the ranking of PCs based on the % of variance explained
ElbowPlot(so, ndims = 30)
Clustering
We cluster the cells using the reduced PCA dimensions.
so <- FindNeighbors(so, reduction = "pca", dims = seq_len(20), verbose = FALSE)
for (res in c(0.2, 0.4, 0.8, 1))
    so <- FindClusters(so, resolution = res, random.seed = 1, verbose = FALSE)
Dimension reduction plots
We plot the dimension reduction (DR) and color by sample, group and cluster ID
thm <- theme(aspect.ratio = 1, legend.position = "none")
ps <- lapply(c("sample_id", "group_id", "ident"), function(u) {
    p1 <- DimPlot(so, reduction = "tsne", group.by = u) + thm
    p2 <- DimPlot(so, reduction = "umap", group.by = u)
    lgd <- get_legend(p2)
    p2 <- p2 + thm
    list(p1, p2, lgd)
    plot_grid(p1, p2, lgd, nrow = 1,
        rel_widths = c(1, 1, 0.5))
})
plot_grid(plotlist = ps, ncol = 1)
QC on DR plots
cs <- sample(colnames(so), 1e4) ## subsample cells
.plot_features <- function(so, dr, id) {
    FeaturePlot(so, cells = cs, features = id, reduction = dr, pt.size = 0.4,
                cols = c("grey", "blue")) +
        guides(col = guide_colourbar()) +
        theme_void() + theme(aspect.ratio = 1)
}
ids <- c("sum", "detected", "subsets_Mt_percent", "ENSG00000120948.TARDBP",
         "ENSG00000120948.TARDBP-alevin", "TDP43-HA")
for (id in ids) {
    cat("### ", id, "\n")
    p1 <- .plot_features(so, "tsne", id)
    lgd <- get_legend(p1)
    p1 <- p1 + theme(legend.position = "none") + ggtitle("tSNE")
    p2 <- .plot_features(so, "umap", id) + theme(legend.position = "none") +
      ggtitle("UMAP")
    ps <- plot_grid(plotlist = list(p1, p2), nrow = 1)
    p <- plot_grid(ps, lgd, nrow = 1, rel_widths = c(1, 0.2))
    print(p)
    cat("\n\n")
}
sum

detected

subsets_Mt_percent

ENSG00000120948.TARDBP

ENSG00000120948.TARDBP-alevin

TDP43-HA

DR with cells colored by individial clustering
We show the cluster membership of the individual clustering in the combined UMAP.
## combined clustering so$RNA_snn_res.0.4
## individual clustering so$integrated_snn_res.0.4 (D96)
## so_tdp$RNA_snn_res.0.4 (TDP-HA)
# we lost the individual clustering of the TDP-HA samples,
# and will add them to the so object
so$TDPHA_snn_res.0.4 <- NA
## iterate throuth each sample and add the corresponding cluster ids
for( s in unique(so_tdp$sample_id)){
  ind <- so$sample_id == s
  ind_tdp <- so_tdp$sample_id == s
  so$TDPHA_snn_res.0.4[ind] <- as.character(so_tdp$RNA_snn_res.0.4)[match(so$barcode[ind],
                                                      so_tdp$barcode[ind_tdp])]
}
so$TDPHA_snn_res.0.4 <- factor(so$TDPHA_snn_res.0.4,
                               levels = as.character(0:16))

so$integrated_snn_res.0.4  <- factor(so$integrated_snn_res.0.4,
                                     levels = as.character(0:16))

cs <- sample(colnames(so), 1e4)
.plot_dr <- function(so, dr, id)
    DimPlot(so, cells = cs, group.by = id, reduction = dr, pt.size = 0.4) +
        guides(col = guide_legend(nrow = 11,
            override.aes = list(size = 3, alpha = 1))) +
        theme_void() + theme(aspect.ratio = 1)

ids <- c("group_id", "sample_id", "ident", "TDPHA_snn_res.0.4", "integrated_snn_res.0.4")
for (id in ids) {
    cat("## ", id, "\n")
    p1 <- .plot_dr(so, "tsne", id)
    lgd <- get_legend(p1)
    p1 <- p1 + theme(legend.position = "none")
    p2 <- .plot_dr(so, "umap", id) + theme(legend.position = "none")
    ps <- plot_grid(plotlist = list(p1, p2), nrow = 1)
    p <- plot_grid(ps, lgd, nrow = 1, rel_widths = c(1, 0.2))
    print(p)
    cat("\n\n")
}
group_id

sample_id

ident

TDPHA_snn_res.0.4

integrated_snn_res.0.4

How are the individal clusters distributed in the combined clustering?
so$RNA_snn_res.0.4 %>% table.
0 1 2 3 4 5 6 7 8 9 10 11 12 13 14 15
6178 6176 4782 3671 3470 3203 2232 2229 1971 1295 1248 1142 675 538 142 51 so$integrated_snn_res.0.4 %>% table.
0 1 2 3 4 5 6 7 8 9 10 11 12 13 14 15
268 1023 29 703 1270 639 670 639 521 464 215 384 501 303 328 123
16
53 so$TDPHA_snn_res.0.4 %>% table.
0 1 2 3 4 5 6 7 8 9 10 11 12 13 14 15
4974 4858 3809 3014 2586 2835 2370 1570 1859 1046 858 269 374 200 154 56
16
38 ## D96
## check if cells from the same cluster are still in the same cluster
(n_clusters <- table(so$RNA_snn_res.0.4, so$integrated_snn_res.0.4))
        0    1    2    3    4    5    6    7    8    9   10   11   12   13   14
  0   186    7    0   46 1270    2    4    2   22    9  107   16    5    1    1
  1     3  960    0    0    0    6   27    3    0   24    0   27    3   21    0
  2     0    8    0    0    0    0  489  296    0    0    0   38    0    0    0
  3     7   33    0    0    0    6   18    5    0   49    1    7  485   19   14
  4     0    5    0    0    0  194    0    9    0  239    1   47    0    0    1
  5     0    1    0    0    0  392  119   10    0    0    0    3    0    0    1
  6     2    0    0    0    0   16    3  312    0    1    0   32    0    0    0
  7     6    0    1    1    0    0    0    0  490    0   16    0    0    0    0
  8     2    9    0    0    0    0    0    0    0    4    0    1    5  260    0
  9     5    0    0    0    0    5    0    0    0  126    0    2    2    0    7
  10   55    0   20  656    0    1    1    0    9    7   65    8    0    1    1
  11    1    0    0    0    0    4    0    0    0    0    0    6    0    0  143
  12    1    0    0    0    0    0    0    0    0    0    0    1    0    0  159
  13    0    0    0    0    0   13    9    2    0    4   25  196    1    1    1
  14    0    0    8    0    0    0    0    0    0    0    0    0    0    0    0
  15    0    0    0    0    0    0    0    0    0    1    0    0    0    0    0

       15   16
  0   120    0
  1     0    0
  2     0    0
  3     0    0
  4     0    0
  5     0    0
  6     0    0
  7     0    0
  8     0    0
  9     0    0
  10    3   53
  11    0    0
  12    0    0
  13    0    0
  14    0    0
  15    0    0
fqs <- prop.table(n_clusters, margin = 2)
mat <- as.matrix(unclass(fqs))
Heatmap(mat,
col = rev(brewer.pal(11, "RdGy")[-6]),
name = "Frequency",
cluster_rows = FALSE,
cluster_columns = FALSE,
row_names_side = "left",
row_title = "combined clusters",
column_title = "individual clusters",
column_title_side = "bottom",
rect_gp = gpar(col = "white"),
cell_fun = function(i, j, x, y, width, height, fill)
grid.text(round(mat[j, i] * 100, 2), x = x, y = y,
gp = gpar(col = "white", fontsize = 8)))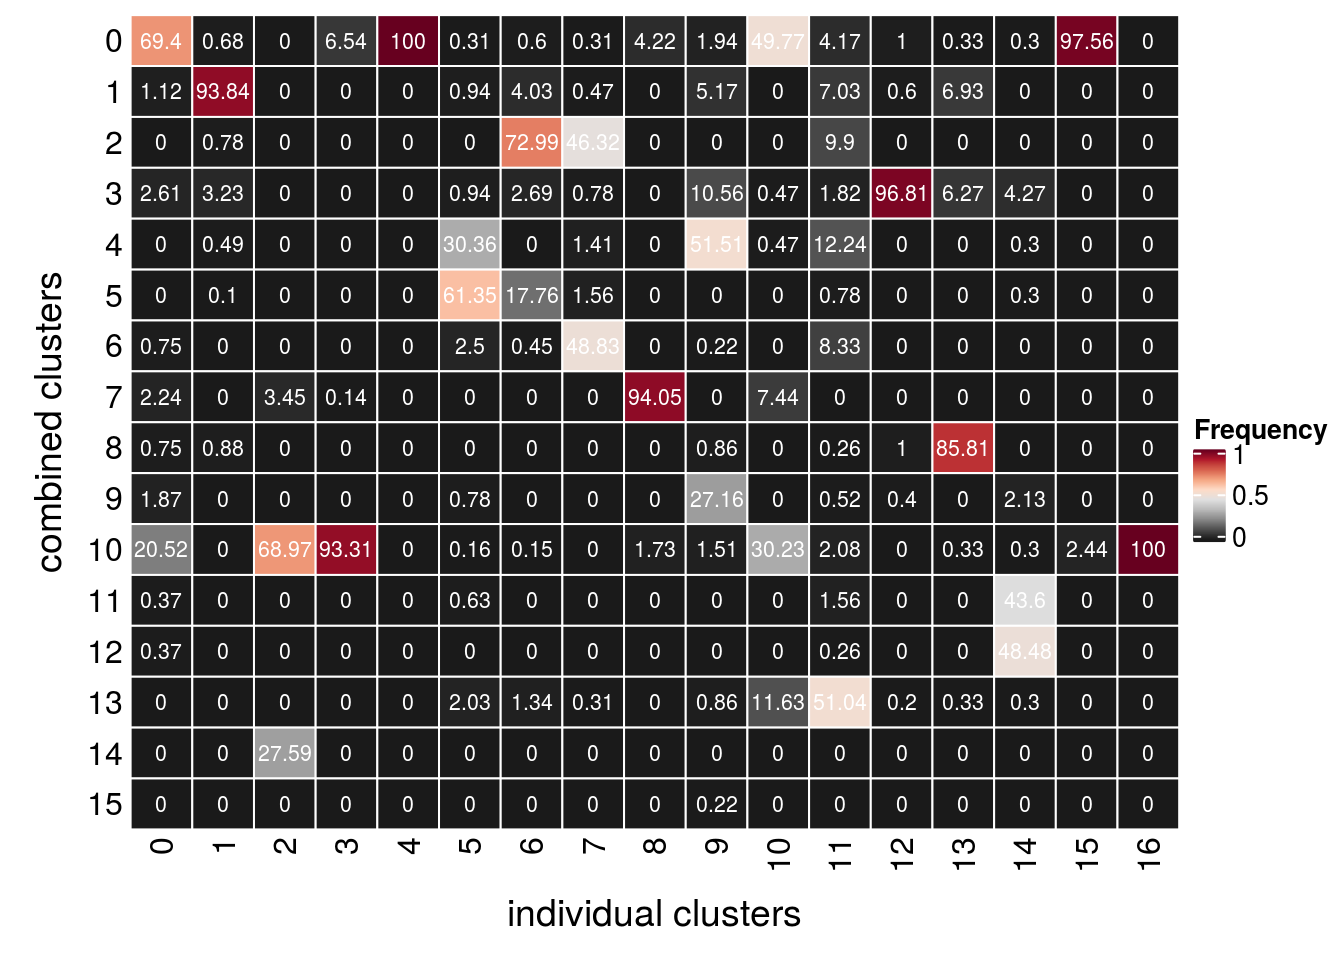
## TDP-HA experiment
(n_clusters <- table(so$RNA_snn_res.0.4, so$TDPHA_snn_res.0.4))
        0    1    2    3    4    5    6    7    8    9   10   11   12   13   14
  0   531 1572  406  288  288  311  278  162  196  107   99   32   38   20   39
  1  1783  587  508  396  340  349  313  204  239  133  101   32   57   29   19
  2   510  469 1293  288  270  250  213  150  207  104   76   32   39   28   15
  3   401  404  284  232  792  237  178  119  159   77   63   17   30   11   14
  4   374  384  287  913  154  206  174  115  133   80   80   18   22   16   11
  5   326  305  248  207  156  443  144  119  541   68   52   16   27    7   11
  6   215  214  184  150  134  535  125   78   90   53   43   13   18    4    8
  7   161  193  121  117  102  111  659   77   69   32   30    8   14    8    8
  8   223  224  150  132  114  118   97  433   88   37   33   12   12   10    3
  9   140  147  111   97   79   91   67   35   47  288   22   10    4    6    3
  10   50  148   30   21   15   32   18    9   13    9    3    2    3    2    0
  11  134  112   94   94   77   70   48   37   39   23  230    7    9    9    3
  12   80   52   53   50   39   44   36   19   25   19   18   68    2    2    6
  13   28   31   22   19   13   21   10    8   10    7    6    1   95    0   13
  14   15    9   11    7    7   14    8    3    2    3    2    1    1   48    1
  15    3    7    7    3    6    3    2    2    1    6    0    0    3    0    0

       15   16
  0     9    4
  1     8    4
  2     2    5
  3     5    4
  4     4    3
  5     2    5
  6     1    1
  7     2    3
  8     3    1
  9     1    0
  10   13    0
  11    1    1
  12    1    0
  13    2    0
  14    2    0
  15    0    7
fqs <- prop.table(n_clusters, margin = 2)
mat <- as.matrix(unclass(fqs))
Heatmap(mat,
col = rev(brewer.pal(11, "RdGy")[-6]),
name = "Frequency",
cluster_rows = FALSE,
cluster_columns = FALSE,
row_names_side = "left",
row_title = "combined clusters",
column_title = "individual clusters",
column_title_side = "bottom",
rect_gp = gpar(col = "white"),
cell_fun = function(i, j, x, y, width, height, fill)
grid.text(round(mat[j, i] * 100, 2), x = x, y = y,
gp = gpar(col = "white", fontsize = 8)))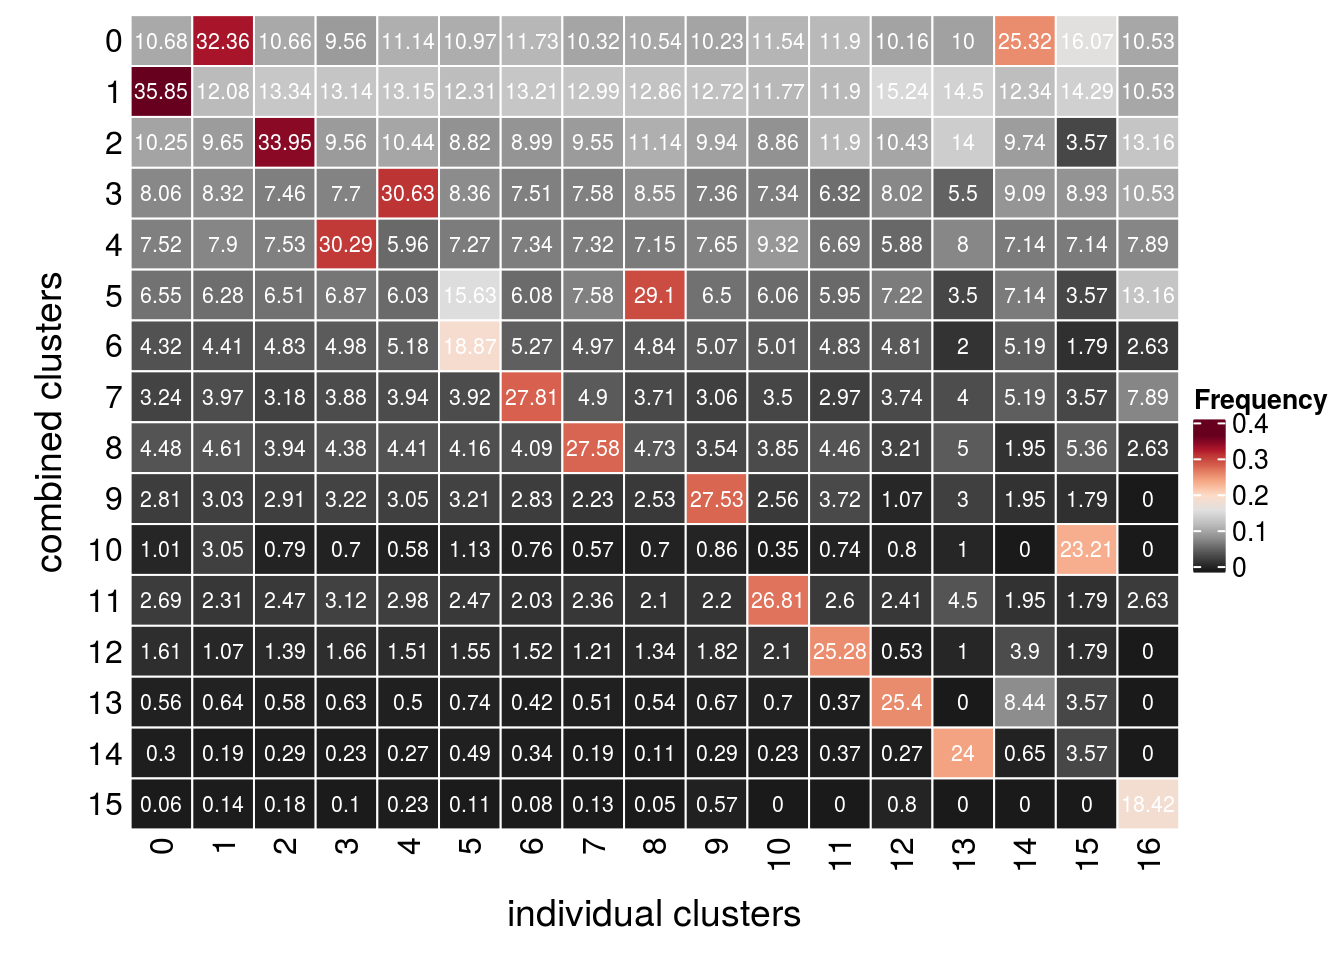
Save Seurat object to RDS
saveRDS(so, file.path("output", "so_08-00_clustering_HA_D96.rds"))
sessionInfo()R version 4.0.0 (2020-04-24)
Platform: x86_64-pc-linux-gnu (64-bit)
Running under: Ubuntu 16.04.6 LTS
Matrix products: default
BLAS: /usr/local/R/R-4.0.0/lib/libRblas.so
LAPACK: /usr/local/R/R-4.0.0/lib/libRlapack.so
locale:
[1] LC_CTYPE=en_US.UTF-8 LC_NUMERIC=C
[3] LC_TIME=en_US.UTF-8 LC_COLLATE=en_US.UTF-8
[5] LC_MONETARY=en_US.UTF-8 LC_MESSAGES=en_US.UTF-8
[7] LC_PAPER=en_US.UTF-8 LC_NAME=C
[9] LC_ADDRESS=C LC_TELEPHONE=C
[11] LC_MEASUREMENT=en_US.UTF-8 LC_IDENTIFICATION=C
attached base packages:
[1] parallel stats4 stats graphics grDevices utils datasets
[8] methods base
other attached packages:
[1] future_1.17.0 SingleCellExperiment_1.10.1
[3] SummarizedExperiment_1.18.1 DelayedArray_0.14.0
[5] matrixStats_0.56.0 Biobase_2.48.0
[7] GenomicRanges_1.40.0 GenomeInfoDb_1.24.2
[9] IRanges_2.22.2 S4Vectors_0.26.1
[11] BiocGenerics_0.34.0 Seurat_3.1.5
[13] cowplot_1.0.0 dplyr_1.0.2
[15] ggplot2_3.3.2 BiocParallel_1.22.0
[17] workflowr_1.6.2
loaded via a namespace (and not attached):
[1] nlme_3.1-148 tsne_0.1-3 bitops_1.0-6
[4] fs_1.4.2 RcppAnnoy_0.0.16 RColorBrewer_1.1-2
[7] httr_1.4.1 rprojroot_1.3-2 sctransform_0.2.1
[10] tools_4.0.0 backports_1.1.9 R6_2.4.1
[13] irlba_2.3.3 KernSmooth_2.23-17 uwot_0.1.8
[16] lazyeval_0.2.2 colorspace_1.4-1 withr_2.2.0
[19] tidyselect_1.1.0 gridExtra_2.3 compiler_4.0.0
[22] git2r_0.27.1 plotly_4.9.2.1 labeling_0.3
[25] scales_1.1.1 lmtest_0.9-37 ggridges_0.5.2
[28] pbapply_1.4-2 rappdirs_0.3.1 stringr_1.4.0
[31] digest_0.6.25 rmarkdown_2.3 XVector_0.28.0
[34] pkgconfig_2.0.3 htmltools_0.5.0 htmlwidgets_1.5.1
[37] rlang_0.4.7 farver_2.0.3 generics_0.0.2
[40] zoo_1.8-8 jsonlite_1.7.0 ica_1.0-2
[43] RCurl_1.98-1.2 magrittr_1.5 GenomeInfoDbData_1.2.3
[46] patchwork_1.0.1 Matrix_1.2-18 Rcpp_1.0.5
[49] munsell_0.5.0 ape_5.4 reticulate_1.16
[52] lifecycle_0.2.0 stringi_1.4.6 whisker_0.4
[55] yaml_2.2.1 zlibbioc_1.34.0 MASS_7.3-51.6
[58] Rtsne_0.15 plyr_1.8.6 grid_4.0.0
[61] listenv_0.8.0 promises_1.1.1 ggrepel_0.8.2
[64] crayon_1.3.4 lattice_0.20-41 splines_4.0.0
[67] knitr_1.29 pillar_1.4.6 igraph_1.2.5
[70] future.apply_1.6.0 reshape2_1.4.4 codetools_0.2-16
[73] leiden_0.3.3 glue_1.4.2 evaluate_0.14
[76] data.table_1.12.8 vctrs_0.3.4 png_0.1-7
[79] httpuv_1.5.4 gtable_0.3.0 RANN_2.6.1
[82] purrr_0.3.4 tidyr_1.1.0 xfun_0.15
[85] rsvd_1.0.3 RSpectra_0.16-0 later_1.1.0.1
[88] survival_3.2-3 viridisLite_0.3.0 tibble_3.0.3
[91] cluster_2.1.0 globals_0.12.5 fitdistrplus_1.1-1
[94] ellipsis_0.3.1 ROCR_1.0-11