Cluster annotation
Katharina Hembach
5/29/2020
Last updated: 2020-05-29
Checks: 7 0
Knit directory: neural_scRNAseq/
This reproducible R Markdown analysis was created with workflowr (version 1.6.2). The Checks tab describes the reproducibility checks that were applied when the results were created. The Past versions tab lists the development history.
Great! Since the R Markdown file has been committed to the Git repository, you know the exact version of the code that produced these results.
Great job! The global environment was empty. Objects defined in the global environment can affect the analysis in your R Markdown file in unknown ways. For reproduciblity it’s best to always run the code in an empty environment.
The command set.seed(20200522) was run prior to running the code in the R Markdown file. Setting a seed ensures that any results that rely on randomness, e.g. subsampling or permutations, are reproducible.
Great job! Recording the operating system, R version, and package versions is critical for reproducibility.
Nice! There were no cached chunks for this analysis, so you can be confident that you successfully produced the results during this run.
Great job! Using relative paths to the files within your workflowr project makes it easier to run your code on other machines.
Great! You are using Git for version control. Tracking code development and connecting the code version to the results is critical for reproducibility.
The results in this page were generated with repository version 97d5a52. See the Past versions tab to see a history of the changes made to the R Markdown and HTML files.
Note that you need to be careful to ensure that all relevant files for the analysis have been committed to Git prior to generating the results (you can use wflow_publish or wflow_git_commit). workflowr only checks the R Markdown file, but you know if there are other scripts or data files that it depends on. Below is the status of the Git repository when the results were generated:
Ignored files:
    Ignored:    .DS_Store
    Ignored:    .Rhistory
    Ignored:    .Rproj.user/
    Ignored:    ._.DS_Store
    Ignored:    .__workflowr.yml
    Ignored:    ._neural_scRNAseq.Rproj
    Ignored:    analysis/.DS_Store
    Ignored:    analysis/.Rhistory
    Ignored:    analysis/._.DS_Store
    Ignored:    analysis/._01-preprocessing.Rmd
    Ignored:    analysis/._01-preprocessing.html
    Ignored:    analysis/._02.1-SampleQC.Rmd
    Ignored:    analysis/._04-clustering.Rmd
    Ignored:    analysis/._04-clustering.knit.md
    Ignored:    analysis/.__site.yml
    Ignored:    analysis/01-preprocessing_cache/
    Ignored:    analysis/02-1-SampleQC_cache/
    Ignored:    analysis/02-quality_control_cache/
    Ignored:    analysis/02.1-SampleQC_cache/
    Ignored:    analysis/03-filtering_cache/
    Ignored:    analysis/04-clustering_cache/
    Ignored:    analysis/figure/
    Ignored:    data/.DS_Store
    Ignored:    data/._.DS_Store
    Ignored:    data/._metadata.csv
    Ignored:    data/._metadata.xlsx
    Ignored:    data/.smbdeleteAAA17ed8b4b
    Ignored:    data/data_sushi/
    Ignored:    data/metadata.csv
    Ignored:    data/metadata.xlsx
    Ignored:    output/.DS_Store
    Ignored:    output/._.DS_Store
    Ignored:    output/figures/
    Ignored:    output/sce_01_preprocessing.rds
    Ignored:    output/sce_02_quality_control.rds
    Ignored:    output/sce_03_filtering.rds
    Ignored:    output/sce_preprocessing.rds
    Ignored:    output/so_04_clustering.rds

Untracked files:
    Untracked:  scripts/

Unstaged changes:
    Modified:   analysis/_site.yml
Note that any generated files, e.g. HTML, png, CSS, etc., are not included in this status report because it is ok for generated content to have uncommitted changes.
These are the previous versions of the repository in which changes were made to the R Markdown (analysis/05-annotation.Rmd) and HTML (docs/05-annotation.html) files. If you’ve configured a remote Git repository (see ?wflow_git_remote), click on the hyperlinks in the table below to view the files as they were in that past version.
| File | Version | Author | Date | Message |
|---|---|---|---|---|
| Rmd | 97d5a52 | khembach | 2020-05-29 | cluster analysis |
Load packages
library(ComplexHeatmap)
library(cowplot)
library(ggplot2)
library(dplyr)
library(muscat)
library(purrr)
library(RColorBrewer)
library(viridis)
library(scran)
library(Seurat)
library(SingleCellExperiment)
Load data & convert to SCE
so <- readRDS(file.path("output", "so_04_clustering.rds"))
sce <- as.SingleCellExperiment(so, assay = "RNA")
colData(sce) <- as.data.frame(colData(sce)) %>%
    mutate_if(is.character, as.factor) %>%
    DataFrame(row.names = colnames(sce))
Nb. of clusters by resolution
cluster_cols <- grep("res.[0-9]", colnames(colData(sce)), value = TRUE)
sapply(colData(sce)[cluster_cols], nlevels)
integrated_snn_res.0.1 integrated_snn_res.0.2 integrated_snn_res.0.4
9 12 18
integrated_snn_res.0.8 integrated_snn_res.1 integrated_snn_res.1.2
25 31 35
integrated_snn_res.2
41 Cluster-sample counts
# set cluster IDs to resolution 0.4 clustering
so <- SetIdent(so, value = "integrated_snn_res.0.4")
so@meta.data$cluster_id <- Idents(so)
sce$cluster_id <- Idents(so)
(n_cells <- table(sce$cluster_id, sce$sample_id))
      1NSC  2NSC 3NC52 4NC52 5NC96 6NC96
  0   6099  6218    97    68   906   104
  1     10    18    29    20 10244   117
  2     11     7  1827  1260   357   561
  3     55    55  1048   851   457   844
  4      0     0  1361   904   212   336
  5    721   700   292   226   466   332
  6    174   174   629   606   749   372
  7      0     0  1154   866   219   451
  8      1     0   906   638   493   550
  9      6     5   716   501   126   222
  10     0     0   685   467   154   227
  11   451   475    95    95   124    96
  12   595   535    53    45    18     9
  13   161   146   319   266   138   171
  14     0     0   359   325    80   169
  15     0     0   270   222   143   174
  16    68    79    48    43   271    20
  17     2     4    36    43    15    37
Relative cluster-abundances
fqs <- prop.table(n_cells, margin = 2)
mat <- as.matrix(unclass(fqs))
Heatmap(mat,
    col = rev(brewer.pal(11, "RdGy")[-6]),
    name = "Frequency",
    cluster_rows = FALSE,
    cluster_columns = FALSE,
    row_names_side = "left",
    row_title = "cluster_id",
    column_title = "sample_id",
    column_title_side = "bottom",
    rect_gp = gpar(col = "white"),
    cell_fun = function(i, j, x, y, width, height, fill)
        grid.text(round(mat[j, i] * 100, 2), x = x, y = y,
            gp = gpar(col = "white", fontsize = 8)))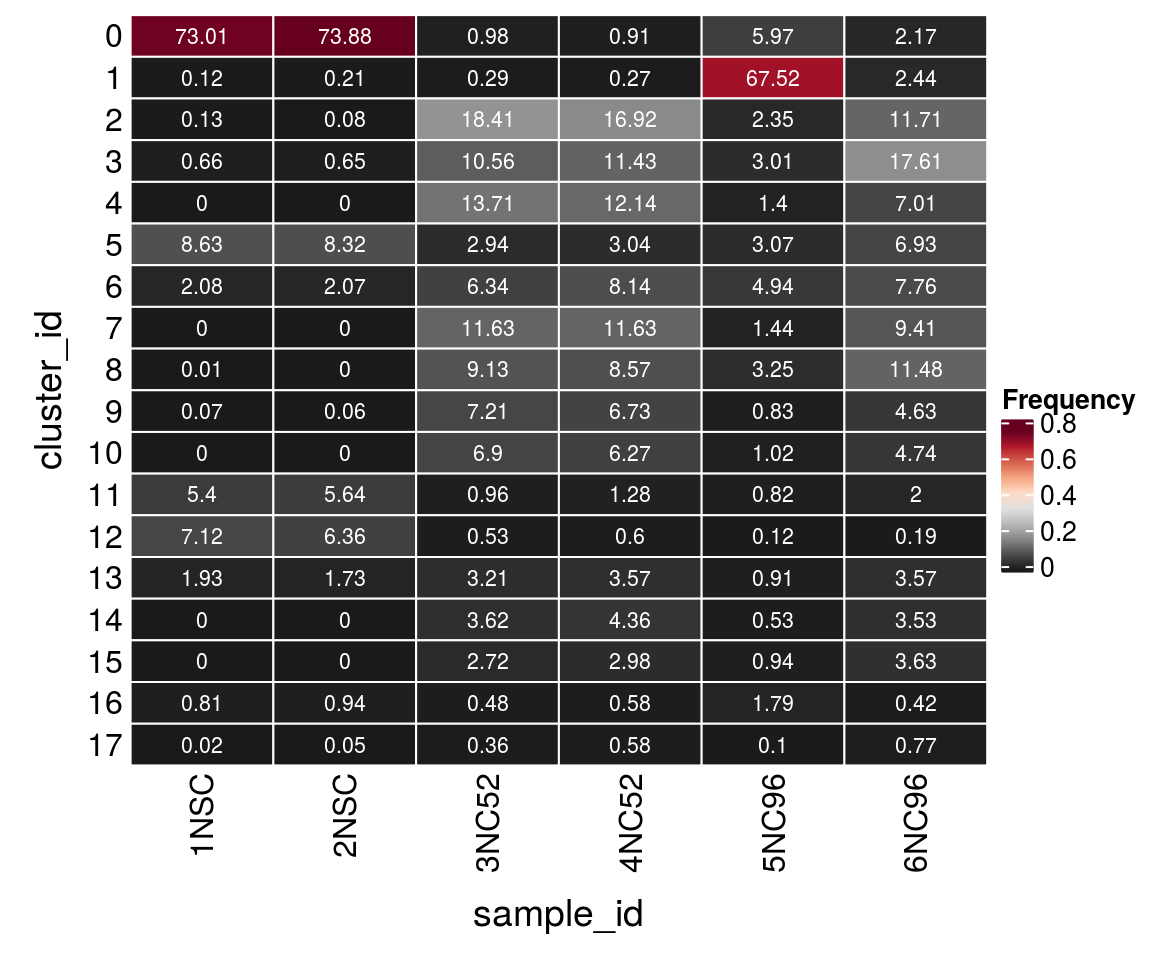
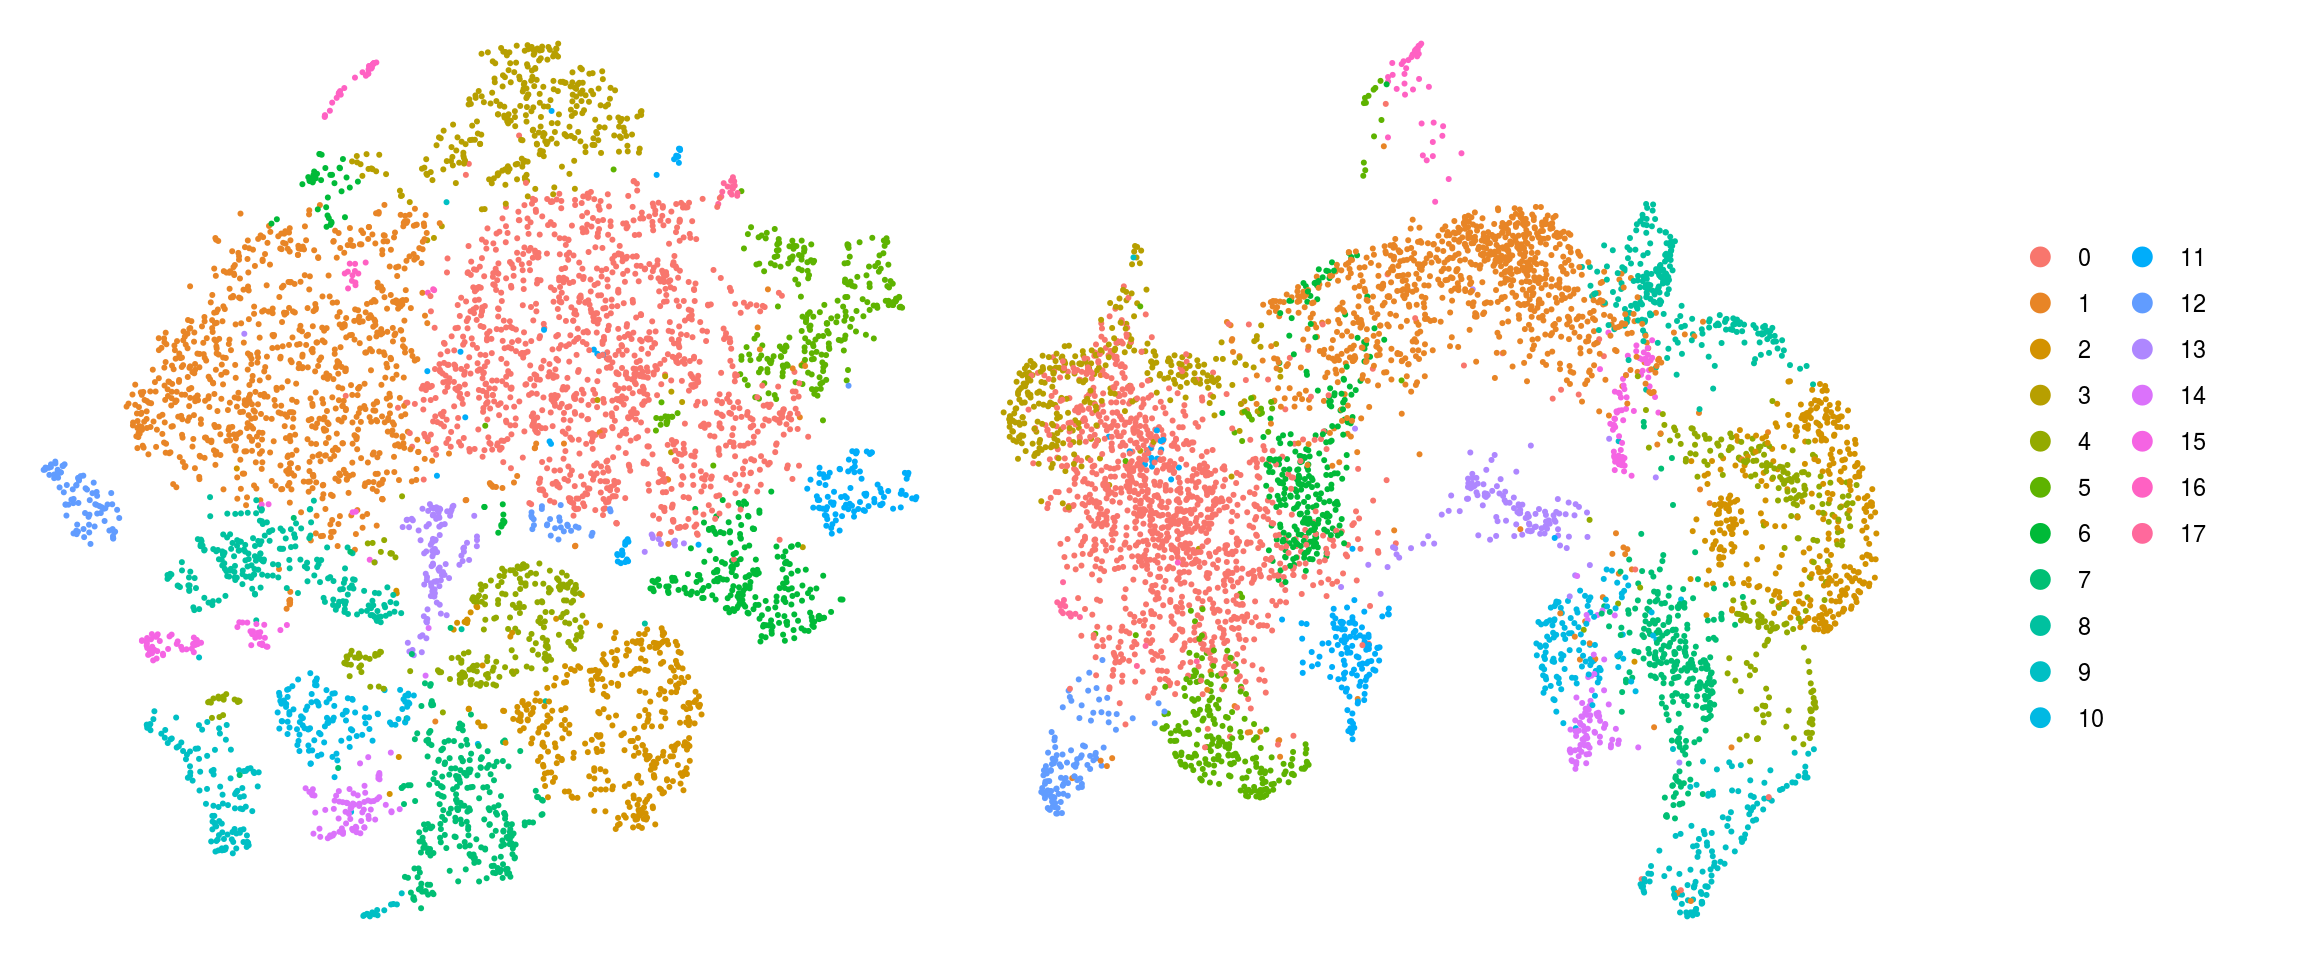
DR colored by cluster ID
cs <- sample(colnames(so), 5e3)
.plot_dr <- function(so, dr, id)
    DimPlot(so, cells = cs, group.by = id, reduction = dr, pt.size = 0.4) +
        guides(col = guide_legend(nrow = 11,
            override.aes = list(size = 3, alpha = 1))) +
        theme_void() + theme(aspect.ratio = 1)
ids <- c("cluster_id", "group_id", "sample_id")
for (id in ids) {
    cat("## ", id, "\n")
    p1 <- .plot_dr(so, "tsne", id)
    lgd <- get_legend(p1)
    p1 <- p1 + theme(legend.position = "none")
    p2 <- .plot_dr(so, "umap", id) + theme(legend.position = "none")
    ps <- plot_grid(plotlist = list(p1, p2), nrow = 1)
    p <- plot_grid(ps, lgd, nrow = 1, rel_widths = c(1, 0.2))
    print(p)
    cat("\n\n")
}
cluster_id
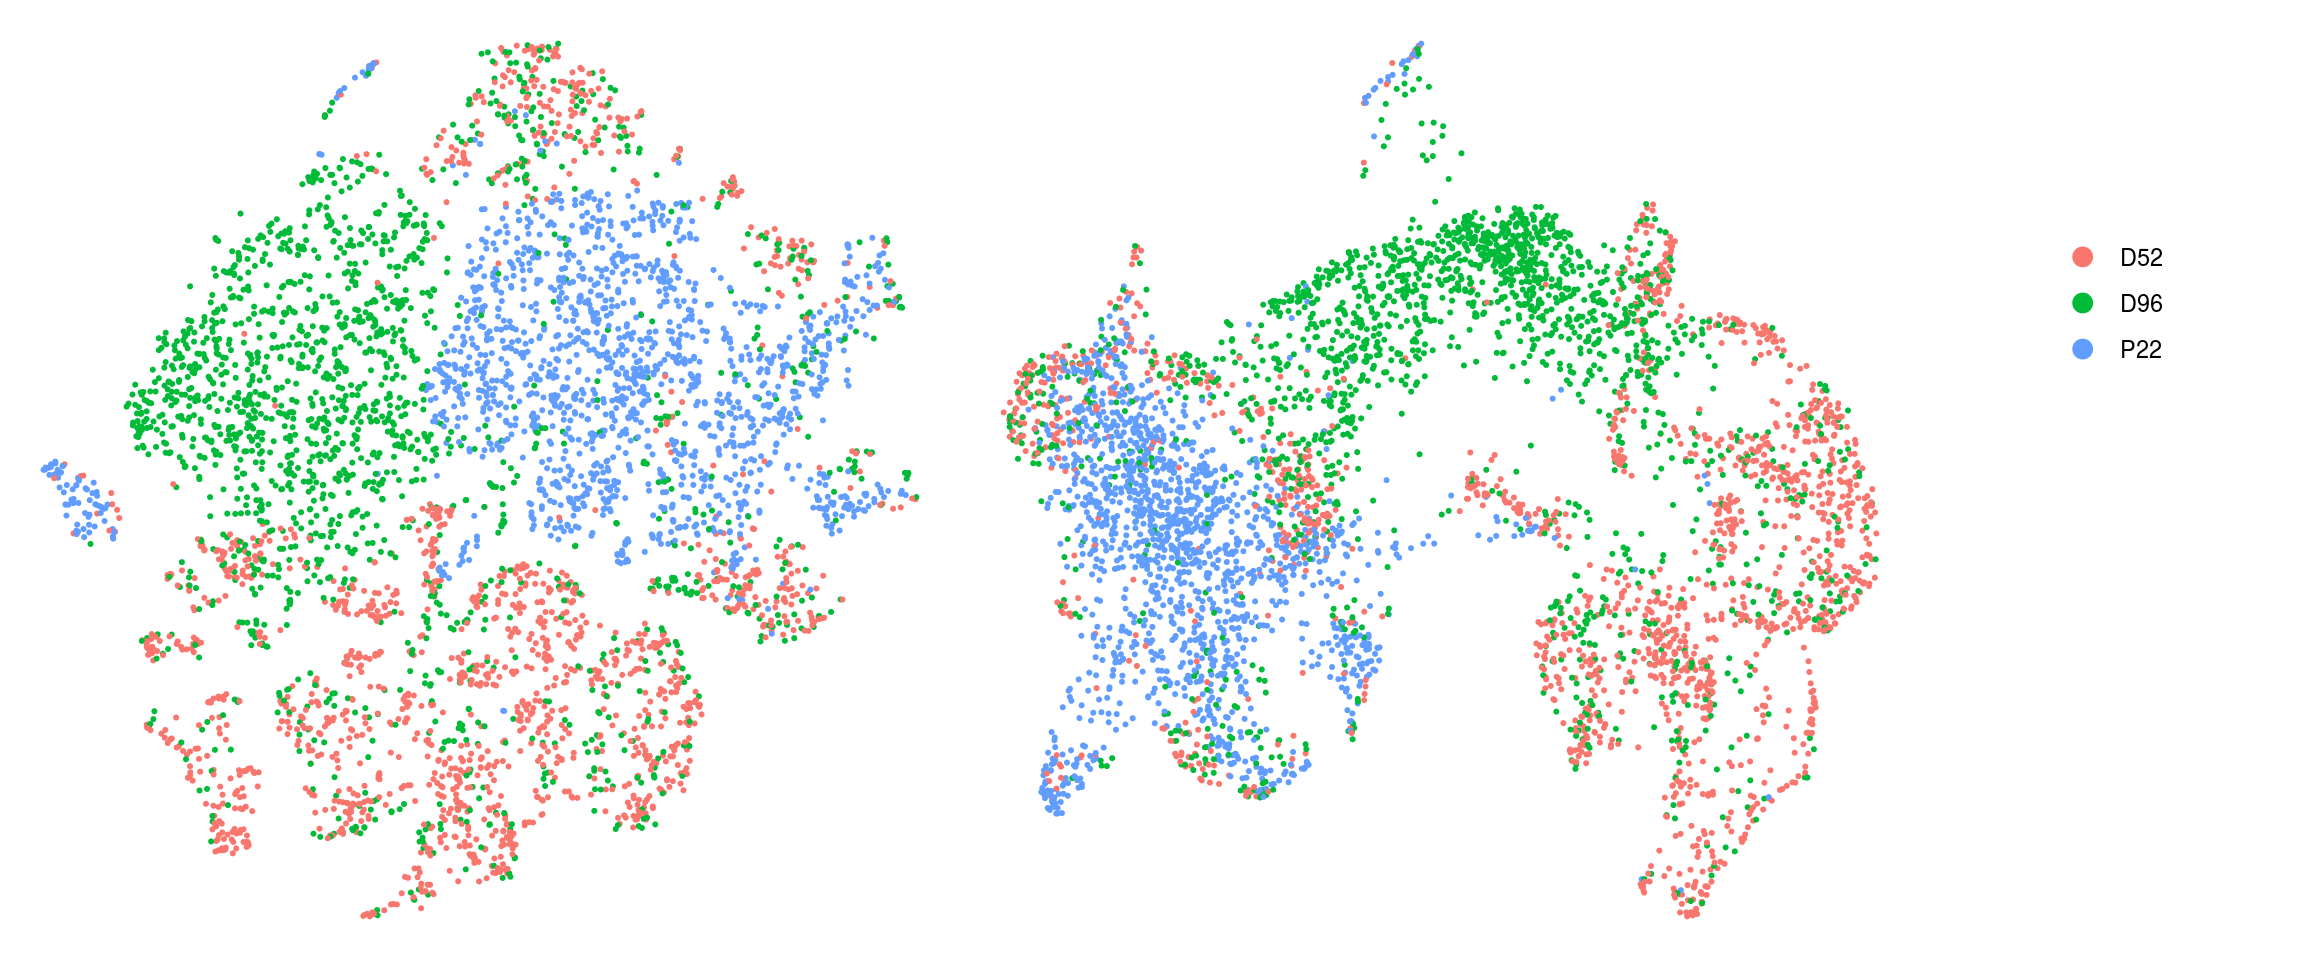
group_id
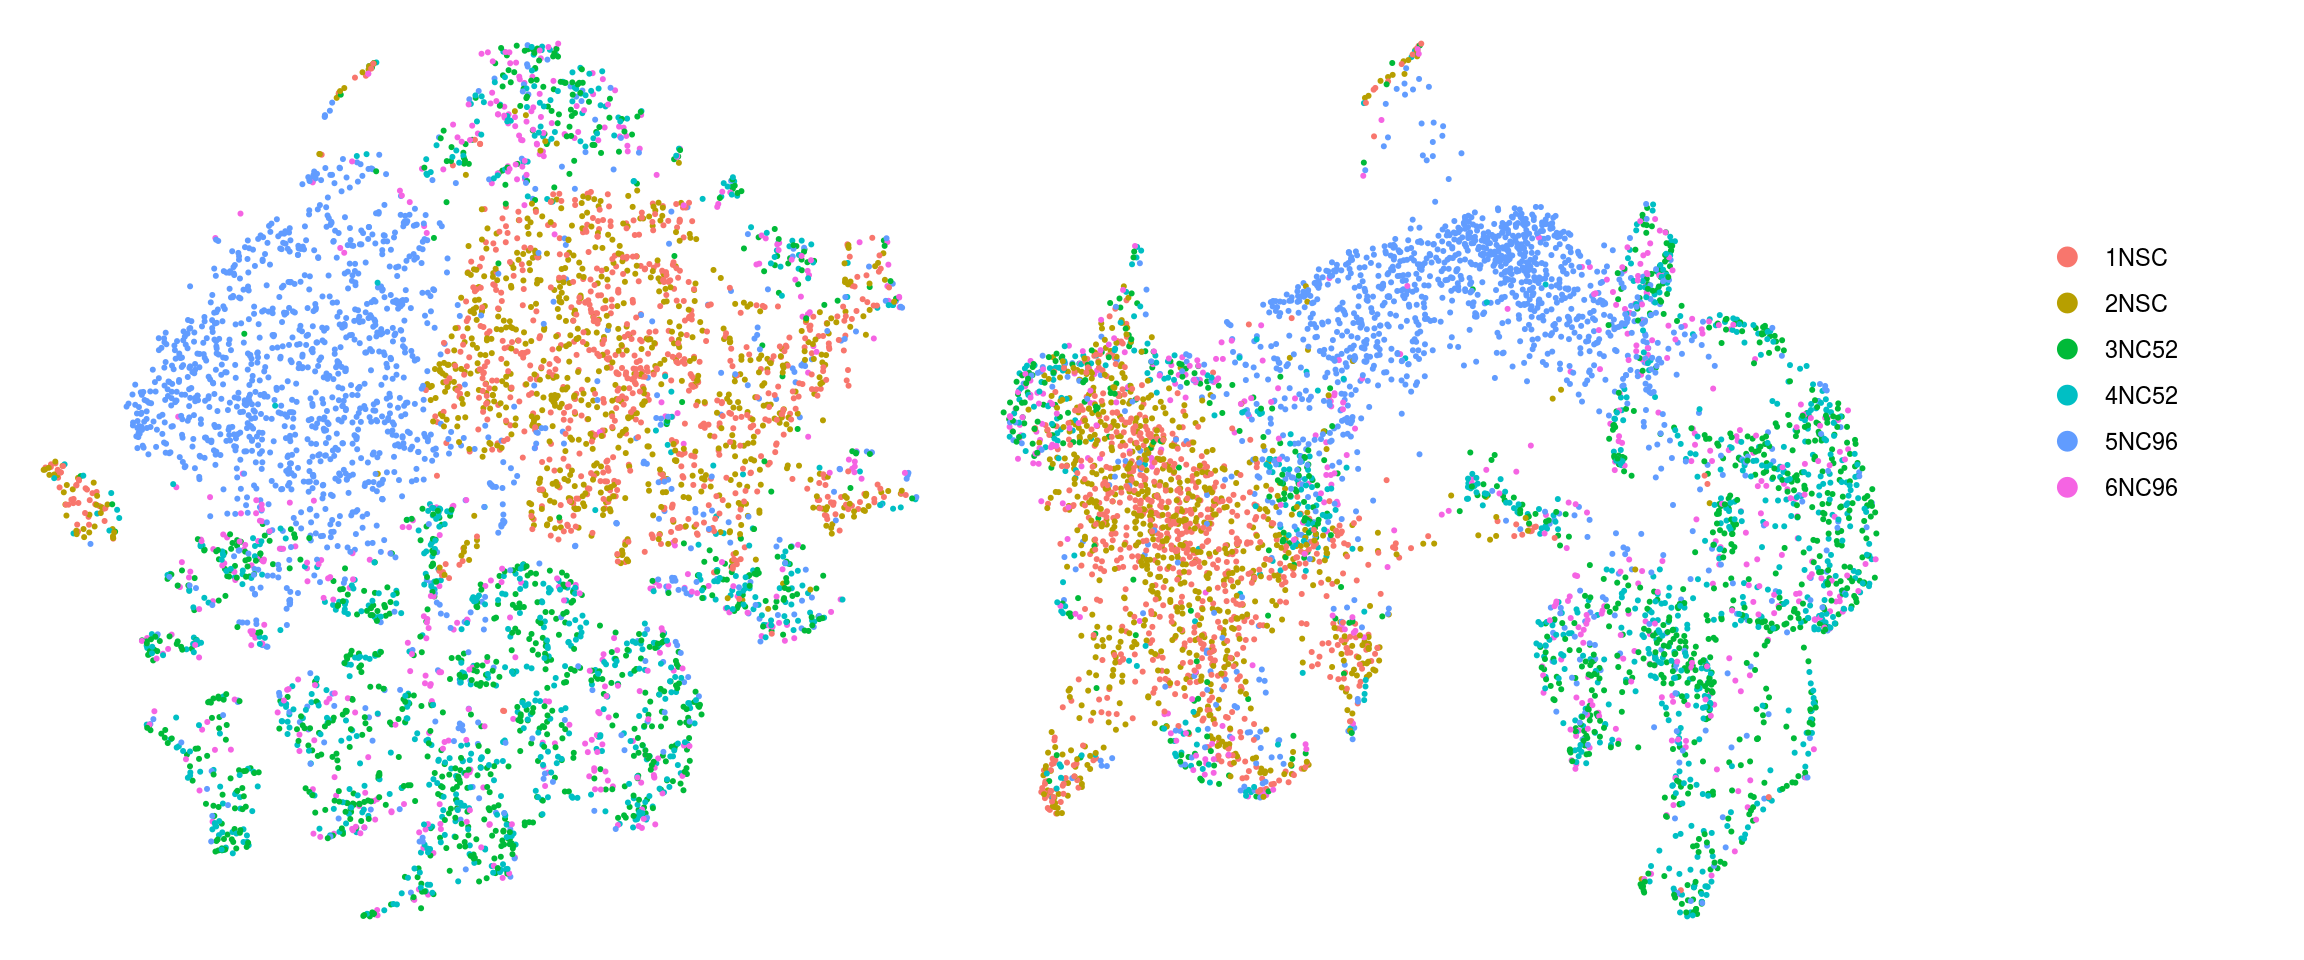
sample_id
sessionInfo()R version 4.0.0 (2020-04-24)
Platform: x86_64-pc-linux-gnu (64-bit)
Running under: Ubuntu 16.04.6 LTS
Matrix products: default
BLAS: /usr/local/R/R-4.0.0/lib/libRblas.so
LAPACK: /usr/local/R/R-4.0.0/lib/libRlapack.so
locale:
[1] LC_CTYPE=en_US.UTF-8 LC_NUMERIC=C
[3] LC_TIME=en_US.UTF-8 LC_COLLATE=en_US.UTF-8
[5] LC_MONETARY=en_US.UTF-8 LC_MESSAGES=en_US.UTF-8
[7] LC_PAPER=en_US.UTF-8 LC_NAME=C
[9] LC_ADDRESS=C LC_TELEPHONE=C
[11] LC_MEASUREMENT=en_US.UTF-8 LC_IDENTIFICATION=C
attached base packages:
[1] parallel stats4 grid stats graphics grDevices utils
[8] datasets methods base
other attached packages:
[1] Seurat_3.1.5 scran_1.16.0
[3] SingleCellExperiment_1.10.1 SummarizedExperiment_1.18.1
[5] DelayedArray_0.14.0 matrixStats_0.56.0
[7] Biobase_2.48.0 GenomicRanges_1.40.0
[9] GenomeInfoDb_1.24.0 IRanges_2.22.2
[11] S4Vectors_0.26.1 BiocGenerics_0.34.0
[13] viridis_0.5.1 viridisLite_0.3.0
[15] RColorBrewer_1.1-2 purrr_0.3.4
[17] muscat_1.2.0 dplyr_0.8.5
[19] ggplot2_3.3.0 cowplot_1.0.0
[21] ComplexHeatmap_2.4.2 workflowr_1.6.2
loaded via a namespace (and not attached):
[1] backports_1.1.7 circlize_0.4.9
[3] blme_1.0-4 igraph_1.2.5
[5] plyr_1.8.6 lazyeval_0.2.2
[7] TMB_1.7.16 splines_4.0.0
[9] BiocParallel_1.22.0 listenv_0.8.0
[11] scater_1.16.0 digest_0.6.25
[13] foreach_1.5.0 htmltools_0.4.0
[15] gdata_2.18.0 lmerTest_3.1-2
[17] magrittr_1.5 memoise_1.1.0
[19] cluster_2.1.0 doParallel_1.0.15
[21] ROCR_1.0-11 limma_3.44.1
[23] globals_0.12.5 annotate_1.66.0
[25] prettyunits_1.1.1 colorspace_1.4-1
[27] rappdirs_0.3.1 ggrepel_0.8.2
[29] blob_1.2.1 xfun_0.14
[31] jsonlite_1.6.1 crayon_1.3.4
[33] RCurl_1.98-1.2 genefilter_1.70.0
[35] lme4_1.1-23 zoo_1.8-8
[37] ape_5.3 survival_3.1-12
[39] iterators_1.0.12 glue_1.4.1
[41] gtable_0.3.0 zlibbioc_1.34.0
[43] XVector_0.28.0 leiden_0.3.3
[45] GetoptLong_0.1.8 BiocSingular_1.4.0
[47] future.apply_1.5.0 shape_1.4.4
[49] scales_1.1.1 DBI_1.1.0
[51] edgeR_3.30.0 Rcpp_1.0.4.6
[53] xtable_1.8-4 progress_1.2.2
[55] clue_0.3-57 reticulate_1.16
[57] dqrng_0.2.1 bit_1.1-15.2
[59] rsvd_1.0.3 tsne_0.1-3
[61] htmlwidgets_1.5.1 httr_1.4.1
[63] gplots_3.0.3 ellipsis_0.3.1
[65] ica_1.0-2 farver_2.0.3
[67] pkgconfig_2.0.3 XML_3.99-0.3
[69] uwot_0.1.8 locfit_1.5-9.4
[71] labeling_0.3 tidyselect_1.1.0
[73] rlang_0.4.6 reshape2_1.4.4
[75] later_1.0.0 AnnotationDbi_1.50.0
[77] munsell_0.5.0 tools_4.0.0
[79] RSQLite_2.2.0 ggridges_0.5.2
[81] evaluate_0.14 stringr_1.4.0
[83] yaml_2.2.1 knitr_1.28
[85] bit64_0.9-7 fs_1.4.1
[87] fitdistrplus_1.1-1 caTools_1.18.0
[89] RANN_2.6.1 pbapply_1.4-2
[91] future_1.17.0 nlme_3.1-148
[93] whisker_0.4 pbkrtest_0.4-8.6
[95] compiler_4.0.0 plotly_4.9.2.1
[97] beeswarm_0.2.3 png_0.1-7
[99] variancePartition_1.18.0 tibble_3.0.1
[101] statmod_1.4.34 geneplotter_1.66.0
[103] stringi_1.4.6 lattice_0.20-41
[105] Matrix_1.2-18 nloptr_1.2.2.1
[107] vctrs_0.3.0 pillar_1.4.4
[109] lifecycle_0.2.0 lmtest_0.9-37
[111] GlobalOptions_0.1.1 RcppAnnoy_0.0.16
[113] BiocNeighbors_1.6.0 data.table_1.12.8
[115] bitops_1.0-6 irlba_2.3.3
[117] patchwork_1.0.0 httpuv_1.5.2
[119] colorRamps_2.3 R6_2.4.1
[121] promises_1.1.0 KernSmooth_2.23-17
[123] gridExtra_2.3 vipor_0.4.5
[125] codetools_0.2-16 boot_1.3-25
[127] MASS_7.3-51.6 gtools_3.8.2
[129] assertthat_0.2.1 DESeq2_1.28.1
[131] rprojroot_1.3-2 rjson_0.2.20
[133] withr_2.2.0 sctransform_0.2.1
[135] GenomeInfoDbData_1.2.3 hms_0.5.3
[137] tidyr_1.1.0 glmmTMB_1.0.1
[139] minqa_1.2.4 rmarkdown_2.1
[141] DelayedMatrixStats_1.10.0 Rtsne_0.15
[143] git2r_0.27.1 numDeriv_2016.8-1.1
[145] ggbeeswarm_0.6.0