Murphy Data Cleaning and Visualization
Stella BooydeGraaff
2024-11-01 13:33:46
Last updated: 2024-11-01
Checks: 7 0
Knit directory: PODFRIDGE/
This reproducible R Markdown analysis was created with workflowr (version 1.7.1). The Checks tab describes the reproducibility checks that were applied when the results were created. The Past versions tab lists the development history.
Great! Since the R Markdown file has been committed to the Git repository, you know the exact version of the code that produced these results.
Great job! The global environment was empty. Objects defined in the global environment can affect the analysis in your R Markdown file in unknown ways. For reproduciblity it’s best to always run the code in an empty environment.
The command set.seed(20230302) was run prior to running
the code in the R Markdown file. Setting a seed ensures that any results
that rely on randomness, e.g. subsampling or permutations, are
reproducible.
Great job! Recording the operating system, R version, and package versions is critical for reproducibility.
Nice! There were no cached chunks for this analysis, so you can be confident that you successfully produced the results during this run.
Great job! Using relative paths to the files within your workflowr project makes it easier to run your code on other machines.
Great! You are using Git for version control. Tracking code development and connecting the code version to the results is critical for reproducibility.
The results in this page were generated with repository version e89e400. See the Past versions tab to see a history of the changes made to the R Markdown and HTML files.
Note that you need to be careful to ensure that all relevant files for
the analysis have been committed to Git prior to generating the results
(you can use wflow_publish or
wflow_git_commit). workflowr only checks the R Markdown
file, but you know if there are other scripts or data files that it
depends on. Below is the status of the Git repository when the results
were generated:
Ignored files:
    Ignored:    .RData
    Ignored:    .Rhistory
    Ignored:    .Rproj.user/
Note that any generated files, e.g. HTML, png, CSS, etc., are not included in this status report because it is ok for generated content to have uncommitted changes.
These are the previous versions of the repository in which changes were
made to the R Markdown (analysis/murphy.rmd) and HTML
(docs/murphy.html) files. If you’ve configured a remote Git
repository (see ?wflow_git_remote), click on the hyperlinks
in the table below to view the files as they were in that past version.
| File | Version | Author | Date | Message |
|---|---|---|---|---|
| html | f143ee1 | tinalasisi | 2024-09-16 | Revised website |
| Rmd | c7eb982 | Stella-Joy | 2024-09-04 | Small color shift in Race gradient |
| Rmd | 785760b | Stella-Joy | 2024-09-04 | Creating DTC figures |
| html | 785760b | Stella-Joy | 2024-09-04 | Creating DTC figures |
| Rmd | d6c9425 | Stella-Joy | 2024-09-03 | explanation update for Murphy FOIA |
| Rmd | f3d1e4e | Stella-Joy | 2024-09-01 | Updates to murphy foia figures |
| html | f3d1e4e | Stella-Joy | 2024-09-01 | Updates to murphy foia figures |
| Rmd | 85383cc | Stella-Joy | 2024-08-29 | changing colors but its ugly rn |
| html | 85383cc | Stella-Joy | 2024-08-29 | changing colors but its ugly rn |
| Rmd | 79694bd | Stella-Joy | 2024-08-18 | Complete first draft of data visualizations |
| html | 79694bd | Stella-Joy | 2024-08-18 | Complete first draft of data visualizations |
| Rmd | a7c07a3 | Stella-Joy | 2024-08-17 | Updates to murphy data visualizations |
| html | a7c07a3 | Stella-Joy | 2024-08-17 | Updates to murphy data visualizations |
| Rmd | 5e8c277 | Stella-Joy | 2024-08-16 | More race Graphs |
| Rmd | 1131bc8 | Stella-Joy | 2024-08-15 | Creating Race Visuals |
| Rmd | 883cdaa | Stella-Joy | 2024-08-09 | Fixed data cleaning |
| Rmd | e8cab2f | Stella-Joy | 2024-08-08 | visualizations for sex and offender_type |
| html | bdc3293 | linmatch | 2024-07-29 | update child_distribution plot |
| Rmd | 5434bd4 | linmatch | 2024-07-25 | fix pipe |
| Rmd | 6cc6921 | linmatch | 2024-07-25 | calculate total by sex |
| Rmd | 1971685 | Stella-Joy | 2024-07-25 | fix male / female issue, start visualizing sex |
| Rmd | 66a01cb | Stella-Joy | 2024-07-25 | Remove root.dir |
| html | 66a01cb | Stella-Joy | 2024-07-25 | Remove root.dir |
| Rmd | 5d0cc04 | Stella-Joy | 2024-07-25 | Cleaned data |
| Rmd | 81560c5 | Stella-Joy | 2024-07-25 | Stella commit |
| html | 8800e0e | Stella-Joy | 2024-07-20 | Update murphy.html |
| Rmd | d0fa29a | Alec Yueh | 2024-07-17 | Murphy Data |
| html | d0fa29a | Alec Yueh | 2024-07-17 | Murphy Data |
| Rmd | a2f6579 | Alec Yueh | 2024-07-08 | created Murphy page |
| html | a2f6579 | Alec Yueh | 2024-07-08 | created Murphy page |
Visualizations of State DNA Databases
Below is a small sample of the data set used to create these visualizations.
| State | variable_detailed | variable_type | value | value_type |
|---|---|---|---|---|
| Alabama | white_state | race | 0.660 | proportion |
| California | male_convicted_offender | sex | 1603222.000 | number |
| Rhode_Island | white_annual | race | 0.543 | proportion |
| Delaware | hispanic_annual | race | 0.056 | proportion |
| South Dakota | native_american_total | race | 14593.000 | number |
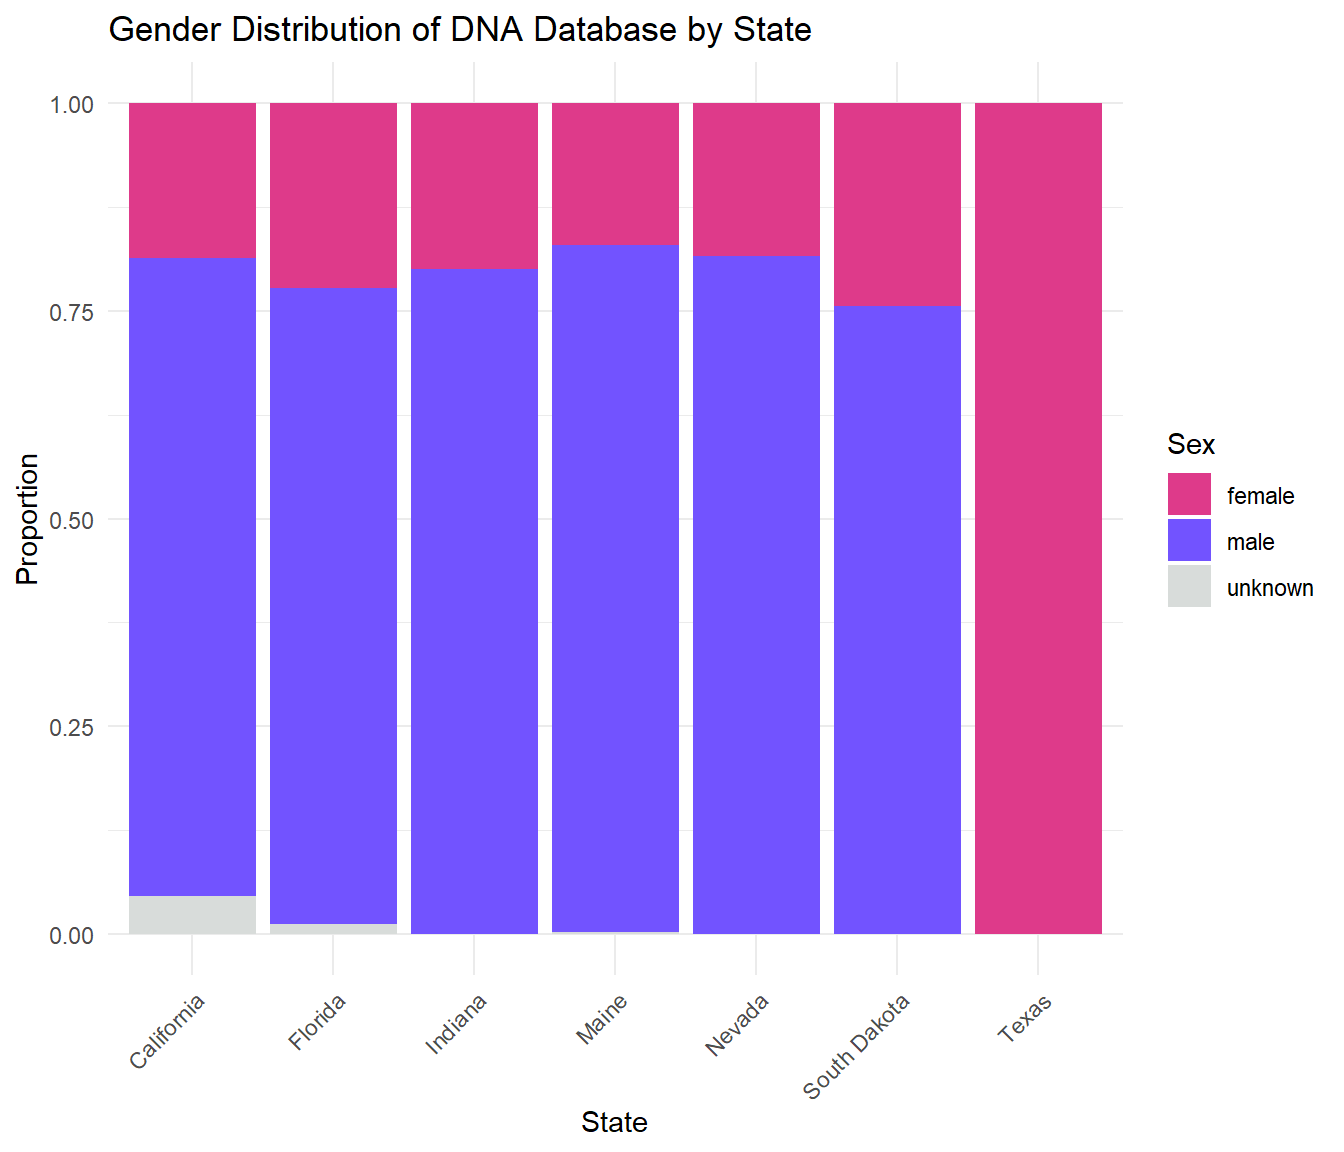
Data on Sex
The following bar chart shows the gender breakdown of the state DNA databases.
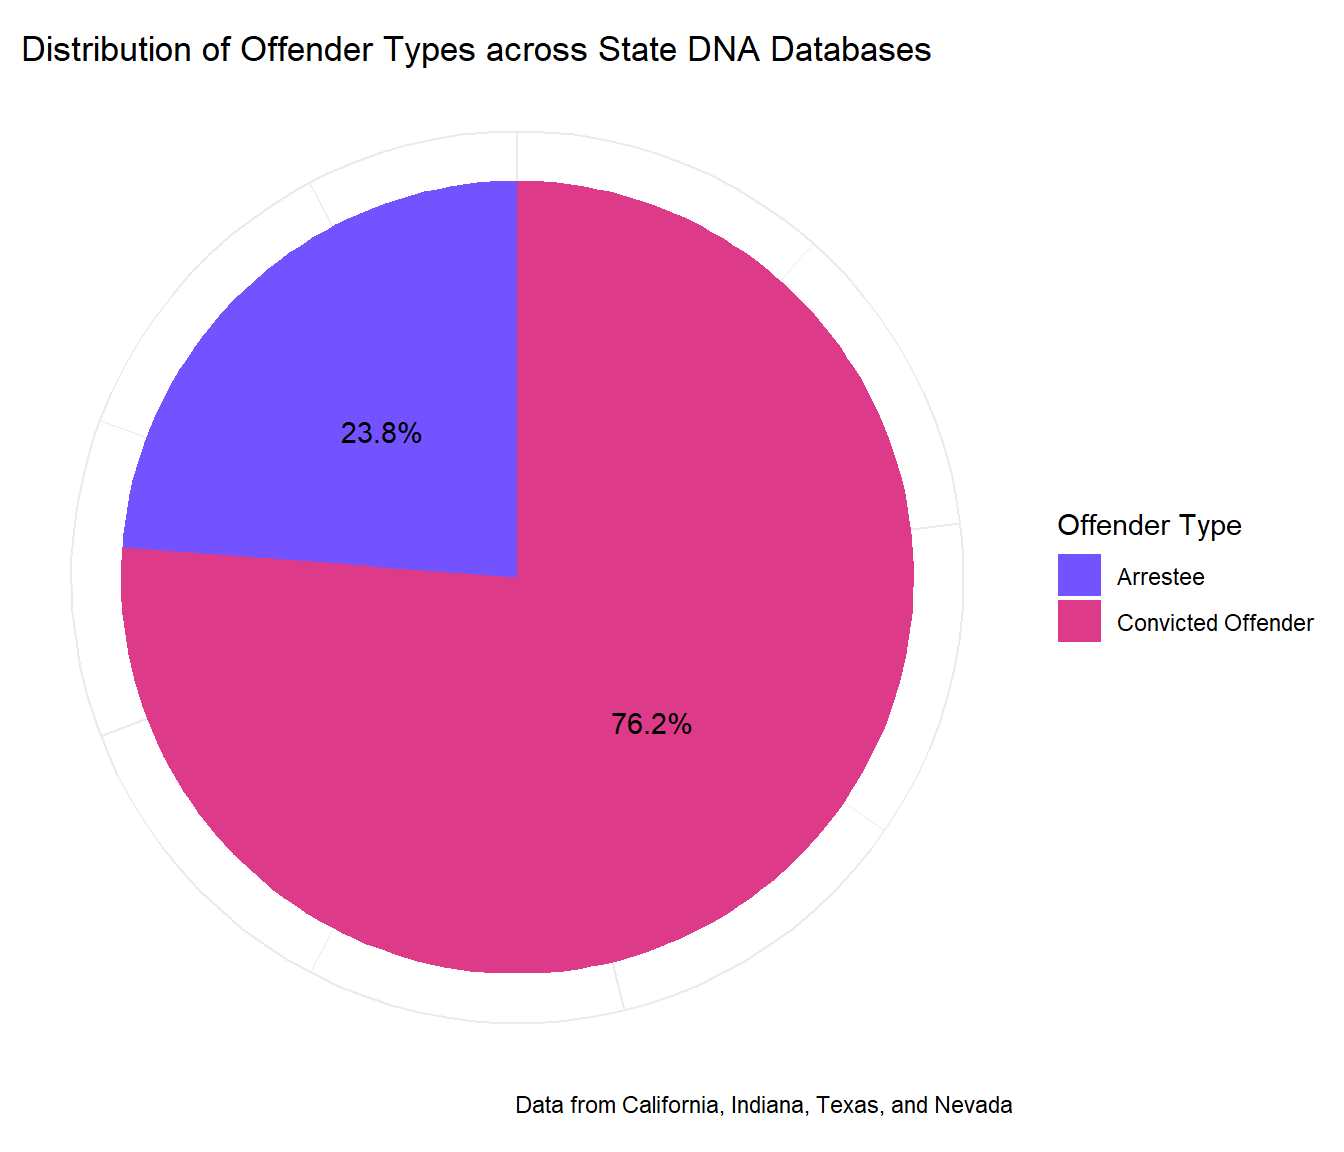
Data on Offender Type
The following pie chart shows a summary of the proportions of arrestees and convicted offenders in the state DNA databases.
Data on Race
State Demographics
Below are some summary statistics of the racial demographics of each state’s total population.
| State | percentage |
|---|---|
| Mississippi | 37.6 |
| Louisiana | 32.5 |
| Georgia | 31.7 |
| State | percentage |
|---|---|
| Montana | 0.6 |
| Idaho | 0.8 |
| Utah | 1.3 |
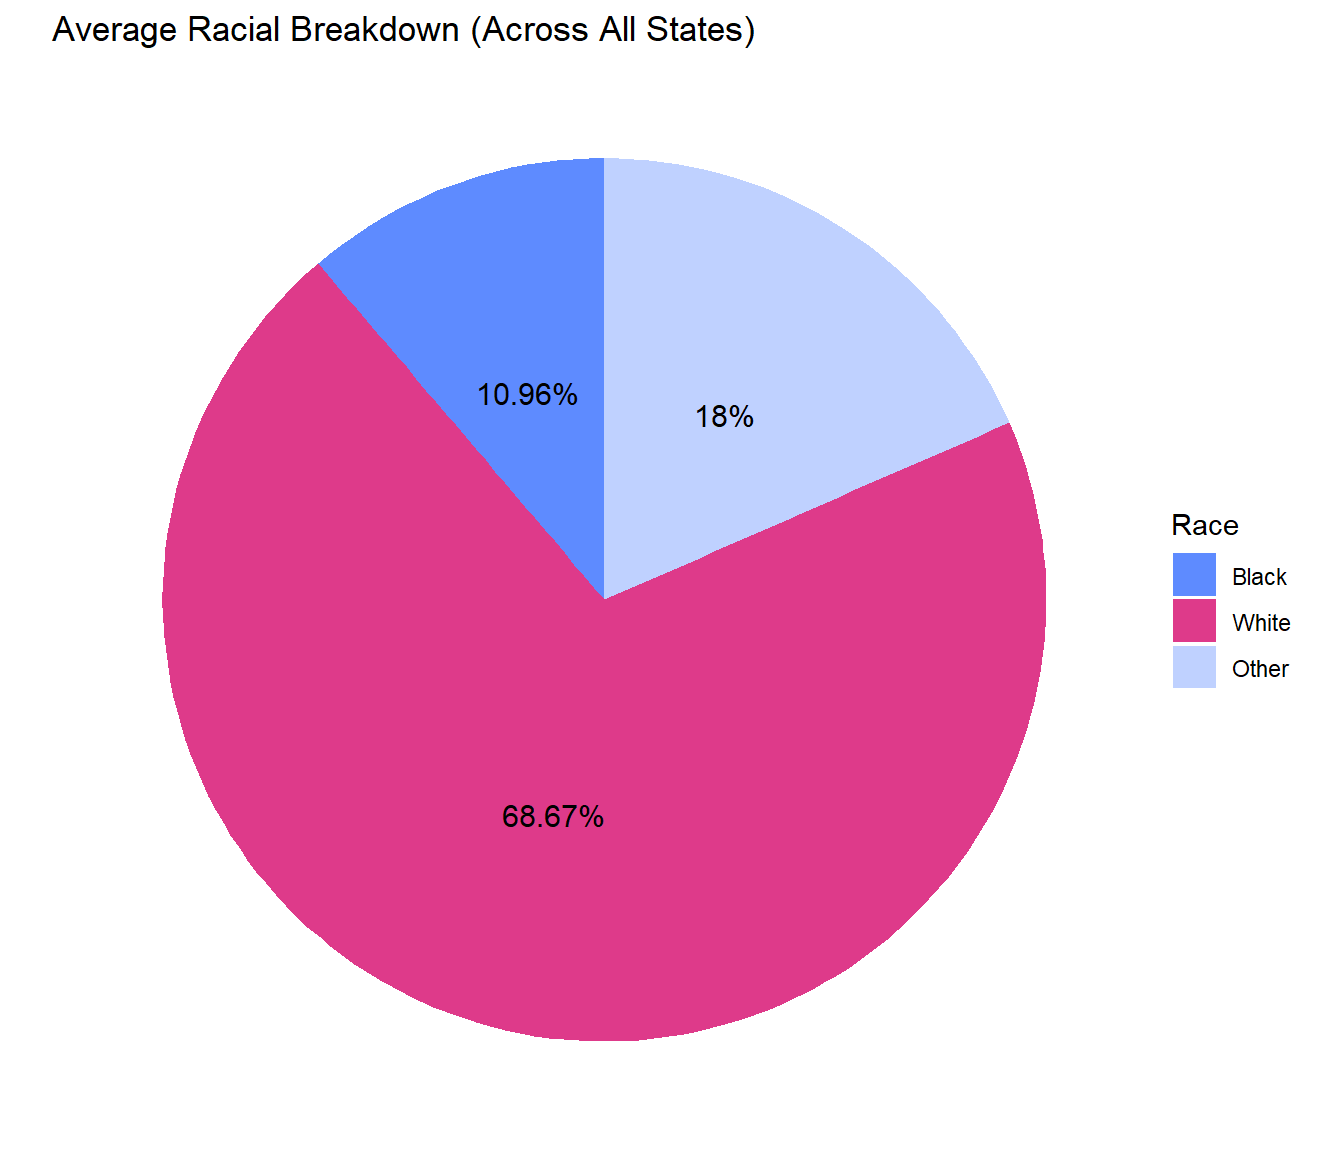
And below is the average proportion of Black people in a state and the average proportion of Black people in a state’s DNA database.
| average_proportion |
|---|
| 10.96 |
| average_proportion |
|---|
| 20.93429 |
On average, Black Americans make up 10.96% of their state, but 20.93% of their state’s DNA database, displaying the racial disparities in these databases.
Race Totals
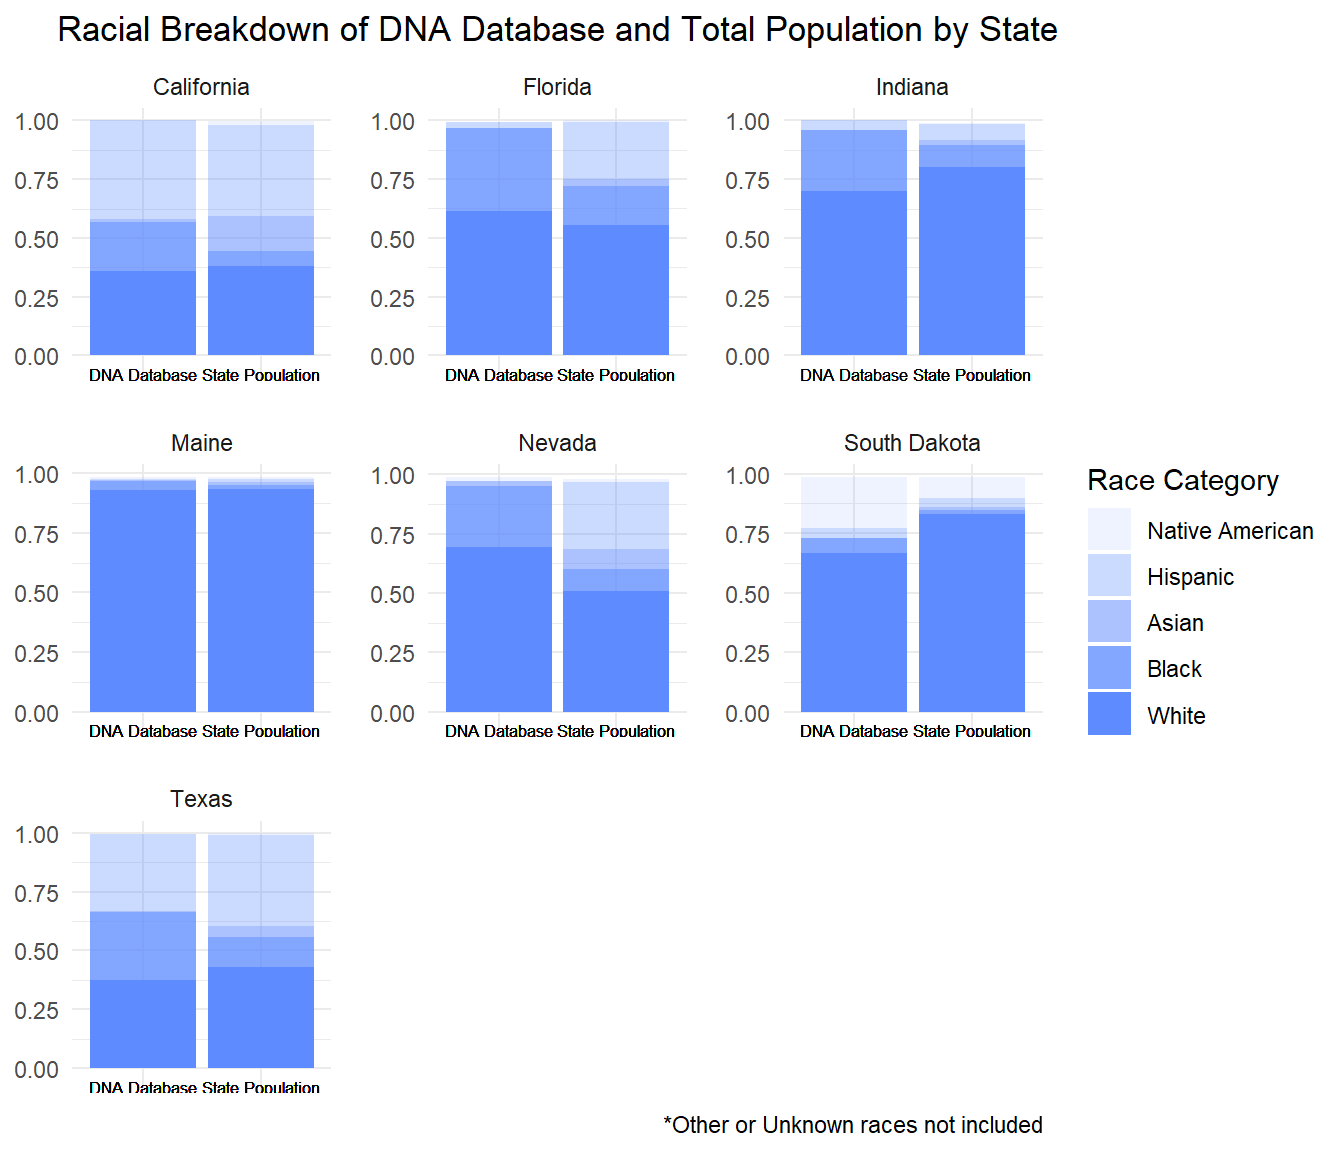
The following bar chart displays the proportions of each race in a state’s DNA database.
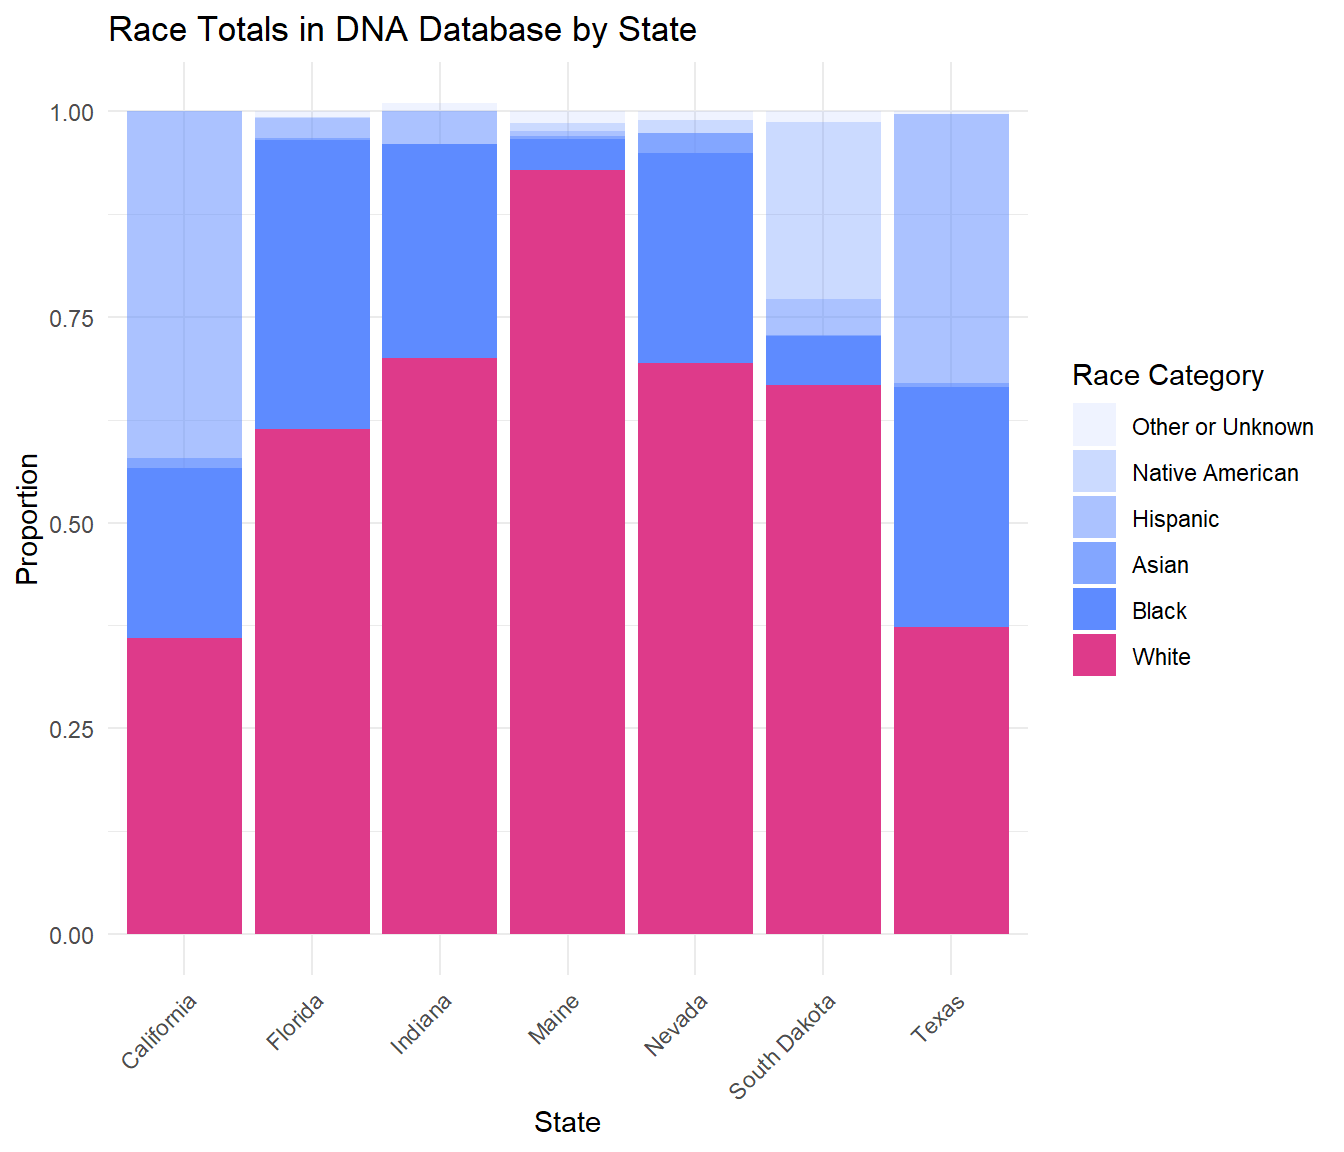
Despite White Americans usually making up the majority of the population in the database, there is still a significant disparity present in this data. Comparing this to a graph of the racial breakdown of the total population in each of these states uncovers that Black Americans and other people of color are over represented in their state’s database.
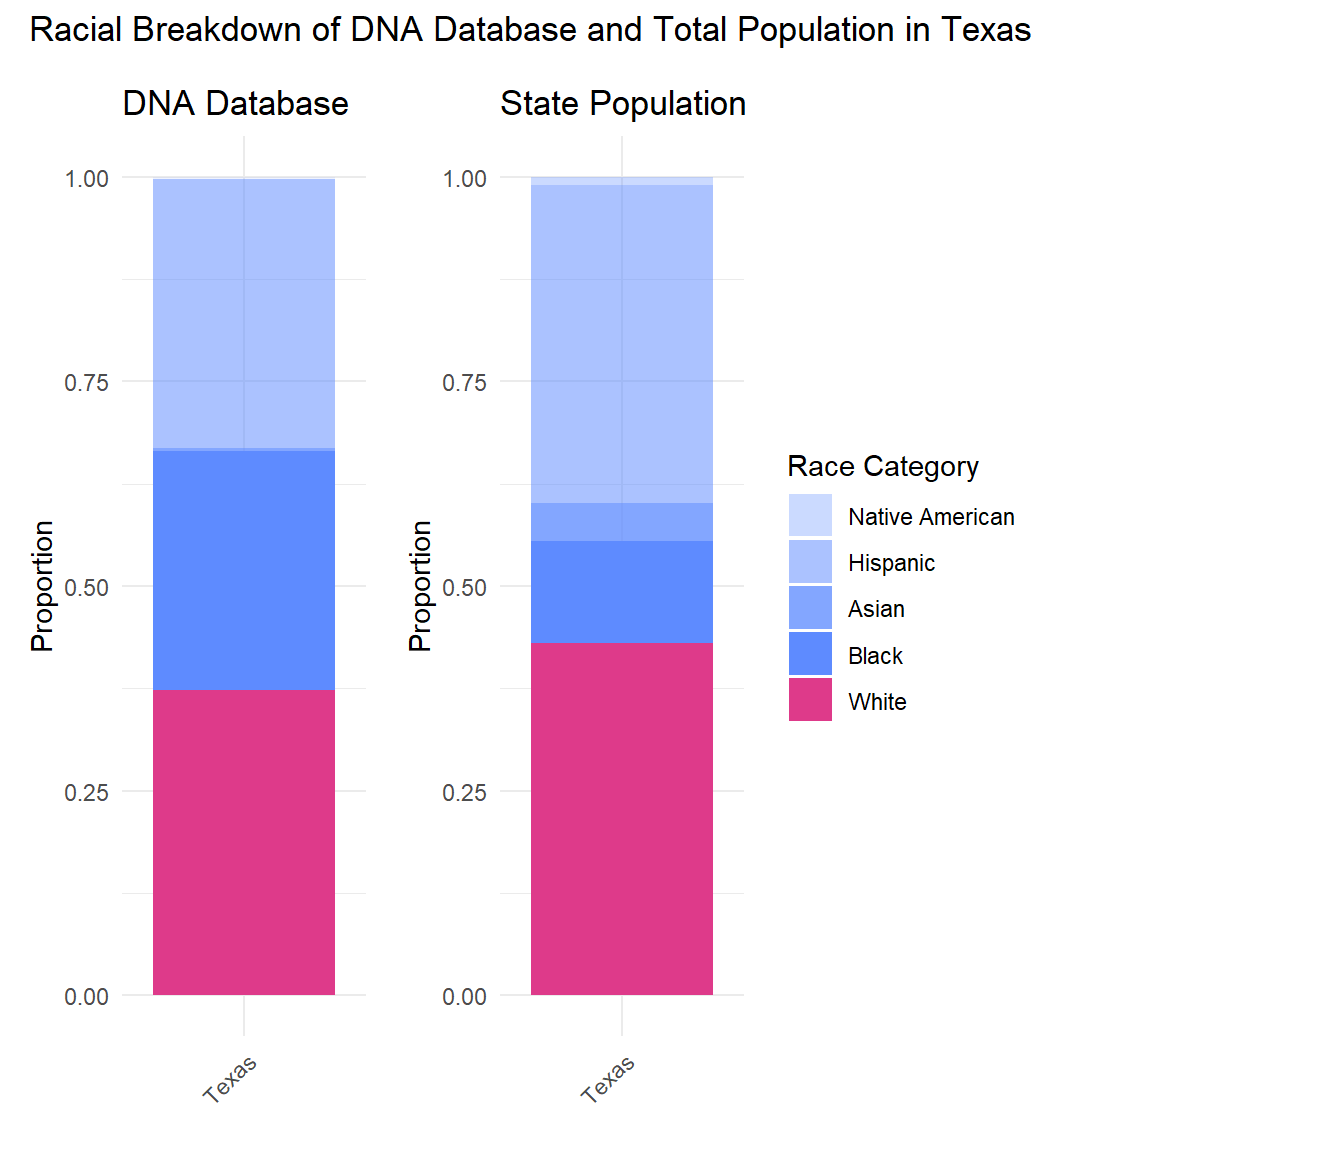
As you can see, the proportion of Black people in the population of Texas is much smaller than the proportion of Black people in the Texas DNA database. Conversely, the proportion of White people in the DNA database is smaller than the percent of the state’s population that is White. This pattern is true for most other states shown below, highlighting the over-representation of Black Americans in the DNA databases.
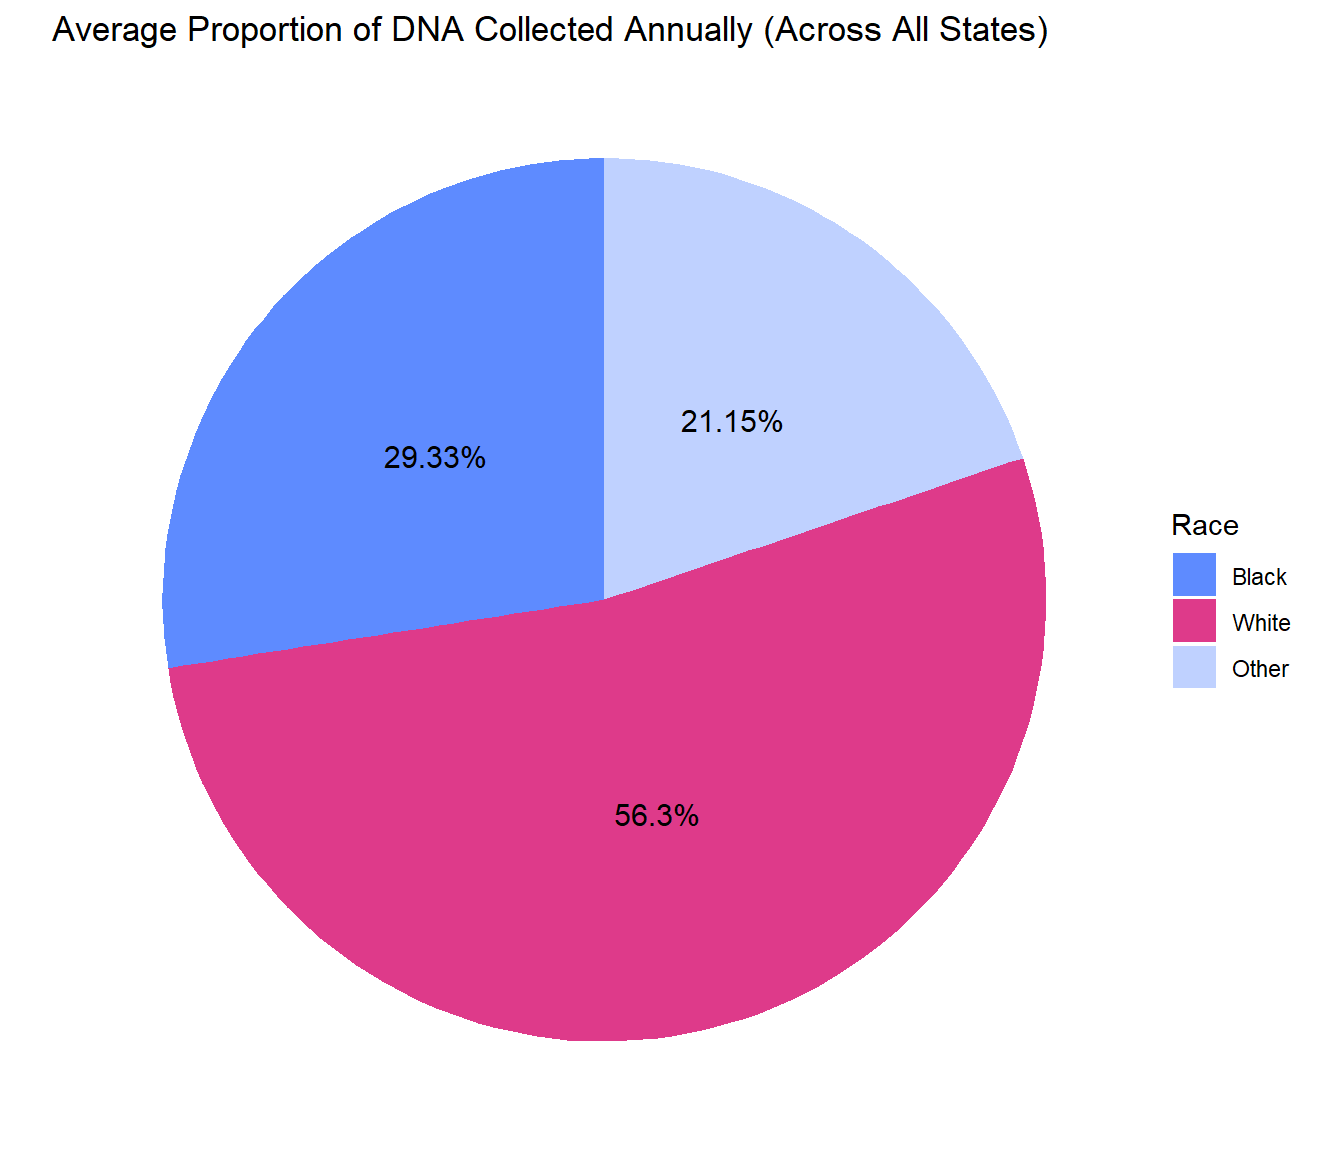
Annual DNA Collection
These summary statistics describe the racial breakdown of DNA collected annually by state. On average, the percentage of DNA collected annually that is from Black Americans is 29.33% and the percentage of DNA collected annually that is from White Americans is 56.3%.
| percentage |
|---|
| 29.33 |
| percentage |
|---|
| 56.3 |
These pie charts show the comparison of the proportion of races with DNA collected and the racial breakdown of the population across all states. We can clearly see from these charts the overwhelming over representation of Black Americans with DNA collected annually compared to the percentage of the population that they make up. The same thing is true for other people of color, and the opposite is true for White Americans, whose DNA is less likely to be collected.
The state with the highest proportion of their DNA database containing Black Americans is Delaware (79.9%) and the state with the lowest proportion of their DNA database containing Black Americans is Montana (1.6%).
| State | percentage |
|---|---|
| Delaware | 79.9 |
| State | percentage |
|---|---|
| Montana | 1.9 |
| State | percentage |
|---|---|
| New_Hampshire | 92.6 |
| State | percentage |
|---|---|
| New_York | 12.9 |
Percent of Population Collected (by Race)
We can look at this data further and compare it to the racial breakdown of the total population in each state to explore the percentage of that population whose DNA has been collected.
For most states, the percentage of non-White people whose DNA is collected annually is much greater compared to White people. This disparity is most apparent for the Black population, which consistently shows the highest proportion of DNA collected.
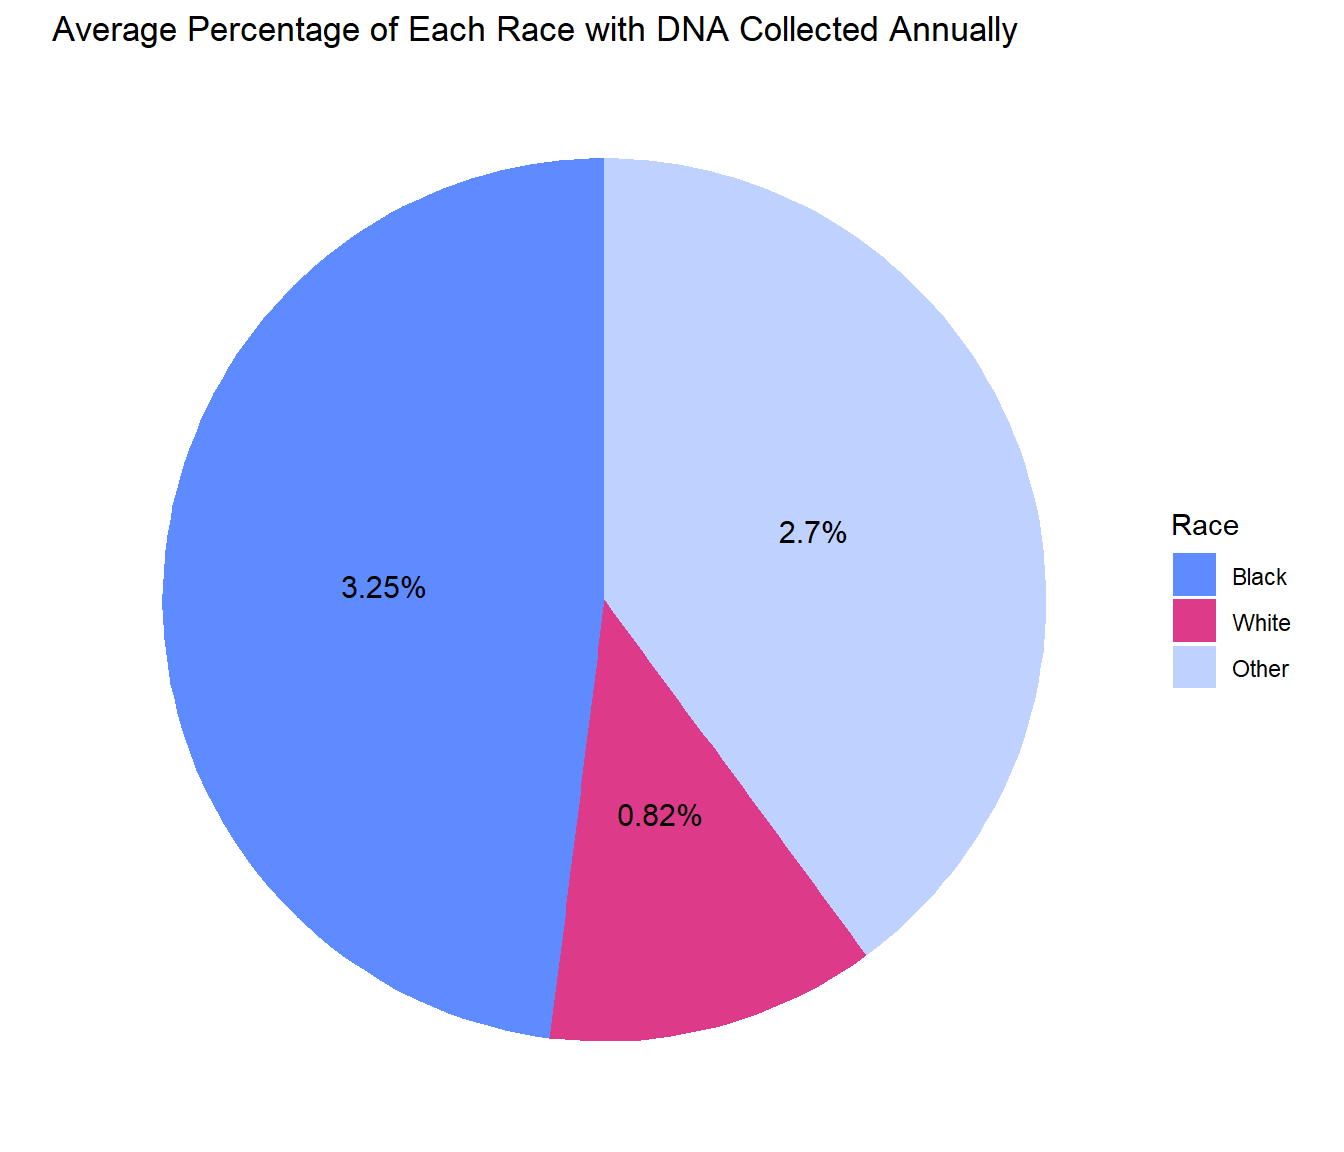
Printed below are the average proportions across all states of people whose DNA is collected annually, divided by race. For example, the average percentage of Black Americans whose DNA is collected annually is 3.25%, meaning on average, 3.25% of the Black population has DNA collected annually. Other people of color have an average of 2.7% collected annually, compared to the White population, whose average percent of population with DNA collected is only 0.82%.
R version 4.4.1 (2024-06-14 ucrt)
Platform: x86_64-w64-mingw32/x64
Running under: Windows 11 x64 (build 22631)

Matrix products: default


locale:
[1] LC_COLLATE=English_United States.utf8
[2] LC_CTYPE=English_United States.utf8
[3] LC_MONETARY=English_United States.utf8
[4] LC_NUMERIC=C
[5] LC_TIME=English_United States.utf8

time zone: America/New_York
tzcode source: internal

attached base packages:
[1] stats     graphics  grDevices utils     datasets  methods   base

other attached packages:
 [1] patchwork_1.2.0 knitr_1.48      lubridate_1.9.3 forcats_1.0.0
 [5] stringr_1.5.1   dplyr_1.1.4     purrr_1.0.2     readr_2.1.5
 [9] tidyr_1.3.1     tibble_3.2.1    ggplot2_3.5.1   tidyverse_2.0.0

loaded via a namespace (and not attached):
 [1] sass_0.4.9        utf8_1.2.4        generics_0.1.3    stringi_1.8.4
 [5] hms_1.1.3         digest_0.6.36     magrittr_2.0.3    timechange_0.3.0
 [9] evaluate_0.24.0   grid_4.4.1        fastmap_1.2.0     rprojroot_2.0.4
[13] workflowr_1.7.1   jsonlite_1.8.8    whisker_0.4.1     promises_1.3.0
[17] fansi_1.0.6       scales_1.3.0      jquerylib_0.1.4   cli_3.6.3
[21] crayon_1.5.3      rlang_1.1.4       bit64_4.0.5       munsell_0.5.1
[25] withr_3.0.0       cachem_1.1.0      yaml_2.3.9        parallel_4.4.1
[29] tools_4.4.1       tzdb_0.4.0        colorspace_2.1-0  httpuv_1.6.15
[33] vctrs_0.6.5       R6_2.5.1          lifecycle_1.0.4   git2r_0.33.0
[37] bit_4.0.5         fs_1.6.4          vroom_1.6.5       pkgconfig_2.0.3
[41] pillar_1.9.0      bslib_0.7.0       later_1.3.2       gtable_0.3.5
[45] glue_1.7.0        Rcpp_1.0.12       highr_0.11        xfun_0.45
[49] tidyselect_1.2.1  rstudioapi_0.16.0 farver_2.1.2      htmltools_0.5.8.1
[53] labeling_0.4.3    rmarkdown_2.27    compiler_4.4.1