assign labels
Mechthild Lütge
31 July 2022
Last updated: 2022-12-02
Checks: 6 1
Knit directory: humanCardiacFibroblasts/
This reproducible R Markdown analysis was created with workflowr (version 1.7.0). The Checks tab describes the reproducibility checks that were applied when the results were created. The Past versions tab lists the development history.
The R Markdown file has unstaged changes. To know which version of
the R Markdown file created these results, you’ll want to first commit
it to the Git repo. If you’re still working on the analysis, you can
ignore this warning. When you’re finished, you can run
wflow_publish to commit the R Markdown file and build the
HTML.
Great job! The global environment was empty. Objects defined in the global environment can affect the analysis in your R Markdown file in unknown ways. For reproduciblity it’s best to always run the code in an empty environment.
The command set.seed(20210903) was run prior to running
the code in the R Markdown file. Setting a seed ensures that any results
that rely on randomness, e.g. subsampling or permutations, are
reproducible.
Great job! Recording the operating system, R version, and package versions is critical for reproducibility.
Nice! There were no cached chunks for this analysis, so you can be confident that you successfully produced the results during this run.
Great job! Using relative paths to the files within your workflowr project makes it easier to run your code on other machines.
Great! You are using Git for version control. Tracking code development and connecting the code version to the results is critical for reproducibility.
The results in this page were generated with repository version e469ce4. See the Past versions tab to see a history of the changes made to the R Markdown and HTML files.
Note that you need to be careful to ensure that all relevant files for
the analysis have been committed to Git prior to generating the results
(you can use wflow_publish or
wflow_git_commit). workflowr only checks the R Markdown
file, but you know if there are other scripts or data files that it
depends on. Below is the status of the Git repository when the results
were generated:
Ignored files:
    Ignored:    .DS_Store
    Ignored:    .Rhistory
    Ignored:    .Rproj.user/
    Ignored:    analysis/figure/
    Ignored:    data/GSEA/
    Ignored:    data/humanFibroblast/
    Ignored:    figure/DEgenesGZplusSG_Groups.Rmd/.DS_Store

Unstaged changes:
    Modified:   analysis/assignLabelshumanHeartsPlusGrazIntWoHH.Rmd
    Modified:   analysis/integrateAcrossPatientsGZplusSG.Rmd
Note that any generated files, e.g. HTML, png, CSS, etc., are not included in this status report because it is ok for generated content to have uncommitted changes.
These are the previous versions of the repository in which changes were
made to the R Markdown
(analysis/assignLabelshumanHeartsPlusGrazIntWoHH.Rmd) and
HTML (docs/assignLabelshumanHeartsPlusGrazIntWoHH.html)
files. If you’ve configured a remote Git repository (see
?wflow_git_remote), click on the hyperlinks in the table
below to view the files as they were in that past version.
| File | Version | Author | Date | Message |
|---|---|---|---|---|
| Rmd | e469ce4 | mluetge | 2022-11-29 | add samples with Htrans |
| html | e469ce4 | mluetge | 2022-11-29 | add samples with Htrans |
load packages
suppressPackageStartupMessages({
  library(SingleCellExperiment)
  library(tidyverse)
  library(Seurat)
  library(magrittr)
  library(dplyr)
  library(purrr)
  library(ggplot2)
  library(here)
  library(runSeurat3)
  library(ggsci)
  library(ggpubr)
  library(pheatmap)
  library(viridis)
  library(sctransform)
})
load data
basedir <- here()
seurat <- readRDS(file = paste0(basedir,
                              "/data/humanHeartsPlusGraz_intPatients_merged",
                              "_seurat.rds"))
Idents(seurat) <- seurat$seurat_clusters
table(seurat$ID)
 GZ1 GZ14 GZ15 GZ16 GZ17 GZ18  GZ2 GZ20  GZ3  GZ4  GZ5  GZ6 SG21 SG24 SG25 SG28
2740 1268 4439  436 1370 2280 1684 2706 2396  545  781  491 1536 2381 3131 1545
SG29 SG31 SG32 SG33 SG34 SG35
2496 1192 1428 6286  620 2363
assign labels
seurat$label <- "other"
seurat$label[which(seurat$integrated_snn_res.0.6 %in% c("2","9"))] <- "Endothelial"
seurat$label[which(seurat$integrated_snn_res.0.6 %in% c("8"))] <- "EndoEC"
seurat$label[which(seurat$integrated_snn_res.0.6 %in% c("13"))] <- "LEC"
seurat$label[which(seurat$integrated_snn_res.0.6 %in% c("4", "11"))] <- "Tcell"
seurat$label[which(seurat$integrated_snn_res.0.6 %in% c("5"))] <- "Cardiomyocyte"
seurat$label[which(seurat$integrated_snn_res.0.6 %in% c("0", "3"))] <- "Fibroblast"
seurat$label[which(seurat$integrated_snn_res.0.6 %in% c("1"))] <- "Perivascular"
seurat$label[which(seurat$integrated_snn_res.0.6 %in% c("10"))] <- "SMC"
seurat$label[which(seurat$integrated_snn_res.0.6 %in% c("7"))] <- "resMacrophage"
seurat$label[which(seurat$integrated_snn_res.0.6 %in% c("6"))] <- "infMacrophage"
seurat$label[which(seurat$integrated_snn_res.0.6 %in% c("12"))] <- "NeuralCells"
seurat$label[which(seurat$integrated_snn_res.0.6 %in% c("14"))] <- "Adipocytes"

# ## reembedding of cluster 4 (mix of diff cell typpes)
# seuratSub <- subset(seurat, integrated_snn_res.0.4=="4")
#
# seuratSub <- rerunSeurat3(seuratSub)
# Tcell <- colnames(seuratSub)[which(seuratSub$RNA_snn_res.0.4 %in% c("0", "3","6", "5", "11"))]
# endo1 <- colnames(seuratSub)[which(seuratSub$RNA_snn_res.0.4 %in% c("1"))]
# fibro <- colnames(seuratSub)[which(seuratSub$RNA_snn_res.0.4 %in% c("2"))]
# peri <- colnames(seuratSub)[which(seuratSub$RNA_snn_res.0.4 %in% c("9", "12"))]
# Adipo <- colnames(seuratSub)[which(seuratSub$RNA_snn_res.0.4 %in% c("7"))]
# resmacro <- colnames(seuratSub)[which(seuratSub$RNA_snn_res.0.4 %in% c("4", "13"))]
# infmacro <- colnames(seuratSub)[which(seuratSub$RNA_snn_res.0.4 %in% c("8"))]
# LEC <- colnames(seuratSub)[which(seuratSub$RNA_snn_res.0.4 %in% c("10"))]
#
#
# seurat$label[which(colnames(seurat) %in% Tcell)] <- "Tcell"
# seurat$label[which(colnames(seurat) %in% peri)] <- "Perivascular"
# seurat$label[which(colnames(seurat) %in% endo1)] <- "Endothelial"
# seurat$label[which(colnames(seurat) %in% fibro)] <- "Fibroblast"
# seurat$label[which(colnames(seurat) %in% Adipo)] <- "Adipocytes"
# seurat$label[which(colnames(seurat) %in% resmacro)] <- "resMacrophage"
# seurat$label[which(colnames(seurat) %in% infmacro)] <- "infMacrophage"
# seurat$label[which(colnames(seurat) %in% LEC)] <- "LEC"
#
# unique(seurat$integrated_snn_res.0.4)
# seurat$clust <- as.character(seurat$integrated_snn_res.0.4)
# seurat$clust[which(seurat$integrated_snn_res.0.6 == "8")] <- "11"
# seurat$clust[which(colnames(seurat) %in% Tcell)] <- "12"
# seurat$clust[which(colnames(seurat) %in% peri)] <- "13"
# seurat$clust[which(colnames(seurat) %in% endo1)] <- "14"
# seurat$clust[which(colnames(seurat) %in% fibro)] <- "15"
# seurat$clust[which(colnames(seurat) %in% Adipo)] <- "16"
# seurat$clust[which(colnames(seurat) %in% resmacro)] <- "17"
# seurat$clust[which(colnames(seurat) %in% infmacro)] <- "18"
# seurat$clust[which(colnames(seurat) %in% LEC)] <- "19"
color vectors
colPal <- c(pal_igv()(12),
            pal_aaas()(10))[1:length(levels(seurat))]
colTec <- pal_jama()(length(unique(seurat$technique)))
colSmp <- c(pal_uchicago()(9), pal_npg()(10), pal_aaas()(10),
            pal_jama()(7))[1:length(unique(seurat$dataset))]
colCond <- pal_npg()(length(unique(seurat$cond)))
colID <- c(pal_jco()(10), pal_npg()(10), pal_futurama()(10),
           pal_d3()(10))[1:length(unique(seurat$ID))]
colOrig <- pal_aaas()(length(unique(seurat$origin)))
colIso <- pal_nejm()(length(unique(seurat$isolation)))
colProc <- pal_aaas()(length(unique(seurat$processing)))
colLab <- c(pal_futurama()(8), pal_uchicago()(6))[1:length(unique(seurat$label))]

names(colPal) <- levels(seurat)
names(colTec) <- unique(seurat$technique)
names(colSmp) <- unique(seurat$dataset)
names(colCond) <- unique(seurat$cond)
names(colID) <- unique(seurat$ID)
names(colOrig) <- unique(seurat$origin)
names(colIso) <- unique(seurat$isolation)
names(colProc) <- unique(seurat$processing)
names(colLab) <- unique(seurat$label)
vis data
clusters
DimPlot(seurat, reduction = "umap", cols=colPal)+
  theme_bw() +
  theme(axis.text = element_blank(), axis.ticks = element_blank(),
        panel.grid.minor = element_blank()) +
  xlab("UMAP1") +
  ylab("UMAP2")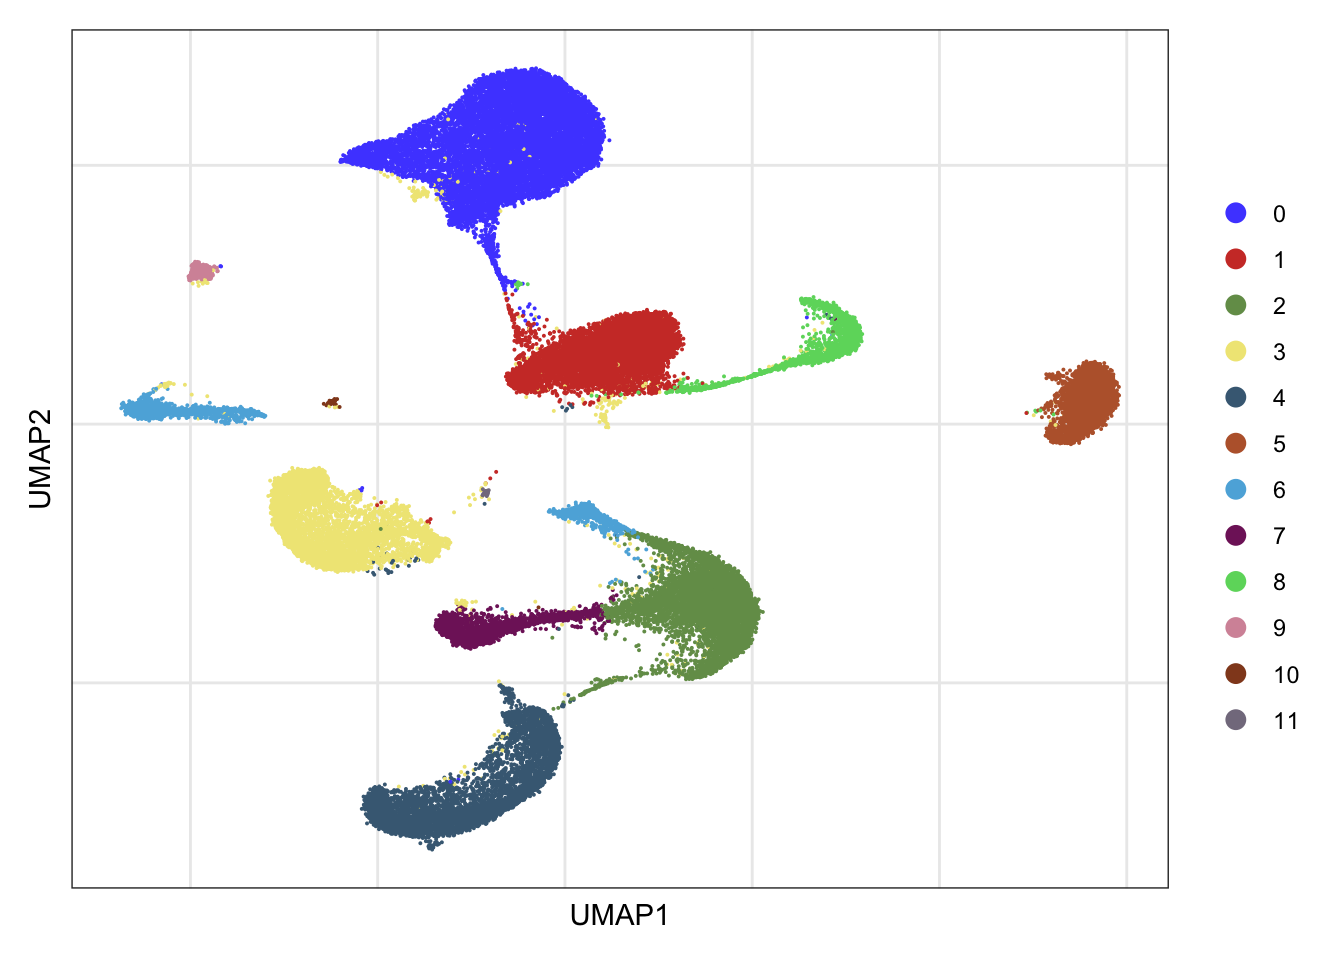
| Version | Author | Date |
|---|---|---|
| e469ce4 | mluetge | 2022-11-29 |
DimPlot(seurat, reduction = "umap", cols=colPal,
        shuffle = T)+
  theme_void()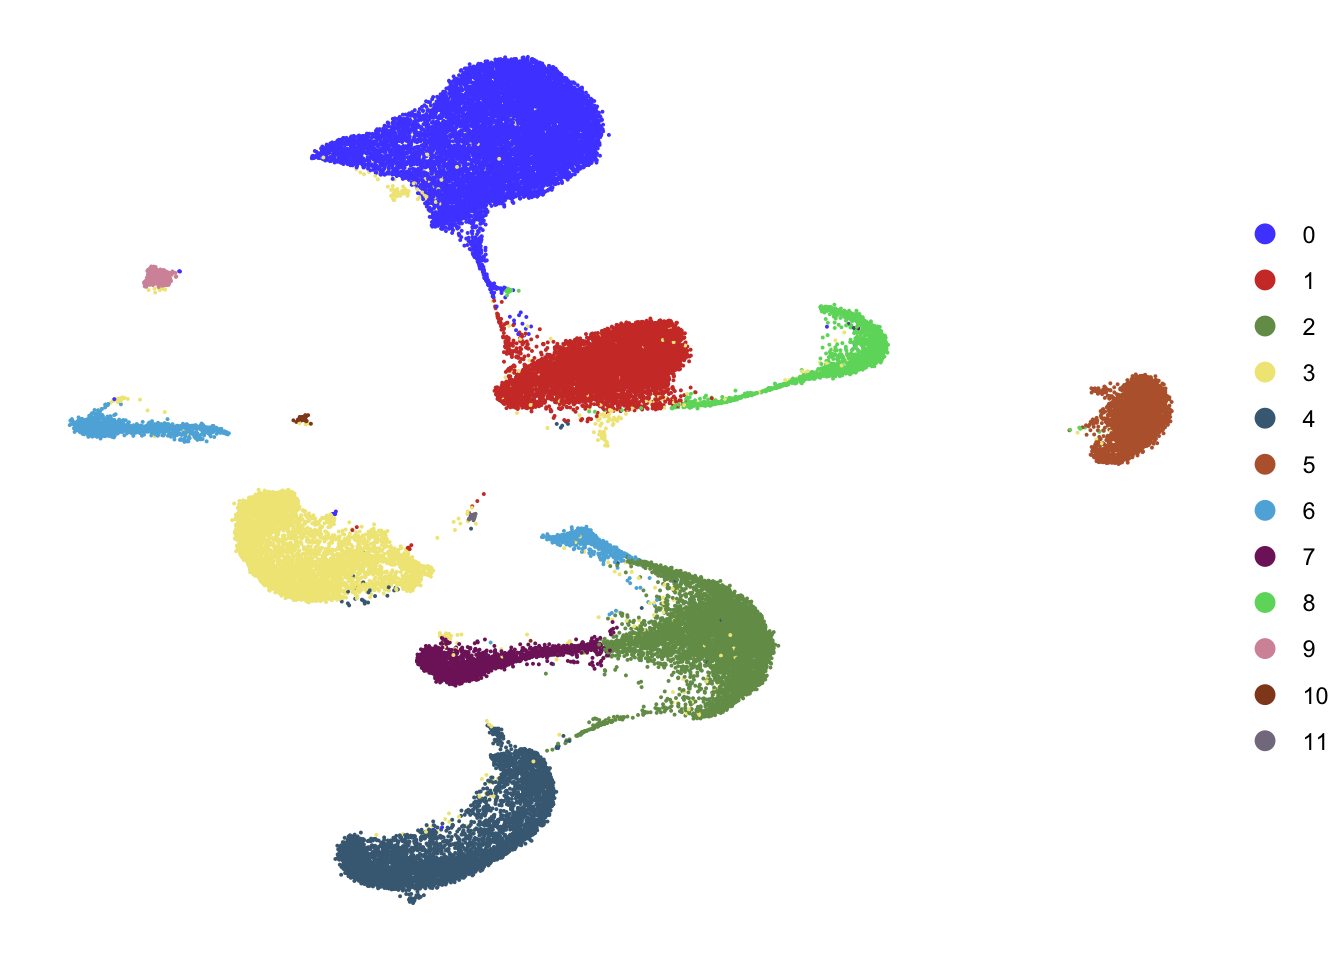
| Version | Author | Date |
|---|---|---|
| e469ce4 | mluetge | 2022-11-29 |
label
DimPlot(seurat, reduction = "umap",  group.by = "label", cols=colLab)+
  theme_bw() +
  theme(axis.text = element_blank(), axis.ticks = element_blank(),
        panel.grid.minor = element_blank()) +
  xlab("UMAP1") +
  ylab("UMAP2")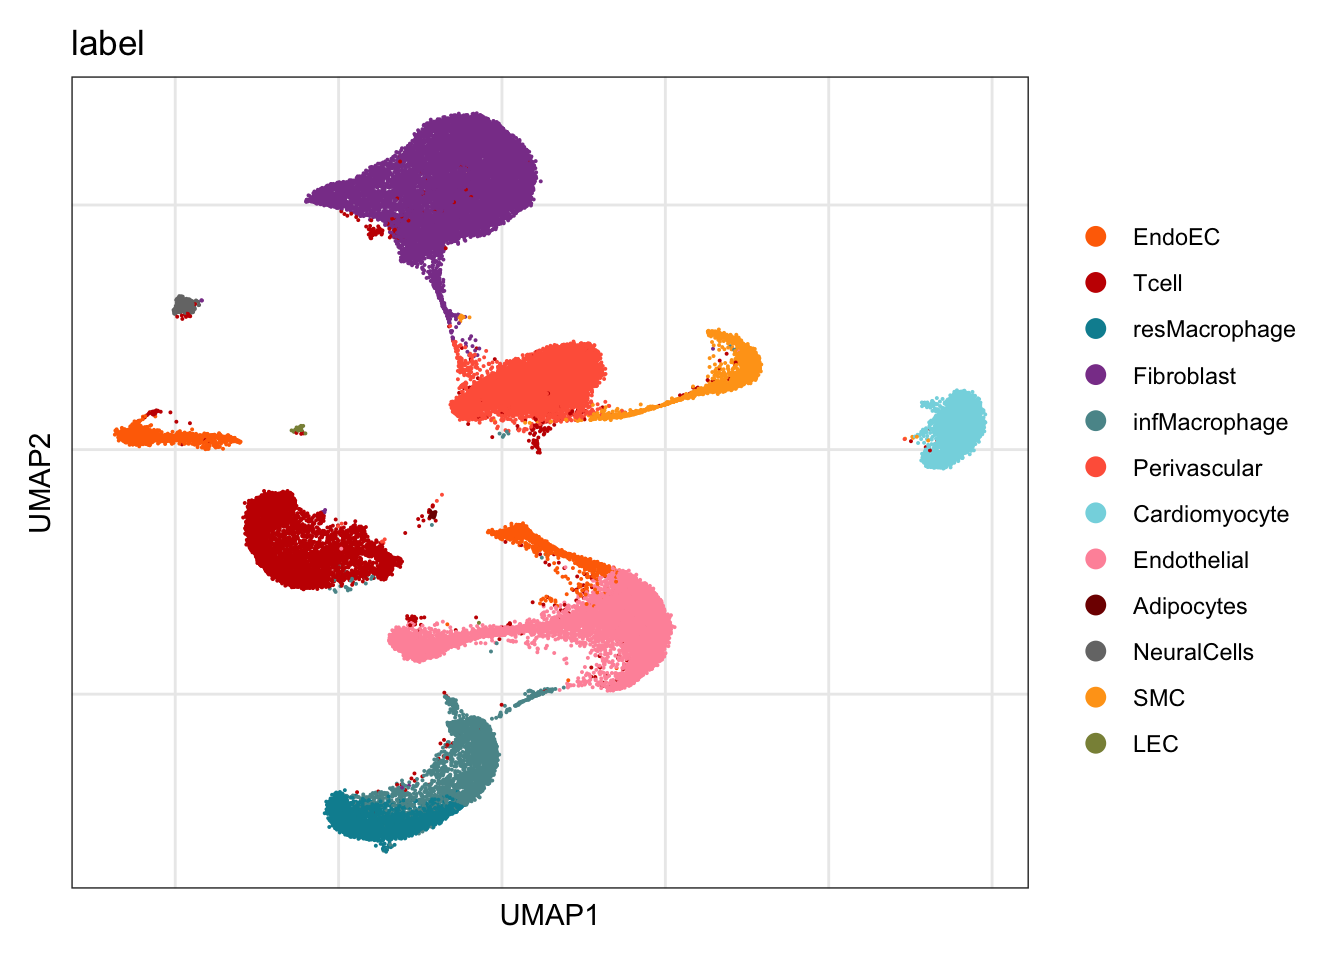
| Version | Author | Date |
|---|---|---|
| e469ce4 | mluetge | 2022-11-29 |
DimPlot(seurat, reduction = "umap", group.by = "label", cols=colLab,
        shuffle = T)+
  theme_void()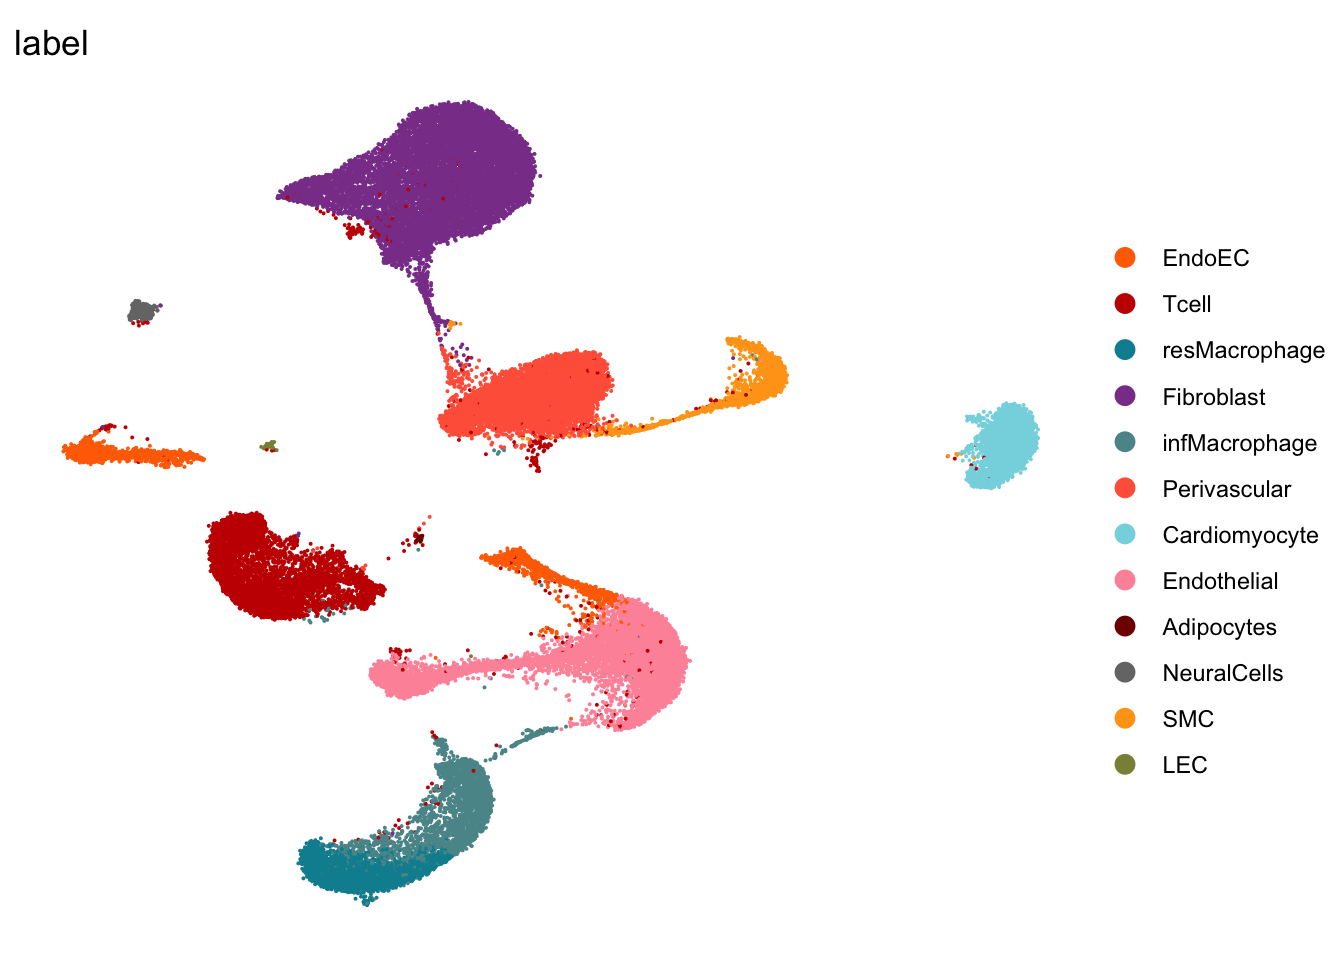
| Version | Author | Date |
|---|---|---|
| e469ce4 | mluetge | 2022-11-29 |
technique
DimPlot(seurat, reduction = "umap", group.by = "technique", cols=colTec)+
  theme_bw() +
  theme(axis.text = element_blank(), axis.ticks = element_blank(),
        panel.grid.minor = element_blank()) +
  xlab("UMAP1") +
  ylab("UMAP2")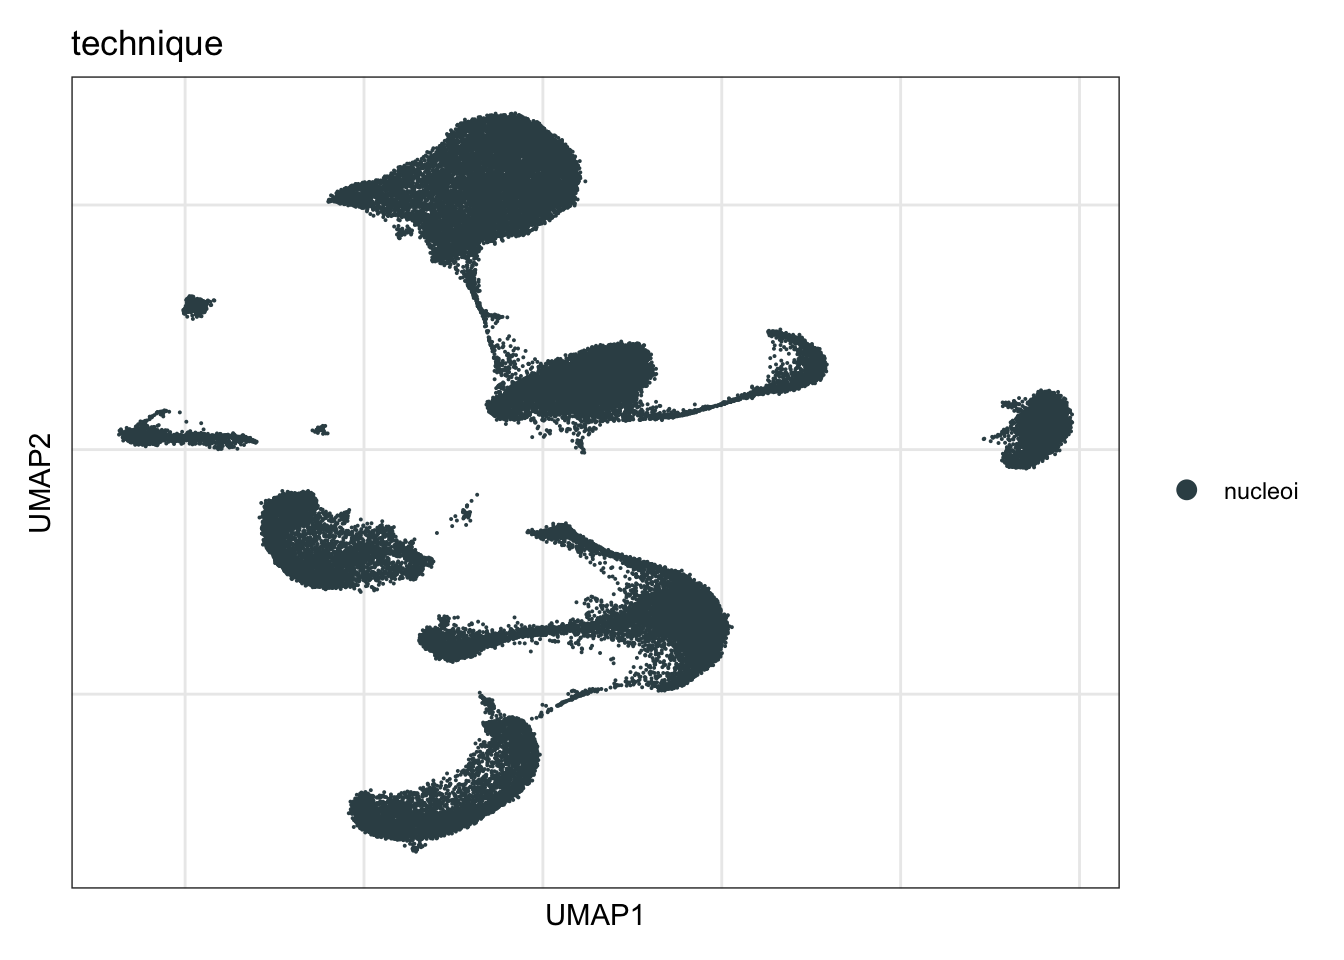
| Version | Author | Date |
|---|---|---|
| e469ce4 | mluetge | 2022-11-29 |
Sample
DimPlot(seurat, reduction = "umap", group.by = "dataset", cols=colSmp)+
  theme_bw() +
  theme(axis.text = element_blank(), axis.ticks = element_blank(),
        panel.grid.minor = element_blank()) +
  xlab("UMAP1") +
  ylab("UMAP2")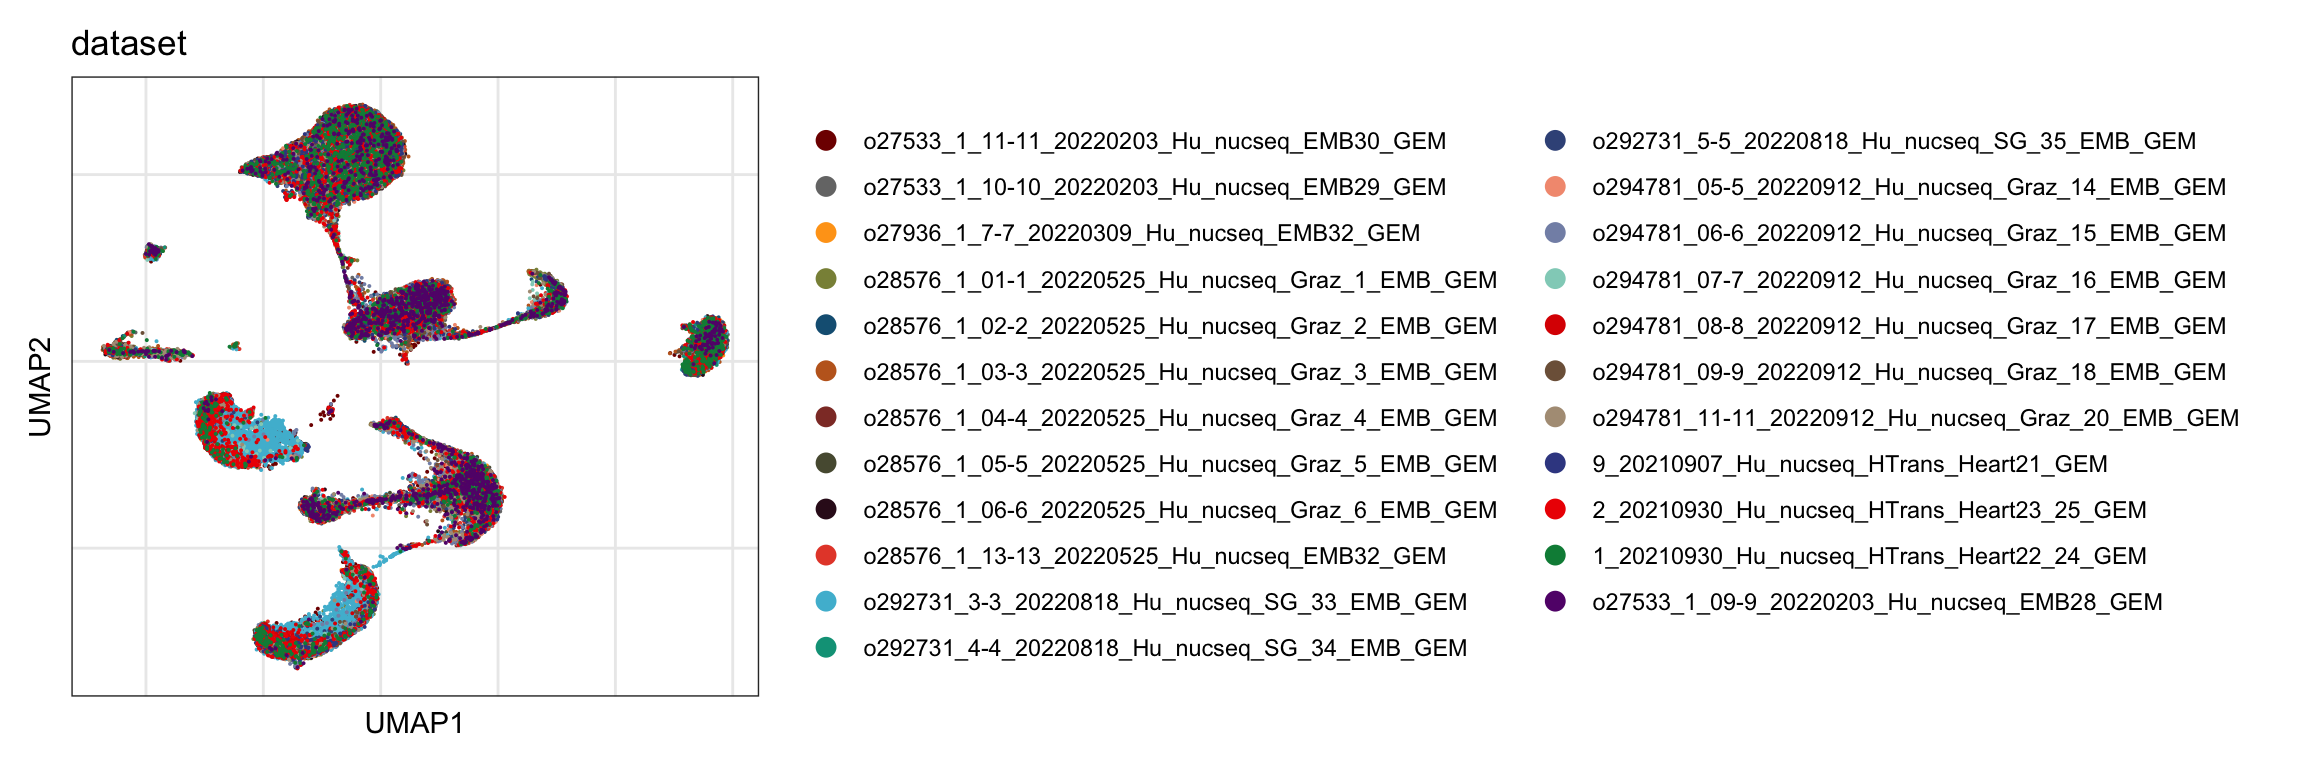
| Version | Author | Date |
|---|---|---|
| e469ce4 | mluetge | 2022-11-29 |
ID
DimPlot(seurat, reduction = "umap", group.by = "ID", cols=colID, shuffle = T)+
  theme_bw() +
  theme(axis.text = element_blank(), axis.ticks = element_blank(),
        panel.grid.minor = element_blank()) +
  xlab("UMAP1") +
  ylab("UMAP2")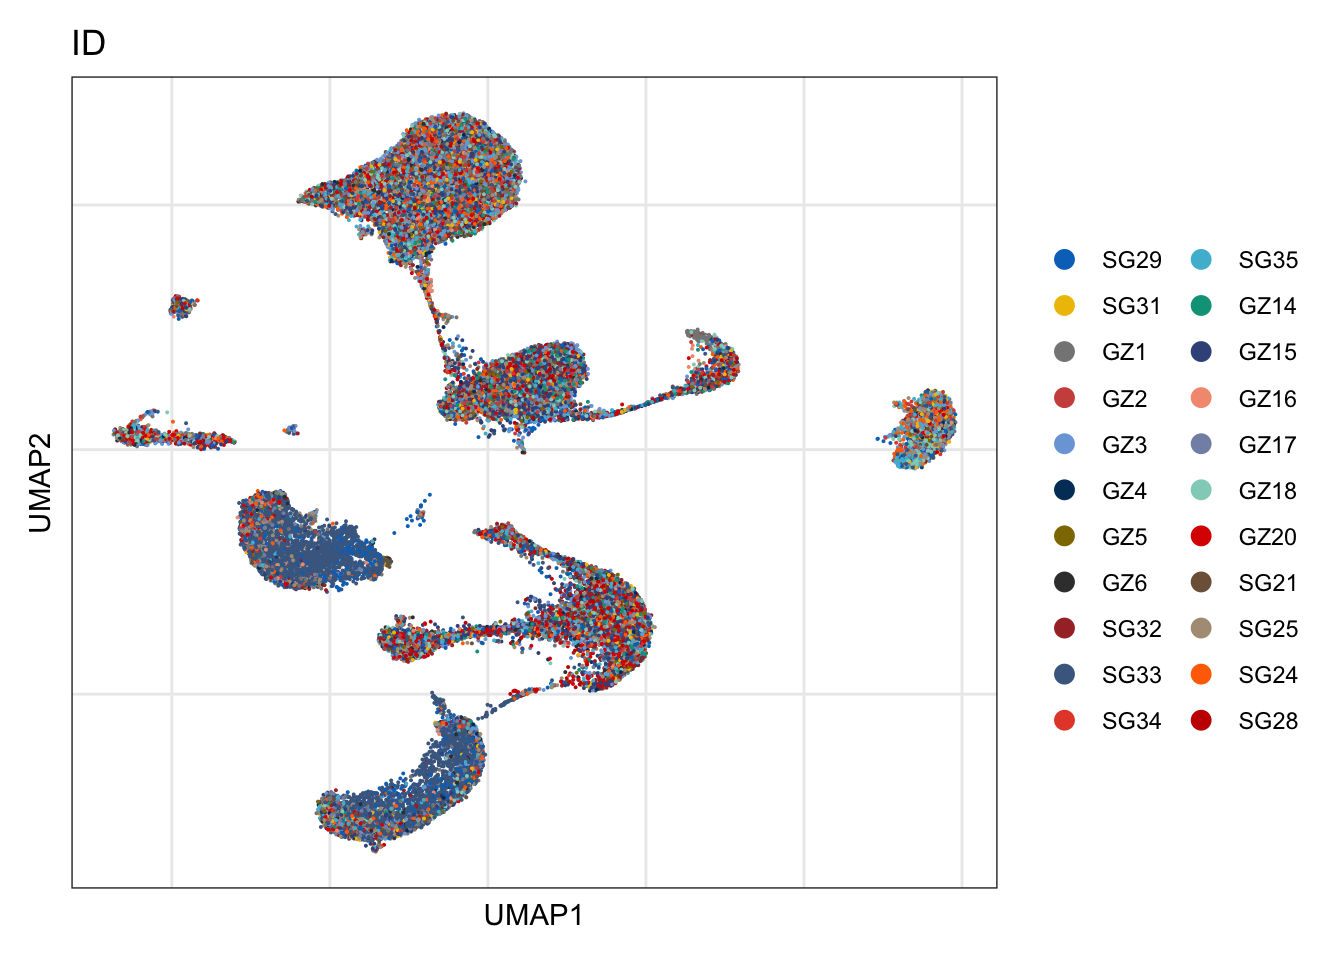
| Version | Author | Date |
|---|---|---|
| e469ce4 | mluetge | 2022-11-29 |
DimPlot(seurat, reduction = "umap", group.by = "ID", cols=colID,
        shuffle = T)+
  theme_void()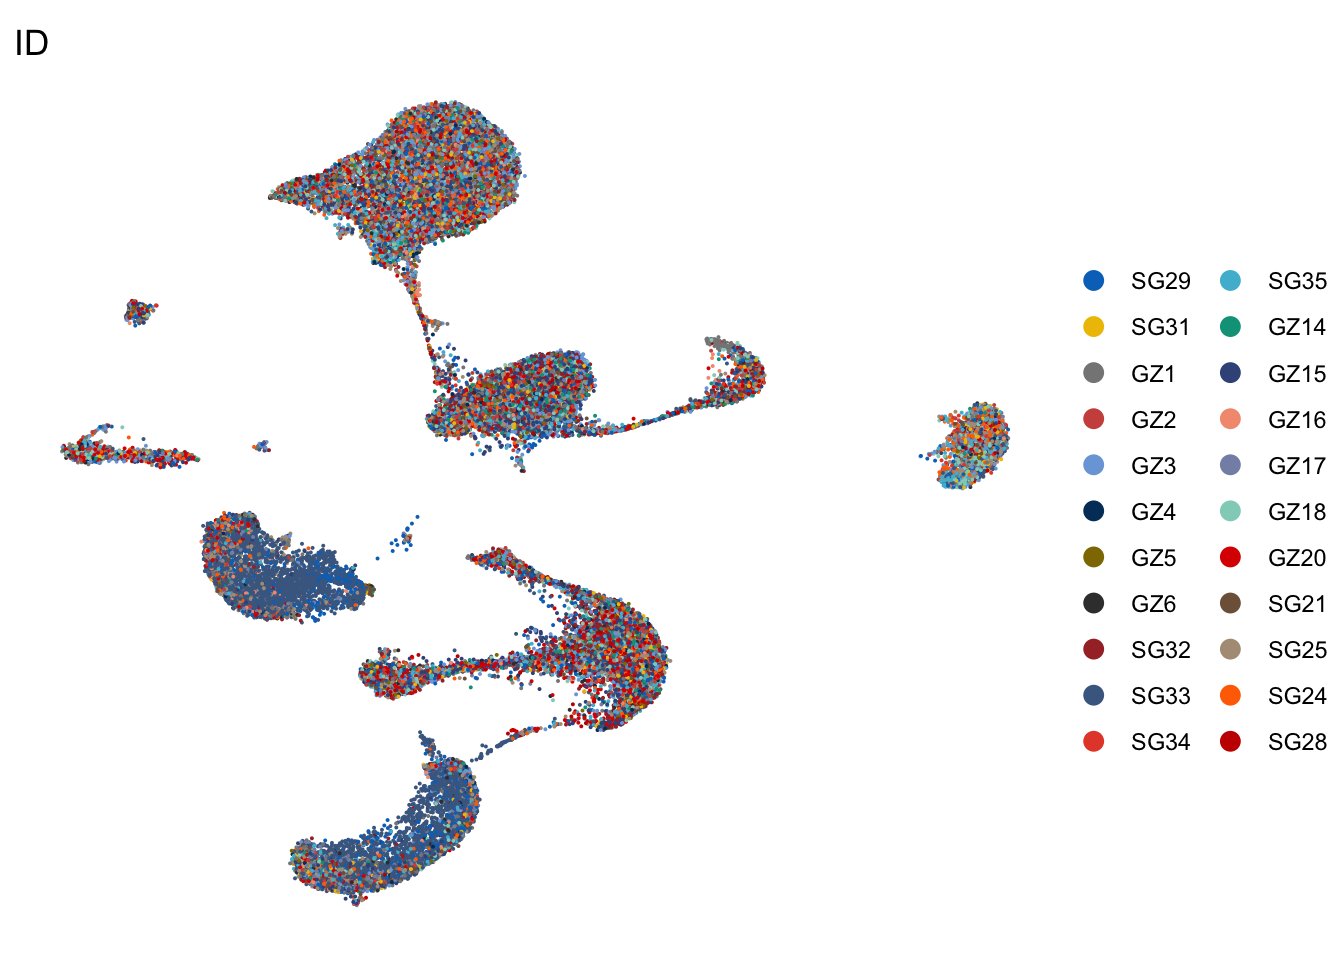
| Version | Author | Date |
|---|---|---|
| e469ce4 | mluetge | 2022-11-29 |
Origin
DimPlot(seurat, reduction = "umap", group.by = "origin", cols=colOrig,
        shuffle = T)+
  theme_bw() +
  theme(axis.text = element_blank(), axis.ticks = element_blank(),
        panel.grid.minor = element_blank()) +
  xlab("UMAP1") +
  ylab("UMAP2")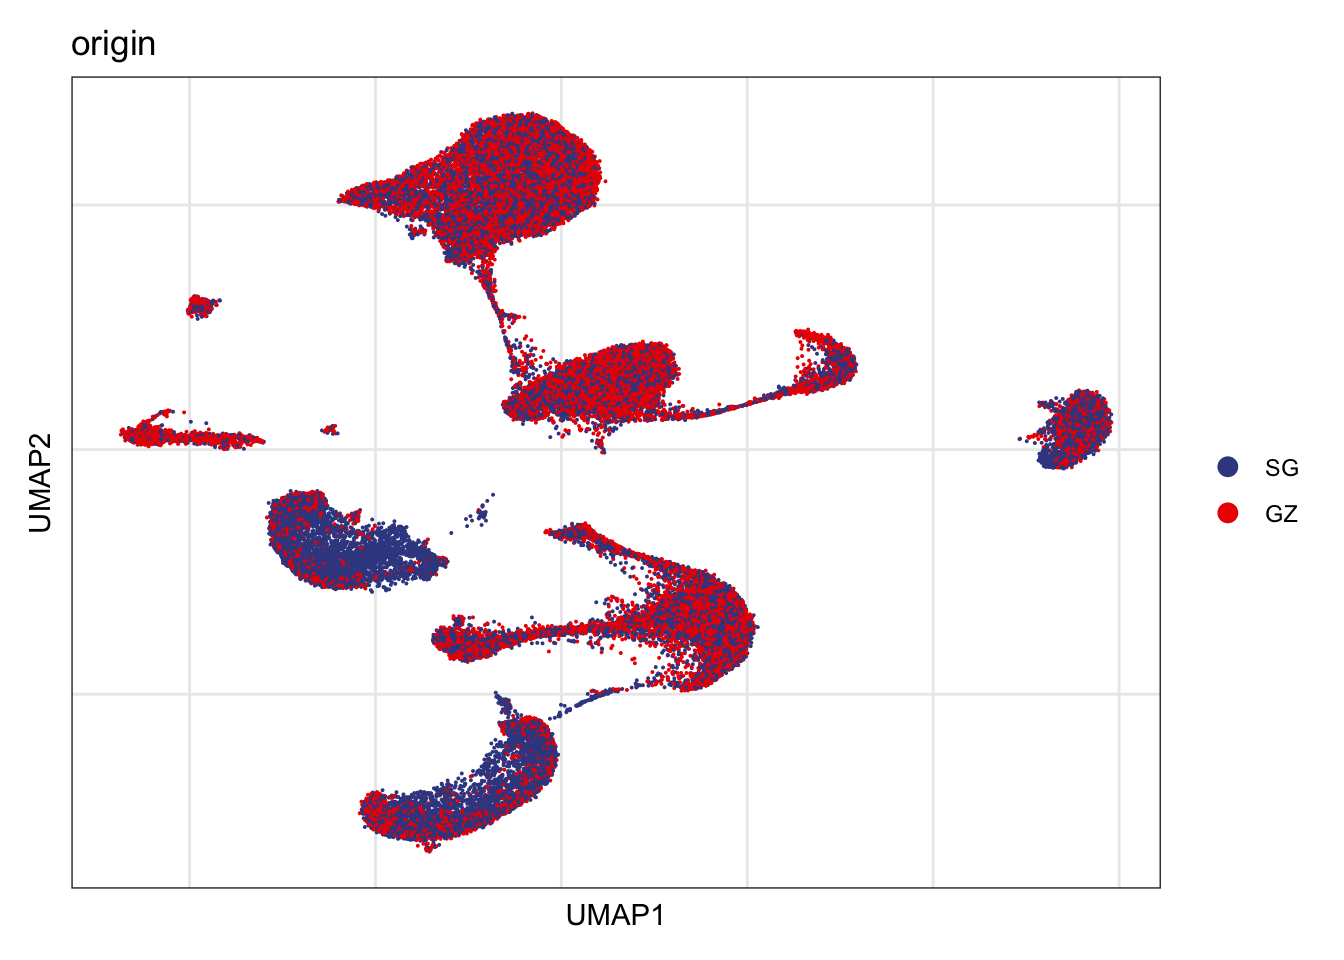
| Version | Author | Date |
|---|---|---|
| e469ce4 | mluetge | 2022-11-29 |
DimPlot(seurat, reduction = "umap", group.by = "origin", cols=colOrig,
        shuffle = T)+
  theme_void()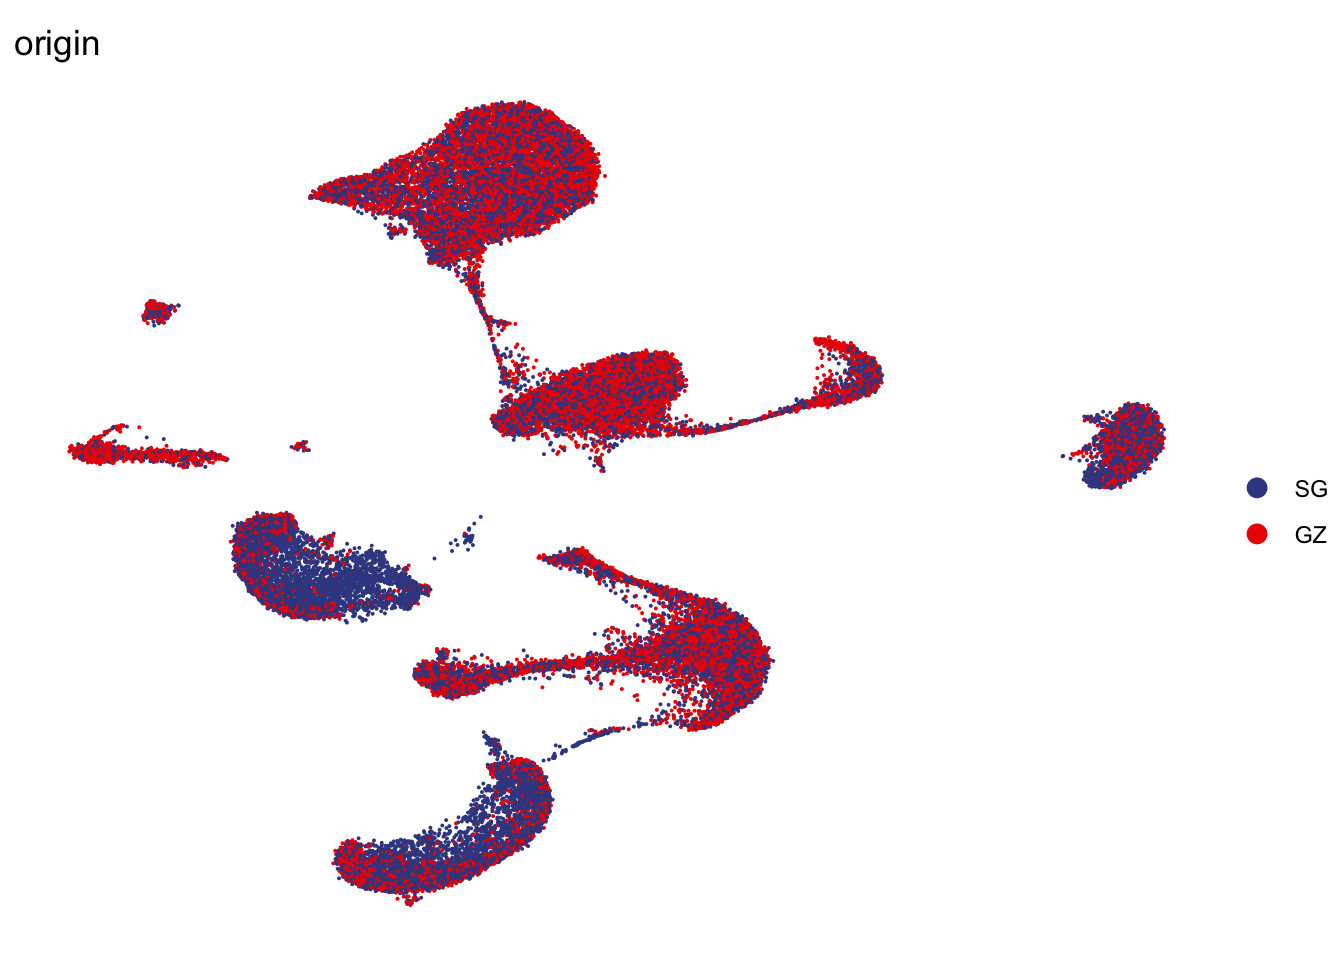
| Version | Author | Date |
|---|---|---|
| e469ce4 | mluetge | 2022-11-29 |
isolation
DimPlot(seurat, reduction = "umap", group.by = "isolation", cols=colIso)+
  theme_bw() +
  theme(axis.text = element_blank(), axis.ticks = element_blank(),
        panel.grid.minor = element_blank()) +
  xlab("UMAP1") +
  ylab("UMAP2")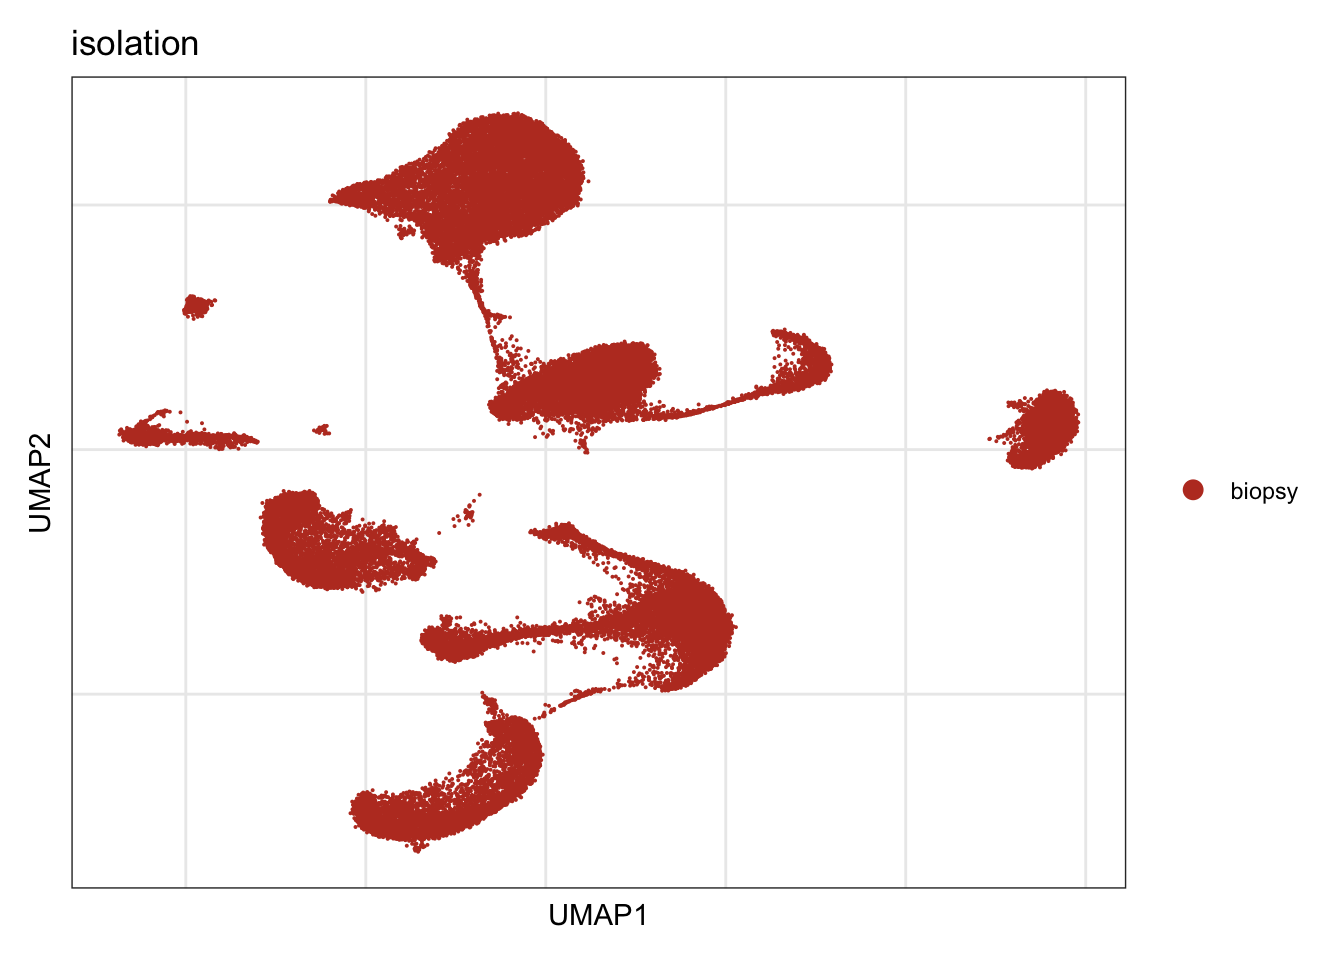
| Version | Author | Date |
|---|---|---|
| e469ce4 | mluetge | 2022-11-29 |
cond
DimPlot(seurat, reduction = "umap", group.by = "cond", cols=colCond)+
  theme_bw() +
  theme(axis.text = element_blank(), axis.ticks = element_blank(),
        panel.grid.minor = element_blank()) +
  xlab("UMAP1") +
  ylab("UMAP2")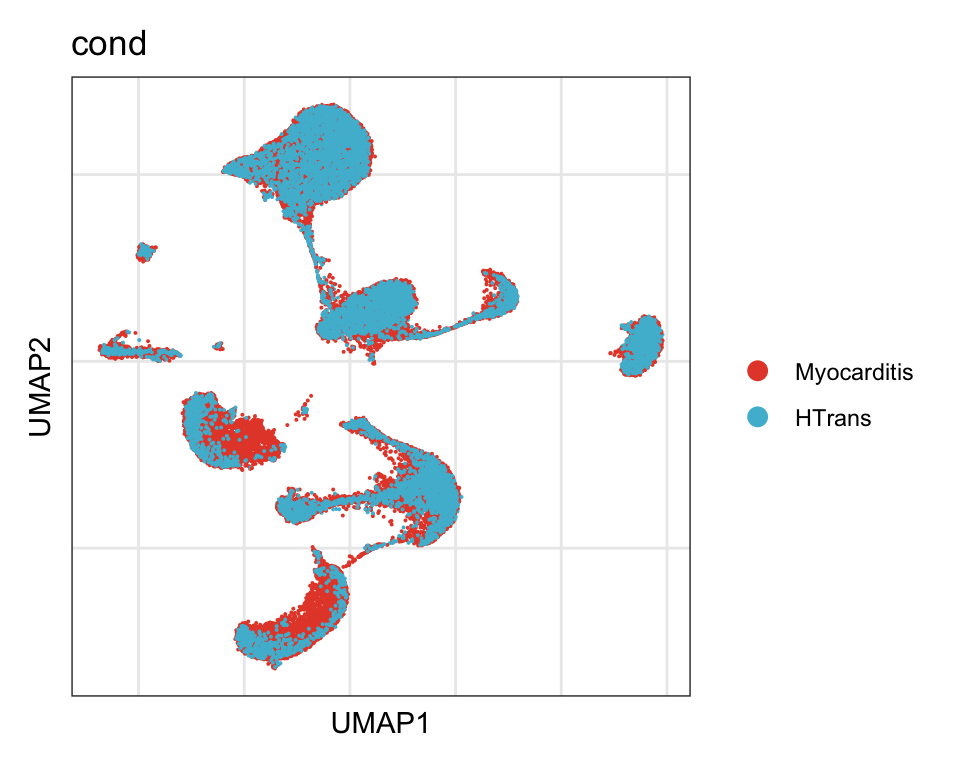
| Version | Author | Date |
|---|---|---|
| e469ce4 | mluetge | 2022-11-29 |
processing
DimPlot(seurat, reduction = "umap", group.by = "processing", cols=colProc)+
  theme_bw() +
  theme(axis.text = element_blank(), axis.ticks = element_blank(),
        panel.grid.minor = element_blank()) +
  xlab("UMAP1") +
  ylab("UMAP2")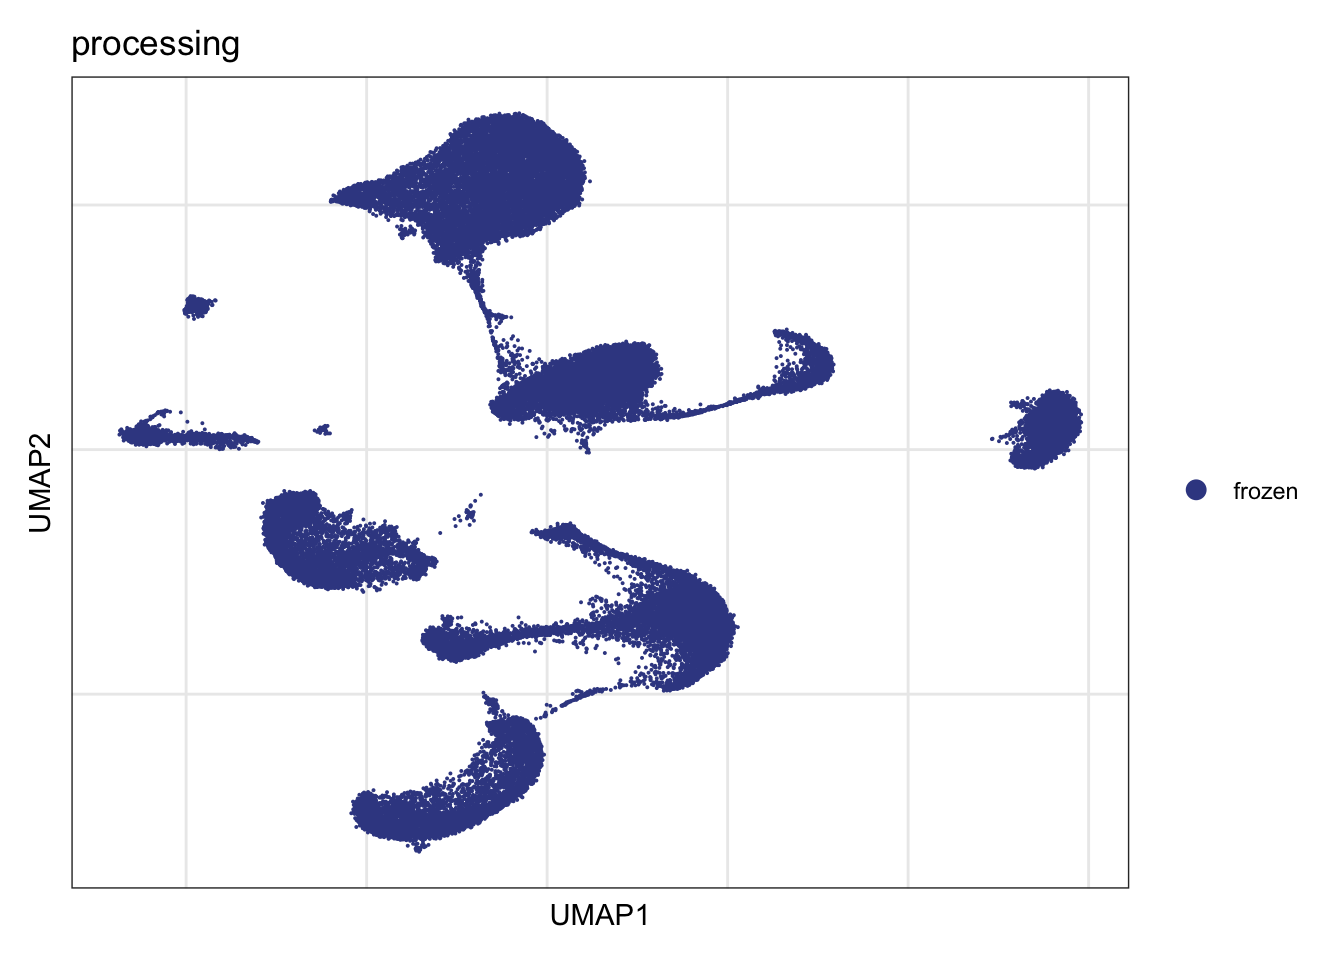
| Version | Author | Date |
|---|---|---|
| e469ce4 | mluetge | 2022-11-29 |
cnt tables
per patient
## total cells per patient
knitr::kable(table(seurat$ID))| Var1 | Freq |
|---|---|
| GZ1 | 2740 |
| GZ14 | 1268 |
| GZ15 | 4439 |
| GZ16 | 436 |
| GZ17 | 1370 |
| GZ18 | 2280 |
| GZ2 | 1684 |
| GZ20 | 2706 |
| GZ3 | 2396 |
| GZ4 | 545 |
| GZ5 | 781 |
| GZ6 | 491 |
| SG21 | 1536 |
| SG24 | 2381 |
| SG25 | 3131 |
| SG28 | 1545 |
| SG29 | 2496 |
| SG31 | 1192 |
| SG32 | 1428 |
| SG33 | 6286 |
| SG34 | 620 |
| SG35 | 2363 |
## celltype per patient counts
knitr::kable(table(seurat$label, seurat$ID))| GZ1 | GZ14 | GZ15 | GZ16 | GZ17 | GZ18 | GZ2 | GZ20 | GZ3 | GZ4 | GZ5 | GZ6 | SG21 | SG24 | SG25 | SG28 | SG29 | SG31 | SG32 | SG33 | SG34 | SG35 | |
|---|---|---|---|---|---|---|---|---|---|---|---|---|---|---|---|---|---|---|---|---|---|---|
| Adipocytes | 0 | 0 | 0 | 0 | 0 | 0 | 1 | 0 | 2 | 1 | 0 | 0 | 1 | 3 | 49 | 3 | 6 | 0 | 5 | 8 | 0 | 0 |
| Cardiomyocyte | 207 | 50 | 116 | 25 | 71 | 329 | 106 | 46 | 238 | 44 | 39 | 12 | 96 | 298 | 396 | 73 | 178 | 178 | 40 | 212 | 174 | 304 |
| EndoEC | 184 | 43 | 172 | 23 | 32 | 211 | 139 | 349 | 215 | 69 | 42 | 59 | 50 | 108 | 116 | 82 | 124 | 67 | 92 | 96 | 23 | 91 |
| Endothelial | 280 | 279 | 912 | 50 | 161 | 426 | 297 | 890 | 349 | 117 | 203 | 95 | 177 | 377 | 535 | 471 | 440 | 190 | 485 | 160 | 82 | 486 |
| Fibroblast | 814 | 317 | 1123 | 130 | 374 | 627 | 661 | 653 | 847 | 142 | 264 | 155 | 614 | 869 | 844 | 322 | 434 | 357 | 320 | 414 | 117 | 778 |
| infMacrophage | 112 | 23 | 110 | 33 | 101 | 25 | 28 | 46 | 55 | 21 | 12 | 30 | 35 | 51 | 98 | 12 | 297 | 39 | 27 | 1407 | 13 | 74 |
| LEC | 6 | 0 | 0 | 0 | 0 | 6 | 6 | 2 | 30 | 0 | 0 | 0 | 1 | 9 | 0 | 1 | 15 | 0 | 4 | 0 | 0 | 0 |
| NeuralCells | 58 | 10 | 76 | 7 | 28 | 28 | 28 | 20 | 31 | 7 | 26 | 2 | 7 | 28 | 26 | 26 | 24 | 22 | 26 | 24 | 5 | 27 |
| Perivascular | 487 | 354 | 1348 | 20 | 147 | 387 | 270 | 352 | 407 | 62 | 122 | 53 | 318 | 286 | 460 | 432 | 310 | 183 | 241 | 135 | 121 | 328 |
| resMacrophage | 188 | 70 | 208 | 20 | 232 | 69 | 56 | 95 | 63 | 33 | 19 | 33 | 120 | 119 | 147 | 8 | 151 | 88 | 43 | 722 | 38 | 125 |
| SMC | 186 | 85 | 188 | 18 | 40 | 129 | 48 | 119 | 82 | 22 | 36 | 15 | 72 | 117 | 99 | 94 | 98 | 45 | 67 | 28 | 22 | 65 |
| Tcell | 218 | 37 | 186 | 110 | 184 | 43 | 44 | 134 | 77 | 27 | 18 | 37 | 45 | 116 | 361 | 21 | 419 | 23 | 78 | 3080 | 25 | 85 |
## celltype percentages per patient
datLab <- data.frame(table(seurat$label, seurat$ID))
colnames(datLab) <- c("label", "ID", "cnt")
datPat <- data.frame(table(seurat$ID))
colnames(datPat) <- c("ID", "total")
datFrac <- datLab %>% left_join(., datPat, by="ID") %>%
  mutate(percentage = cnt*100/total)
knitr::kable(datFrac)| label | ID | cnt | total | percentage |
|---|---|---|---|---|
| Adipocytes | GZ1 | 0 | 2740 | 0.0000000 |
| Cardiomyocyte | GZ1 | 207 | 2740 | 7.5547445 |
| EndoEC | GZ1 | 184 | 2740 | 6.7153285 |
| Endothelial | GZ1 | 280 | 2740 | 10.2189781 |
| Fibroblast | GZ1 | 814 | 2740 | 29.7080292 |
| infMacrophage | GZ1 | 112 | 2740 | 4.0875912 |
| LEC | GZ1 | 6 | 2740 | 0.2189781 |
| NeuralCells | GZ1 | 58 | 2740 | 2.1167883 |
| Perivascular | GZ1 | 487 | 2740 | 17.7737226 |
| resMacrophage | GZ1 | 188 | 2740 | 6.8613139 |
| SMC | GZ1 | 186 | 2740 | 6.7883212 |
| Tcell | GZ1 | 218 | 2740 | 7.9562044 |
| Adipocytes | GZ14 | 0 | 1268 | 0.0000000 |
| Cardiomyocyte | GZ14 | 50 | 1268 | 3.9432177 |
| EndoEC | GZ14 | 43 | 1268 | 3.3911672 |
| Endothelial | GZ14 | 279 | 1268 | 22.0031546 |
| Fibroblast | GZ14 | 317 | 1268 | 25.0000000 |
| infMacrophage | GZ14 | 23 | 1268 | 1.8138801 |
| LEC | GZ14 | 0 | 1268 | 0.0000000 |
| NeuralCells | GZ14 | 10 | 1268 | 0.7886435 |
| Perivascular | GZ14 | 354 | 1268 | 27.9179811 |
| resMacrophage | GZ14 | 70 | 1268 | 5.5205047 |
| SMC | GZ14 | 85 | 1268 | 6.7034700 |
| Tcell | GZ14 | 37 | 1268 | 2.9179811 |
| Adipocytes | GZ15 | 0 | 4439 | 0.0000000 |
| Cardiomyocyte | GZ15 | 116 | 4439 | 2.6132012 |
| EndoEC | GZ15 | 172 | 4439 | 3.8747466 |
| Endothelial | GZ15 | 912 | 4439 | 20.5451678 |
| Fibroblast | GZ15 | 1123 | 4439 | 25.2984907 |
| infMacrophage | GZ15 | 110 | 4439 | 2.4780356 |
| LEC | GZ15 | 0 | 4439 | 0.0000000 |
| NeuralCells | GZ15 | 76 | 4439 | 1.7120973 |
| Perivascular | GZ15 | 1348 | 4439 | 30.3671998 |
| resMacrophage | GZ15 | 208 | 4439 | 4.6857400 |
| SMC | GZ15 | 188 | 4439 | 4.2351881 |
| Tcell | GZ15 | 186 | 4439 | 4.1901329 |
| Adipocytes | GZ16 | 0 | 436 | 0.0000000 |
| Cardiomyocyte | GZ16 | 25 | 436 | 5.7339450 |
| EndoEC | GZ16 | 23 | 436 | 5.2752294 |
| Endothelial | GZ16 | 50 | 436 | 11.4678899 |
| Fibroblast | GZ16 | 130 | 436 | 29.8165138 |
| infMacrophage | GZ16 | 33 | 436 | 7.5688073 |
| LEC | GZ16 | 0 | 436 | 0.0000000 |
| NeuralCells | GZ16 | 7 | 436 | 1.6055046 |
| Perivascular | GZ16 | 20 | 436 | 4.5871560 |
| resMacrophage | GZ16 | 20 | 436 | 4.5871560 |
| SMC | GZ16 | 18 | 436 | 4.1284404 |
| Tcell | GZ16 | 110 | 436 | 25.2293578 |
| Adipocytes | GZ17 | 0 | 1370 | 0.0000000 |
| Cardiomyocyte | GZ17 | 71 | 1370 | 5.1824818 |
| EndoEC | GZ17 | 32 | 1370 | 2.3357664 |
| Endothelial | GZ17 | 161 | 1370 | 11.7518248 |
| Fibroblast | GZ17 | 374 | 1370 | 27.2992701 |
| infMacrophage | GZ17 | 101 | 1370 | 7.3722628 |
| LEC | GZ17 | 0 | 1370 | 0.0000000 |
| NeuralCells | GZ17 | 28 | 1370 | 2.0437956 |
| Perivascular | GZ17 | 147 | 1370 | 10.7299270 |
| resMacrophage | GZ17 | 232 | 1370 | 16.9343066 |
| SMC | GZ17 | 40 | 1370 | 2.9197080 |
| Tcell | GZ17 | 184 | 1370 | 13.4306569 |
| Adipocytes | GZ18 | 0 | 2280 | 0.0000000 |
| Cardiomyocyte | GZ18 | 329 | 2280 | 14.4298246 |
| EndoEC | GZ18 | 211 | 2280 | 9.2543860 |
| Endothelial | GZ18 | 426 | 2280 | 18.6842105 |
| Fibroblast | GZ18 | 627 | 2280 | 27.5000000 |
| infMacrophage | GZ18 | 25 | 2280 | 1.0964912 |
| LEC | GZ18 | 6 | 2280 | 0.2631579 |
| NeuralCells | GZ18 | 28 | 2280 | 1.2280702 |
| Perivascular | GZ18 | 387 | 2280 | 16.9736842 |
| resMacrophage | GZ18 | 69 | 2280 | 3.0263158 |
| SMC | GZ18 | 129 | 2280 | 5.6578947 |
| Tcell | GZ18 | 43 | 2280 | 1.8859649 |
| Adipocytes | GZ2 | 1 | 1684 | 0.0593824 |
| Cardiomyocyte | GZ2 | 106 | 1684 | 6.2945368 |
| EndoEC | GZ2 | 139 | 1684 | 8.2541568 |
| Endothelial | GZ2 | 297 | 1684 | 17.6365796 |
| Fibroblast | GZ2 | 661 | 1684 | 39.2517815 |
| infMacrophage | GZ2 | 28 | 1684 | 1.6627078 |
| LEC | GZ2 | 6 | 1684 | 0.3562945 |
| NeuralCells | GZ2 | 28 | 1684 | 1.6627078 |
| Perivascular | GZ2 | 270 | 1684 | 16.0332542 |
| resMacrophage | GZ2 | 56 | 1684 | 3.3254157 |
| SMC | GZ2 | 48 | 1684 | 2.8503563 |
| Tcell | GZ2 | 44 | 1684 | 2.6128266 |
| Adipocytes | GZ20 | 0 | 2706 | 0.0000000 |
| Cardiomyocyte | GZ20 | 46 | 2706 | 1.6999261 |
| EndoEC | GZ20 | 349 | 2706 | 12.8972653 |
| Endothelial | GZ20 | 890 | 2706 | 32.8898744 |
| Fibroblast | GZ20 | 653 | 2706 | 24.1315595 |
| infMacrophage | GZ20 | 46 | 2706 | 1.6999261 |
| LEC | GZ20 | 2 | 2706 | 0.0739098 |
| NeuralCells | GZ20 | 20 | 2706 | 0.7390983 |
| Perivascular | GZ20 | 352 | 2706 | 13.0081301 |
| resMacrophage | GZ20 | 95 | 2706 | 3.5107169 |
| SMC | GZ20 | 119 | 2706 | 4.3976349 |
| Tcell | GZ20 | 134 | 2706 | 4.9519586 |
| Adipocytes | GZ3 | 2 | 2396 | 0.0834725 |
| Cardiomyocyte | GZ3 | 238 | 2396 | 9.9332220 |
| EndoEC | GZ3 | 215 | 2396 | 8.9732888 |
| Endothelial | GZ3 | 349 | 2396 | 14.5659432 |
| Fibroblast | GZ3 | 847 | 2396 | 35.3505843 |
| infMacrophage | GZ3 | 55 | 2396 | 2.2954925 |
| LEC | GZ3 | 30 | 2396 | 1.2520868 |
| NeuralCells | GZ3 | 31 | 2396 | 1.2938230 |
| Perivascular | GZ3 | 407 | 2396 | 16.9866444 |
| resMacrophage | GZ3 | 63 | 2396 | 2.6293823 |
| SMC | GZ3 | 82 | 2396 | 3.4223706 |
| Tcell | GZ3 | 77 | 2396 | 3.2136895 |
| Adipocytes | GZ4 | 1 | 545 | 0.1834862 |
| Cardiomyocyte | GZ4 | 44 | 545 | 8.0733945 |
| EndoEC | GZ4 | 69 | 545 | 12.6605505 |
| Endothelial | GZ4 | 117 | 545 | 21.4678899 |
| Fibroblast | GZ4 | 142 | 545 | 26.0550459 |
| infMacrophage | GZ4 | 21 | 545 | 3.8532110 |
| LEC | GZ4 | 0 | 545 | 0.0000000 |
| NeuralCells | GZ4 | 7 | 545 | 1.2844037 |
| Perivascular | GZ4 | 62 | 545 | 11.3761468 |
| resMacrophage | GZ4 | 33 | 545 | 6.0550459 |
| SMC | GZ4 | 22 | 545 | 4.0366972 |
| Tcell | GZ4 | 27 | 545 | 4.9541284 |
| Adipocytes | GZ5 | 0 | 781 | 0.0000000 |
| Cardiomyocyte | GZ5 | 39 | 781 | 4.9935980 |
| EndoEC | GZ5 | 42 | 781 | 5.3777209 |
| Endothelial | GZ5 | 203 | 781 | 25.9923175 |
| Fibroblast | GZ5 | 264 | 781 | 33.8028169 |
| infMacrophage | GZ5 | 12 | 781 | 1.5364917 |
| LEC | GZ5 | 0 | 781 | 0.0000000 |
| NeuralCells | GZ5 | 26 | 781 | 3.3290653 |
| Perivascular | GZ5 | 122 | 781 | 15.6209987 |
| resMacrophage | GZ5 | 19 | 781 | 2.4327785 |
| SMC | GZ5 | 36 | 781 | 4.6094750 |
| Tcell | GZ5 | 18 | 781 | 2.3047375 |
| Adipocytes | GZ6 | 0 | 491 | 0.0000000 |
| Cardiomyocyte | GZ6 | 12 | 491 | 2.4439919 |
| EndoEC | GZ6 | 59 | 491 | 12.0162933 |
| Endothelial | GZ6 | 95 | 491 | 19.3482688 |
| Fibroblast | GZ6 | 155 | 491 | 31.5682281 |
| infMacrophage | GZ6 | 30 | 491 | 6.1099796 |
| LEC | GZ6 | 0 | 491 | 0.0000000 |
| NeuralCells | GZ6 | 2 | 491 | 0.4073320 |
| Perivascular | GZ6 | 53 | 491 | 10.7942974 |
| resMacrophage | GZ6 | 33 | 491 | 6.7209776 |
| SMC | GZ6 | 15 | 491 | 3.0549898 |
| Tcell | GZ6 | 37 | 491 | 7.5356415 |
| Adipocytes | SG21 | 1 | 1536 | 0.0651042 |
| Cardiomyocyte | SG21 | 96 | 1536 | 6.2500000 |
| EndoEC | SG21 | 50 | 1536 | 3.2552083 |
| Endothelial | SG21 | 177 | 1536 | 11.5234375 |
| Fibroblast | SG21 | 614 | 1536 | 39.9739583 |
| infMacrophage | SG21 | 35 | 1536 | 2.2786458 |
| LEC | SG21 | 1 | 1536 | 0.0651042 |
| NeuralCells | SG21 | 7 | 1536 | 0.4557292 |
| Perivascular | SG21 | 318 | 1536 | 20.7031250 |
| resMacrophage | SG21 | 120 | 1536 | 7.8125000 |
| SMC | SG21 | 72 | 1536 | 4.6875000 |
| Tcell | SG21 | 45 | 1536 | 2.9296875 |
| Adipocytes | SG24 | 3 | 2381 | 0.1259975 |
| Cardiomyocyte | SG24 | 298 | 2381 | 12.5157497 |
| EndoEC | SG24 | 108 | 2381 | 4.5359093 |
| Endothelial | SG24 | 377 | 2381 | 15.8336833 |
| Fibroblast | SG24 | 869 | 2381 | 36.4972701 |
| infMacrophage | SG24 | 51 | 2381 | 2.1419572 |
| LEC | SG24 | 9 | 2381 | 0.3779924 |
| NeuralCells | SG24 | 28 | 2381 | 1.1759765 |
| Perivascular | SG24 | 286 | 2381 | 12.0117598 |
| resMacrophage | SG24 | 119 | 2381 | 4.9979000 |
| SMC | SG24 | 117 | 2381 | 4.9139017 |
| Tcell | SG24 | 116 | 2381 | 4.8719026 |
| Adipocytes | SG25 | 49 | 3131 | 1.5649952 |
| Cardiomyocyte | SG25 | 396 | 3131 | 12.6477164 |
| EndoEC | SG25 | 116 | 3131 | 3.7048866 |
| Endothelial | SG25 | 535 | 3131 | 17.0871926 |
| Fibroblast | SG25 | 844 | 3131 | 26.9562440 |
| infMacrophage | SG25 | 98 | 3131 | 3.1299904 |
| LEC | SG25 | 0 | 3131 | 0.0000000 |
| NeuralCells | SG25 | 26 | 3131 | 0.8304056 |
| Perivascular | SG25 | 460 | 3131 | 14.6917918 |
| resMacrophage | SG25 | 147 | 3131 | 4.6949856 |
| SMC | SG25 | 99 | 3131 | 3.1619291 |
| Tcell | SG25 | 361 | 3131 | 11.5298627 |
| Adipocytes | SG28 | 3 | 1545 | 0.1941748 |
| Cardiomyocyte | SG28 | 73 | 1545 | 4.7249191 |
| EndoEC | SG28 | 82 | 1545 | 5.3074434 |
| Endothelial | SG28 | 471 | 1545 | 30.4854369 |
| Fibroblast | SG28 | 322 | 1545 | 20.8414239 |
| infMacrophage | SG28 | 12 | 1545 | 0.7766990 |
| LEC | SG28 | 1 | 1545 | 0.0647249 |
| NeuralCells | SG28 | 26 | 1545 | 1.6828479 |
| Perivascular | SG28 | 432 | 1545 | 27.9611650 |
| resMacrophage | SG28 | 8 | 1545 | 0.5177994 |
| SMC | SG28 | 94 | 1545 | 6.0841424 |
| Tcell | SG28 | 21 | 1545 | 1.3592233 |
| Adipocytes | SG29 | 6 | 2496 | 0.2403846 |
| Cardiomyocyte | SG29 | 178 | 2496 | 7.1314103 |
| EndoEC | SG29 | 124 | 2496 | 4.9679487 |
| Endothelial | SG29 | 440 | 2496 | 17.6282051 |
| Fibroblast | SG29 | 434 | 2496 | 17.3878205 |
| infMacrophage | SG29 | 297 | 2496 | 11.8990385 |
| LEC | SG29 | 15 | 2496 | 0.6009615 |
| NeuralCells | SG29 | 24 | 2496 | 0.9615385 |
| Perivascular | SG29 | 310 | 2496 | 12.4198718 |
| resMacrophage | SG29 | 151 | 2496 | 6.0496795 |
| SMC | SG29 | 98 | 2496 | 3.9262821 |
| Tcell | SG29 | 419 | 2496 | 16.7868590 |
| Adipocytes | SG31 | 0 | 1192 | 0.0000000 |
| Cardiomyocyte | SG31 | 178 | 1192 | 14.9328859 |
| EndoEC | SG31 | 67 | 1192 | 5.6208054 |
| Endothelial | SG31 | 190 | 1192 | 15.9395973 |
| Fibroblast | SG31 | 357 | 1192 | 29.9496644 |
| infMacrophage | SG31 | 39 | 1192 | 3.2718121 |
| LEC | SG31 | 0 | 1192 | 0.0000000 |
| NeuralCells | SG31 | 22 | 1192 | 1.8456376 |
| Perivascular | SG31 | 183 | 1192 | 15.3523490 |
| resMacrophage | SG31 | 88 | 1192 | 7.3825503 |
| SMC | SG31 | 45 | 1192 | 3.7751678 |
| Tcell | SG31 | 23 | 1192 | 1.9295302 |
| Adipocytes | SG32 | 5 | 1428 | 0.3501401 |
| Cardiomyocyte | SG32 | 40 | 1428 | 2.8011204 |
| EndoEC | SG32 | 92 | 1428 | 6.4425770 |
| Endothelial | SG32 | 485 | 1428 | 33.9635854 |
| Fibroblast | SG32 | 320 | 1428 | 22.4089636 |
| infMacrophage | SG32 | 27 | 1428 | 1.8907563 |
| LEC | SG32 | 4 | 1428 | 0.2801120 |
| NeuralCells | SG32 | 26 | 1428 | 1.8207283 |
| Perivascular | SG32 | 241 | 1428 | 16.8767507 |
| resMacrophage | SG32 | 43 | 1428 | 3.0112045 |
| SMC | SG32 | 67 | 1428 | 4.6918768 |
| Tcell | SG32 | 78 | 1428 | 5.4621849 |
| Adipocytes | SG33 | 8 | 6286 | 0.1272669 |
| Cardiomyocyte | SG33 | 212 | 6286 | 3.3725740 |
| EndoEC | SG33 | 96 | 6286 | 1.5272033 |
| Endothelial | SG33 | 160 | 6286 | 2.5453388 |
| Fibroblast | SG33 | 414 | 6286 | 6.5860643 |
| infMacrophage | SG33 | 1407 | 6286 | 22.3830735 |
| LEC | SG33 | 0 | 6286 | 0.0000000 |
| NeuralCells | SG33 | 24 | 6286 | 0.3818008 |
| Perivascular | SG33 | 135 | 6286 | 2.1476297 |
| resMacrophage | SG33 | 722 | 6286 | 11.4858416 |
| SMC | SG33 | 28 | 6286 | 0.4454343 |
| Tcell | SG33 | 3080 | 6286 | 48.9977728 |
| Adipocytes | SG34 | 0 | 620 | 0.0000000 |
| Cardiomyocyte | SG34 | 174 | 620 | 28.0645161 |
| EndoEC | SG34 | 23 | 620 | 3.7096774 |
| Endothelial | SG34 | 82 | 620 | 13.2258065 |
| Fibroblast | SG34 | 117 | 620 | 18.8709677 |
| infMacrophage | SG34 | 13 | 620 | 2.0967742 |
| LEC | SG34 | 0 | 620 | 0.0000000 |
| NeuralCells | SG34 | 5 | 620 | 0.8064516 |
| Perivascular | SG34 | 121 | 620 | 19.5161290 |
| resMacrophage | SG34 | 38 | 620 | 6.1290323 |
| SMC | SG34 | 22 | 620 | 3.5483871 |
| Tcell | SG34 | 25 | 620 | 4.0322581 |
| Adipocytes | SG35 | 0 | 2363 | 0.0000000 |
| Cardiomyocyte | SG35 | 304 | 2363 | 12.8650021 |
| EndoEC | SG35 | 91 | 2363 | 3.8510368 |
| Endothelial | SG35 | 486 | 2363 | 20.5670758 |
| Fibroblast | SG35 | 778 | 2363 | 32.9242488 |
| infMacrophage | SG35 | 74 | 2363 | 3.1316124 |
| LEC | SG35 | 0 | 2363 | 0.0000000 |
| NeuralCells | SG35 | 27 | 2363 | 1.1426153 |
| Perivascular | SG35 | 328 | 2363 | 13.8806602 |
| resMacrophage | SG35 | 125 | 2363 | 5.2898857 |
| SMC | SG35 | 65 | 2363 | 2.7507406 |
| Tcell | SG35 | 85 | 2363 | 3.5971223 |
ordVec <- datFrac %>% dplyr::filter(label=="Tcell") %>%
  arrange(., percentage)
ordBar <- c("Tcell","infMacrophage","resMacrophage","Fibroblast","Perivascular",
            "SMC","Endothelial","EndoEC","LEC","Cardiomyocyte","Adipocytes",
            "NeuralCells")
datFrac <-datFrac %>% mutate(labelFac=factor(label, levels = ordBar))
ggbarplot(datFrac, x="ID", y="percentage",
          fill = "labelFac",
          palette = colLab,
          order= ordVec$ID) +
  rotate_x_text(angle = 90)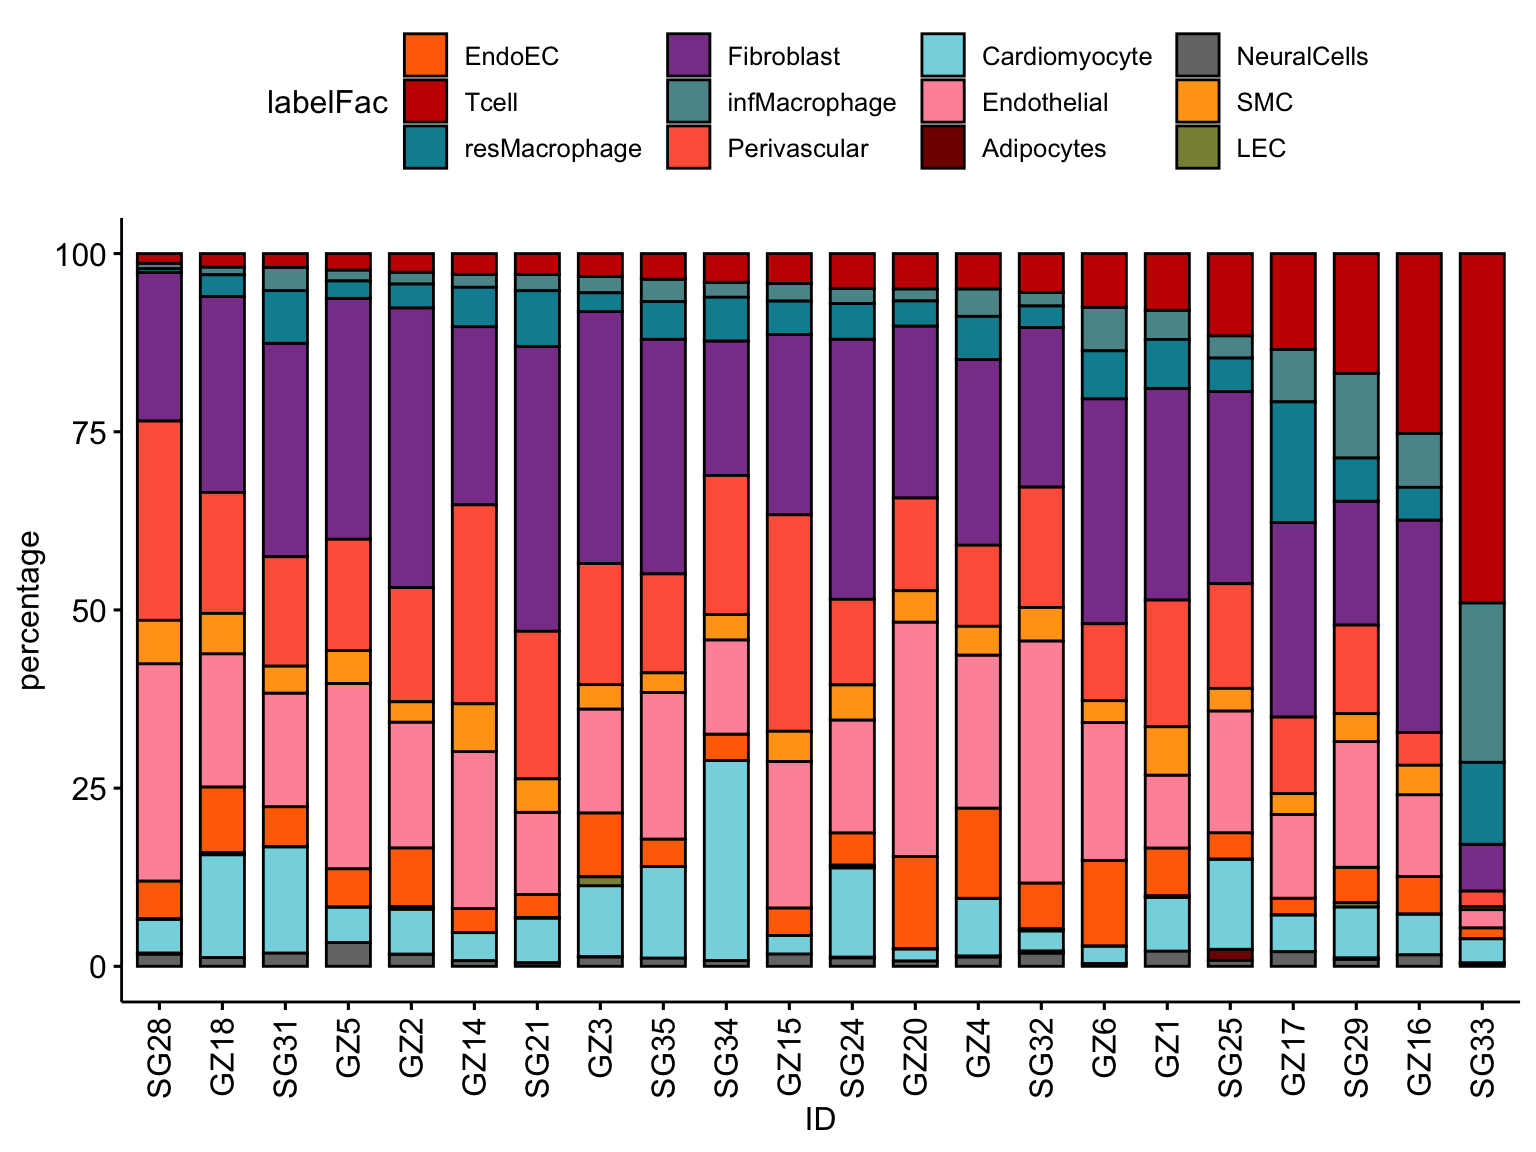
| Version | Author | Date |
|---|---|---|
| e469ce4 | mluetge | 2022-11-29 |
## only Myocarditis patients
selMyo <- unique(seurat$ID[which(seurat$cond != "HH")])
datFracSel <- datFrac %>% filter(ID %in% selMyo)
ggbarplot(datFracSel, x="ID", y="percentage",
          fill = "labelFac",
          palette = colLab,
          order= ordVec$ID) +
  rotate_x_text(angle = 90)
| Version | Author | Date |
|---|---|---|
| e469ce4 | mluetge | 2022-11-29 |
assign groups based on T cell fraction
TcellGrp <- read_tsv(paste0(basedir, "/data/assignTcellGrp.txt"))
IDtoTcell <- data.frame(ID=seurat$ID) %>% left_join(., TcellGrp, by="ID")
seurat$TcellGrp <- IDtoTcell$TcellGrp
table(seurat$TcellGrp)
TcellHigh  TcellInt  TcellLow
    16950     14482     12682
table(seurat$TcellGrp, seurat$ID)
             GZ1 GZ14 GZ15 GZ16 GZ17 GZ18  GZ2 GZ20  GZ3  GZ4  GZ5  GZ6 SG21
  TcellHigh 2740    0    0  436 1370    0    0    0    0    0    0  491    0
  TcellInt     0    0 4439    0    0    0    0 2706    0  545    0    0    0
  TcellLow     0 1268    0    0    0 2280 1684    0 2396    0  781    0 1536

            SG24 SG25 SG28 SG29 SG31 SG32 SG33 SG34 SG35
  TcellHigh    0 3131    0 2496    0    0 6286    0    0
  TcellInt  2381    0    0    0    0 1428    0  620 2363
  TcellLow     0    0 1545    0 1192    0    0    0    0
vis marker for celltype assignment
heatmap
genes <- data.frame(gene=rownames(seurat)) %>%
    mutate(geneID=gsub("^.*\\.", "", gene))

selGenesAll <- read_tsv(file = paste0(basedir,
                                      "/data/markerLabels.txt")) %>%
  left_join(., genes, by = "geneID")

Idents(seurat) <- seurat$seurat_clusters
pOut <- avgHeatmap(seurat = seurat, selGenes = selGenesAll,
                  colVecIdent = colPal,
                  ordVec=levels(seurat),
                  gapVecR=NULL, gapVecC=NULL,cc=T,
                  cr=F, condCol=F)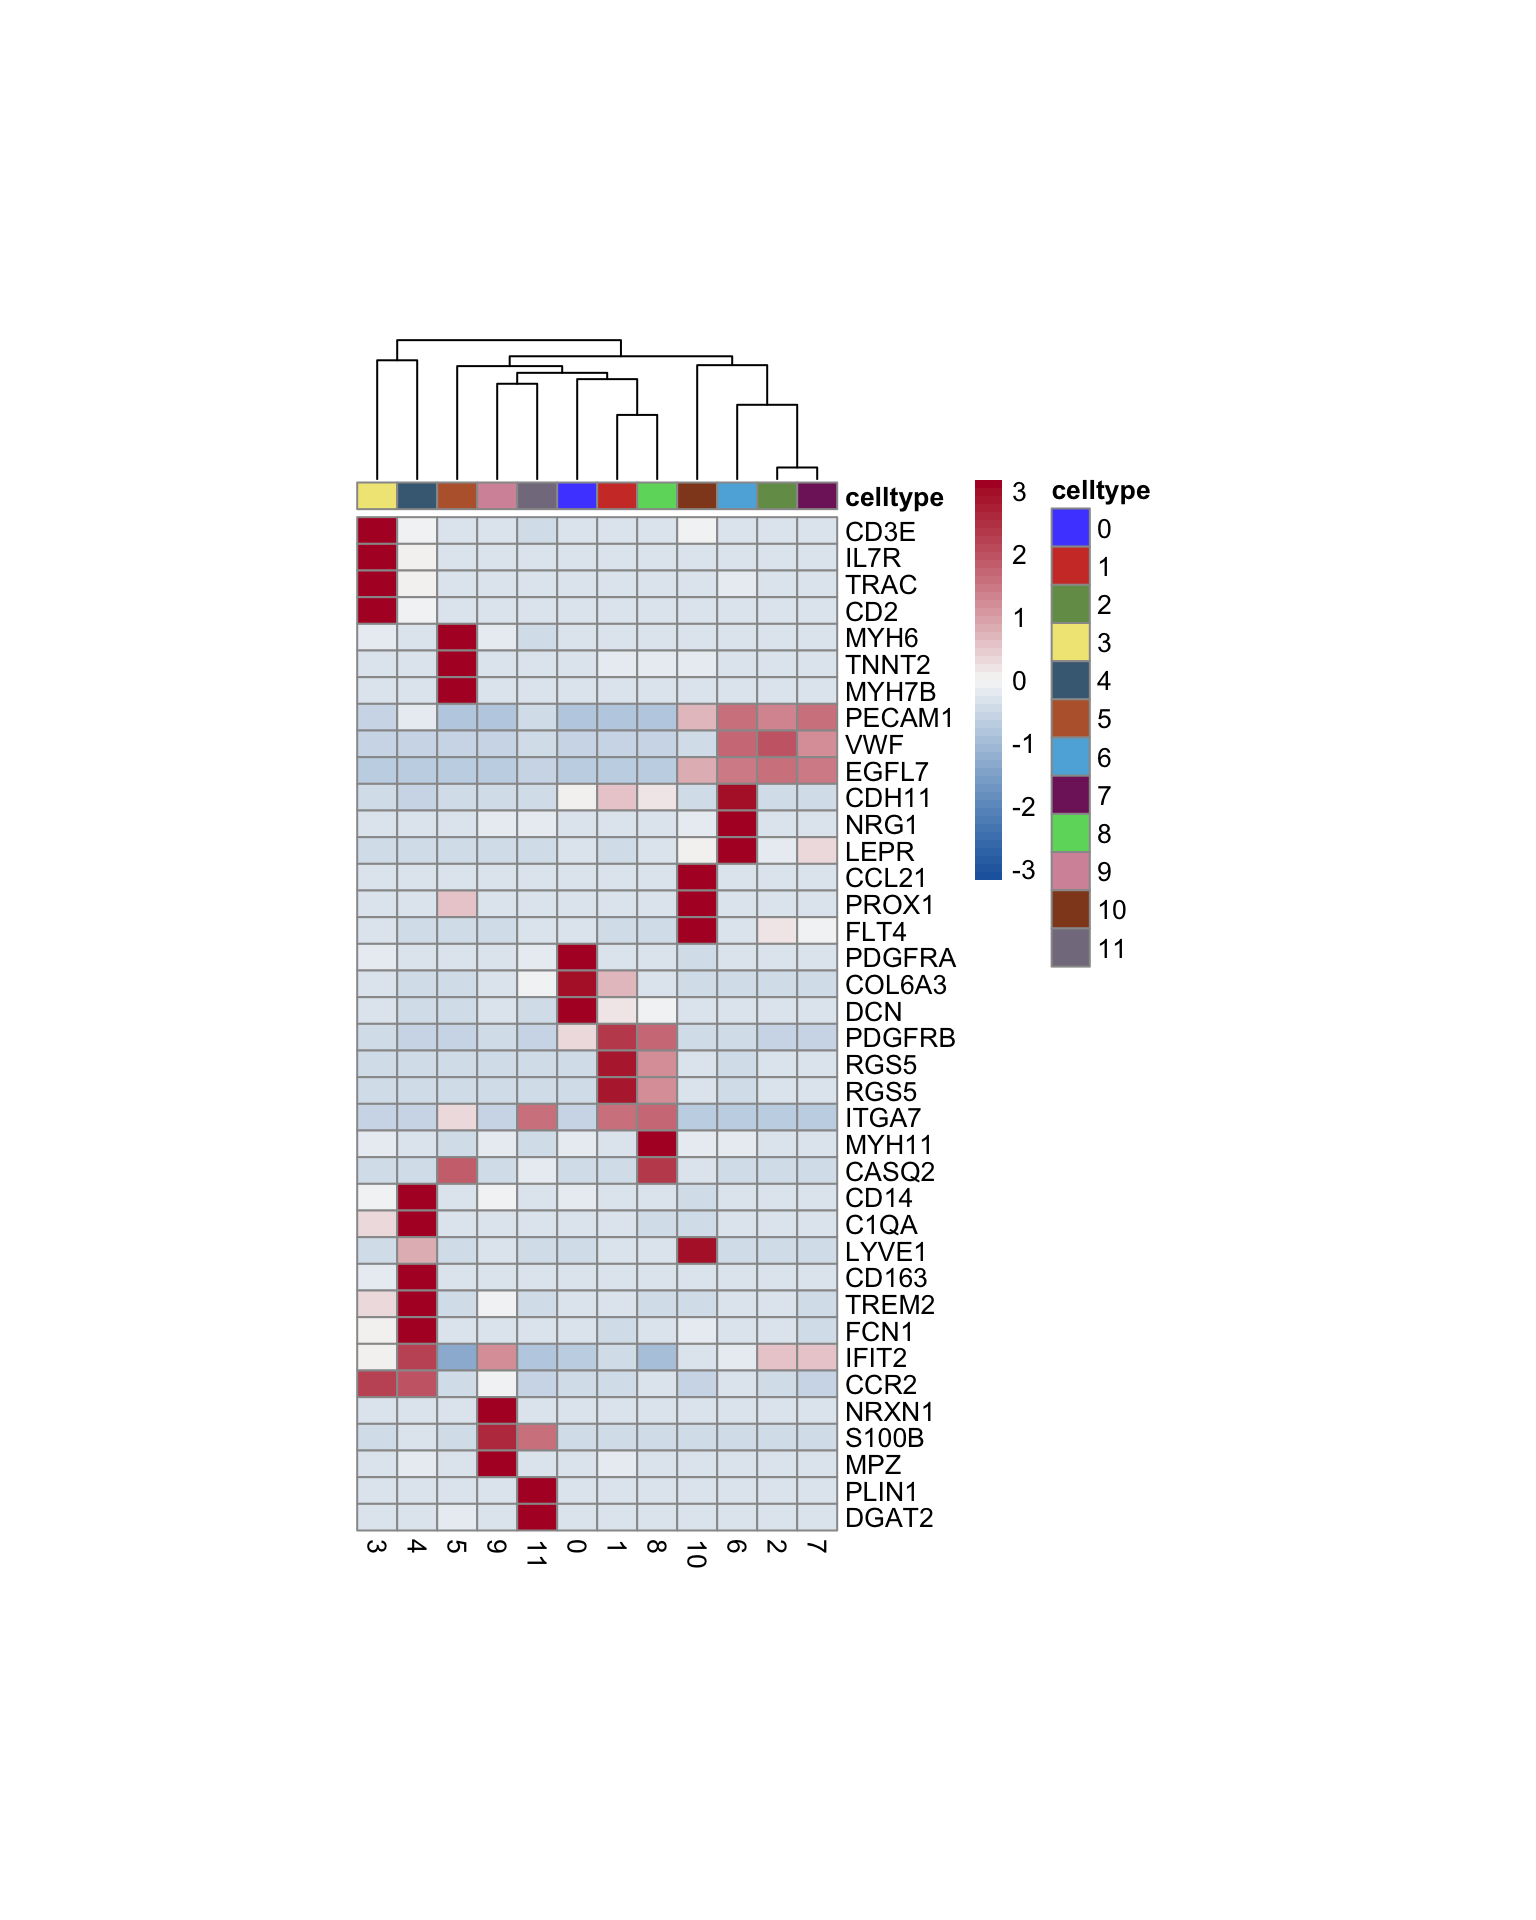
| Version | Author | Date |
|---|---|---|
| e469ce4 | mluetge | 2022-11-29 |
Idents(seurat) <- seurat$label
pOut <- avgHeatmap(seurat = seurat, selGenes = selGenesAll,
                  colVecIdent = colLab,
                  ordVec=levels(seurat),
                  gapVecR=NULL, gapVecC=NULL,cc=T,
                  cr=F, condCol=F)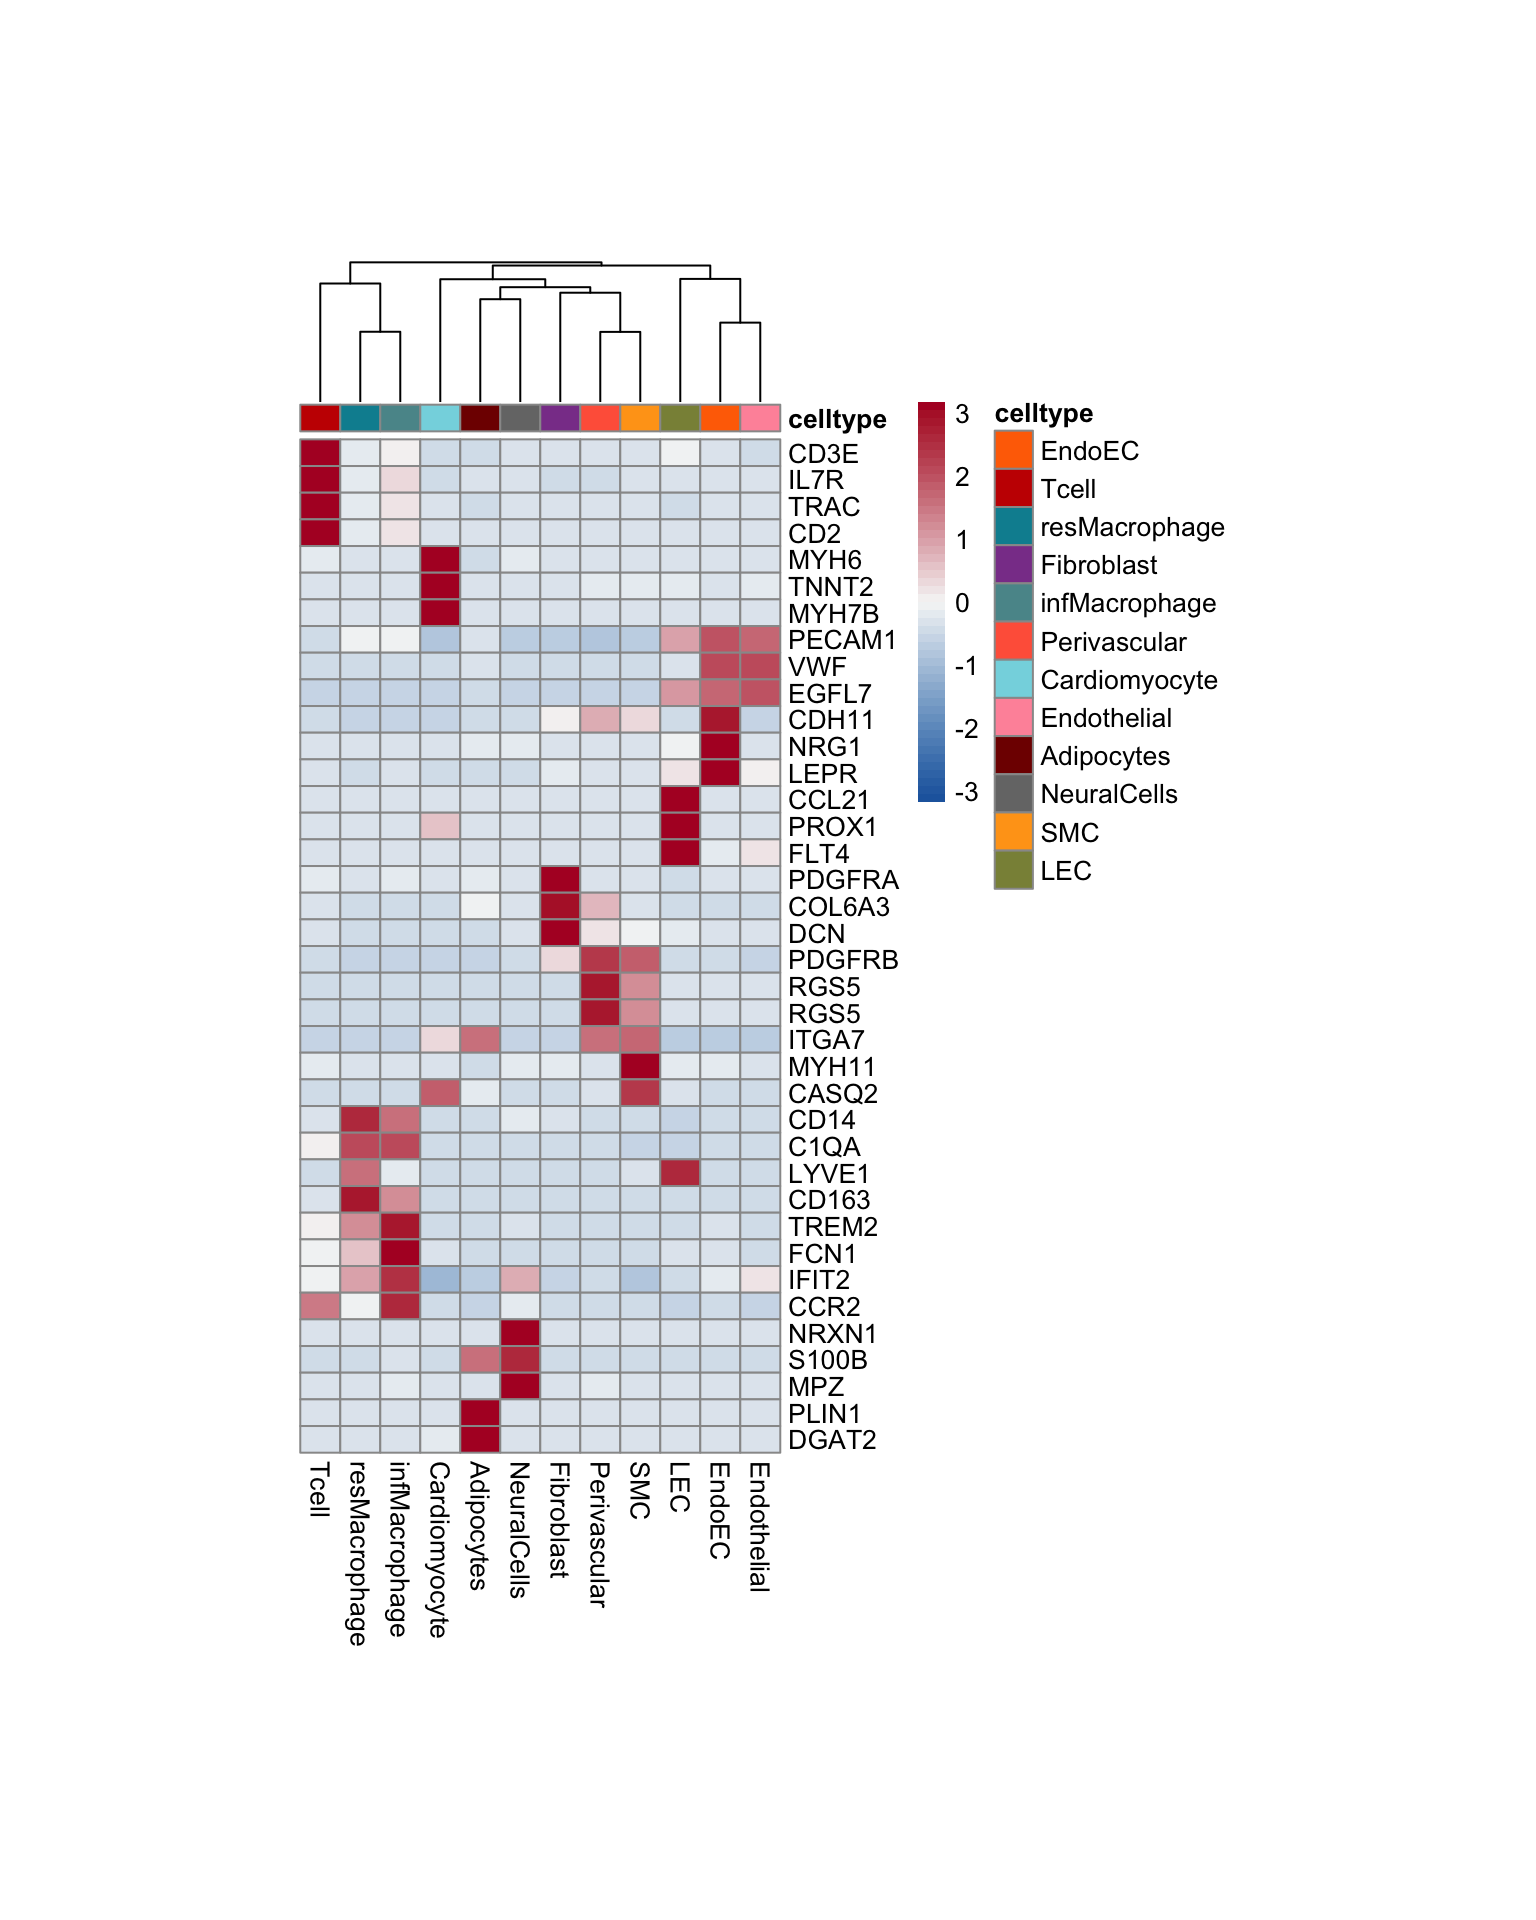
| Version | Author | Date |
|---|---|---|
| e469ce4 | mluetge | 2022-11-29 |
Dotplot
DotPlot(seurat, assay="RNA", features = selGenesAll$gene, scale =T,
        cluster.idents = T) +
  scale_color_viridis_c() +
  coord_flip() +
  theme(axis.text.x = element_text(angle = 90, hjust = 1)) +
  scale_x_discrete(breaks=selGenesAll$gene, labels=selGenesAll$geneID) +
  xlab("") + ylab("")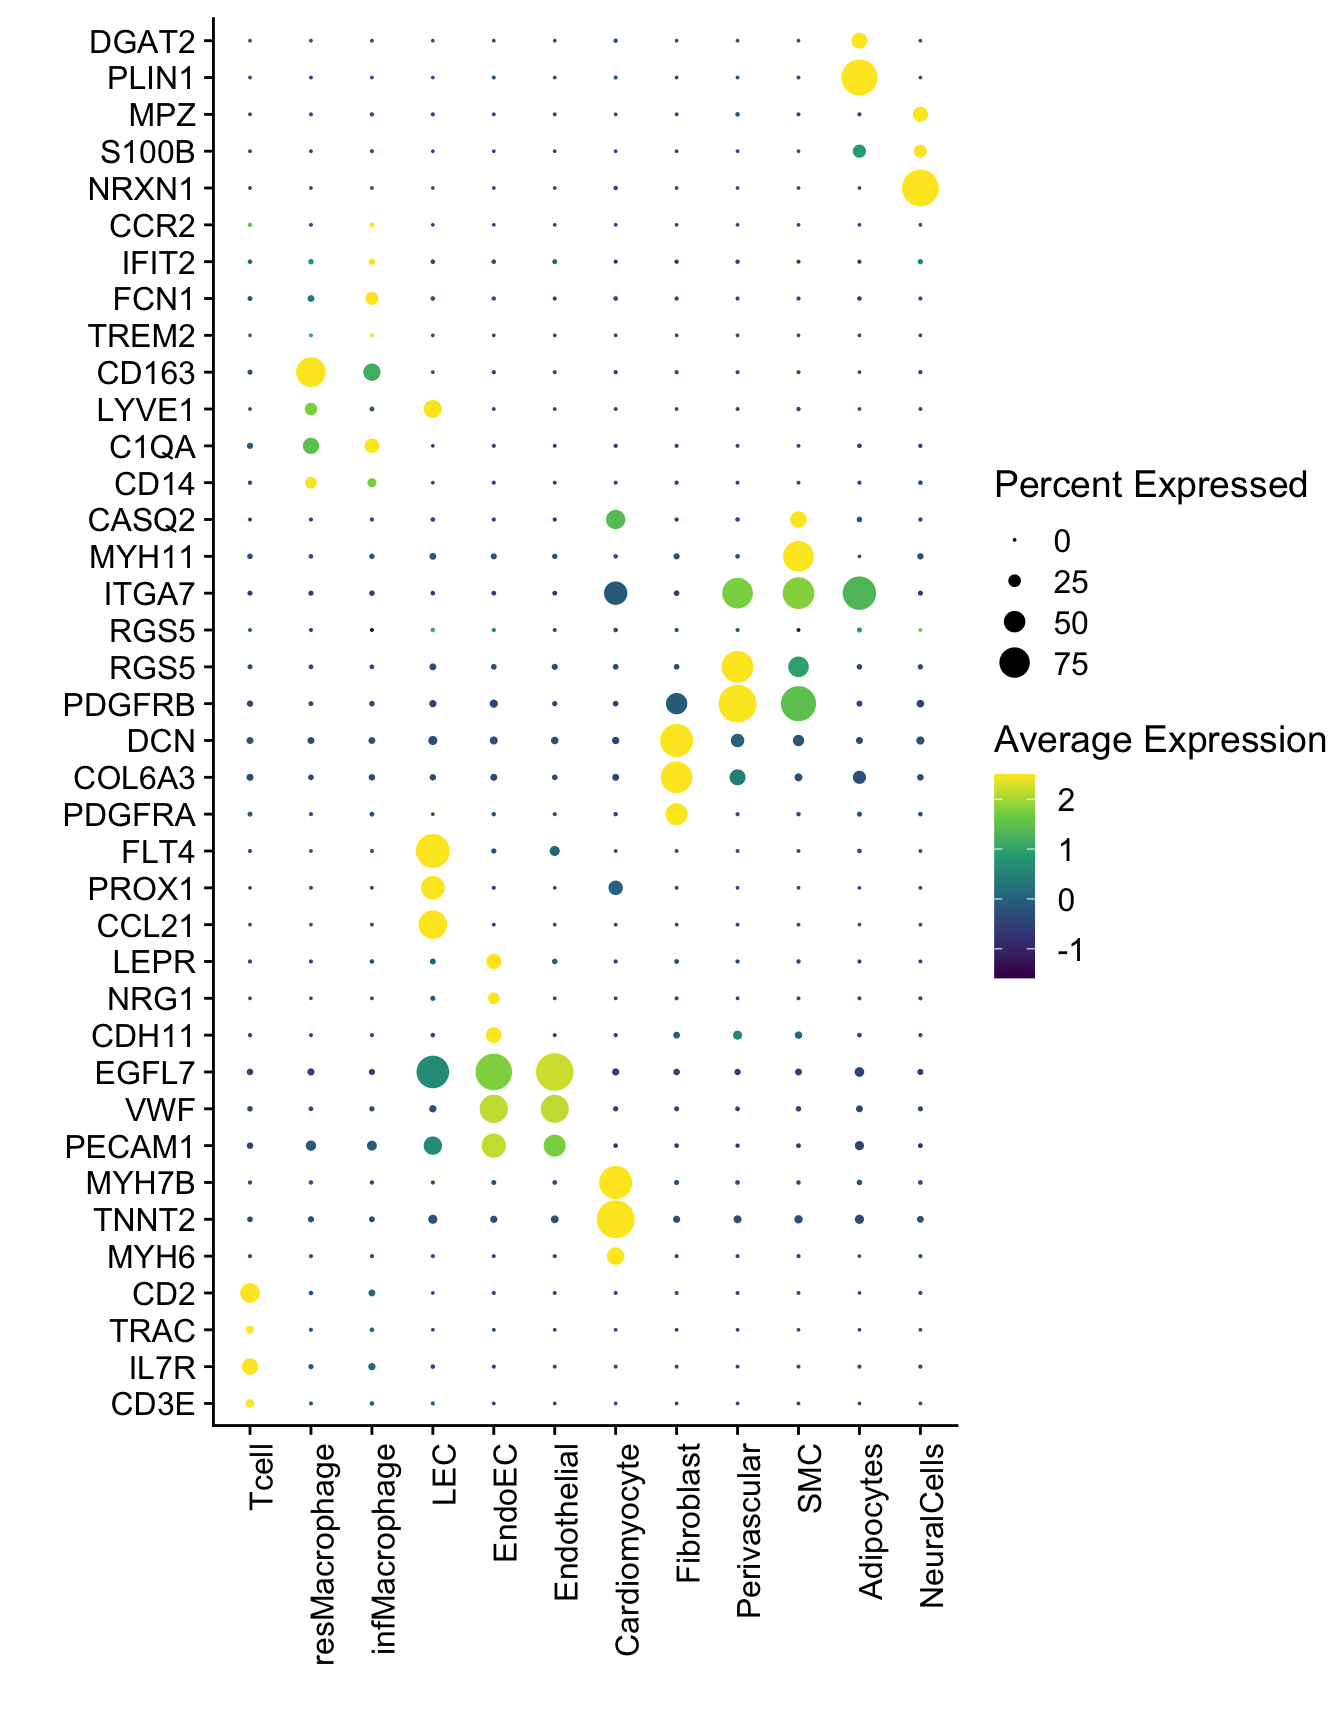
| Version | Author | Date |
|---|---|---|
| e469ce4 | mluetge | 2022-11-29 |
Idents(seurat) <- seurat$seurat_clusters
DotPlot(seurat, assay="RNA", features = selGenesAll$gene, scale =T,
        cluster.idents = T) +
  scale_color_viridis_c() +
  coord_flip() +
  theme(axis.text.x = element_text(angle = 90, hjust = 1)) +
  scale_x_discrete(breaks=selGenesAll$gene, labels=selGenesAll$geneID) +
  xlab("") + ylab("")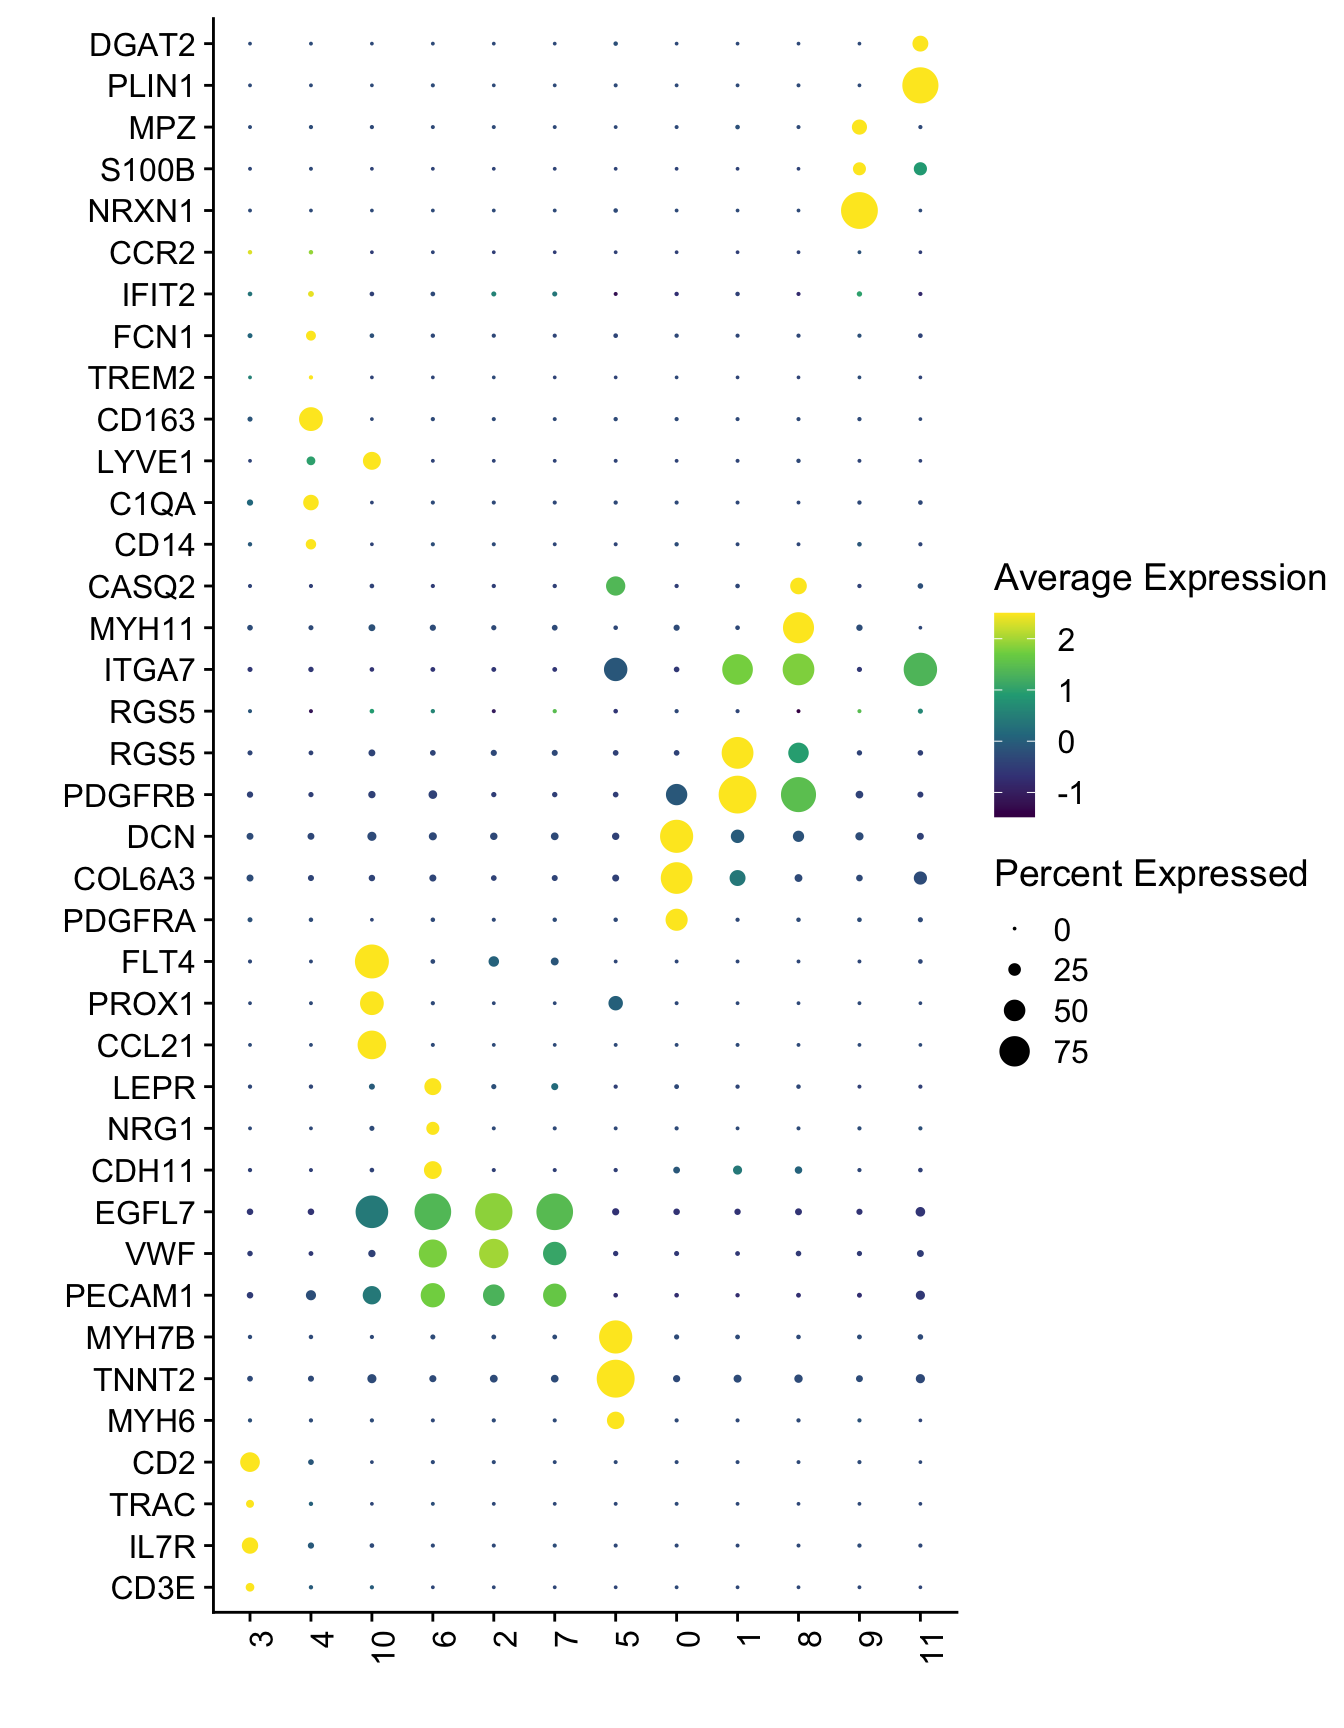
| Version | Author | Date |
|---|---|---|
| e469ce4 | mluetge | 2022-11-29 |
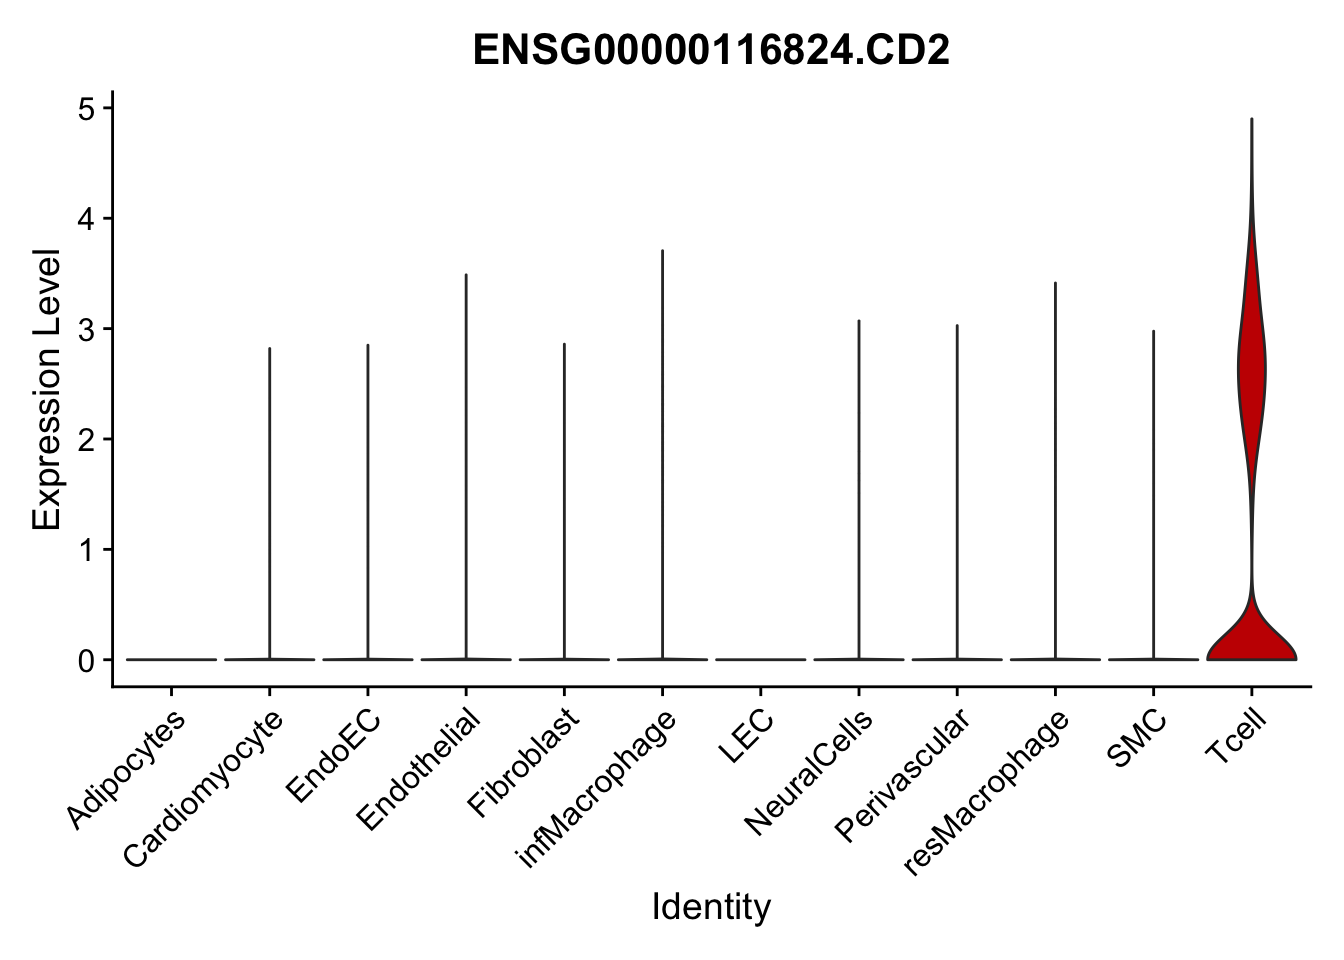
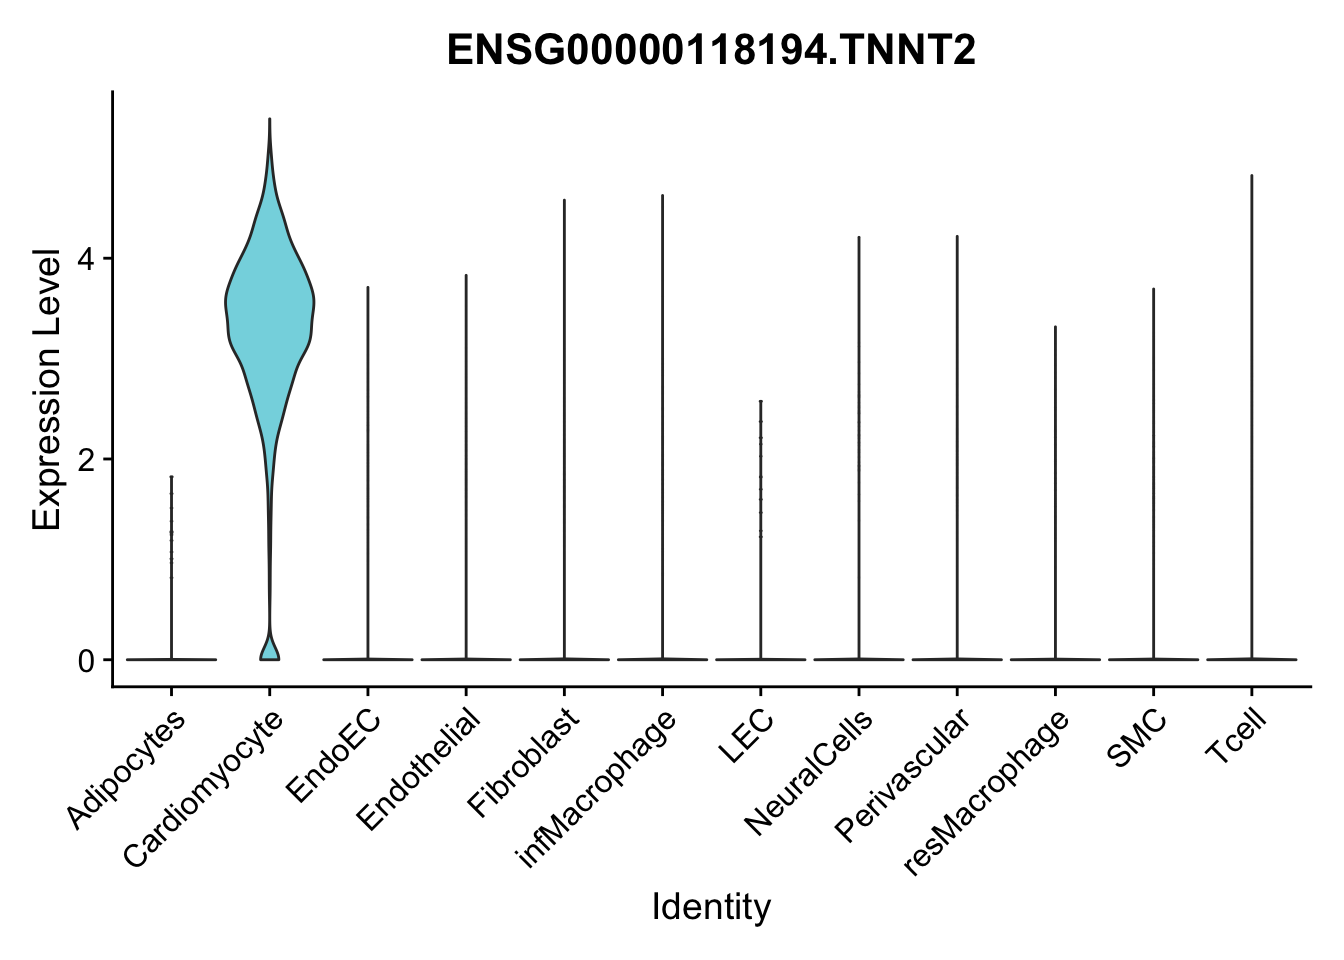
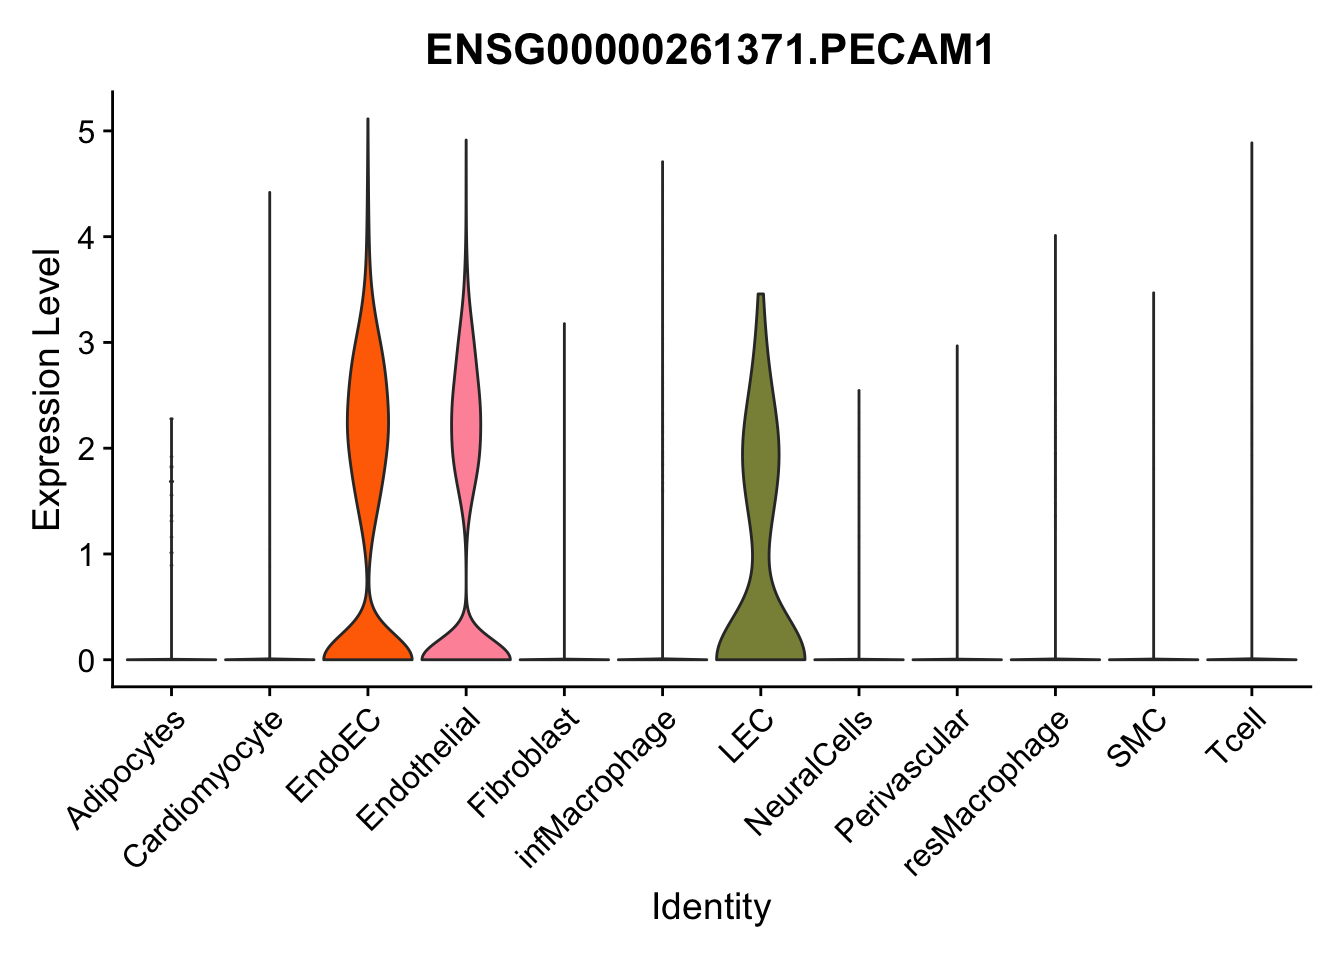
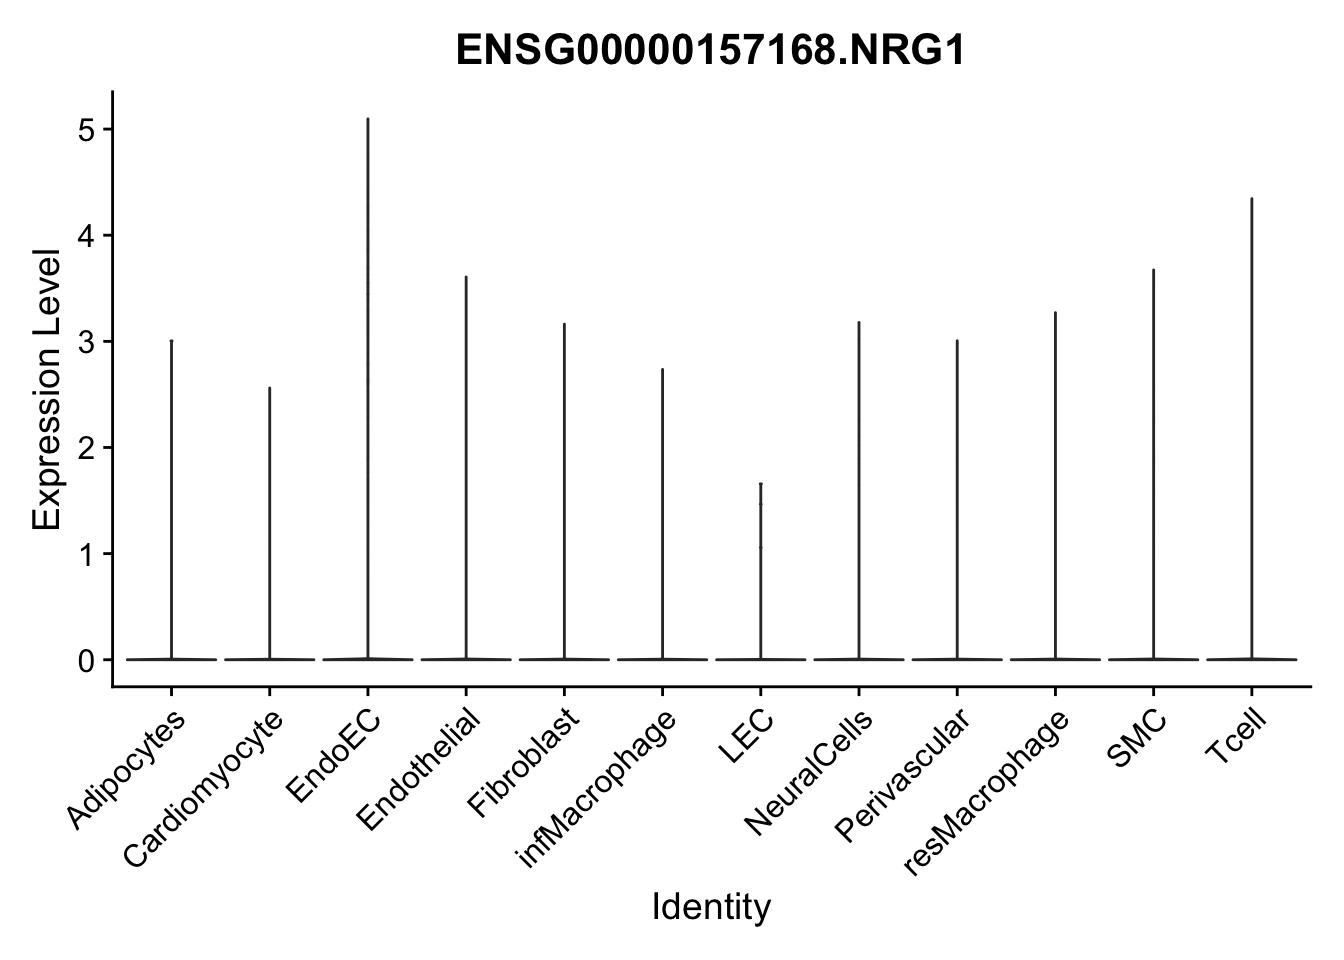
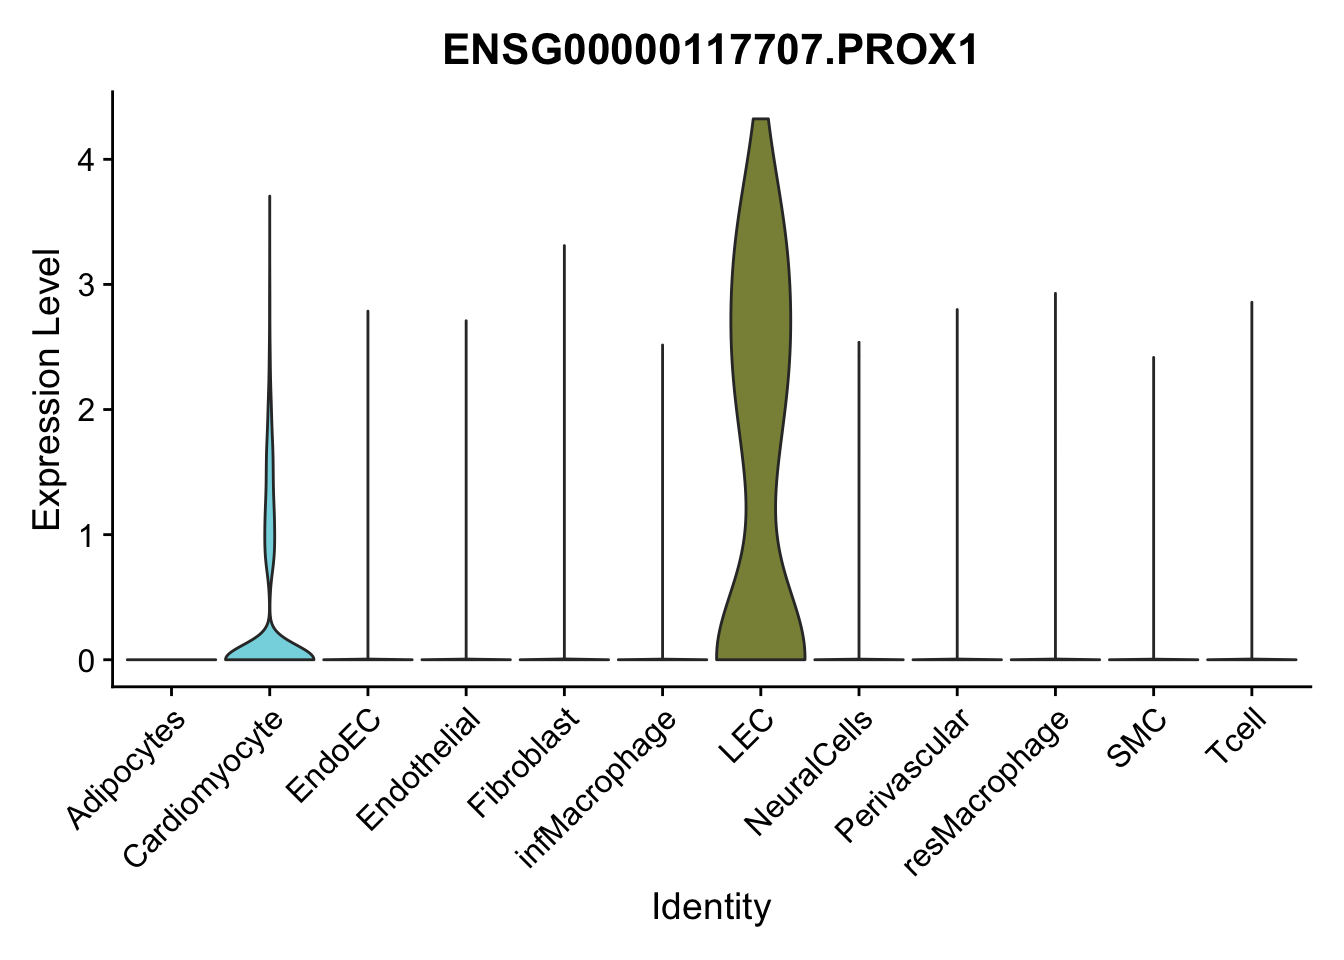
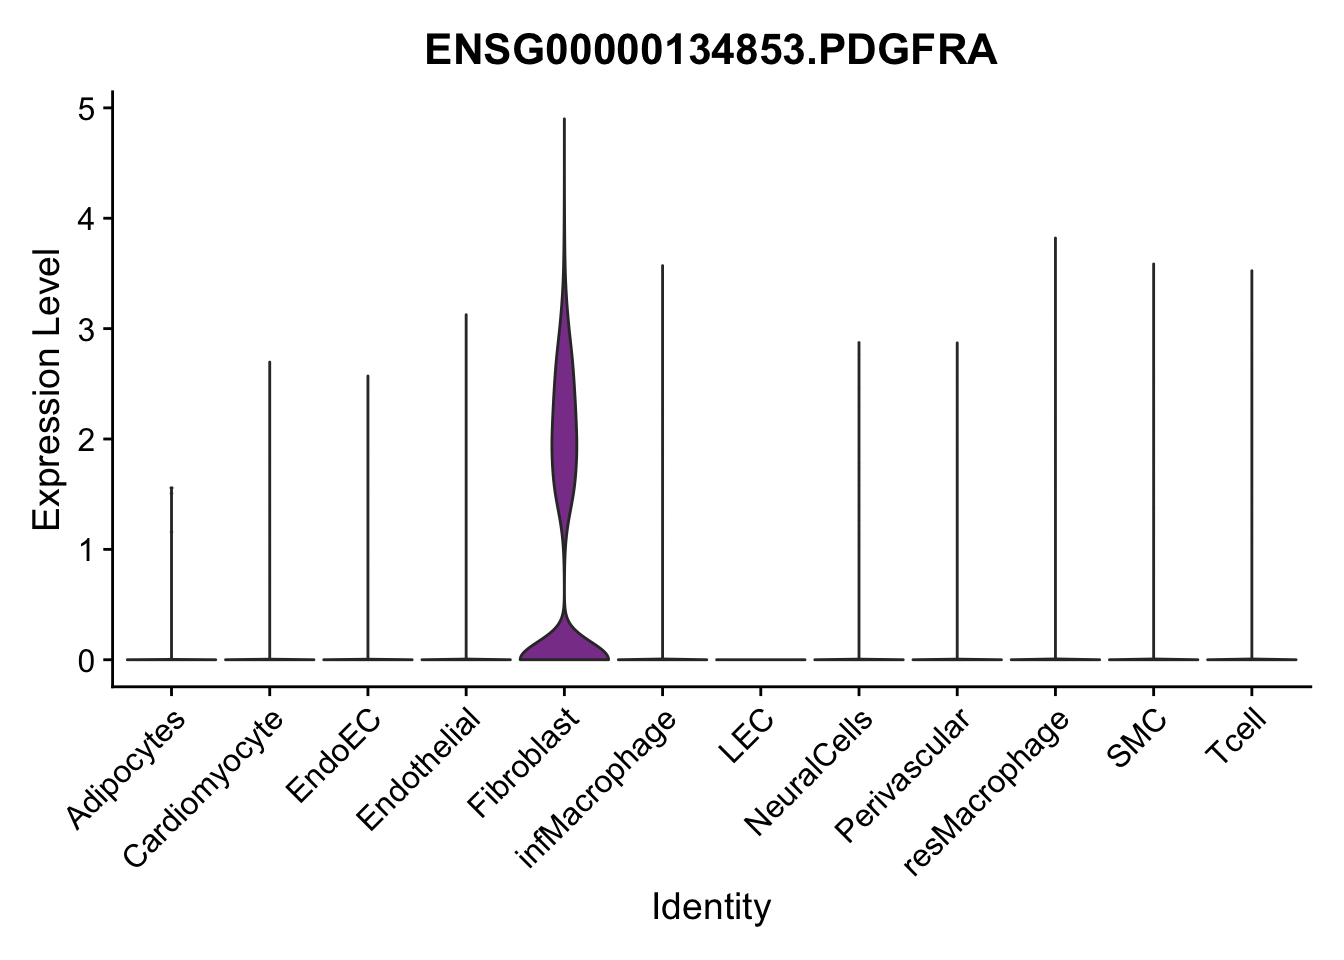
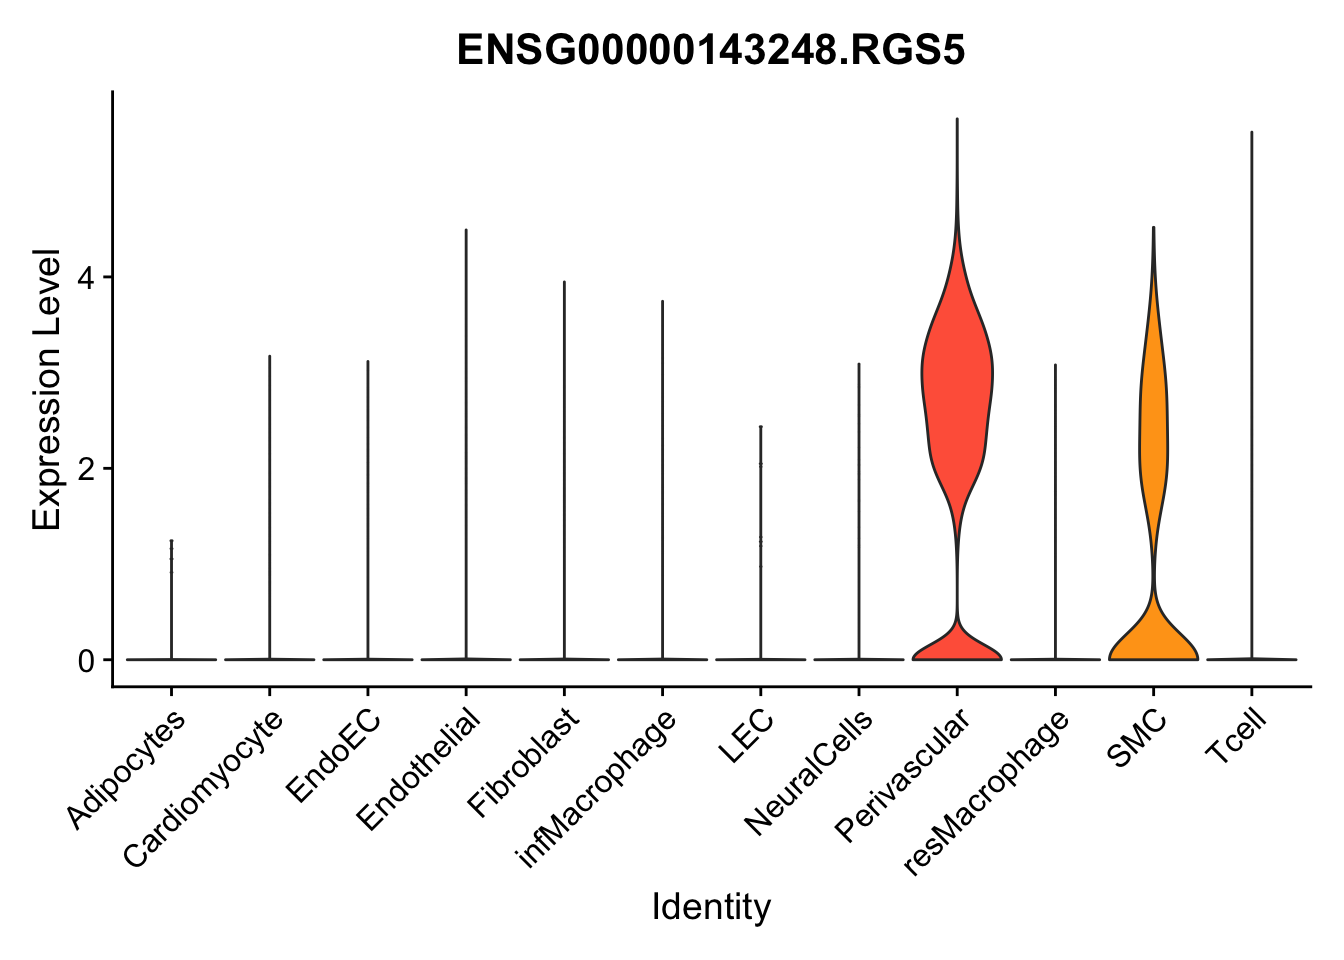
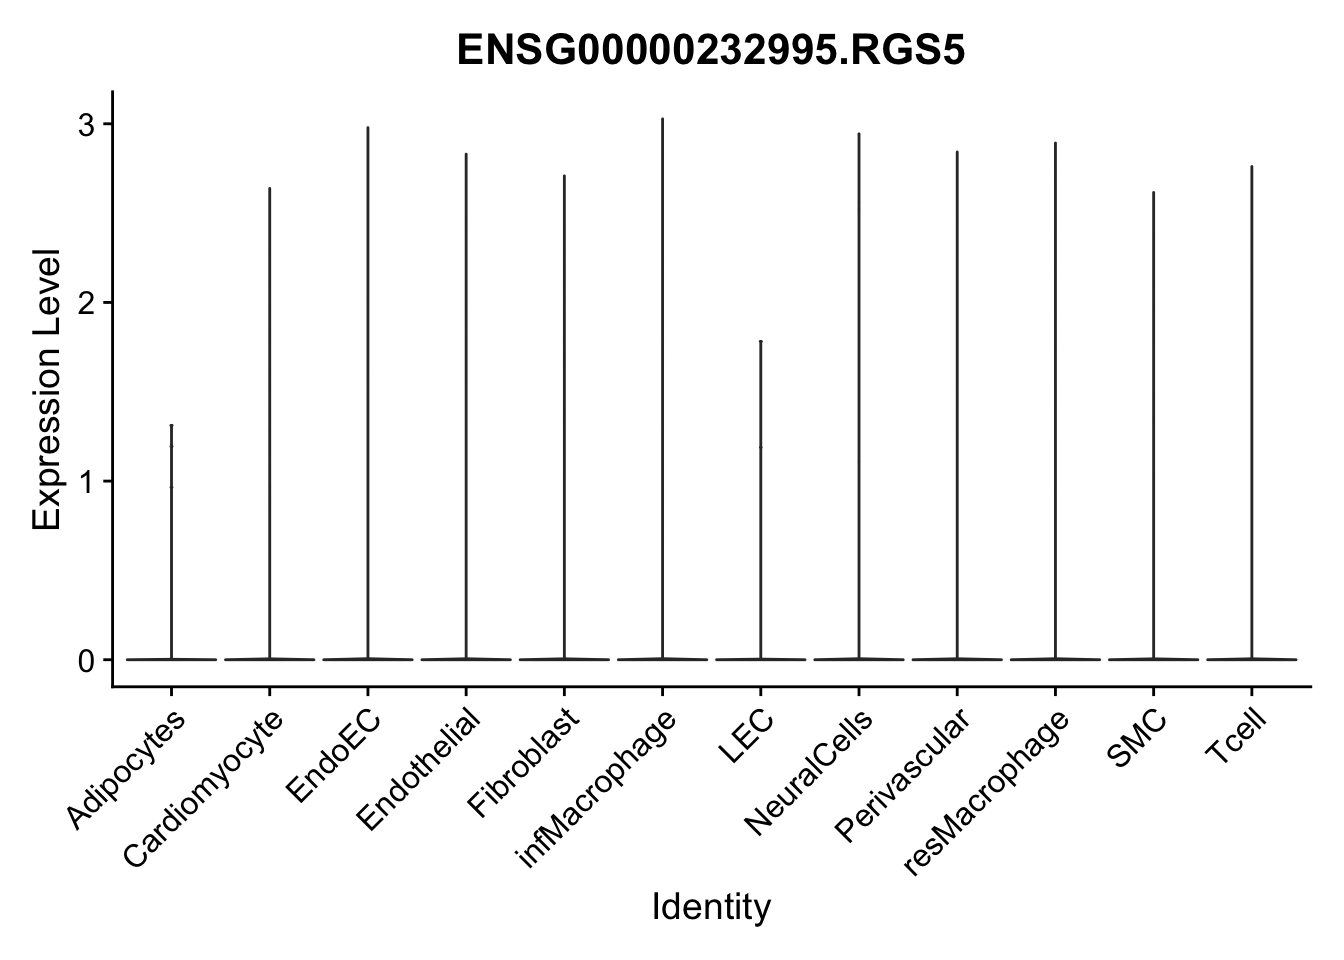
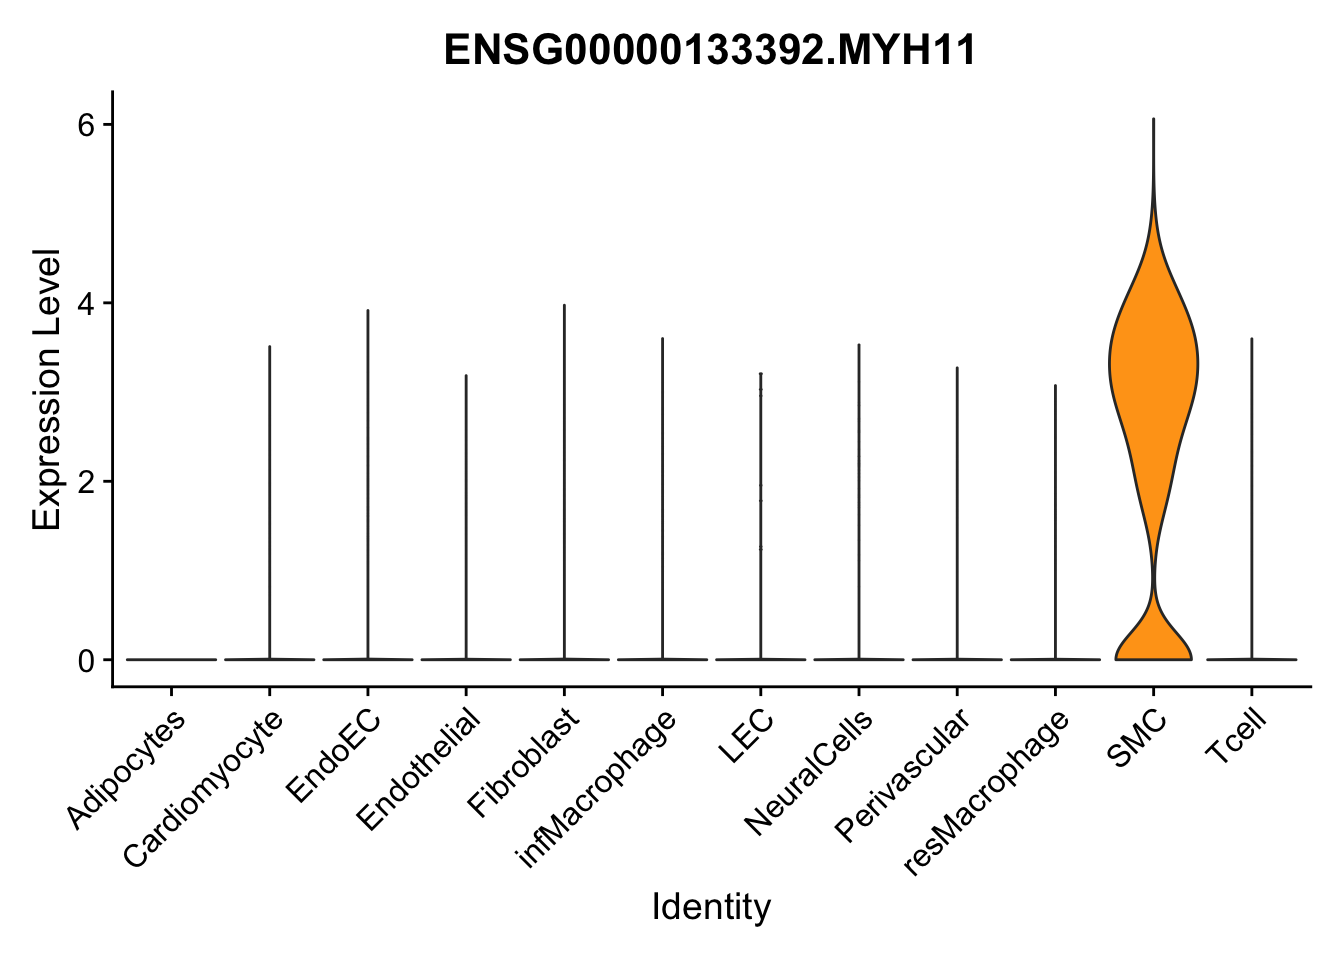
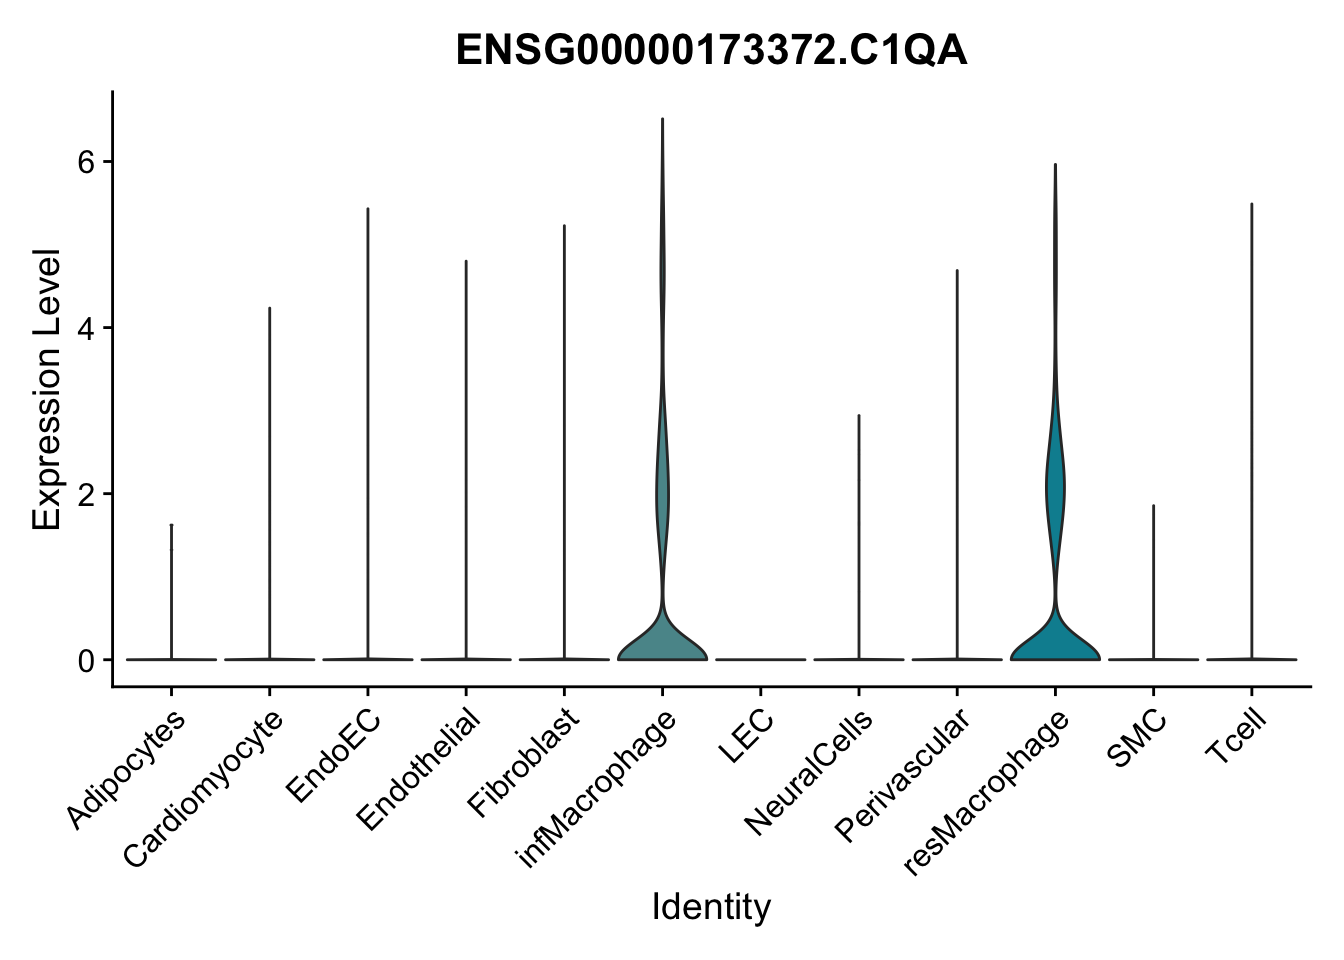
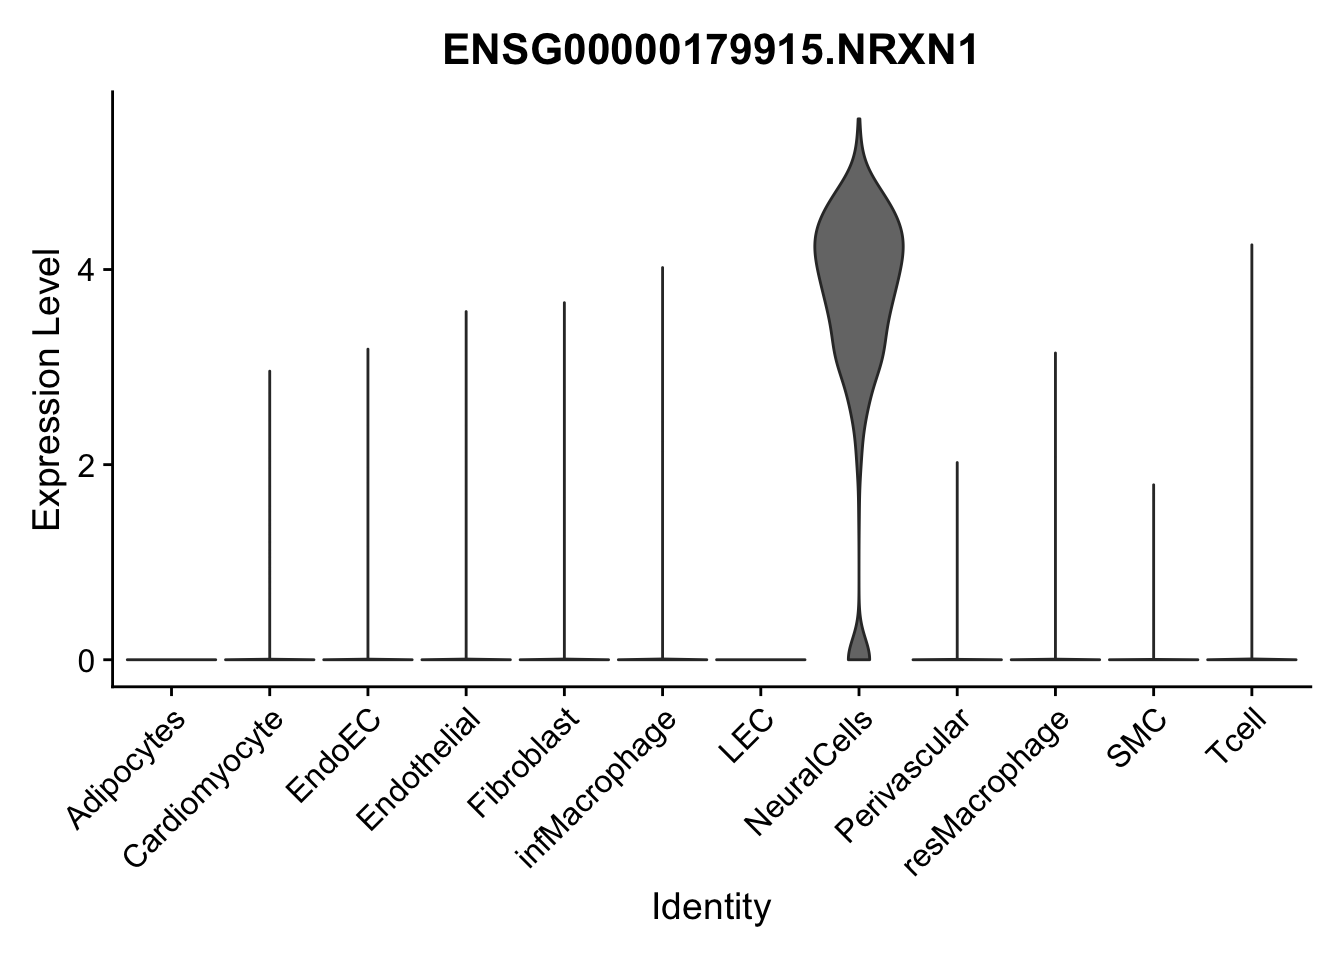
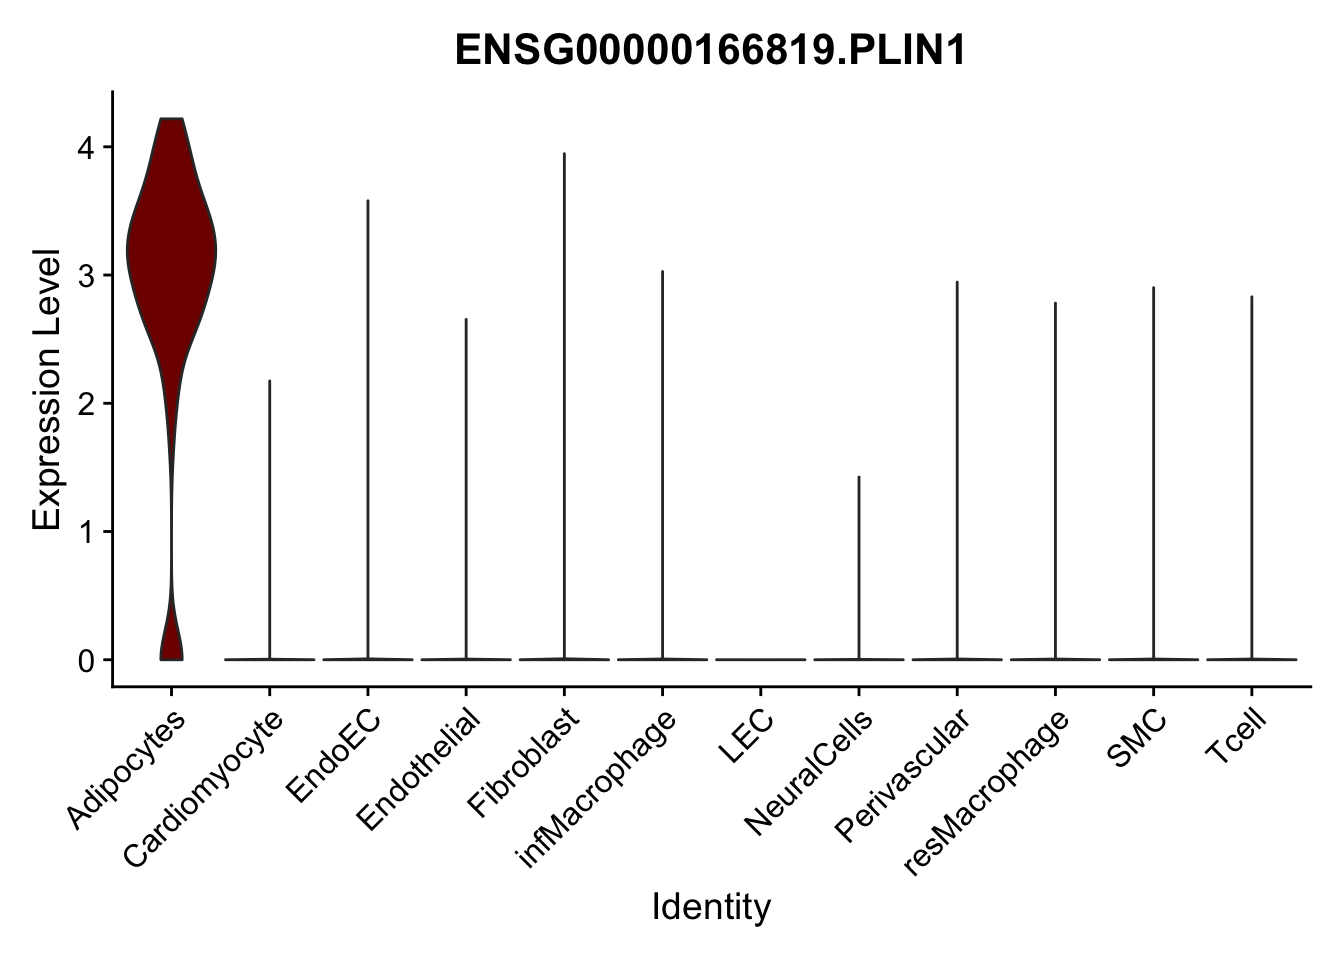
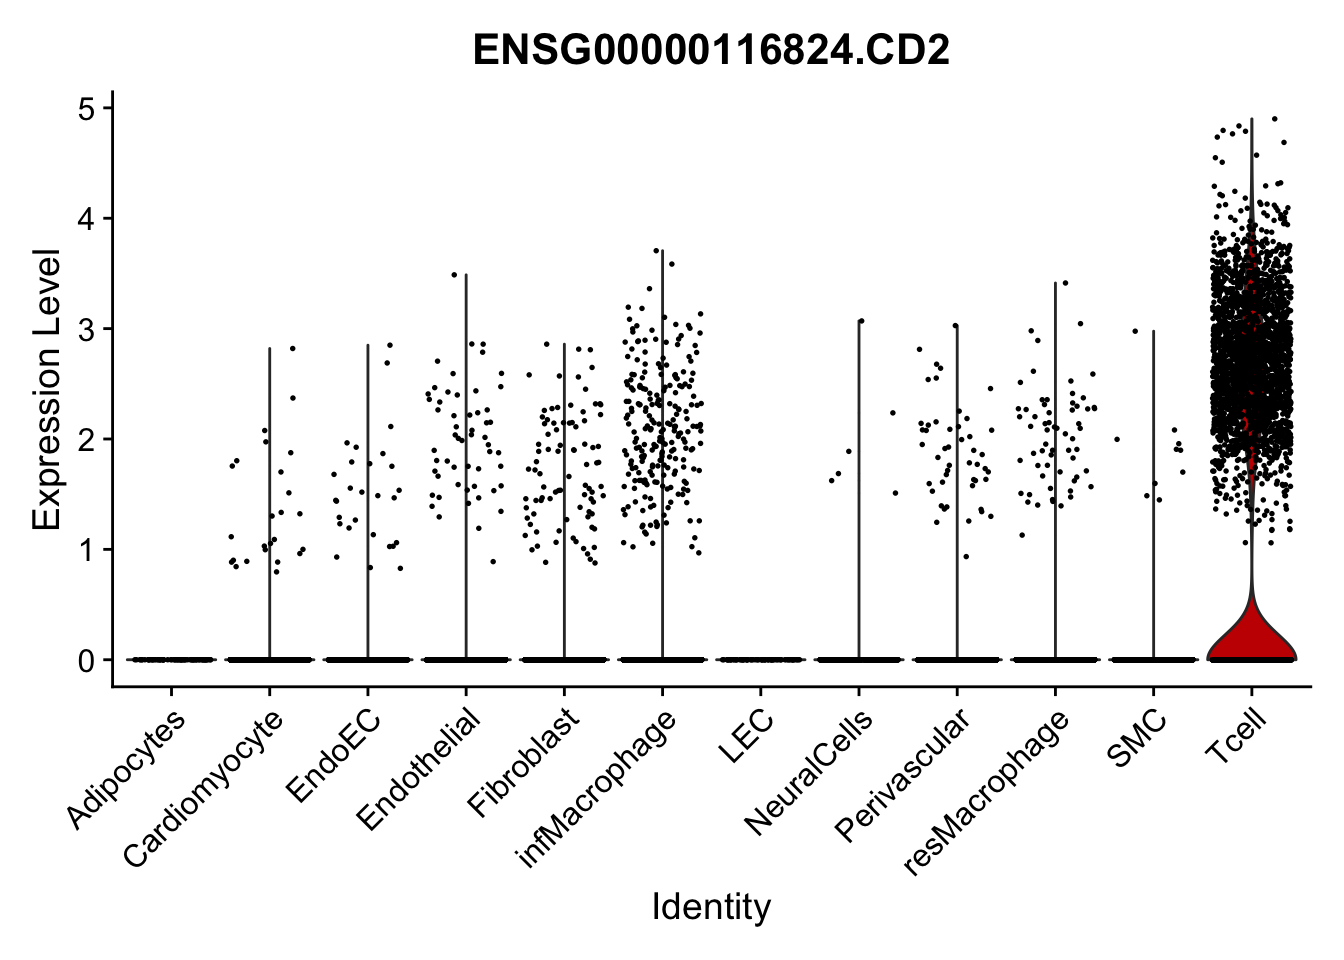
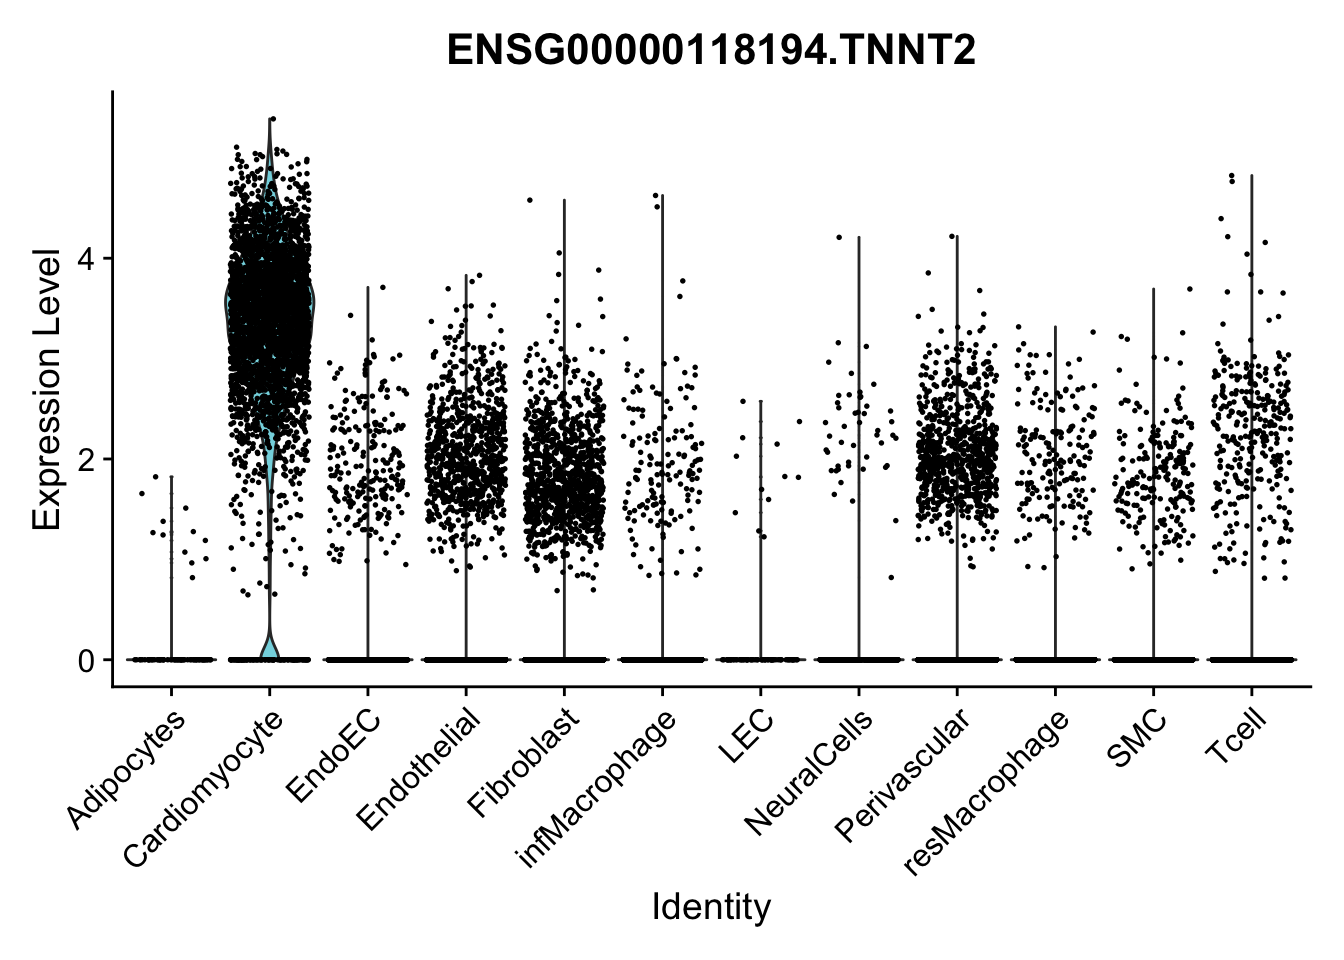
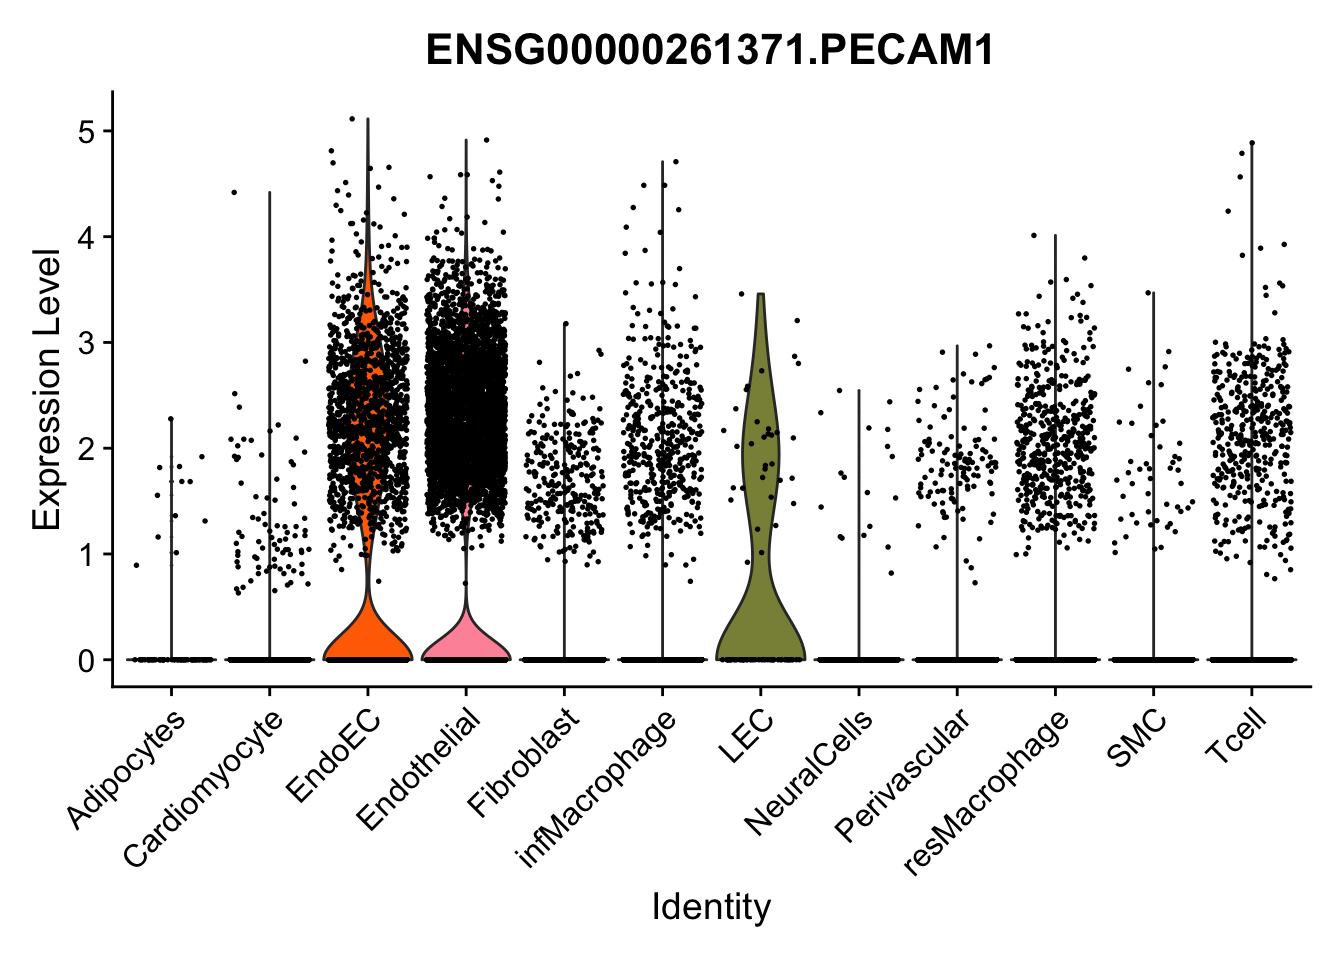
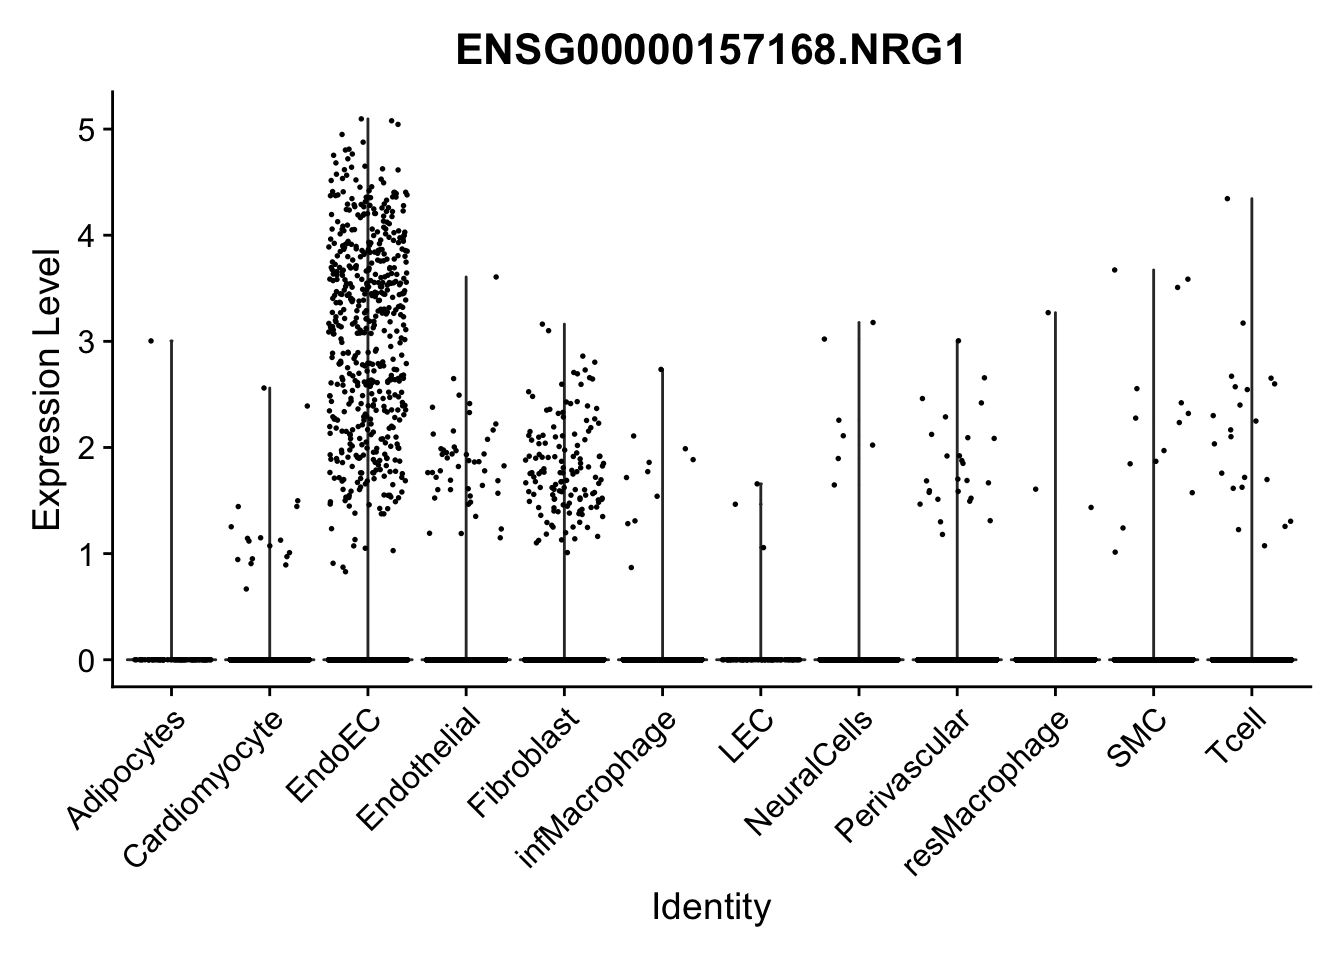
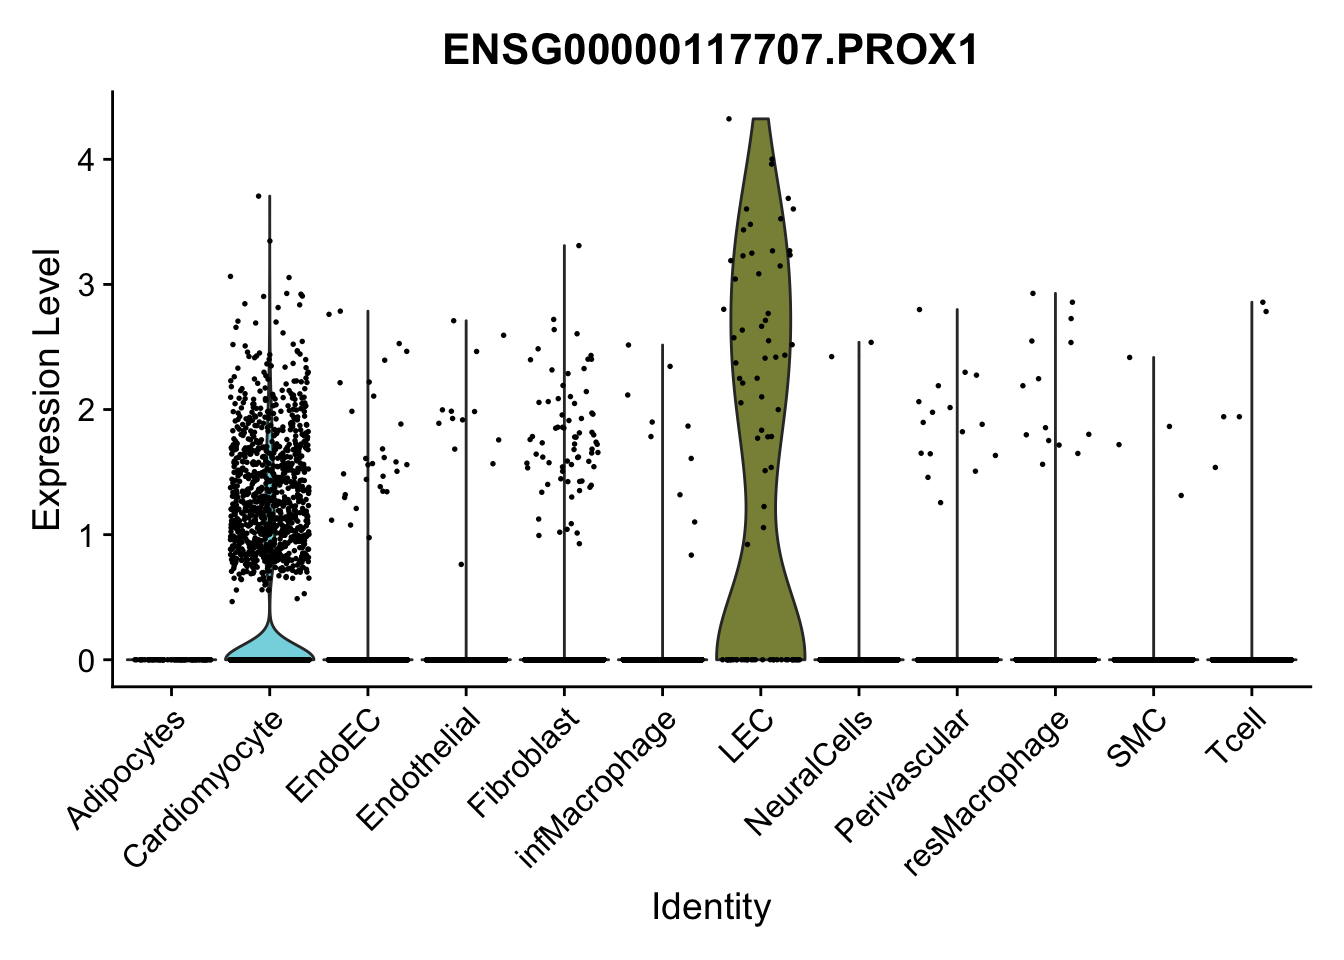
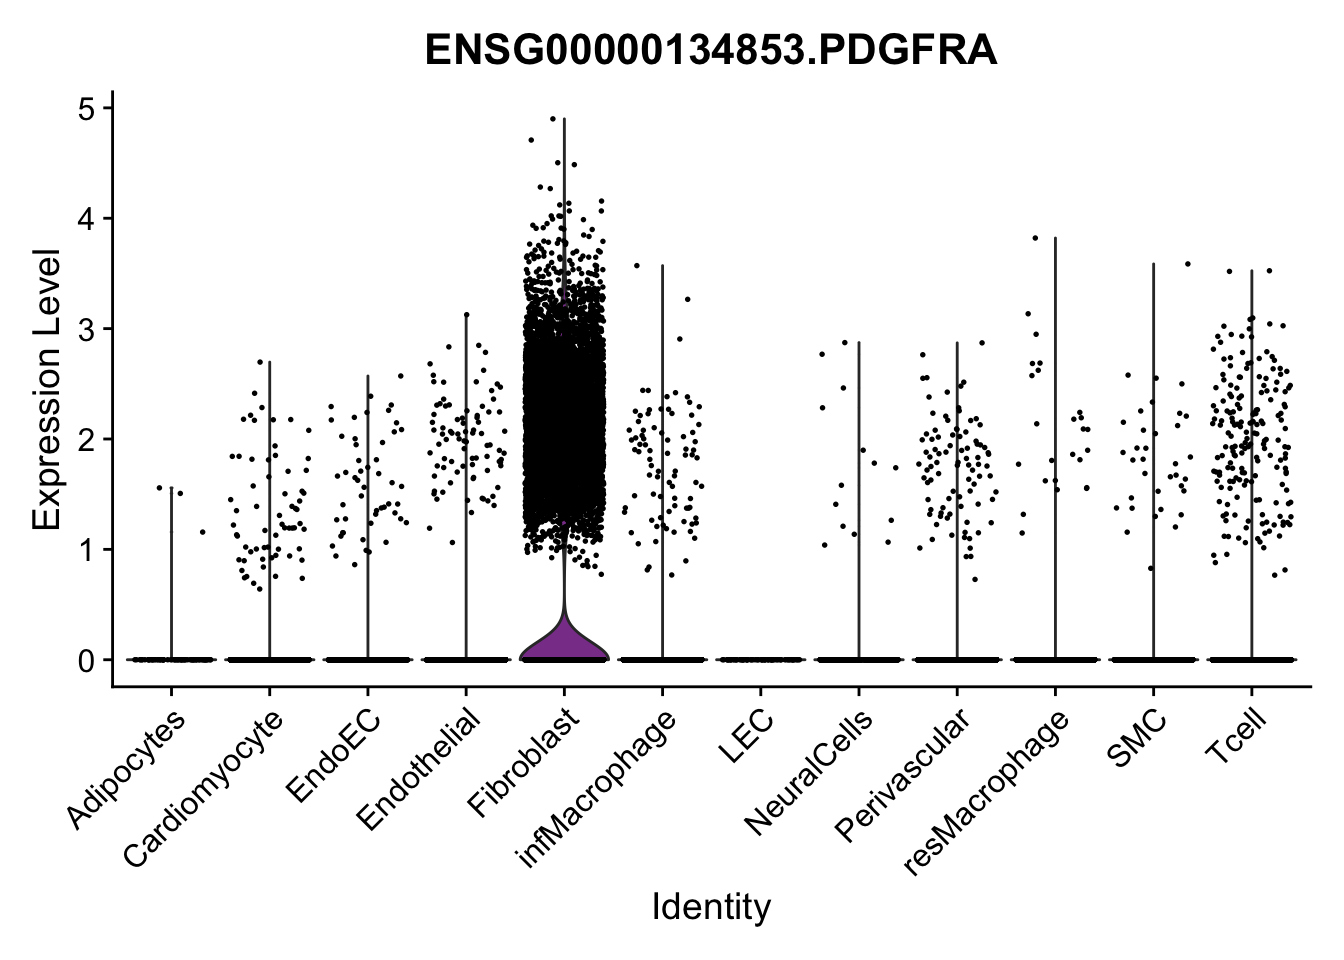
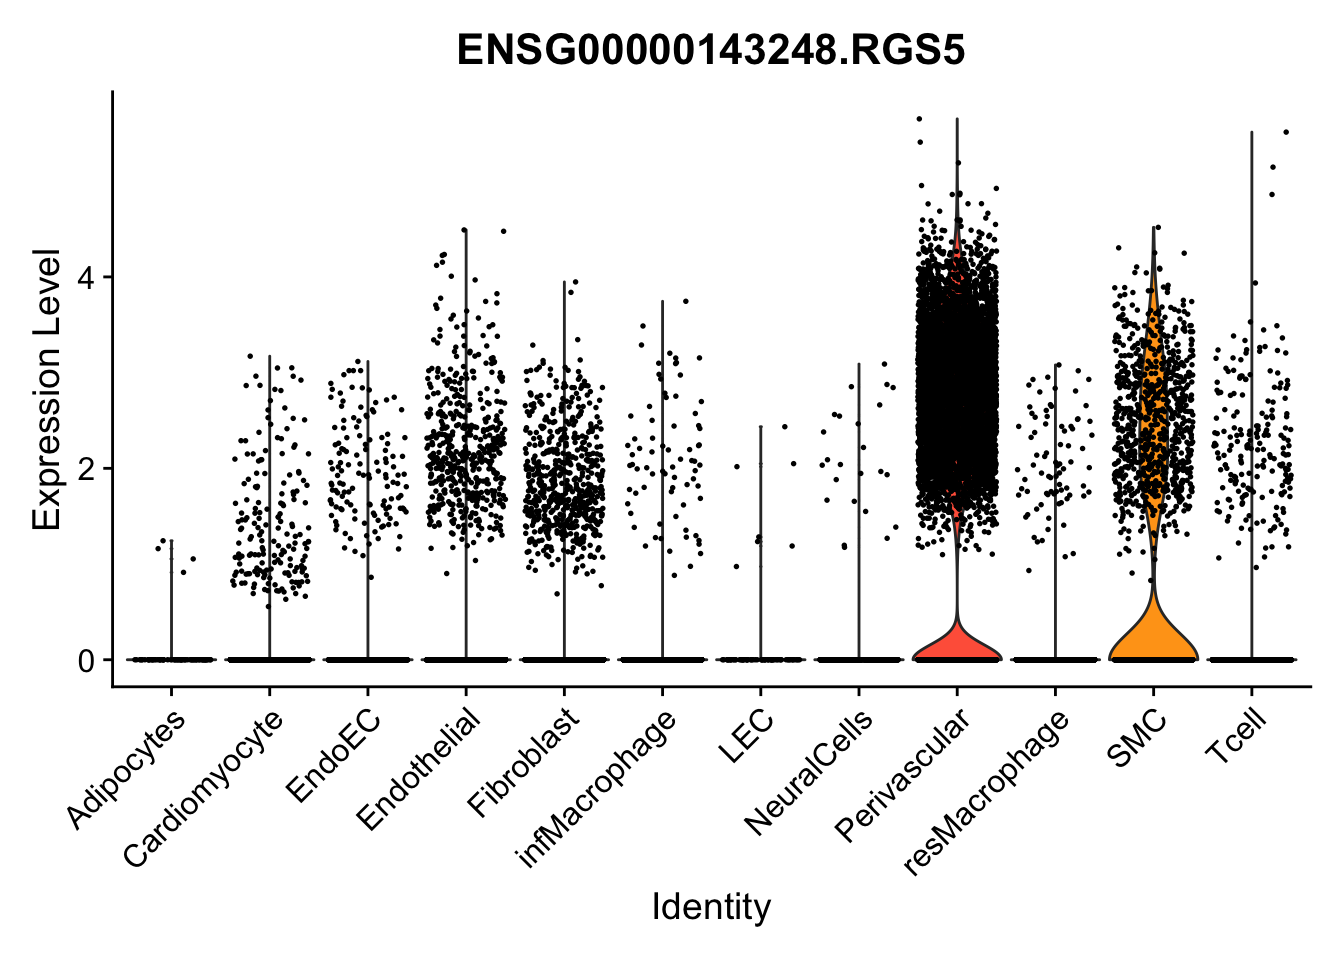
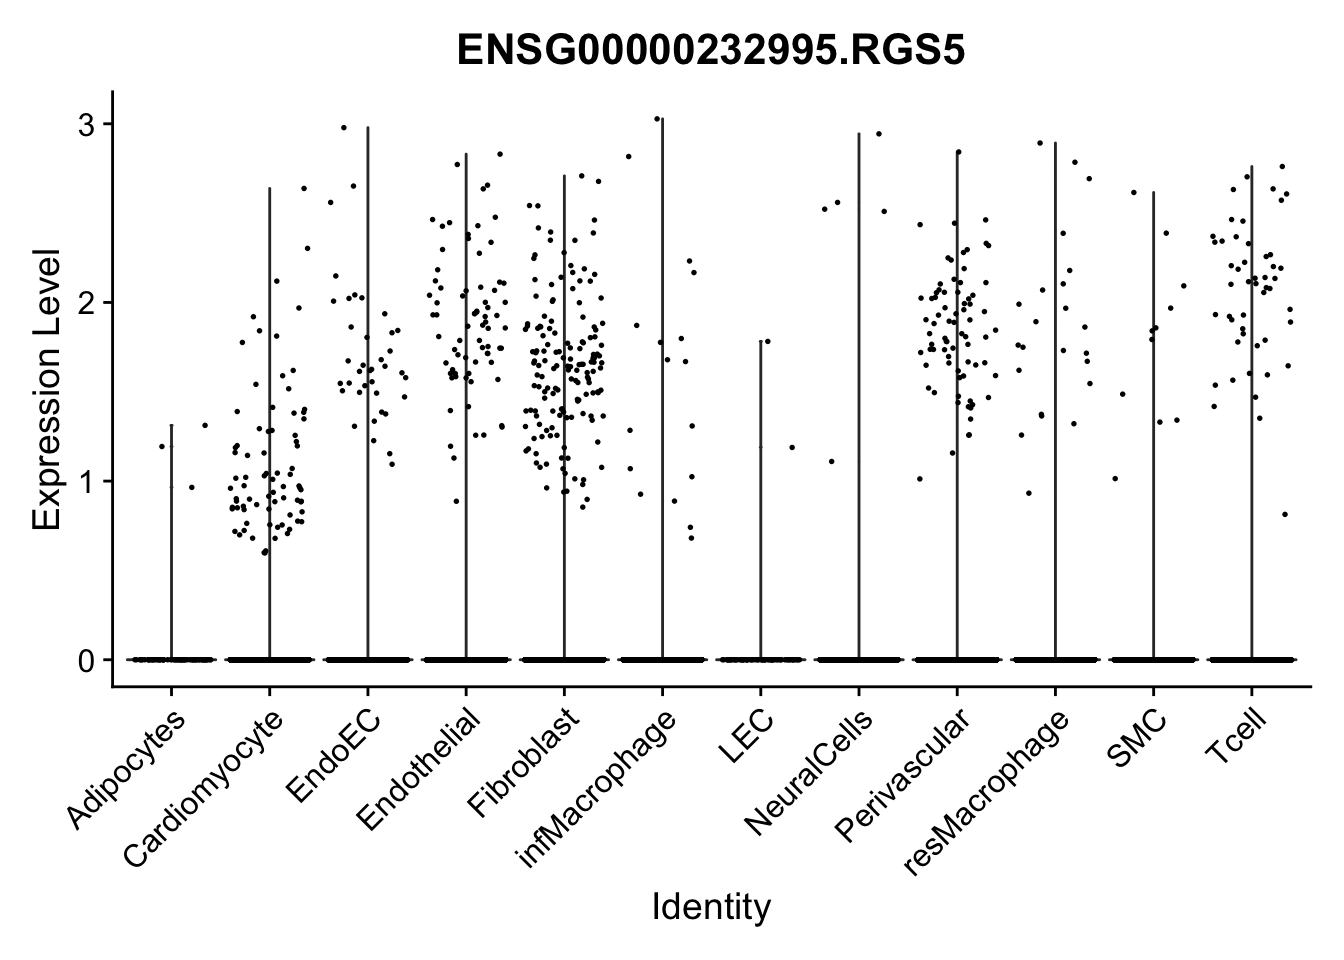
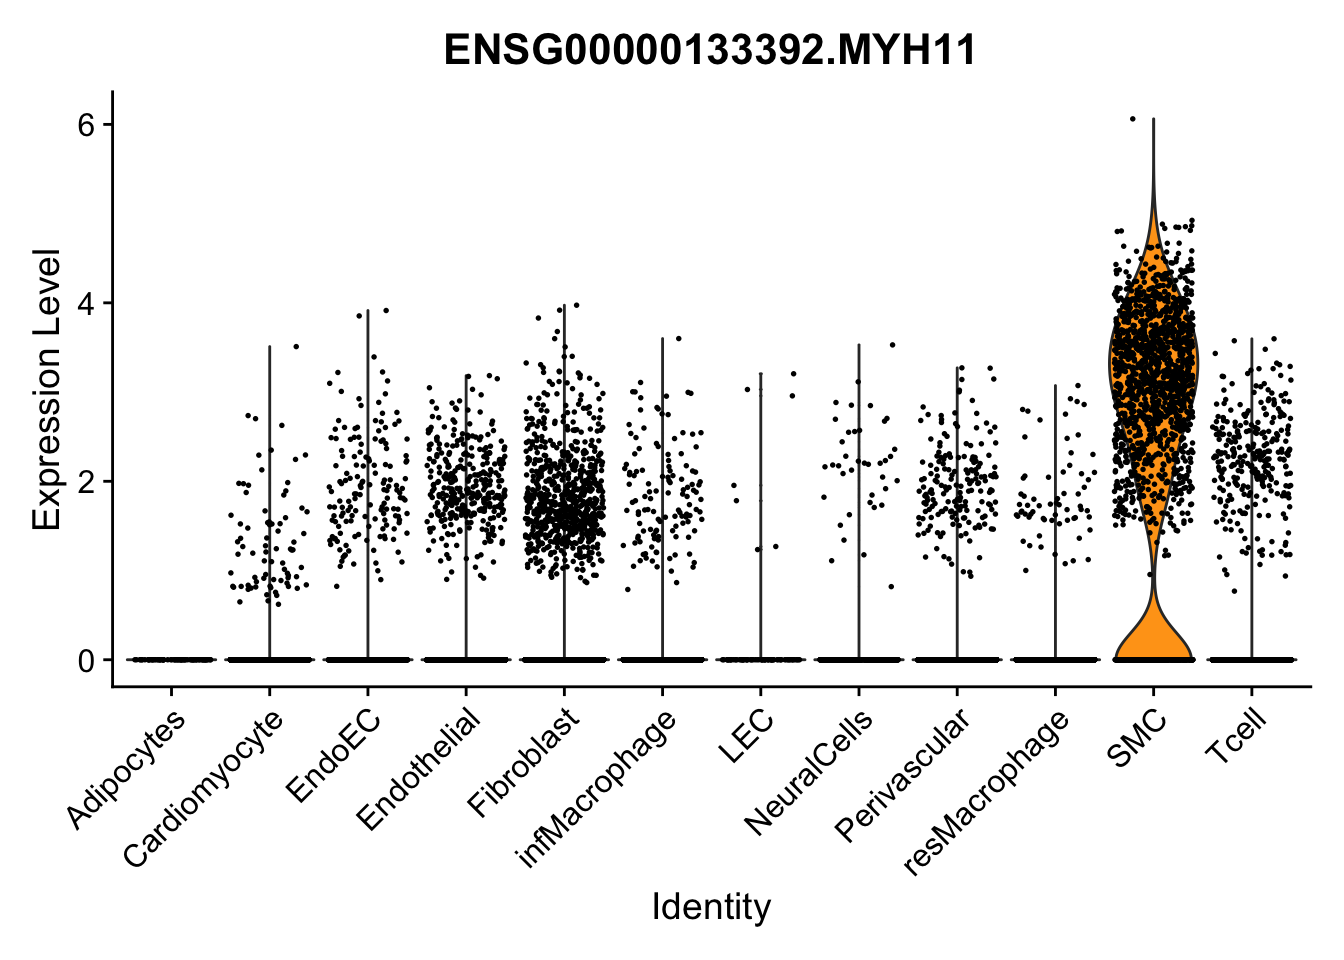
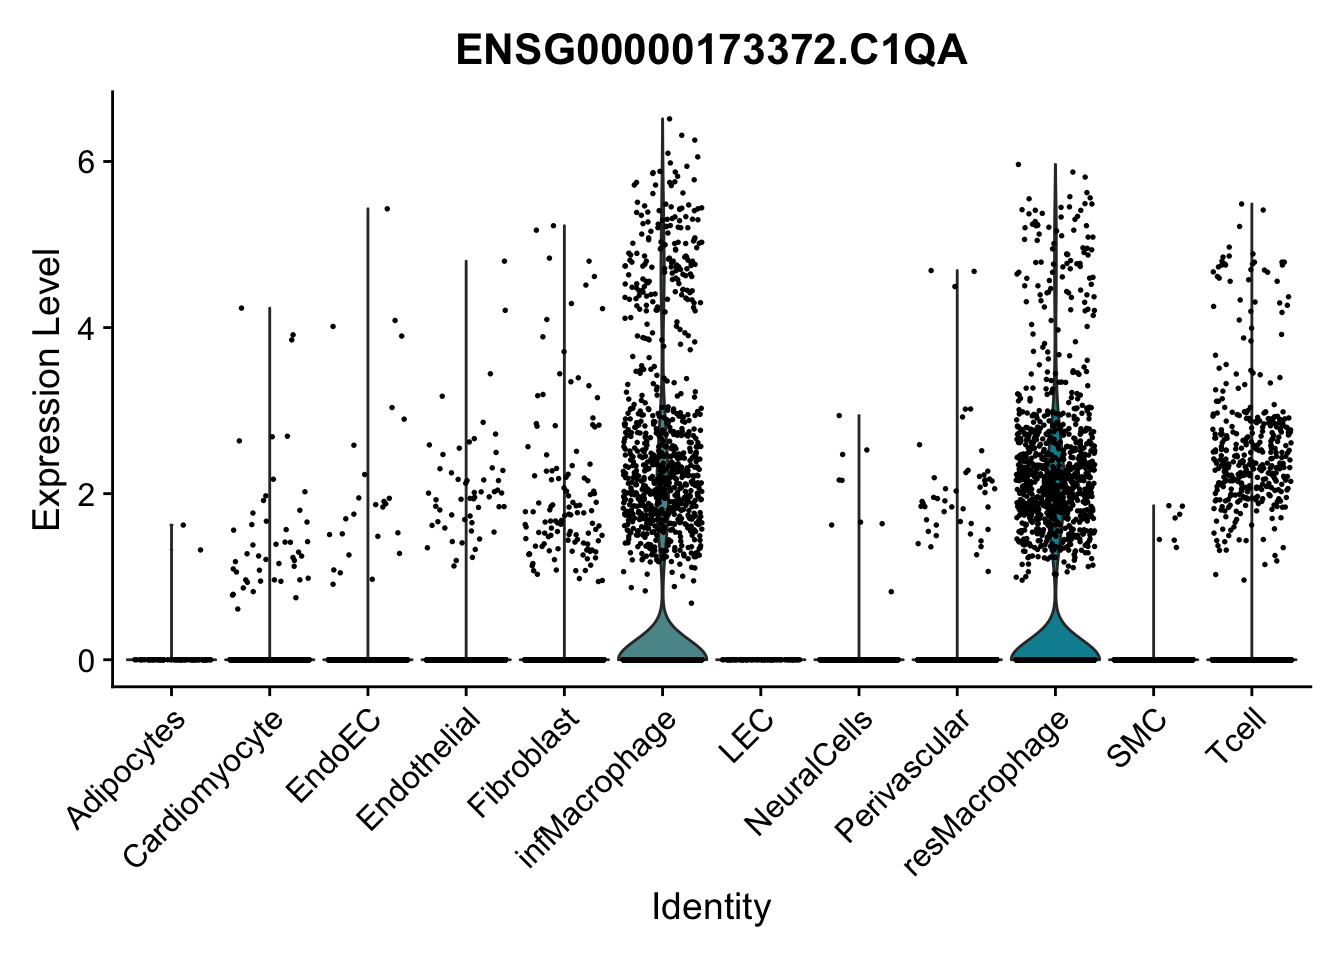
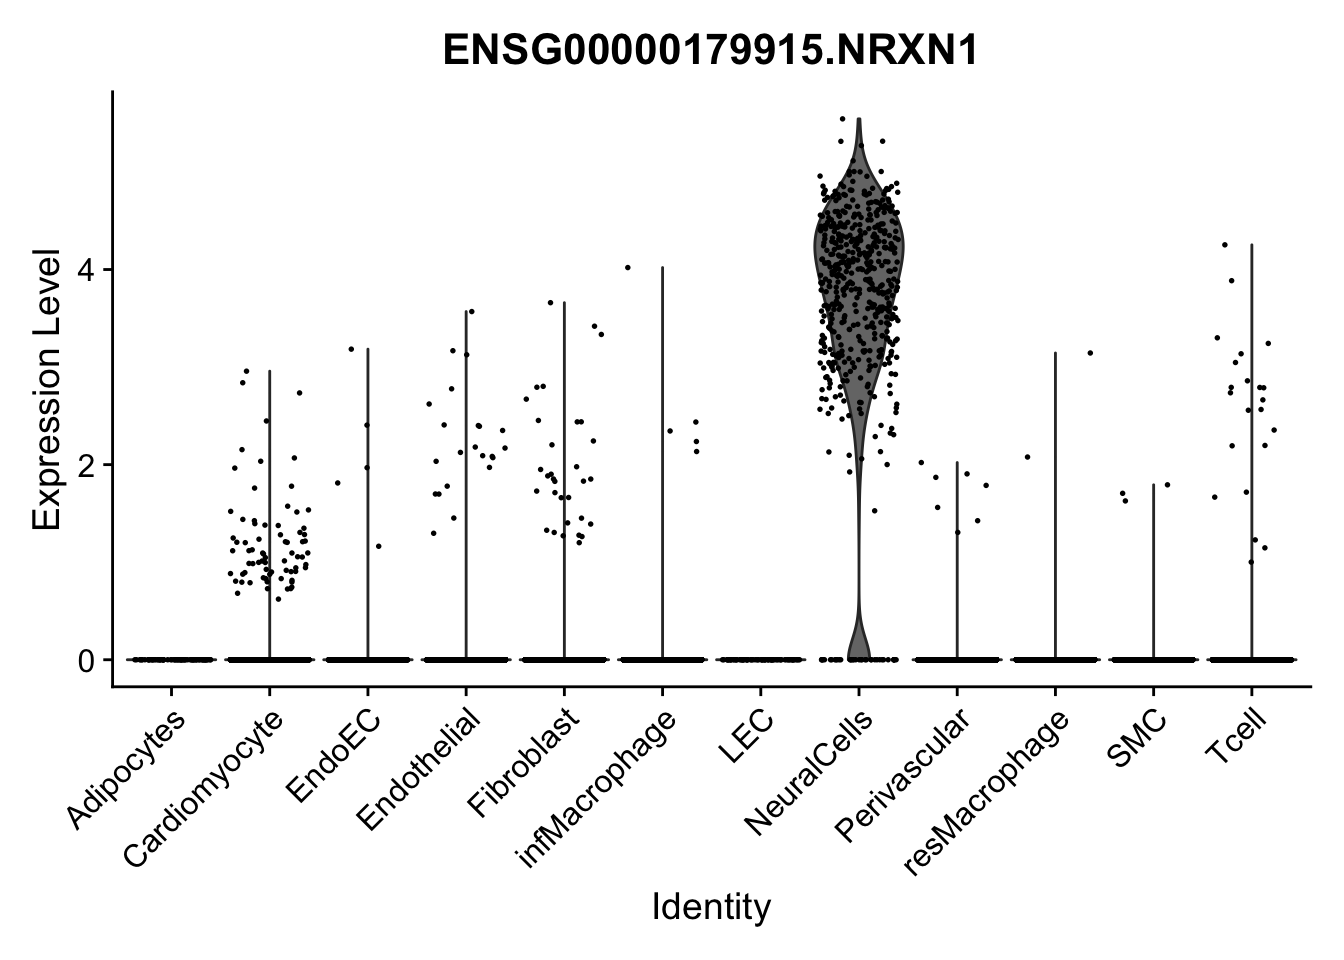
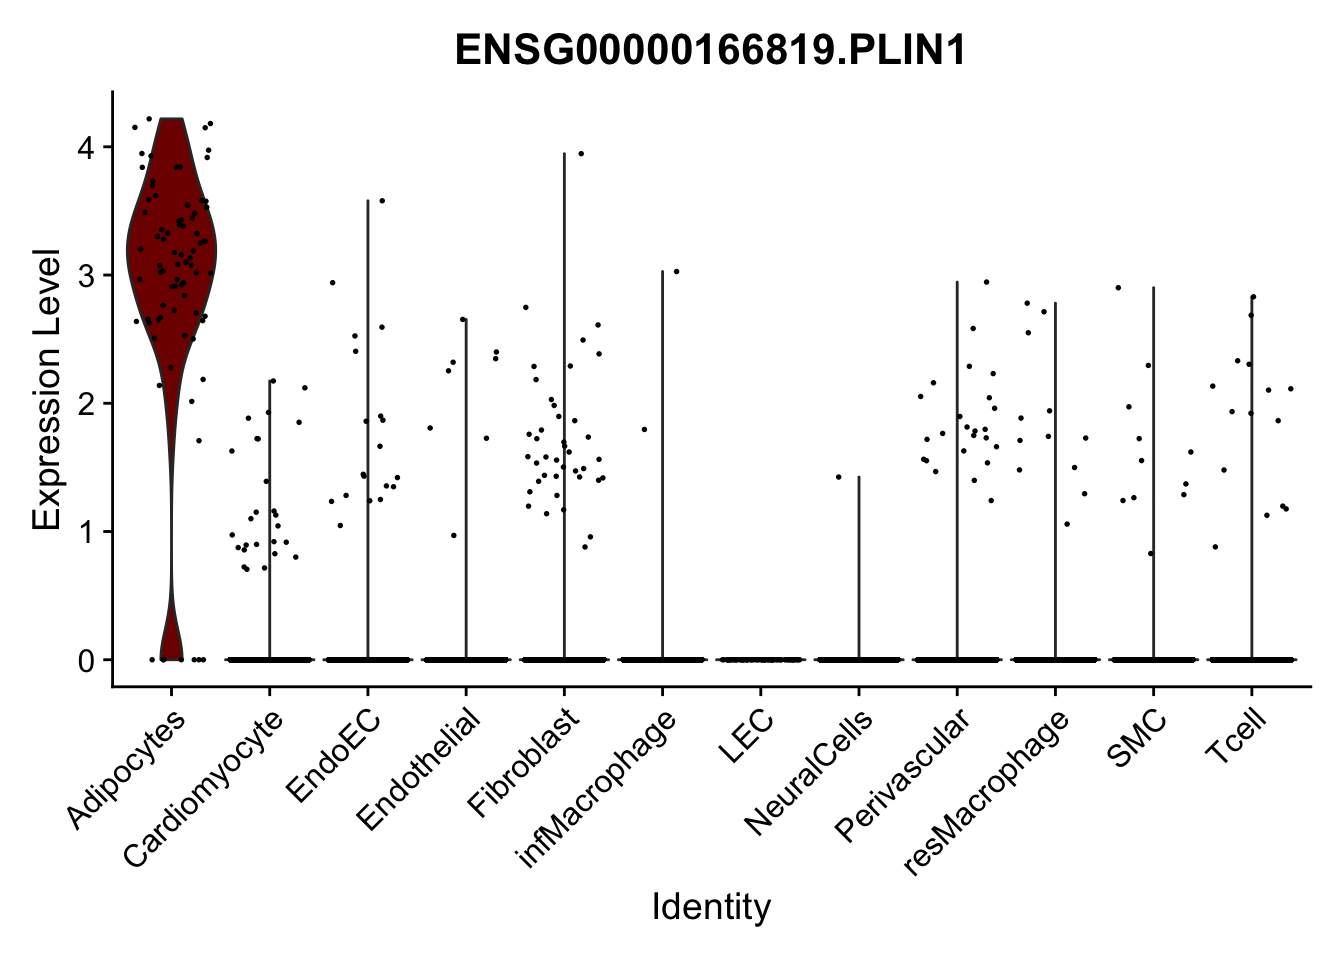
violin plots selected marker
genesDat <- data.frame(EnsID=rownames(seurat)) %>%
  mutate(gene=gsub(".*\\.", "", EnsID))
selGenes <- data.frame(gene=c("CD2", "TNNT2", "PECAM1", "NRG1", "PROX1",
                              "PDGFRA", "RGS5", "MYH11", "C1QA", "NRXN1",
                              "PLIN1")) %>%
  left_join(., genesDat, by="gene")

pList <- sapply(selGenes$EnsID, function(x){
  p <- VlnPlot(object = seurat, features = x,
               group.by = "label",
               cols = colLab, pt.size = 0
               ) +
    theme(legend.position = "none")

  plot(p)
})
| Version | Author | Date |
|---|---|---|
| e469ce4 | mluetge | 2022-11-29 |
| Version | Author | Date |
|---|---|---|
| e469ce4 | mluetge | 2022-11-29 |
| Version | Author | Date |
|---|---|---|
| e469ce4 | mluetge | 2022-11-29 |
| Version | Author | Date |
|---|---|---|
| e469ce4 | mluetge | 2022-11-29 |
| Version | Author | Date |
|---|---|---|
| e469ce4 | mluetge | 2022-11-29 |
| Version | Author | Date |
|---|---|---|
| e469ce4 | mluetge | 2022-11-29 |
| Version | Author | Date |
|---|---|---|
| e469ce4 | mluetge | 2022-11-29 |
| Version | Author | Date |
|---|---|---|
| e469ce4 | mluetge | 2022-11-29 |
| Version | Author | Date |
|---|---|---|
| e469ce4 | mluetge | 2022-11-29 |
| Version | Author | Date |
|---|---|---|
| e469ce4 | mluetge | 2022-11-29 |
| Version | Author | Date |
|---|---|---|
| e469ce4 | mluetge | 2022-11-29 |
| Version | Author | Date |
|---|---|---|
| e469ce4 | mluetge | 2022-11-29 |
pList <- sapply(selGenes$EnsID, function(x){
  p <- VlnPlot(object = seurat, features = x,
               group.by = "label",
               cols = colLab, pt.size = 0.3
               ) +
    theme(legend.position = "none")

  plot(p)
})
| Version | Author | Date |
|---|---|---|
| e469ce4 | mluetge | 2022-11-29 |
| Version | Author | Date |
|---|---|---|
| e469ce4 | mluetge | 2022-11-29 |
| Version | Author | Date |
|---|---|---|
| e469ce4 | mluetge | 2022-11-29 |
| Version | Author | Date |
|---|---|---|
| e469ce4 | mluetge | 2022-11-29 |
| Version | Author | Date |
|---|---|---|
| e469ce4 | mluetge | 2022-11-29 |
| Version | Author | Date |
|---|---|---|
| e469ce4 | mluetge | 2022-11-29 |
| Version | Author | Date |
|---|---|---|
| e469ce4 | mluetge | 2022-11-29 |
| Version | Author | Date |
|---|---|---|
| e469ce4 | mluetge | 2022-11-29 |
| Version | Author | Date |
|---|---|---|
| e469ce4 | mluetge | 2022-11-29 |
| Version | Author | Date |
|---|---|---|
| e469ce4 | mluetge | 2022-11-29 |
| Version | Author | Date |
|---|---|---|
| e469ce4 | mluetge | 2022-11-29 |
| Version | Author | Date |
|---|---|---|
| e469ce4 | mluetge | 2022-11-29 |
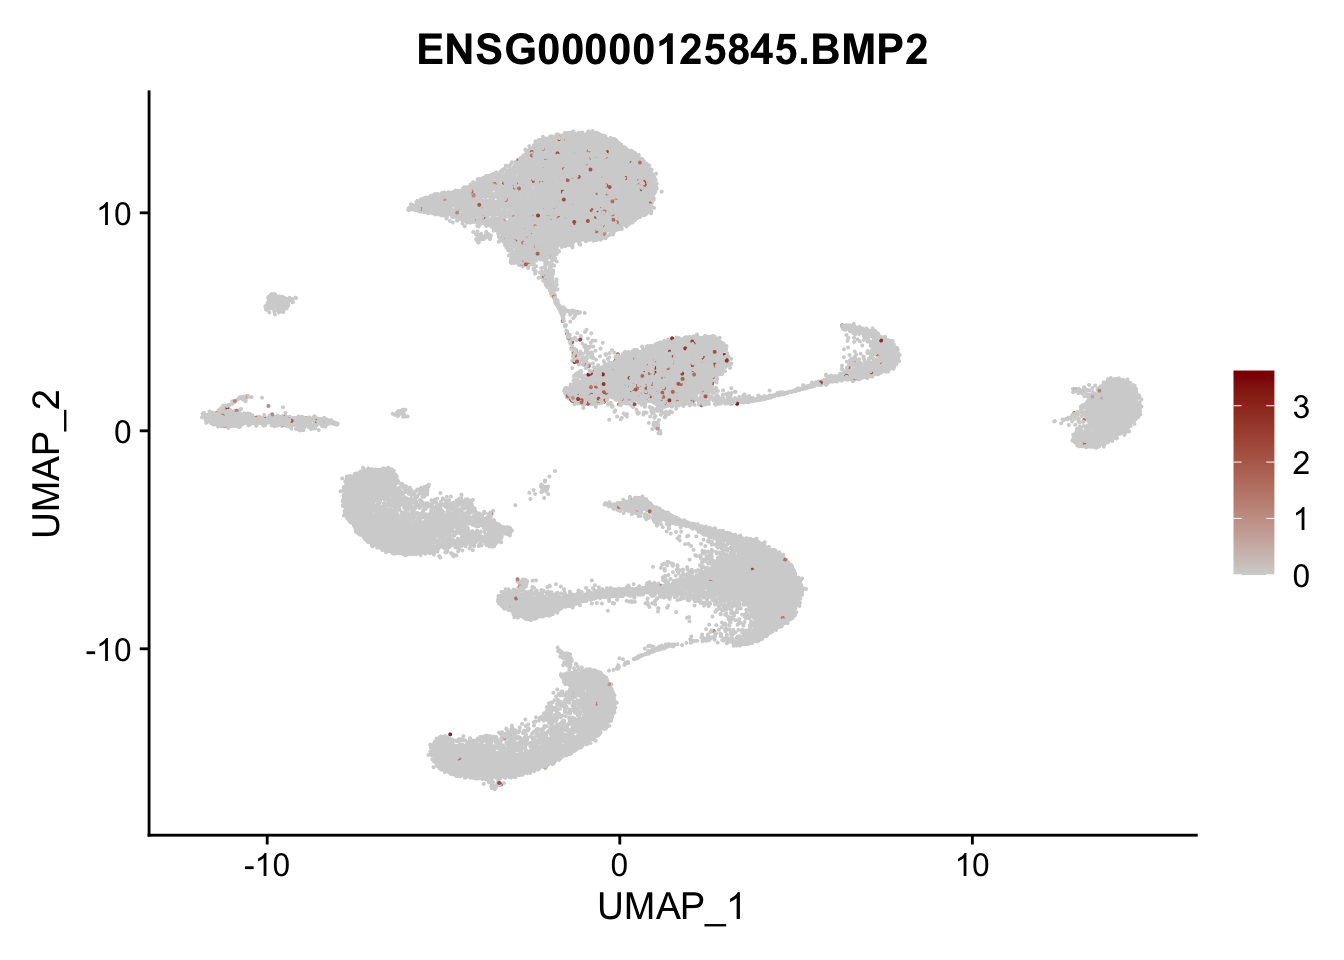
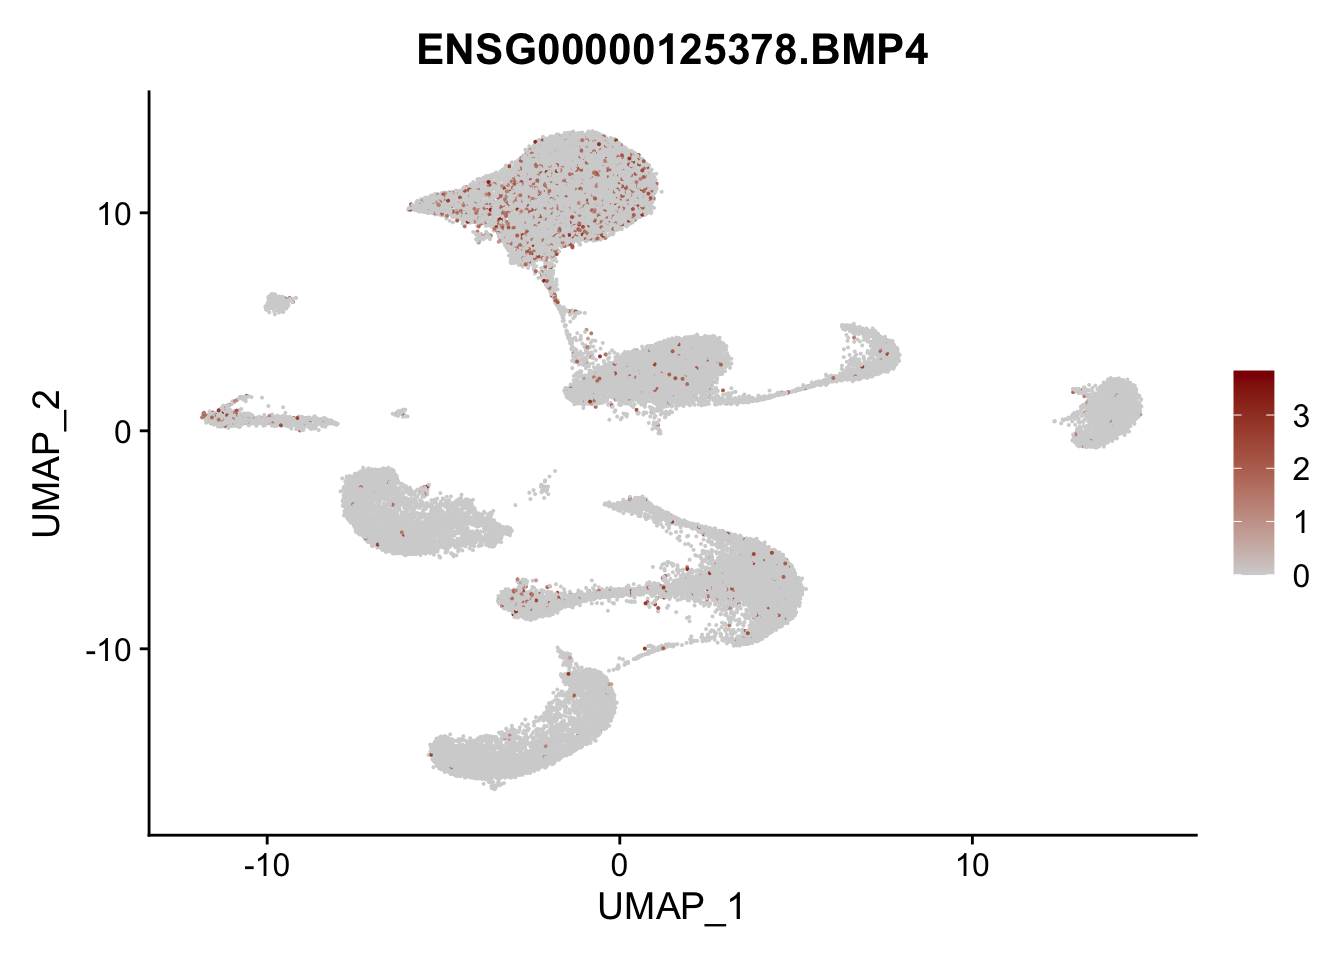
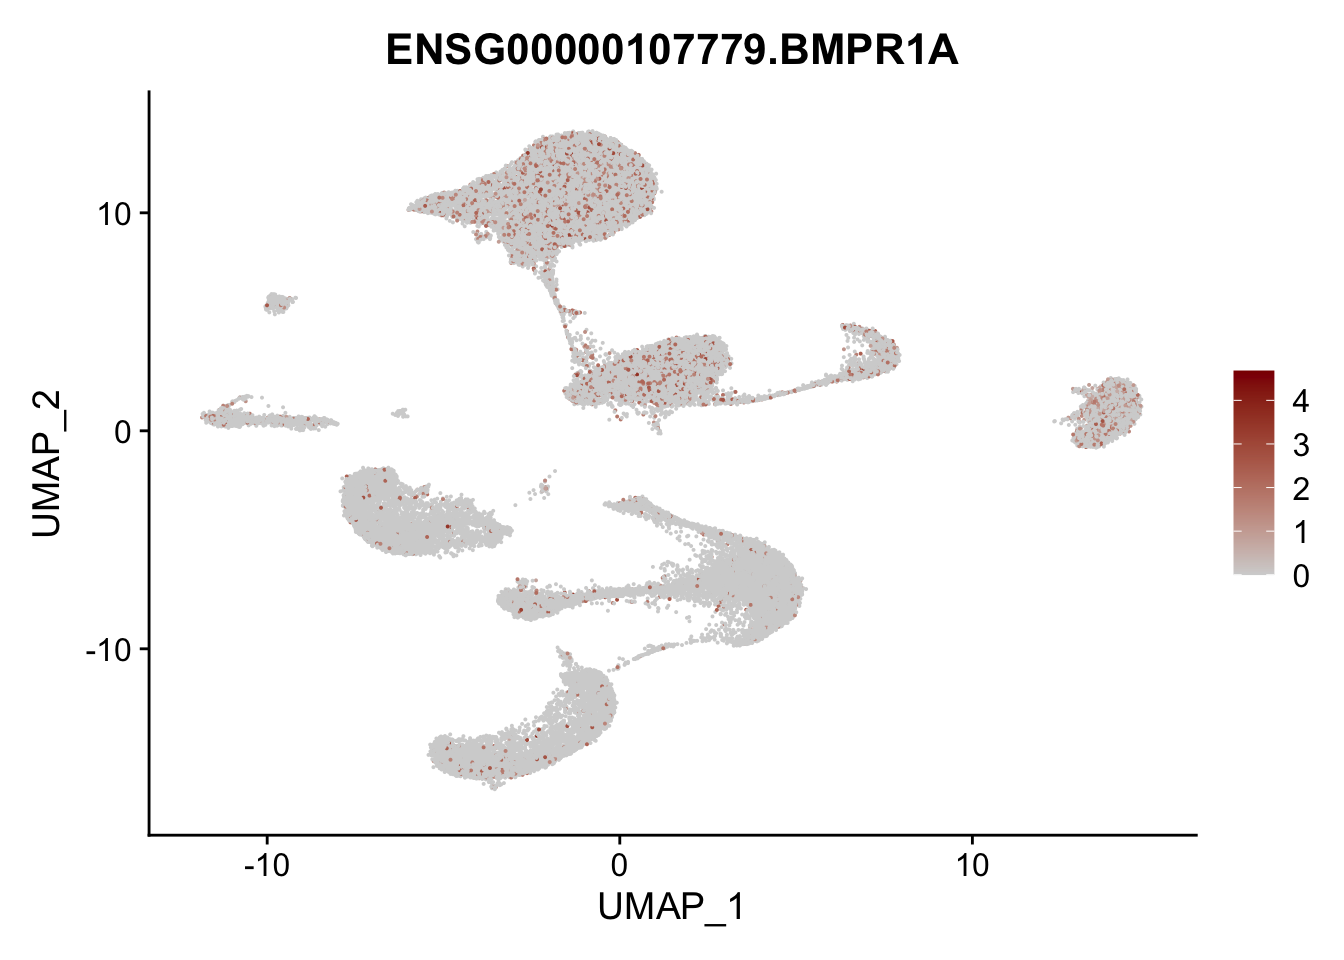
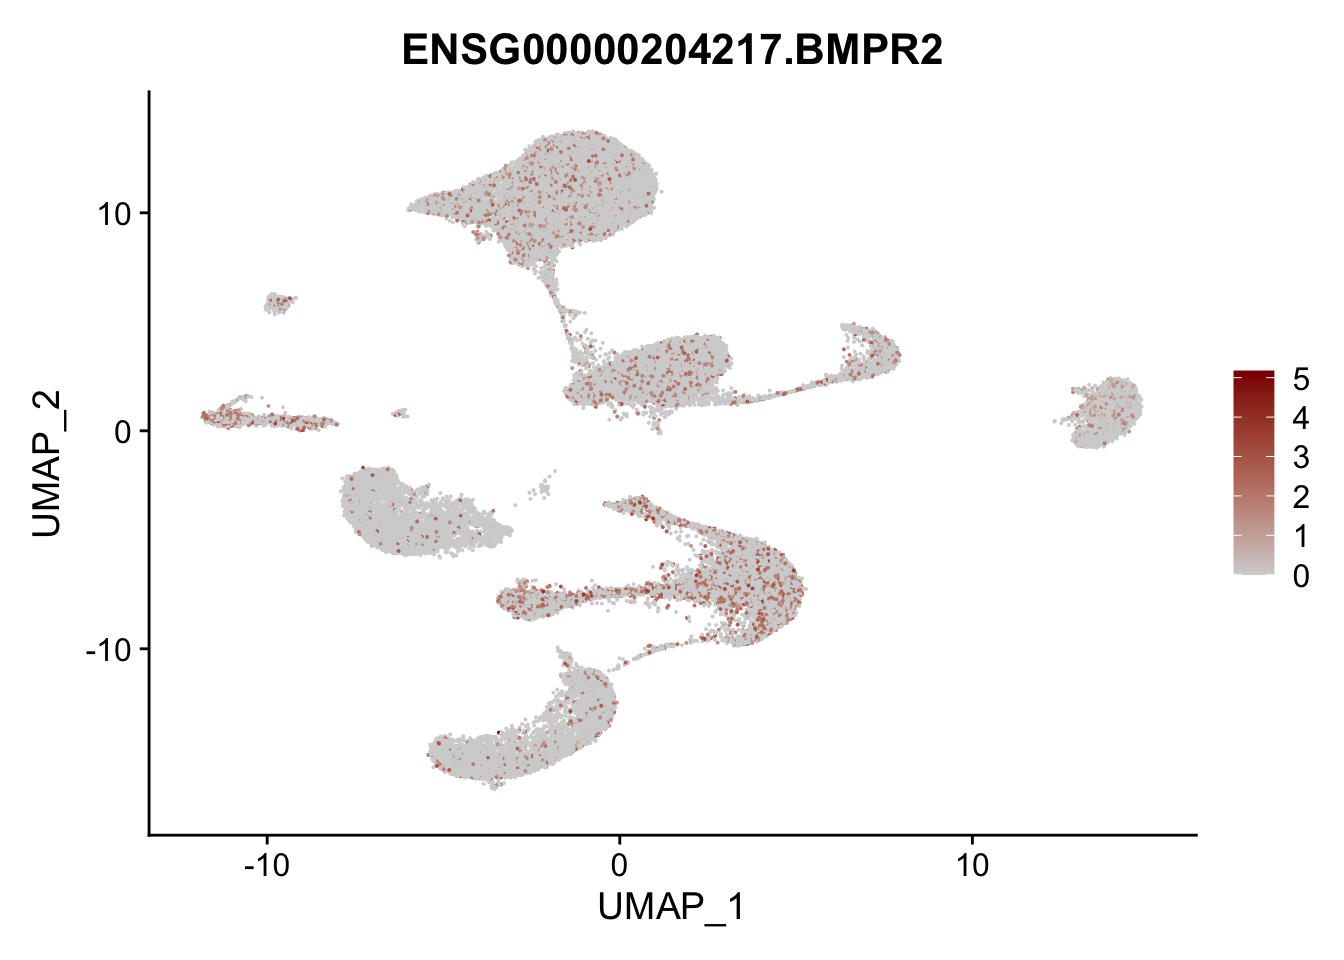
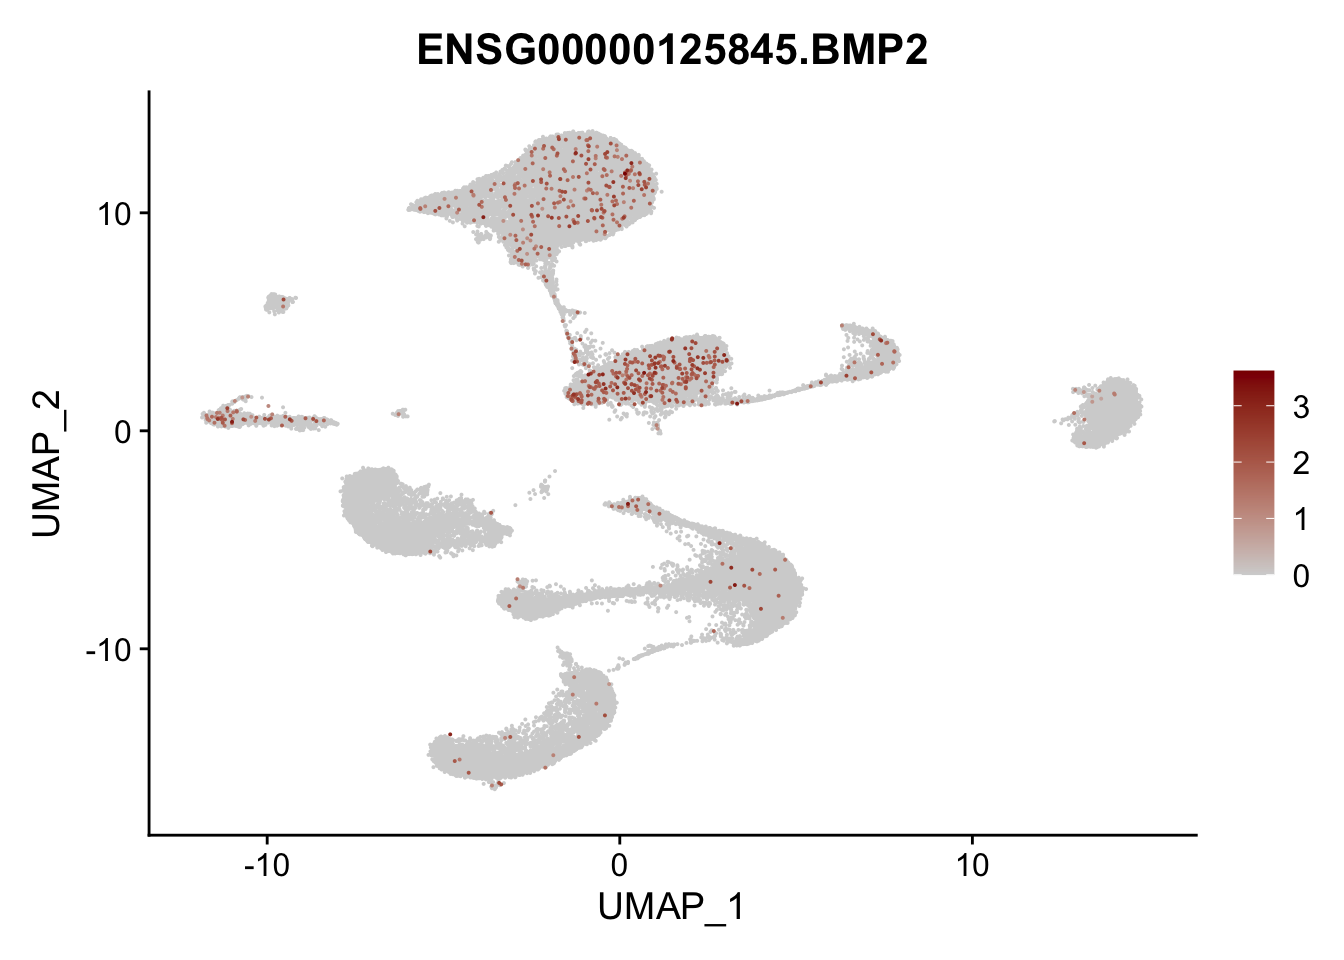
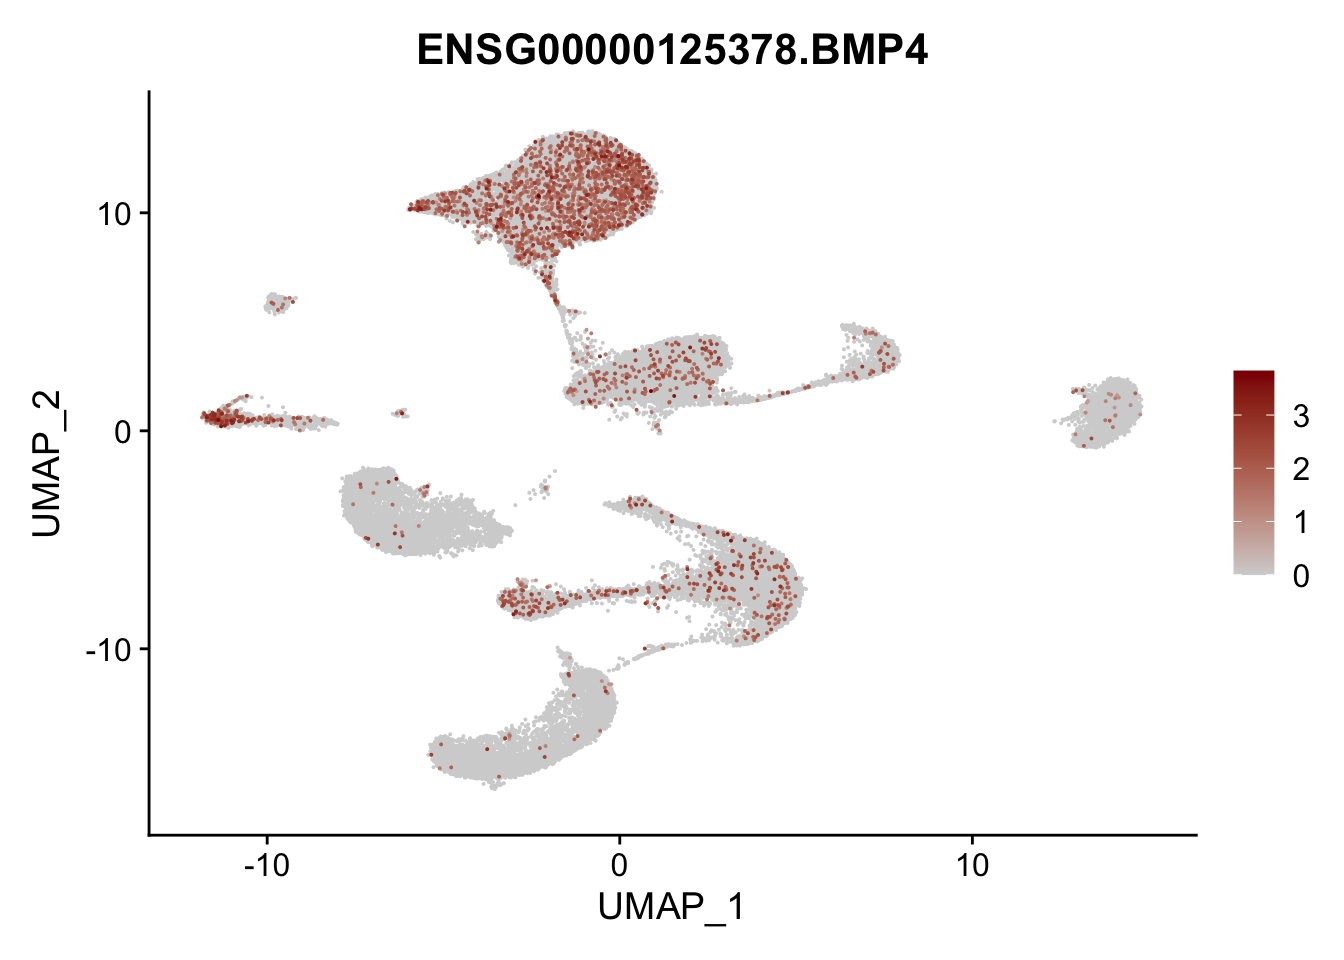
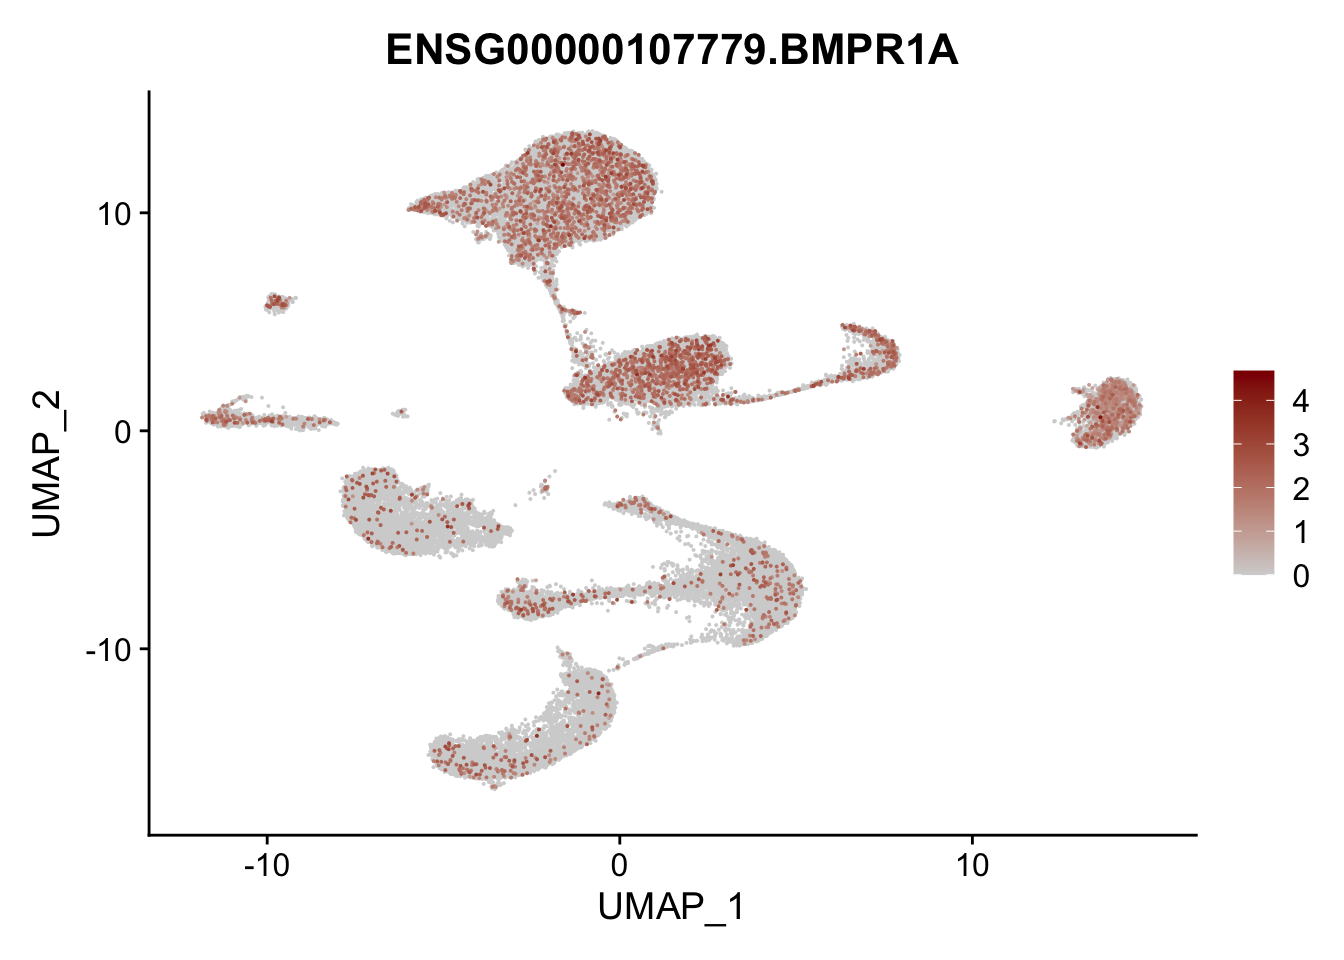
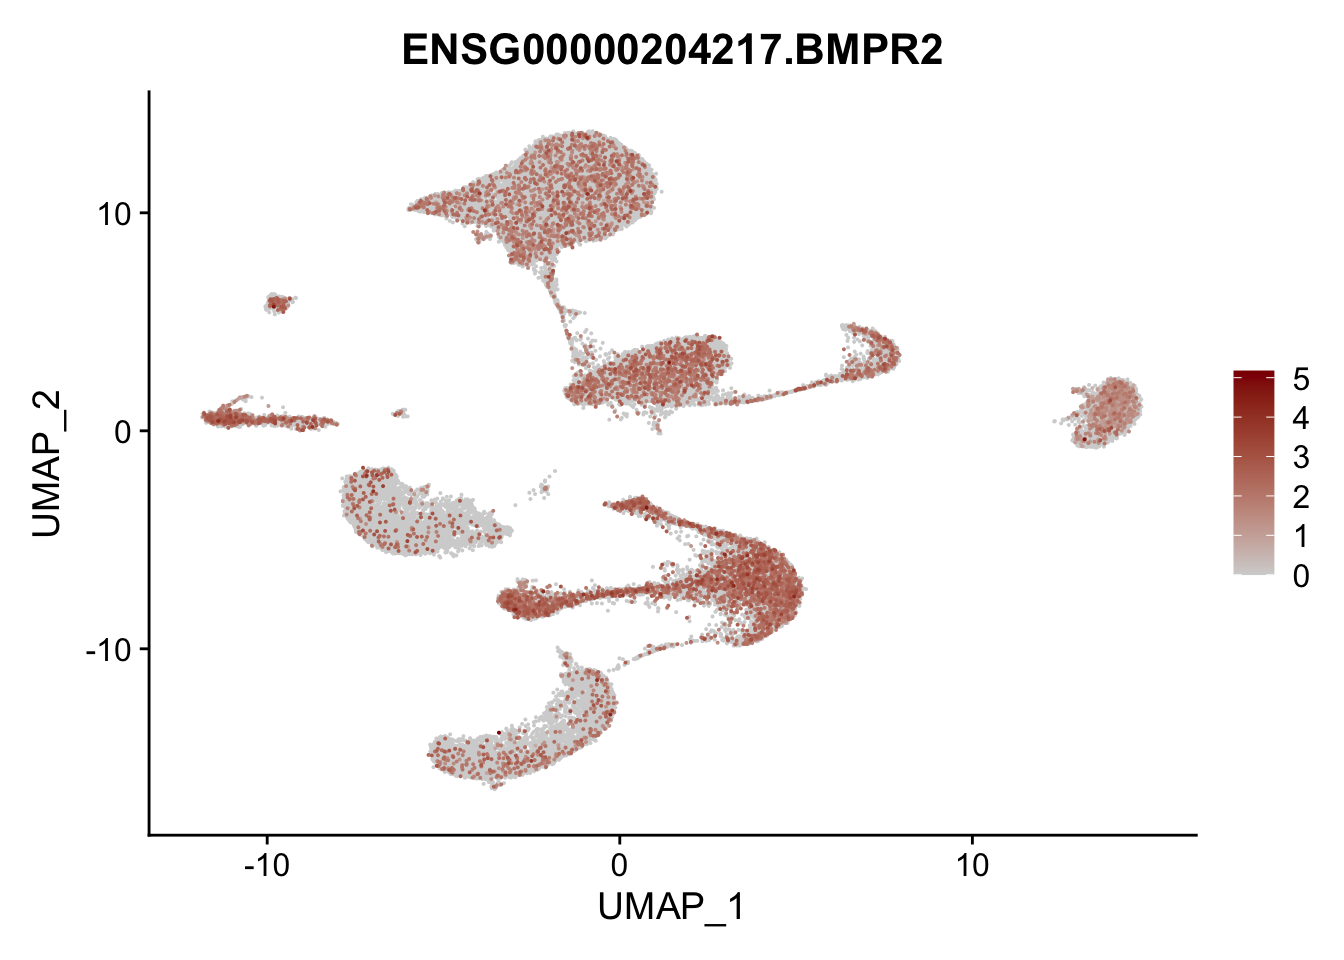
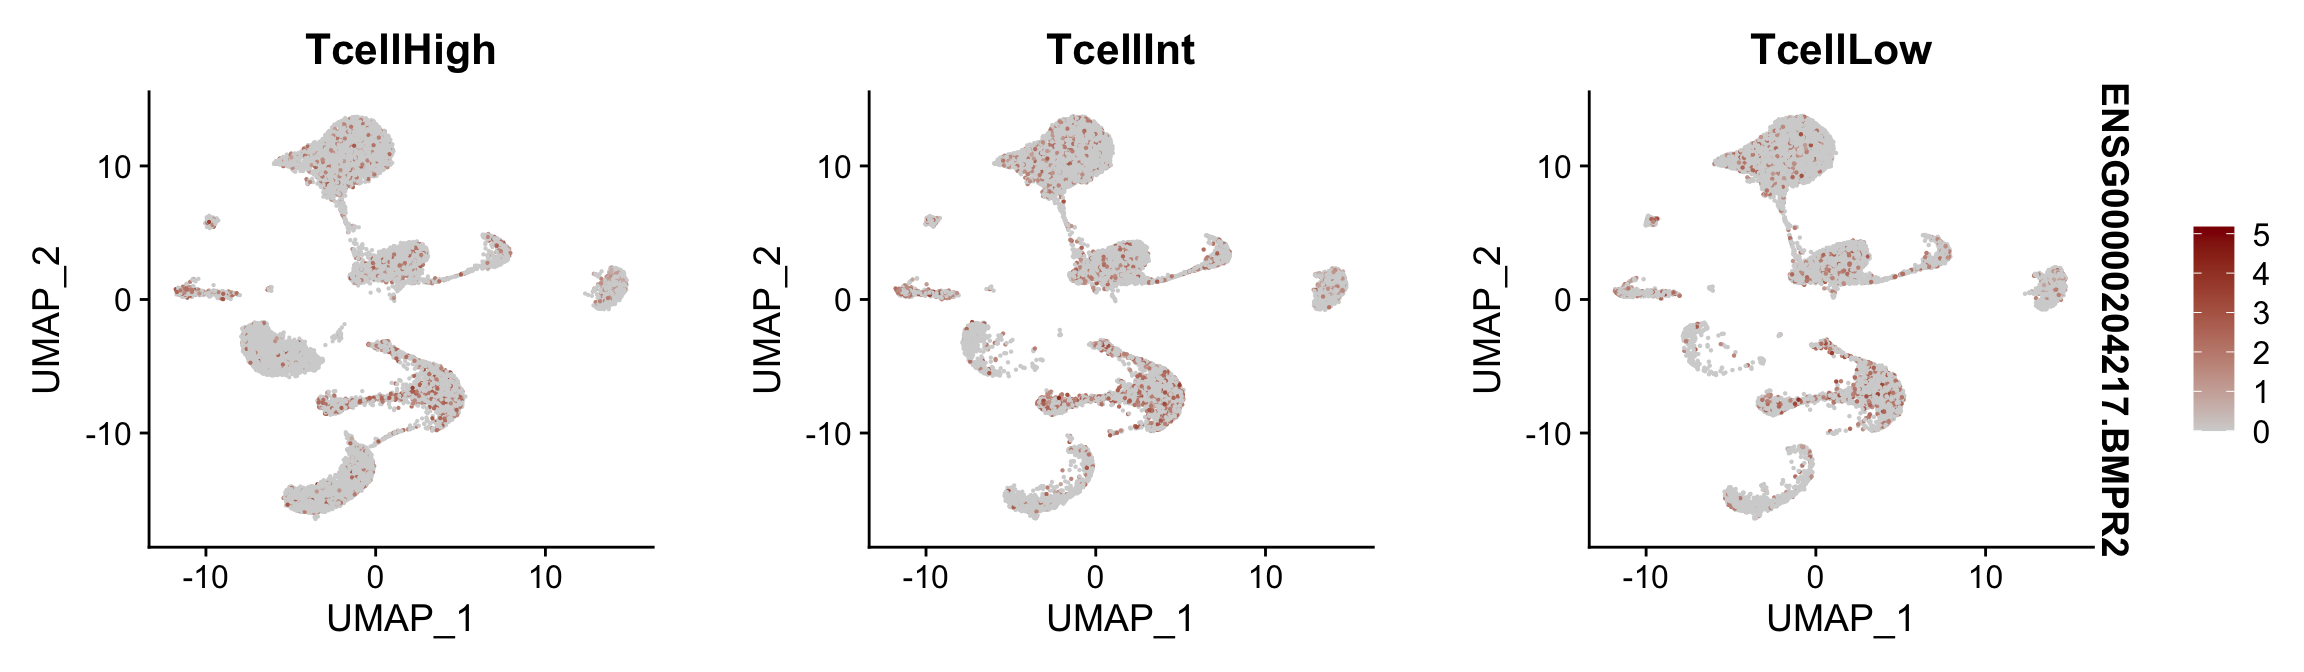
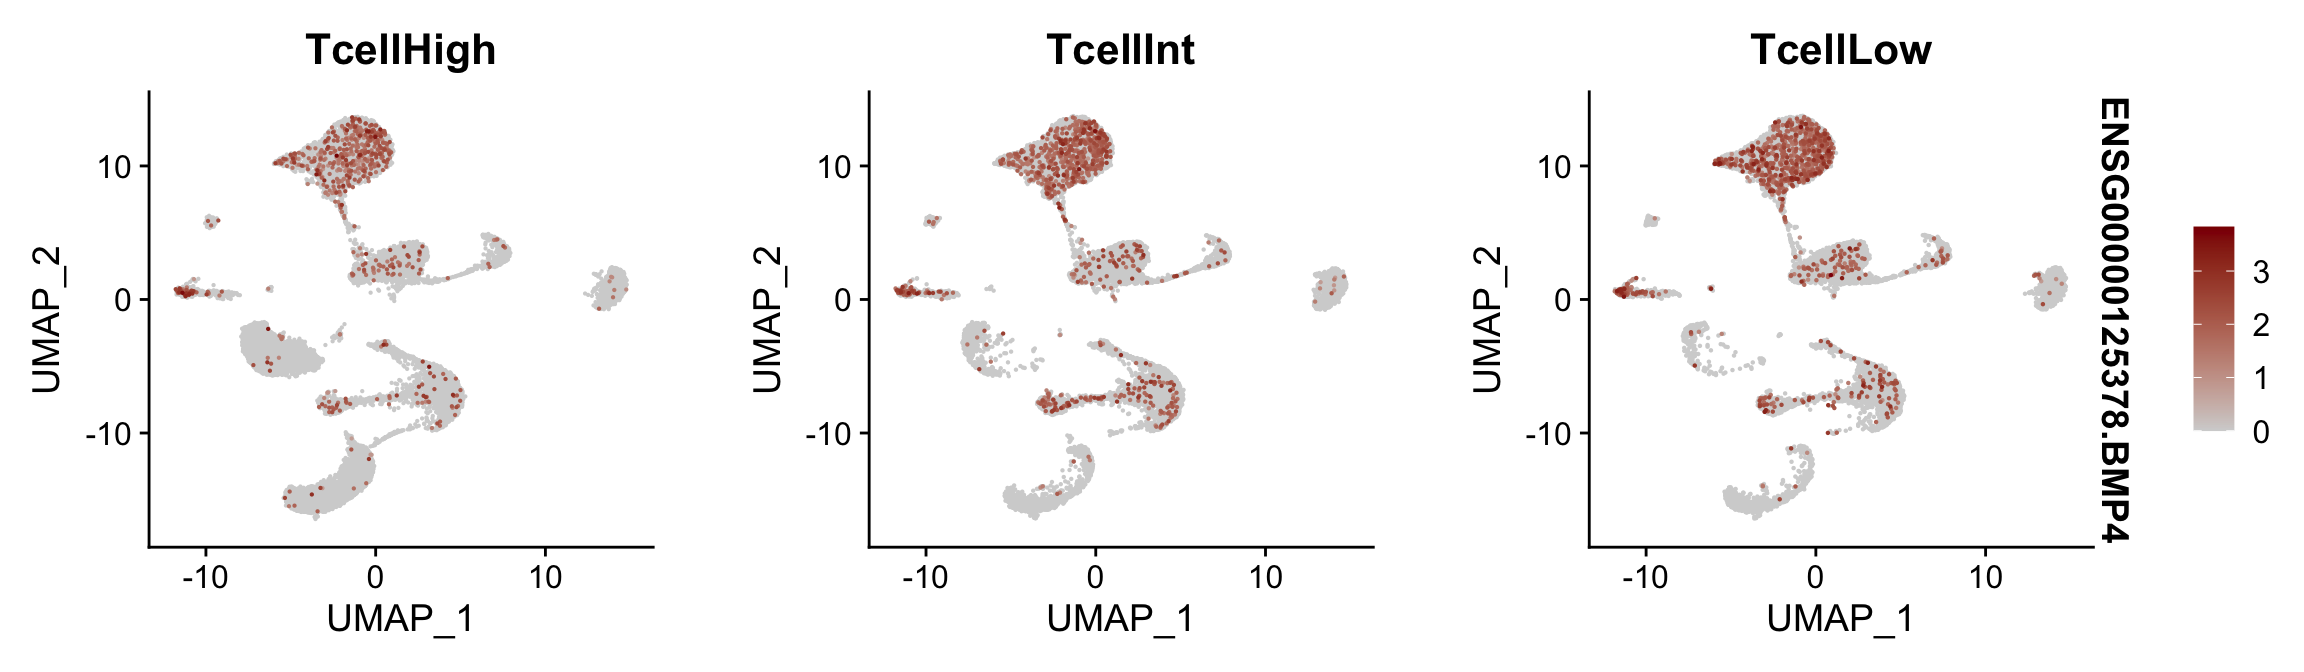
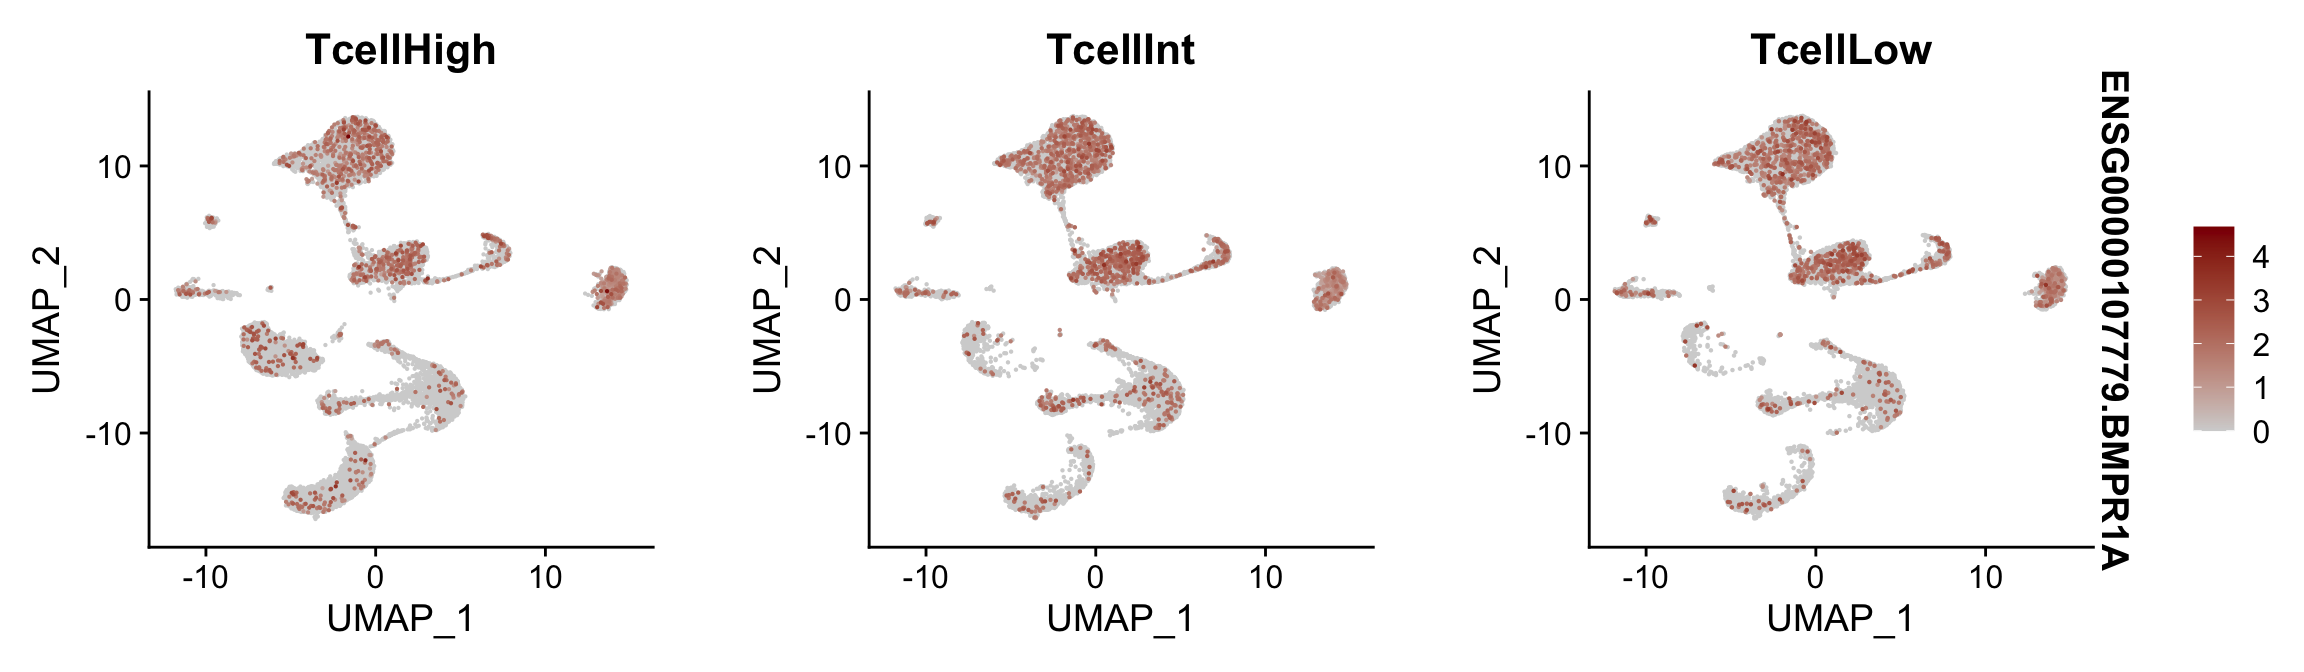
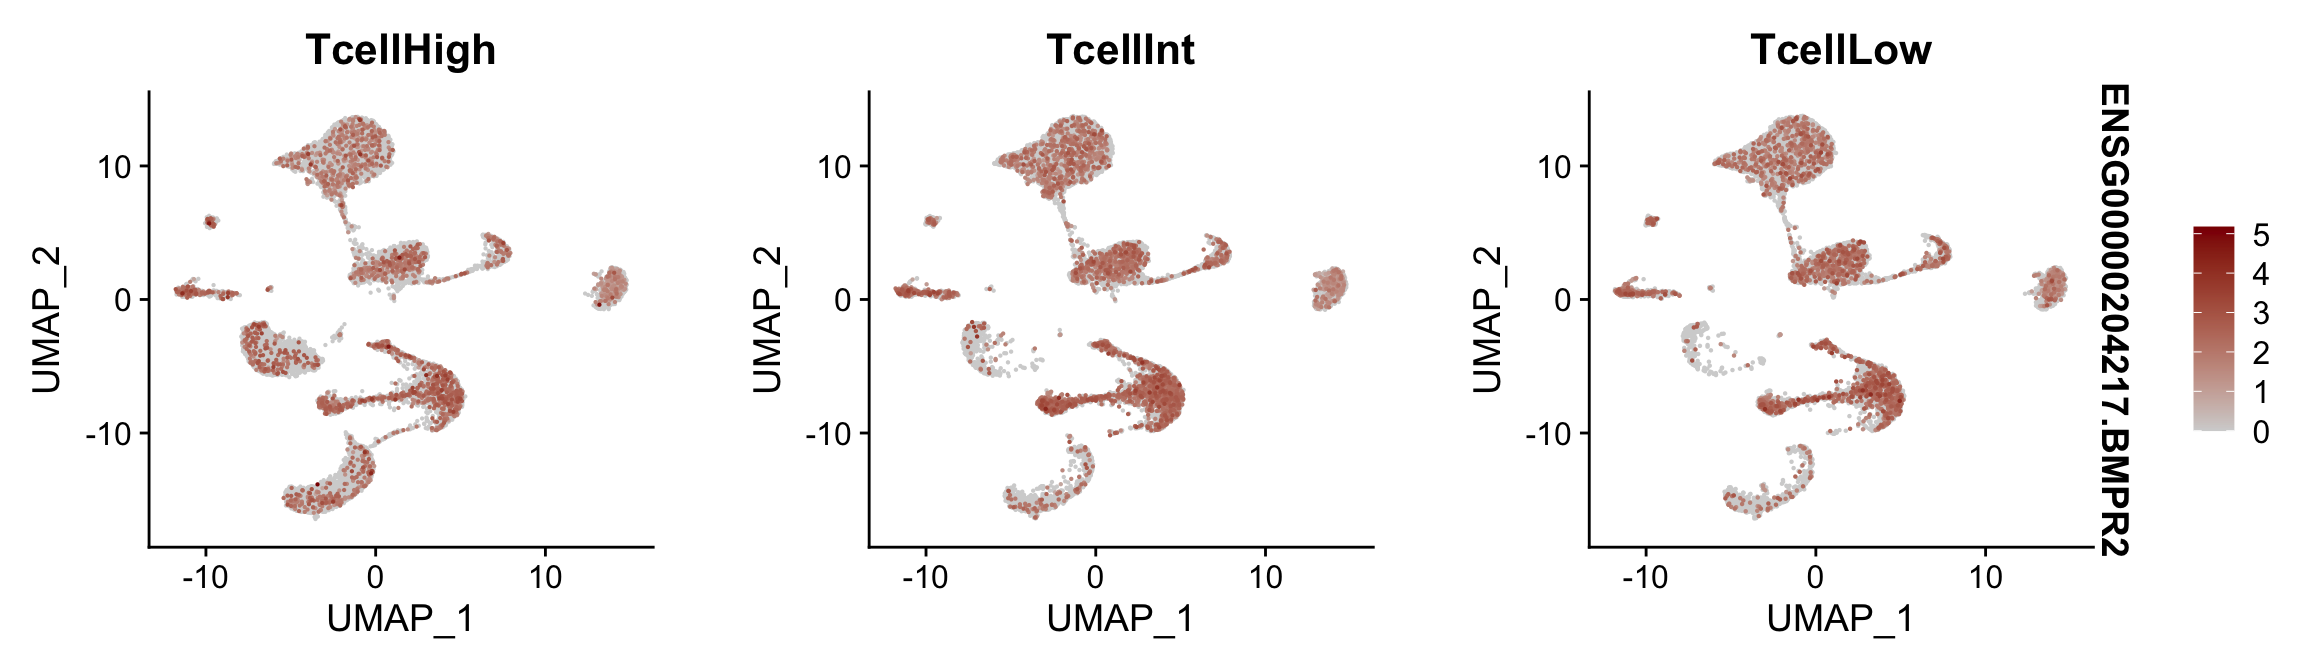
Feature plots BMPs
## list with all gene names for mapping of EnsIDs
genesDat <- data.frame(EnsID=rownames(seurat)) %>%
  mutate(gene=gsub(".*\\.", "", EnsID))

## selected genes to plot
selGenes <- data.frame(gene=c("BMP2", "BMP4", "BMPR1A", "BMPR2")) %>%
  left_join(., genesDat, by="gene")

## plotting loop order=F
pList <- sapply(selGenes$EnsID, function(x){
p <- FeaturePlot(seurat, reduction = "umap",
            features = x,
            cols=c("lightgrey", "darkred"),
            order = F)+
  theme(legend.position="right")
  plot(p)
})
| Version | Author | Date |
|---|---|---|
| e469ce4 | mluetge | 2022-11-29 |
| Version | Author | Date |
|---|---|---|
| e469ce4 | mluetge | 2022-11-29 |
| Version | Author | Date |
|---|---|---|
| e469ce4 | mluetge | 2022-11-29 |
| Version | Author | Date |
|---|---|---|
| e469ce4 | mluetge | 2022-11-29 |
## plotting loop order=T
pList <- sapply(selGenes$EnsID, function(x){
p <- FeaturePlot(seurat, reduction = "umap",
            features = x,
            cols=c("lightgrey", "darkred"),
            order = T)+
  theme(legend.position="right")
  plot(p)
})
| Version | Author | Date |
|---|---|---|
| e469ce4 | mluetge | 2022-11-29 |
| Version | Author | Date |
|---|---|---|
| e469ce4 | mluetge | 2022-11-29 |
| Version | Author | Date |
|---|---|---|
| e469ce4 | mluetge | 2022-11-29 |
| Version | Author | Date |
|---|---|---|
| e469ce4 | mluetge | 2022-11-29 |
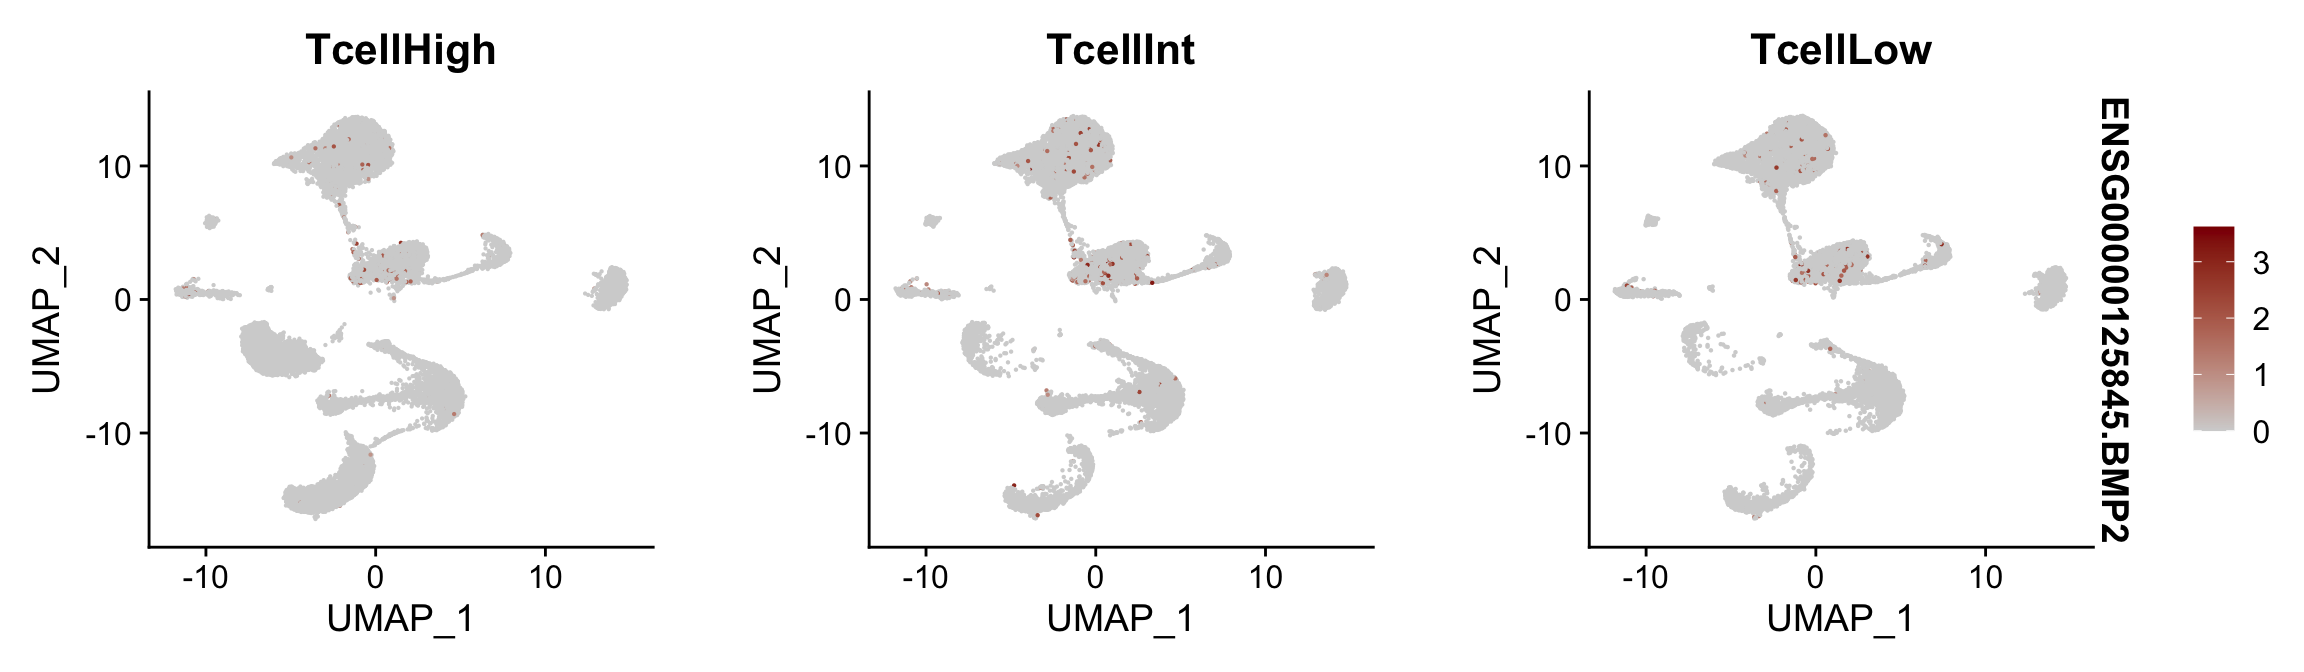
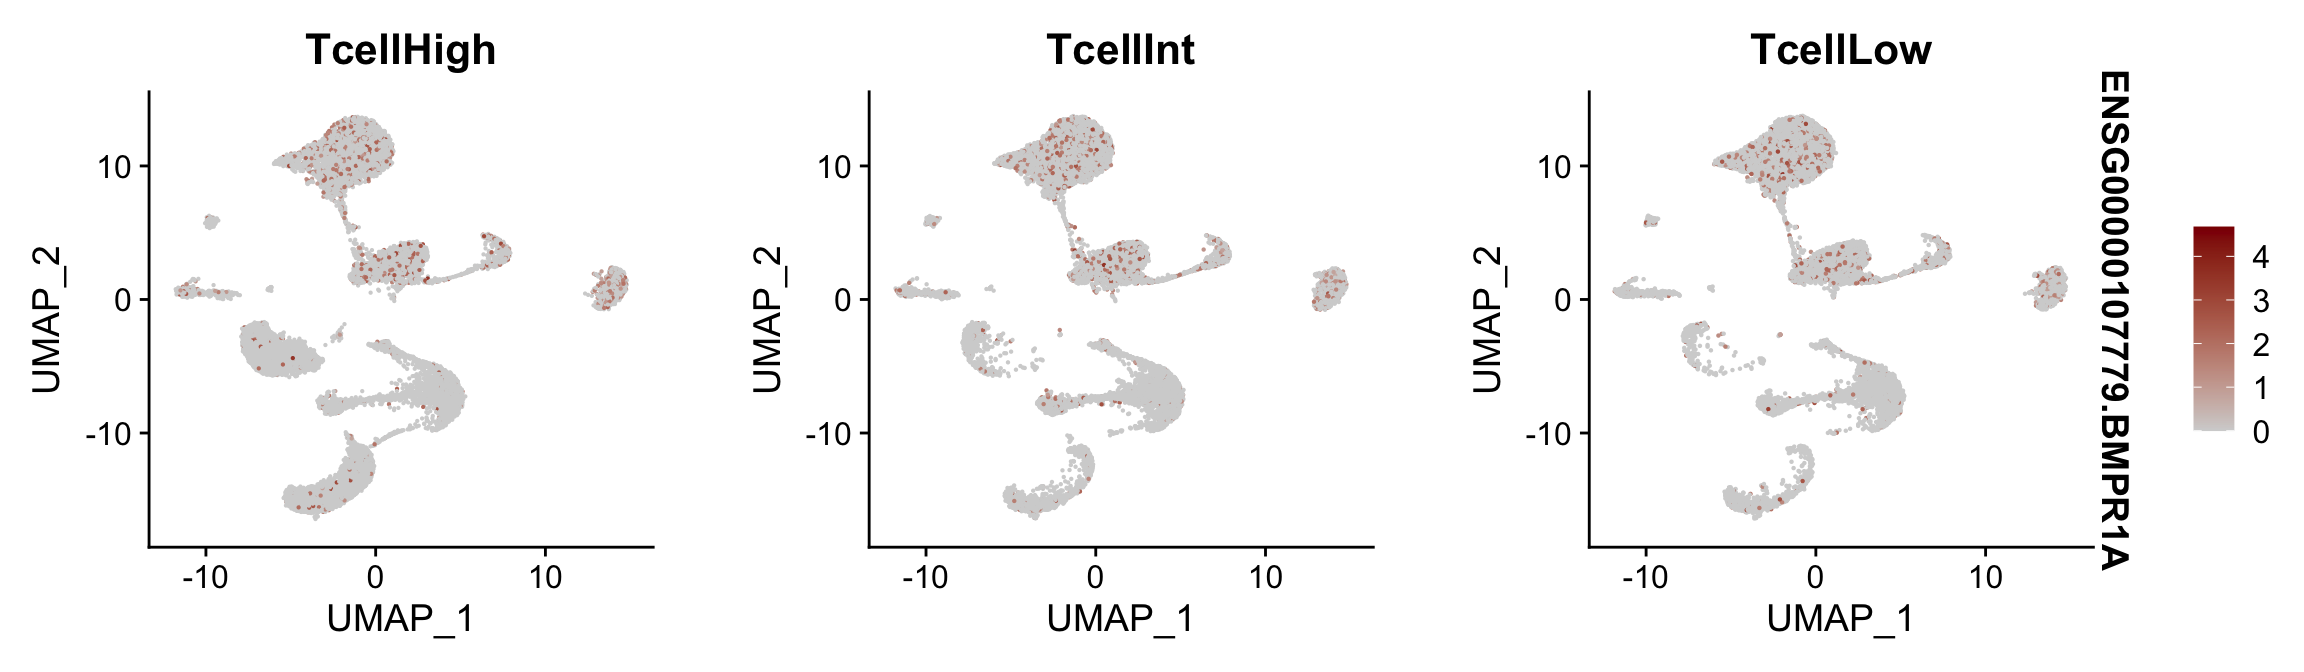
Feature plots BMPs split by TcellGrp
## plotting loop order=F
pList <- sapply(selGenes$EnsID, function(x){
p <- FeaturePlot(seurat, reduction = "umap",
            features = x,
            cols=c("lightgrey", "darkred"),
            order = F,
            split.by = "TcellGrp")+
  theme(legend.position="right")
  plot(p)
})

## plotting loop order=T
pList <- sapply(selGenes$EnsID, function(x){
p <- FeaturePlot(seurat, reduction = "umap",
            features = x,
            cols=c("lightgrey", "darkred"),
            order = T,
            split.by = "TcellGrp")+
  theme(legend.position="right")
  plot(p)
})
average counts BMPs in Fibroblasts
seuratSub <- subset(seurat, label=="Fibroblast")

## assay data
clusterAssigned <- as.data.frame(seuratSub$ID) %>%
  dplyr::mutate(cell=rownames(.))
colnames(clusterAssigned)[1] <- "ident"
seuratDat <- GetAssayData(seuratSub)

  ## genes of interest
genes <- data.frame(gene=rownames(seuratSub)) %>%
  mutate(geneID=gsub("^.*\\.", "", gene)) %>% filter(geneID %in% selGenes$gene)

  ## matrix with averaged cnts per ident
logNormExpres <- as.data.frame(t(as.matrix(
  seuratDat[which(rownames(seuratDat) %in% genes$gene),])))
logNormExpres <- logNormExpres %>% dplyr::mutate(cell=rownames(.)) %>%
  dplyr::left_join(.,clusterAssigned, by=c("cell")) %>%
  dplyr::select(-cell) %>% dplyr::group_by(ident) %>%
  dplyr::summarise_all(mean)

write.table(logNormExpres,
            file=paste0(basedir, "/data/BmpCntsFibroblastsPerPatient_woHH.txt"),
            row.names = F, col.names = T, sep = "\t", quote = F)
save seurat object
saveRDS(seurat, file = paste0(basedir,
                              "/data/humanHeartsPlusGraz_intPatients_merged",
                              "labeled_woHH_seurat.rds"))
session info
sessionInfo()R version 4.2.1 (2022-06-23)
Platform: x86_64-apple-darwin17.0 (64-bit)
Running under: macOS Big Sur ... 10.16
Matrix products: default
BLAS: /Library/Frameworks/R.framework/Versions/4.2/Resources/lib/libRblas.0.dylib
LAPACK: /Library/Frameworks/R.framework/Versions/4.2/Resources/lib/libRlapack.dylib
locale:
[1] en_US.UTF-8/en_US.UTF-8/en_US.UTF-8/C/en_US.UTF-8/en_US.UTF-8
attached base packages:
[1] stats4 stats graphics grDevices utils datasets methods
[8] base
other attached packages:
[1] sctransform_0.3.5 viridis_0.6.2
[3] viridisLite_0.4.1 pheatmap_1.0.12
[5] ggpubr_0.4.0 ggsci_2.9
[7] runSeurat3_0.1.0 here_1.0.1
[9] magrittr_2.0.3 sp_1.5-0
[11] SeuratObject_4.1.2 Seurat_4.2.0
[13] forcats_0.5.2 stringr_1.4.1
[15] dplyr_1.0.10 purrr_0.3.5
[17] readr_2.1.3 tidyr_1.2.1
[19] tibble_3.1.8 ggplot2_3.3.6
[21] tidyverse_1.3.2 SingleCellExperiment_1.18.1
[23] SummarizedExperiment_1.26.1 Biobase_2.56.0
[25] GenomicRanges_1.48.0 GenomeInfoDb_1.32.4
[27] IRanges_2.30.1 S4Vectors_0.34.0
[29] BiocGenerics_0.42.0 MatrixGenerics_1.8.1
[31] matrixStats_0.62.0
loaded via a namespace (and not attached):
[1] utf8_1.2.2 reticulate_1.26 tidyselect_1.2.0
[4] htmlwidgets_1.5.4 grid_4.2.1 Rtsne_0.16
[7] munsell_0.5.0 codetools_0.2-18 ica_1.0-3
[10] future_1.28.0 miniUI_0.1.1.1 withr_2.5.0
[13] spatstat.random_2.2-0 colorspace_2.0-3 progressr_0.11.0
[16] highr_0.9 knitr_1.40 rstudioapi_0.14
[19] ROCR_1.0-11 ggsignif_0.6.4 tensor_1.5
[22] listenv_0.8.0 labeling_0.4.2 git2r_0.30.1
[25] GenomeInfoDbData_1.2.8 polyclip_1.10-4 bit64_4.0.5
[28] farver_2.1.1 rprojroot_2.0.3 parallelly_1.32.1
[31] vctrs_0.5.0 generics_0.1.3 xfun_0.34
[34] R6_2.5.1 ggbeeswarm_0.6.0 bitops_1.0-7
[37] spatstat.utils_3.0-1 cachem_1.0.6 DelayedArray_0.22.0
[40] assertthat_0.2.1 vroom_1.6.0 promises_1.2.0.1
[43] scales_1.2.1 googlesheets4_1.0.1 beeswarm_0.4.0
[46] rgeos_0.5-9 gtable_0.3.1 globals_0.16.1
[49] goftest_1.2-3 workflowr_1.7.0 rlang_1.0.6
[52] splines_4.2.1 rstatix_0.7.0 lazyeval_0.2.2
[55] gargle_1.2.1 spatstat.geom_2.4-0 broom_1.0.1
[58] yaml_2.3.6 reshape2_1.4.4 abind_1.4-5
[61] modelr_0.1.9 backports_1.4.1 httpuv_1.6.6
[64] tools_4.2.1 ellipsis_0.3.2 spatstat.core_2.4-4
[67] jquerylib_0.1.4 RColorBrewer_1.1-3 ggridges_0.5.4
[70] Rcpp_1.0.9 plyr_1.8.7 zlibbioc_1.42.0
[73] RCurl_1.98-1.9 rpart_4.1.19 deldir_1.0-6
[76] pbapply_1.5-0 cowplot_1.1.1 zoo_1.8-11
[79] haven_2.5.1 ggrepel_0.9.1 cluster_2.1.4
[82] fs_1.5.2 data.table_1.14.4 scattermore_0.8
[85] lmtest_0.9-40 reprex_2.0.2 RANN_2.6.1
[88] googledrive_2.0.0 whisker_0.4 fitdistrplus_1.1-8
[91] hms_1.1.2 patchwork_1.1.2 mime_0.12
[94] evaluate_0.17 xtable_1.8-4 readxl_1.4.1
[97] gridExtra_2.3 compiler_4.2.1 KernSmooth_2.23-20
[100] crayon_1.5.2 htmltools_0.5.3 mgcv_1.8-41
[103] later_1.3.0 tzdb_0.3.0 lubridate_1.8.0
[106] DBI_1.1.3 dbplyr_2.2.1 MASS_7.3-58.1
[109] Matrix_1.5-1 car_3.1-1 cli_3.4.1
[112] parallel_4.2.1 igraph_1.3.5 pkgconfig_2.0.3
[115] plotly_4.10.0 spatstat.sparse_3.0-0 xml2_1.3.3
[118] vipor_0.4.5 bslib_0.4.0 XVector_0.36.0
[121] rvest_1.0.3 digest_0.6.30 RcppAnnoy_0.0.19
[124] spatstat.data_3.0-0 rmarkdown_2.17 cellranger_1.1.0
[127] leiden_0.4.3 uwot_0.1.14 shiny_1.7.2
[130] lifecycle_1.0.3 nlme_3.1-160 jsonlite_1.8.3
[133] carData_3.0-5 fansi_1.0.3 pillar_1.8.1
[136] lattice_0.20-45 ggrastr_1.0.1 fastmap_1.1.0
[139] httr_1.4.4 survival_3.4-0 glue_1.6.2
[142] png_0.1-7 bit_4.0.4 stringi_1.7.8
[145] sass_0.4.2 irlba_2.3.5.1 future.apply_1.9.1 date()[1] "Fri Dec 2 11:27:12 2022"
sessionInfo()R version 4.2.1 (2022-06-23)
Platform: x86_64-apple-darwin17.0 (64-bit)
Running under: macOS Big Sur ... 10.16
Matrix products: default
BLAS: /Library/Frameworks/R.framework/Versions/4.2/Resources/lib/libRblas.0.dylib
LAPACK: /Library/Frameworks/R.framework/Versions/4.2/Resources/lib/libRlapack.dylib
locale:
[1] en_US.UTF-8/en_US.UTF-8/en_US.UTF-8/C/en_US.UTF-8/en_US.UTF-8
attached base packages:
[1] stats4 stats graphics grDevices utils datasets methods
[8] base
other attached packages:
[1] sctransform_0.3.5 viridis_0.6.2
[3] viridisLite_0.4.1 pheatmap_1.0.12
[5] ggpubr_0.4.0 ggsci_2.9
[7] runSeurat3_0.1.0 here_1.0.1
[9] magrittr_2.0.3 sp_1.5-0
[11] SeuratObject_4.1.2 Seurat_4.2.0
[13] forcats_0.5.2 stringr_1.4.1
[15] dplyr_1.0.10 purrr_0.3.5
[17] readr_2.1.3 tidyr_1.2.1
[19] tibble_3.1.8 ggplot2_3.3.6
[21] tidyverse_1.3.2 SingleCellExperiment_1.18.1
[23] SummarizedExperiment_1.26.1 Biobase_2.56.0
[25] GenomicRanges_1.48.0 GenomeInfoDb_1.32.4
[27] IRanges_2.30.1 S4Vectors_0.34.0
[29] BiocGenerics_0.42.0 MatrixGenerics_1.8.1
[31] matrixStats_0.62.0
loaded via a namespace (and not attached):
[1] utf8_1.2.2 reticulate_1.26 tidyselect_1.2.0
[4] htmlwidgets_1.5.4 grid_4.2.1 Rtsne_0.16
[7] munsell_0.5.0 codetools_0.2-18 ica_1.0-3
[10] future_1.28.0 miniUI_0.1.1.1 withr_2.5.0
[13] spatstat.random_2.2-0 colorspace_2.0-3 progressr_0.11.0
[16] highr_0.9 knitr_1.40 rstudioapi_0.14
[19] ROCR_1.0-11 ggsignif_0.6.4 tensor_1.5
[22] listenv_0.8.0 labeling_0.4.2 git2r_0.30.1
[25] GenomeInfoDbData_1.2.8 polyclip_1.10-4 bit64_4.0.5
[28] farver_2.1.1 rprojroot_2.0.3 parallelly_1.32.1
[31] vctrs_0.5.0 generics_0.1.3 xfun_0.34
[34] R6_2.5.1 ggbeeswarm_0.6.0 bitops_1.0-7
[37] spatstat.utils_3.0-1 cachem_1.0.6 DelayedArray_0.22.0
[40] assertthat_0.2.1 vroom_1.6.0 promises_1.2.0.1
[43] scales_1.2.1 googlesheets4_1.0.1 beeswarm_0.4.0
[46] rgeos_0.5-9 gtable_0.3.1 globals_0.16.1
[49] goftest_1.2-3 workflowr_1.7.0 rlang_1.0.6
[52] splines_4.2.1 rstatix_0.7.0 lazyeval_0.2.2
[55] gargle_1.2.1 spatstat.geom_2.4-0 broom_1.0.1
[58] yaml_2.3.6 reshape2_1.4.4 abind_1.4-5
[61] modelr_0.1.9 backports_1.4.1 httpuv_1.6.6
[64] tools_4.2.1 ellipsis_0.3.2 spatstat.core_2.4-4
[67] jquerylib_0.1.4 RColorBrewer_1.1-3 ggridges_0.5.4
[70] Rcpp_1.0.9 plyr_1.8.7 zlibbioc_1.42.0
[73] RCurl_1.98-1.9 rpart_4.1.19 deldir_1.0-6
[76] pbapply_1.5-0 cowplot_1.1.1 zoo_1.8-11
[79] haven_2.5.1 ggrepel_0.9.1 cluster_2.1.4
[82] fs_1.5.2 data.table_1.14.4 scattermore_0.8
[85] lmtest_0.9-40 reprex_2.0.2 RANN_2.6.1
[88] googledrive_2.0.0 whisker_0.4 fitdistrplus_1.1-8
[91] hms_1.1.2 patchwork_1.1.2 mime_0.12
[94] evaluate_0.17 xtable_1.8-4 readxl_1.4.1
[97] gridExtra_2.3 compiler_4.2.1 KernSmooth_2.23-20
[100] crayon_1.5.2 htmltools_0.5.3 mgcv_1.8-41
[103] later_1.3.0 tzdb_0.3.0 lubridate_1.8.0
[106] DBI_1.1.3 dbplyr_2.2.1 MASS_7.3-58.1
[109] Matrix_1.5-1 car_3.1-1 cli_3.4.1
[112] parallel_4.2.1 igraph_1.3.5 pkgconfig_2.0.3
[115] plotly_4.10.0 spatstat.sparse_3.0-0 xml2_1.3.3
[118] vipor_0.4.5 bslib_0.4.0 XVector_0.36.0
[121] rvest_1.0.3 digest_0.6.30 RcppAnnoy_0.0.19
[124] spatstat.data_3.0-0 rmarkdown_2.17 cellranger_1.1.0
[127] leiden_0.4.3 uwot_0.1.14 shiny_1.7.2
[130] lifecycle_1.0.3 nlme_3.1-160 jsonlite_1.8.3
[133] carData_3.0-5 fansi_1.0.3 pillar_1.8.1
[136] lattice_0.20-45 ggrastr_1.0.1 fastmap_1.1.0
[139] httr_1.4.4 survival_3.4-0 glue_1.6.2
[142] png_0.1-7 bit_4.0.4 stringi_1.7.8
[145] sass_0.4.2 irlba_2.3.5.1 future.apply_1.9.1