DE genes between T cell groups
Mechthild Lütge
Dec 2022
Last updated: 2022-12-09
Checks: 6 1
Knit directory: humanCardiacFibroblasts/
This reproducible R Markdown analysis was created with workflowr (version 1.7.0). The Checks tab describes the reproducibility checks that were applied when the results were created. The Past versions tab lists the development history.
The R Markdown file has unstaged changes. To know which version of
the R Markdown file created these results, you’ll want to first commit
it to the Git repo. If you’re still working on the analysis, you can
ignore this warning. When you’re finished, you can run
wflow_publish to commit the R Markdown file and build the
HTML.
Great job! The global environment was empty. Objects defined in the global environment can affect the analysis in your R Markdown file in unknown ways. For reproduciblity it’s best to always run the code in an empty environment.
The command set.seed(20210903) was run prior to running
the code in the R Markdown file. Setting a seed ensures that any results
that rely on randomness, e.g. subsampling or permutations, are
reproducible.
Great job! Recording the operating system, R version, and package versions is critical for reproducibility.
Nice! There were no cached chunks for this analysis, so you can be confident that you successfully produced the results during this run.
Great job! Using relative paths to the files within your workflowr project makes it easier to run your code on other machines.
Great! You are using Git for version control. Tracking code development and connecting the code version to the results is critical for reproducibility.
The results in this page were generated with repository version 66c2208. See the Past versions tab to see a history of the changes made to the R Markdown and HTML files.
Note that you need to be careful to ensure that all relevant files for
the analysis have been committed to Git prior to generating the results
(you can use wflow_publish or
wflow_git_commit). workflowr only checks the R Markdown
file, but you know if there are other scripts or data files that it
depends on. Below is the status of the Git repository when the results
were generated:
Ignored files:
    Ignored:    .DS_Store
    Ignored:    .Rhistory
    Ignored:    .Rproj.user/
    Ignored:    data/GSEA/
    Ignored:    data/humanFibroblast/
    Ignored:    figure/DEgenesGZplusSG_Groups.Rmd/.DS_Store

Unstaged changes:
    Modified:   analysis/DEgenesTcellgrps.Rmd
    Modified:   analysis/assignLabelshumanHeartsPlusGrazIntWoHH.Rmd
    Modified:   analysis/projectSignatures.Rmd
    Modified:   figure/DEgenesTcellgrps.Rmd/avgHeat cwDE Adipocytes-1.pdf
    Modified:   figure/DEgenesTcellgrps.Rmd/avgHeat cwDE Adipocytes-1.png
    Modified:   figure/DEgenesTcellgrps.Rmd/avgHeat cwDE Cardiomyocyte-1.pdf
    Modified:   figure/DEgenesTcellgrps.Rmd/avgHeat cwDE Cardiomyocyte-1.png
    Modified:   figure/DEgenesTcellgrps.Rmd/avgHeat cwDE EndoEC-1.pdf
    Modified:   figure/DEgenesTcellgrps.Rmd/avgHeat cwDE EndoEC-1.png
    Modified:   figure/DEgenesTcellgrps.Rmd/avgHeat cwDE Endothelial-1.pdf
    Modified:   figure/DEgenesTcellgrps.Rmd/avgHeat cwDE Endothelial-1.png
    Modified:   figure/DEgenesTcellgrps.Rmd/avgHeat cwDE Fibroblast-1.pdf
    Modified:   figure/DEgenesTcellgrps.Rmd/avgHeat cwDE Fibroblast-1.png
    Modified:   figure/DEgenesTcellgrps.Rmd/avgHeat cwDE NeuralCells-1.pdf
    Modified:   figure/DEgenesTcellgrps.Rmd/avgHeat cwDE NeuralCells-1.png
    Modified:   figure/DEgenesTcellgrps.Rmd/avgHeat cwDE Perivascular-1.pdf
    Modified:   figure/DEgenesTcellgrps.Rmd/avgHeat cwDE Perivascular-1.png
    Modified:   figure/DEgenesTcellgrps.Rmd/avgHeat cwDE SMC-1.pdf
    Modified:   figure/DEgenesTcellgrps.Rmd/avgHeat cwDE SMC-1.png
    Modified:   figure/DEgenesTcellgrps.Rmd/avgHeat cwDE Tcell-1.pdf
    Modified:   figure/DEgenesTcellgrps.Rmd/avgHeat cwDE Tcell-1.png
    Modified:   figure/DEgenesTcellgrps.Rmd/avgHeat cwDE infMacrophage-1.pdf
    Modified:   figure/DEgenesTcellgrps.Rmd/avgHeat cwDE infMacrophage-1.png
    Modified:   figure/DEgenesTcellgrps.Rmd/avgHeat cwDE resMacrophage-1.pdf
    Modified:   figure/DEgenesTcellgrps.Rmd/avgHeat cwDE resMacrophage-1.png
Note that any generated files, e.g. HTML, png, CSS, etc., are not included in this status report because it is ok for generated content to have uncommitted changes.
These are the previous versions of the repository in which changes were
made to the R Markdown (analysis/projectSignatures.Rmd) and
HTML (docs/projectSignatures.html) files. If you’ve
configured a remote Git repository (see ?wflow_git_remote),
click on the hyperlinks in the table below to view the files as they
were in that past version.
| File | Version | Author | Date | Message |
|---|---|---|---|---|
| Rmd | 66c2208 | mluetge | 2022-12-08 | compare T cell groups and project gene signatures |
| html | 66c2208 | mluetge | 2022-12-08 | compare T cell groups and project gene signatures |
load packages
suppressPackageStartupMessages({
  library(SingleCellExperiment)
  library(tidyverse)
  library(Seurat)
  library(magrittr)
  library(dplyr)
  library(purrr)
  library(ggplot2)
  library(here)
  library(runSeurat3)
  library(ggsci)
  library(pheatmap)
  library(ggpubr)
  library(RColorBrewer)
  library(viridis)
})
heatmap function
avgHeatmap <- function(seurat, selGenes, colVecIdent, colVecCond=NULL,
                       ordVec=NULL, gapVecR=NULL, gapVecC=NULL,cc=FALSE,
                       cr=FALSE, condCol=FALSE){

  selGenes <- selGenes$gene

  ## assay data
  clusterAssigned <- as.data.frame(Idents(seurat)) %>%
  dplyr::mutate(cell=rownames(.))
  colnames(clusterAssigned)[1] <- "ident"
  seuratDat <- GetAssayData(seurat)

  ## genes of interest
  genes <- data.frame(gene=rownames(seurat)) %>%
    mutate(geneID=gsub("^.*\\.", "", gene)) %>% filter(geneID %in% selGenes)

  ## matrix with averaged cnts per ident
  logNormExpres <- as.data.frame(t(as.matrix(
    seuratDat[which(rownames(seuratDat) %in% genes$gene),])))
  logNormExpres <- logNormExpres %>% dplyr::mutate(cell=rownames(.)) %>%
    dplyr::left_join(.,clusterAssigned, by=c("cell")) %>%
    dplyr::select(-cell) %>% dplyr::group_by(ident) %>%
    dplyr::summarise_all(mean)
  logNormExpresMa <- logNormExpres %>% dplyr::select(-ident) %>% as.matrix()
  rownames(logNormExpresMa) <- logNormExpres$ident
  logNormExpresMa <- t(logNormExpresMa)
  rownames(logNormExpresMa) <- gsub("^.*?\\.","",rownames(logNormExpresMa))

  ## remove genes if they are all the same in all groups
  ind <- apply(logNormExpresMa, 1, sd) == 0
  logNormExpresMa <- logNormExpresMa[!ind,]
  genes <- genes[!ind,]

  ## color columns according to cluster
  annotation_col <- as.data.frame(gsub("(^.*?_)","",
                                       colnames(logNormExpresMa)))%>%
    dplyr::mutate(celltype=gsub("(_.*$)","",colnames(logNormExpresMa)))
  colnames(annotation_col)[1] <- "col1"
  annotation_col <- annotation_col %>%
    dplyr::mutate(cond = gsub(".*_","",col1)) %>%
    dplyr::select(cond, celltype)
  rownames(annotation_col) <- colnames(logNormExpresMa)

  ann_colors = list(
      cond = colVecCond,
      celltype=colVecIdent)
  if(is.null(ann_colors$cond)){
    annotation_col$cond <- NULL
  }

  ## adjust order
  logNormExpresMa <- logNormExpresMa[selGenes,]
  if(is.null(ordVec)){
    ordVec <- levels(seurat)
  }
  logNormExpresMa <- logNormExpresMa[,ordVec]

  ## scaled row-wise
  pheatmap(logNormExpresMa, scale="row" ,treeheight_row = 0, cluster_rows = cr,
         cluster_cols = cc, border_color = NA,
         color = colorRampPalette(c("#2166AC", "#F7F7F7", "#B2182B"))(50),
         annotation_col = annotation_col, cellwidth=15, cellheight=10,
         annotation_colors = ann_colors, gaps_row = gapVecR, gaps_col = gapVecC)
}
sign plot funct
## adapted from CellMixS
visGroup_adapt <- function (sce,group,dim_red = "TSNE",col_group=pal_nejm()(8))
{
    if (!is(sce, "SingleCellExperiment")) {
        stop("Error:'sce' must be a 'SingleCellExperiment' object.")
    }
    if (!group %in% names(colData(sce))) {
        stop("Error: 'group' variable must be in 'colData(sce)'")
    }
    cell_names <- colnames(sce)
    if (!dim_red %in% "TSNE") {
        if (!dim_red %in% reducedDimNames(sce)) {
            stop("Please provide a dim_red method listed in reducedDims of sce")
        }
        red_dim <- as.data.frame(reducedDim(sce, dim_red))
    }
    else {
        if (!"TSNE" %in% reducedDimNames(sce)) {
            if ("logcounts" %in% names(assays(sce))) {
                sce <- runTSNE(sce)
            }
            else {
                sce <- runTSNE(sce, exprs_values = "counts")
            }
        }
        red_dim <- as.data.frame(reducedDim(sce, "TSNE"))
    }
    colnames(red_dim) <- c("red_dim1", "red_dim2")
    df <- data.frame(sample_id = cell_names, group_var = colData(sce)[,
        group], red_Dim1 = red_dim$red_dim1, red_Dim2 = red_dim$red_dim2)
    t <- ggplot(df, aes_string(x = "red_Dim1", y = "red_Dim2")) +
        xlab(paste0(dim_red, "_1")) + ylab(paste0(dim_red, "_2")) +
        theme_void() + theme(aspect.ratio = 1,
                             panel.grid.minor = element_blank(),
        panel.grid.major = element_line(color = "grey", size = 0.3))
    t_group <- t + geom_point(size = 1.5, alpha = 0.8,
                              aes_string(color = "group_var")) +
        guides(color = guide_legend(override.aes = list(size = 1),
            title = group)) + ggtitle(group)
    if (is.numeric(df$group_var)) {
        t_group <- t_group + scale_color_viridis(option = "D")
    }
    else {
        t_group <- t_group + scale_color_manual(values = col_group)
    }
    t_group
}
set dir
basedir <- here()
seurat <- readRDS(file = paste0(basedir,
                              "/data/humanHeartsPlusGraz_intPatients_merged",
                              "labeled_woHH_seurat.rds"))
Idents(seurat) <- seurat$integrated_snn_res.0.6
color vectors
colPal <- c(pal_igv()(12),
            pal_aaas()(10))[1:length(levels(seurat))]
colTec <- pal_jama()(length(unique(seurat$technique)))
colSmp <- c(pal_uchicago()(9), pal_npg()(10), pal_aaas()(10),
            pal_jama()(7))[1:length(unique(seurat$dataset))]
colCond <- pal_npg()(length(unique(seurat$cond)))
colID <- c(pal_jco()(10), pal_npg()(10), pal_futurama()(10),
           pal_d3()(10))[1:length(unique(seurat$ID))]
colOrig <- pal_aaas()(length(unique(seurat$origin)))
colIso <- pal_nejm()(length(unique(seurat$isolation)))
colProc <- pal_aaas()(length(unique(seurat$processing)))
colTgrp <- c("#d70700", "#00239a", "#1f7a1f")
colLab <- c("#c08b65", "#ba4e45", "#d4cc84", "#546f82", "#5c5cdf",
            "#80396e", "#8d5639", "#779462", "#800000FF", "#d87c15",
            "#FFA319FF", "#FF95A8FF")
names(colLab) <- c("EndoEC", "Tcell","resMacrophage", "Fibroblast",
                   "infMacrophage", "Perivascular","Cardiomyocyte",
                   "Endothelial","Adipocytes","NeuralCells","SMC","LEC")
names(colTgrp) <- c("TcellHigh", "TcellLow", "TcellInt" )
names(colPal) <- levels(seurat)
names(colTec) <- unique(seurat$technique)
names(colSmp) <- unique(seurat$dataset)
names(colCond) <- unique(seurat$cond)
names(colID) <- unique(seurat$ID)
names(colOrig) <- unique(seurat$origin)
names(colIso) <- unique(seurat$isolation)
names(colProc) <- unique(seurat$processing)
vis data
clusters
DimPlot(seurat, reduction = "umap", cols=colPal)+
  theme_bw() +
  theme(axis.text = element_blank(), axis.ticks = element_blank(),
        panel.grid.minor = element_blank()) +
  xlab("UMAP1") +
  ylab("UMAP2")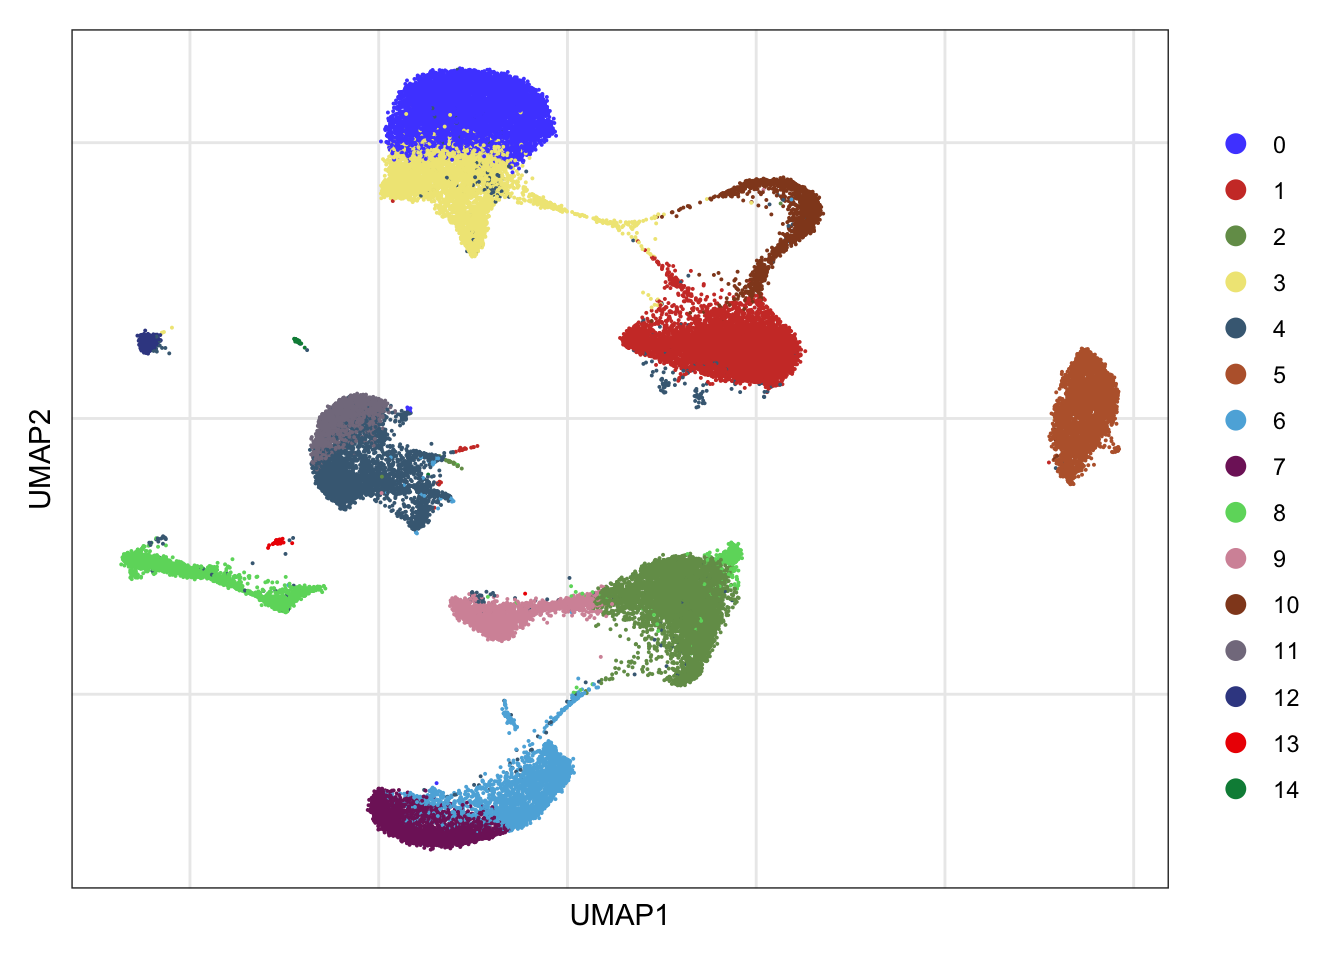
| Version | Author | Date |
|---|---|---|
| 66c2208 | mluetge | 2022-12-08 |
DimPlot(seurat, reduction = "umap", cols=colPal,
        shuffle = T)+
  theme_void()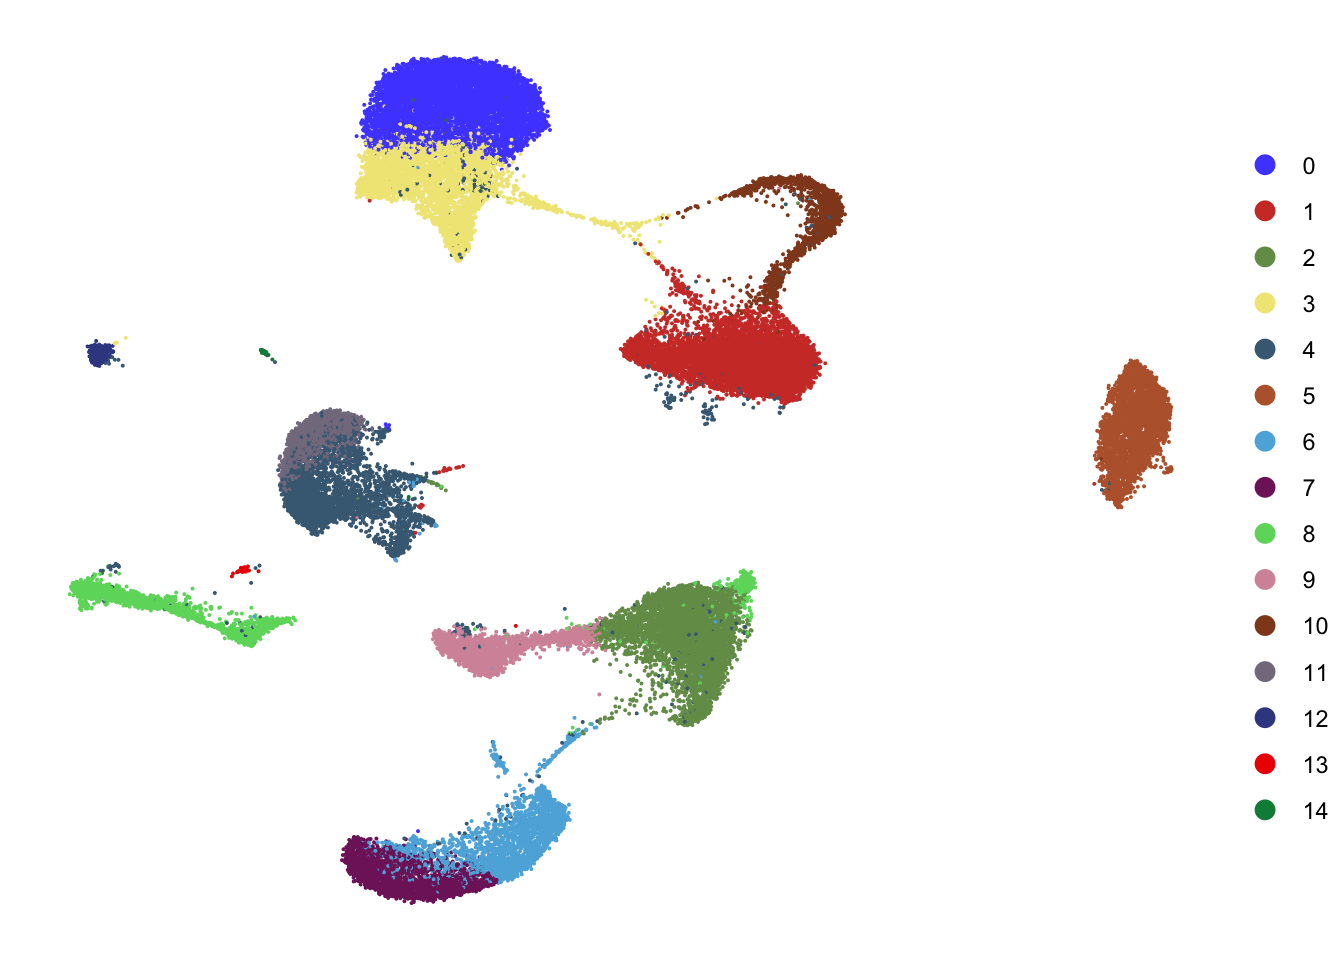
| Version | Author | Date |
|---|---|---|
| 66c2208 | mluetge | 2022-12-08 |
label
DimPlot(seurat, reduction = "umap",  group.by = "label", cols=colLab)+
  theme_bw() +
  theme(axis.text = element_blank(), axis.ticks = element_blank(),
        panel.grid.minor = element_blank()) +
  xlab("UMAP1") +
  ylab("UMAP2")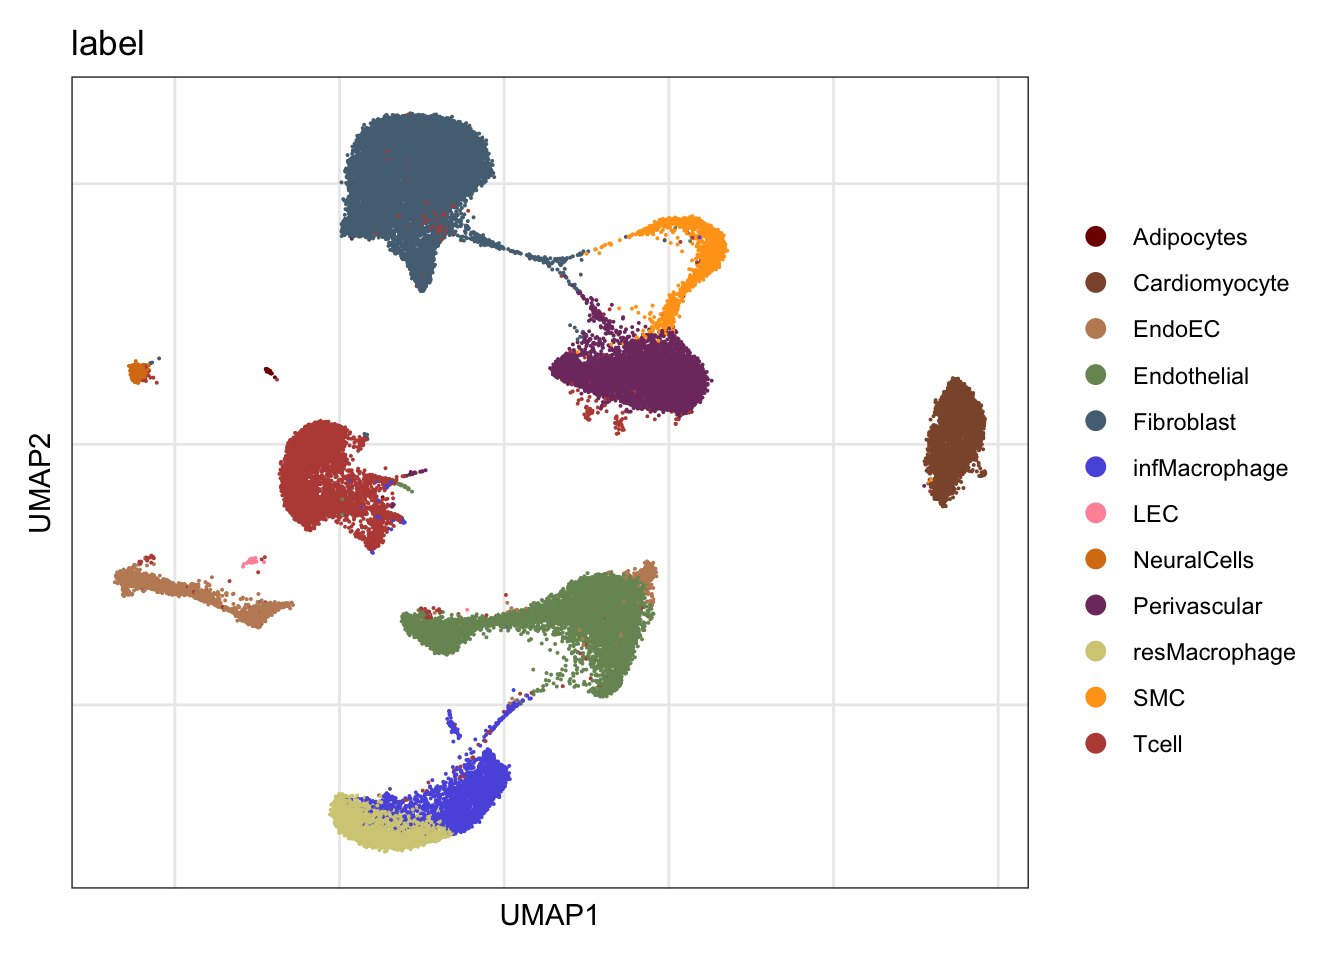
| Version | Author | Date |
|---|---|---|
| 66c2208 | mluetge | 2022-12-08 |
DimPlot(seurat, reduction = "umap", group.by = "label", cols=colLab,
        shuffle = T)+
  theme_void()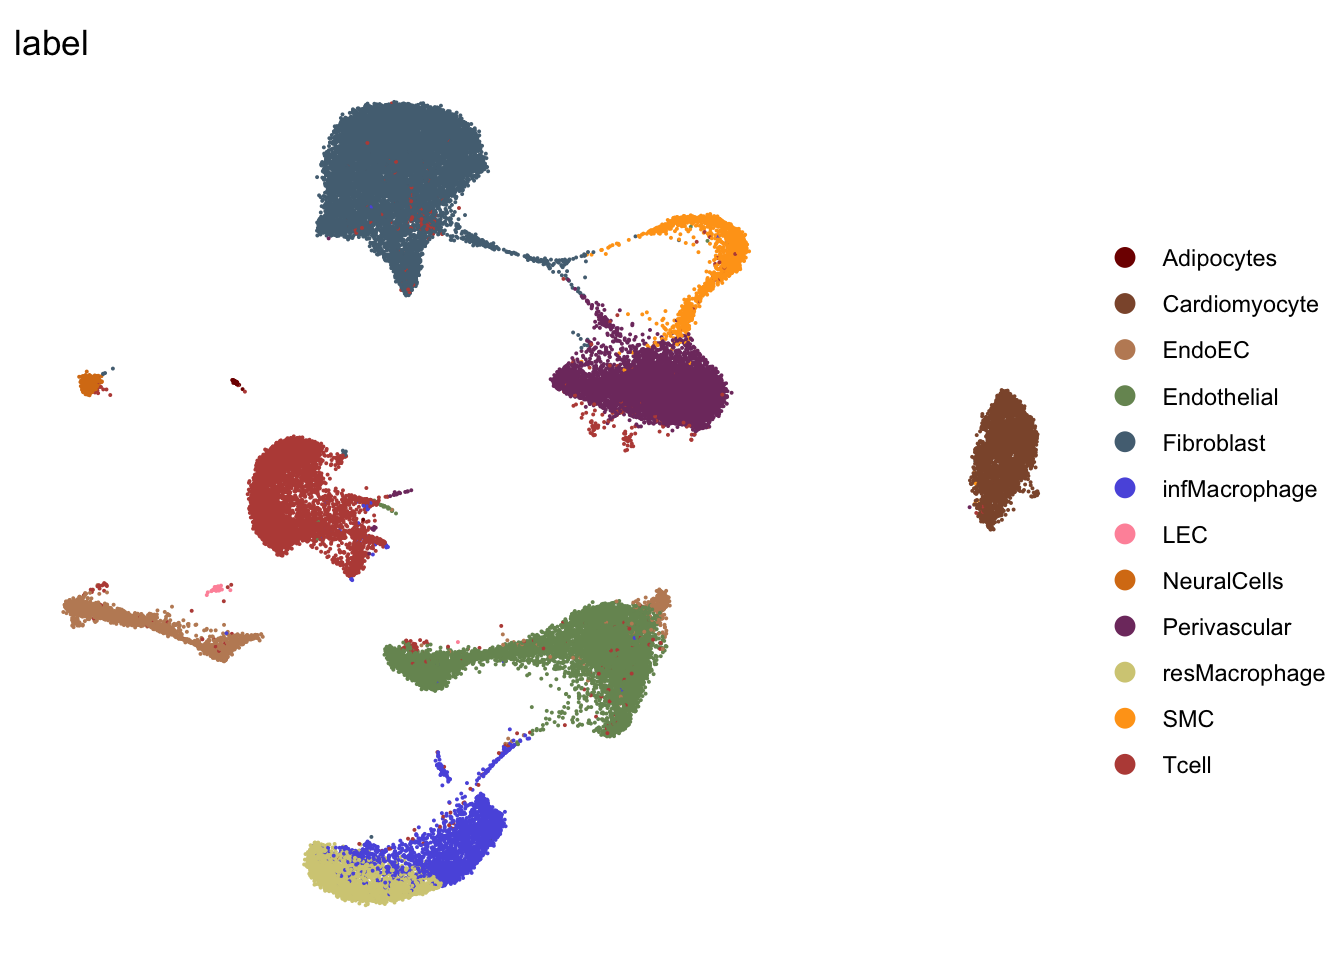
| Version | Author | Date |
|---|---|---|
| 66c2208 | mluetge | 2022-12-08 |
ID
DimPlot(seurat, reduction = "umap", group.by = "ID", cols=colID, shuffle = T)+
  theme_bw() +
  theme(axis.text = element_blank(), axis.ticks = element_blank(),
        panel.grid.minor = element_blank()) +
  xlab("UMAP1") +
  ylab("UMAP2")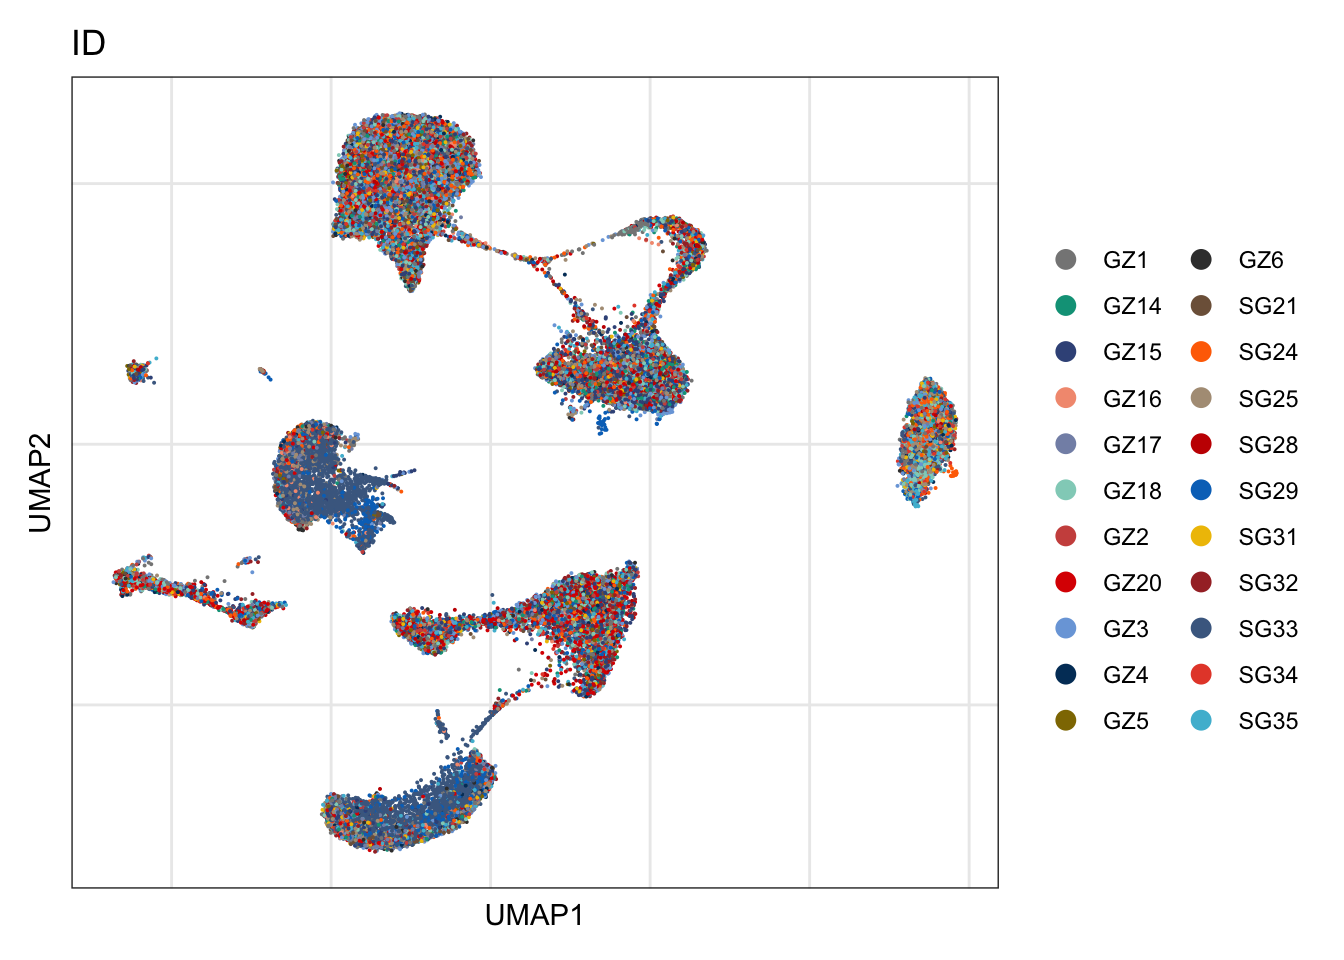
| Version | Author | Date |
|---|---|---|
| 66c2208 | mluetge | 2022-12-08 |
DimPlot(seurat, reduction = "umap", group.by = "ID", cols=colID,
        shuffle = T)+
  theme_void()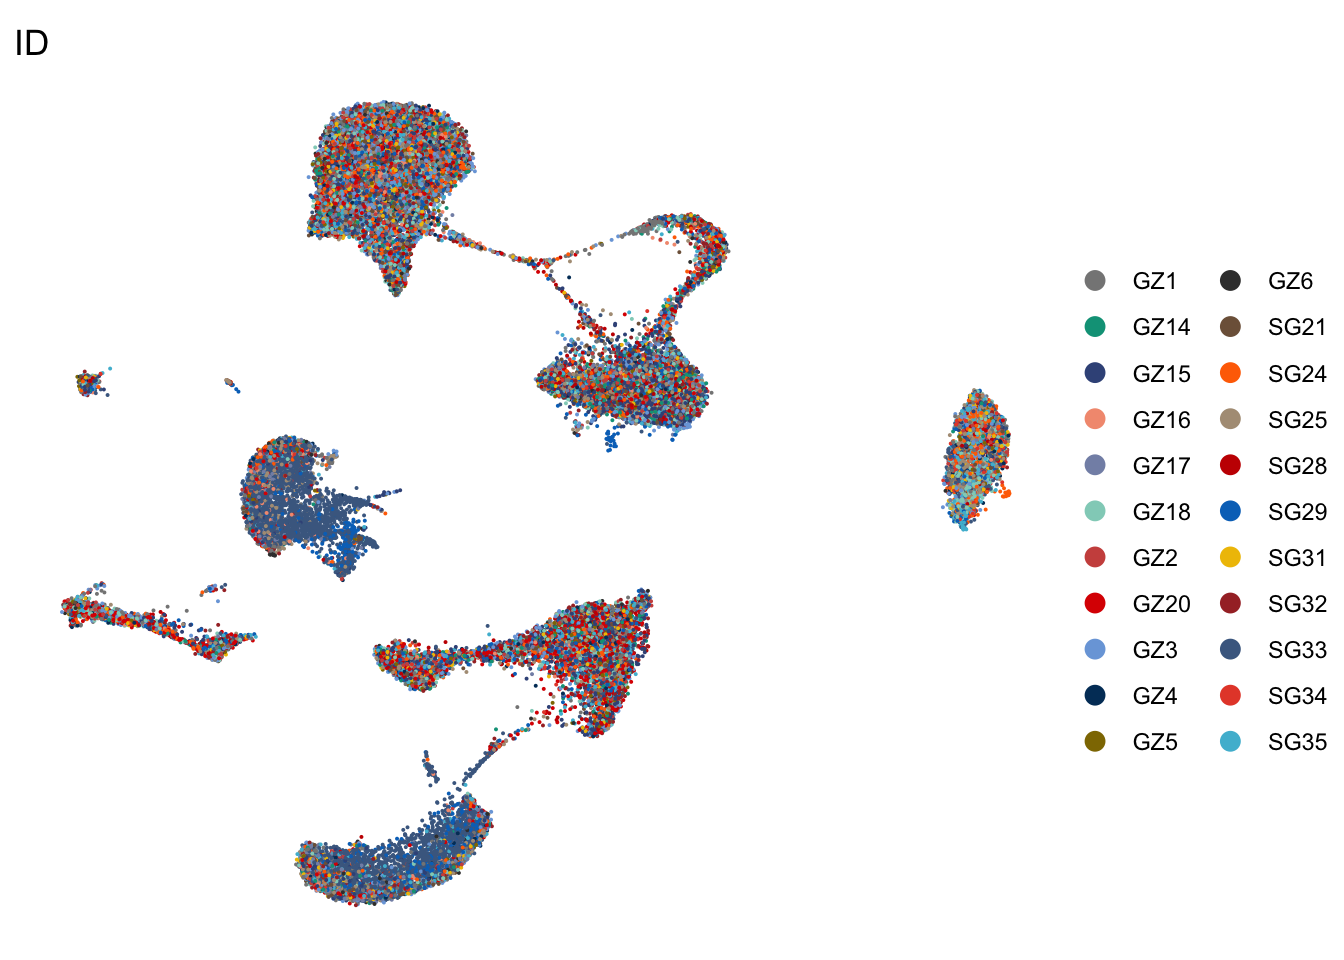
| Version | Author | Date |
|---|---|---|
| 66c2208 | mluetge | 2022-12-08 |
cond
DimPlot(seurat, reduction = "umap", group.by = "cond", cols=colCond)+
  theme_bw() +
  theme(axis.text = element_blank(), axis.ticks = element_blank(),
        panel.grid.minor = element_blank()) +
  xlab("UMAP1") +
  ylab("UMAP2")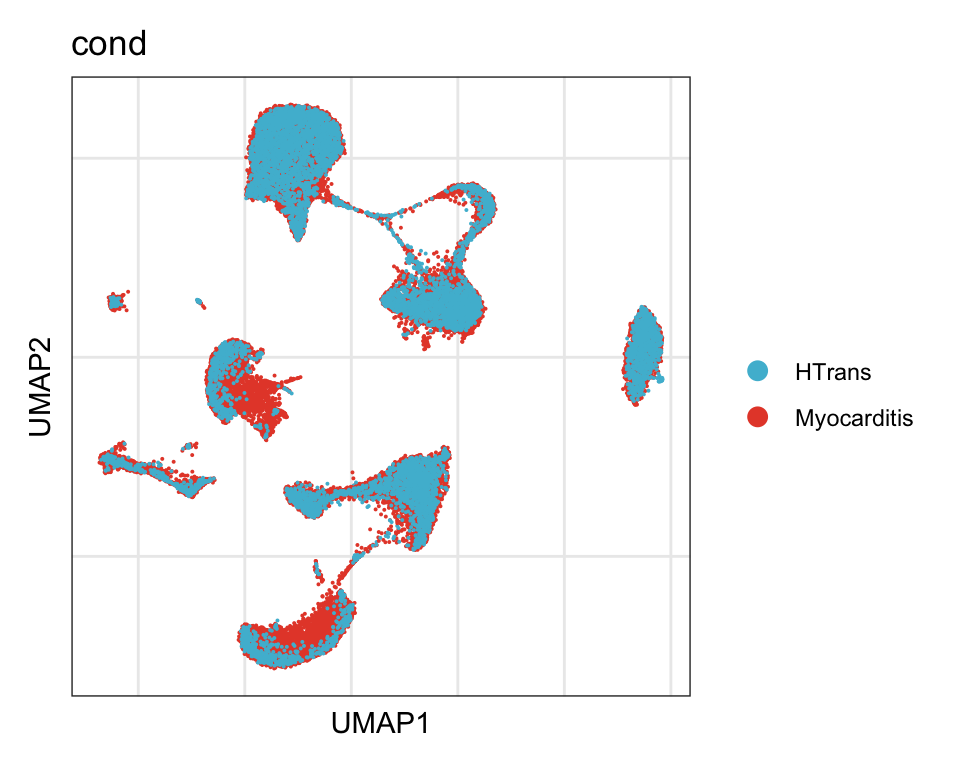
| Version | Author | Date |
|---|---|---|
| 66c2208 | mluetge | 2022-12-08 |
T cell grp
DimPlot(seurat, reduction = "umap", group.by = "TcellGrp", cols=colTgrp)+
  theme_bw() +
  theme(axis.text = element_blank(), axis.ticks = element_blank(),
        panel.grid.minor = element_blank()) +
  xlab("UMAP1") +
  ylab("UMAP2")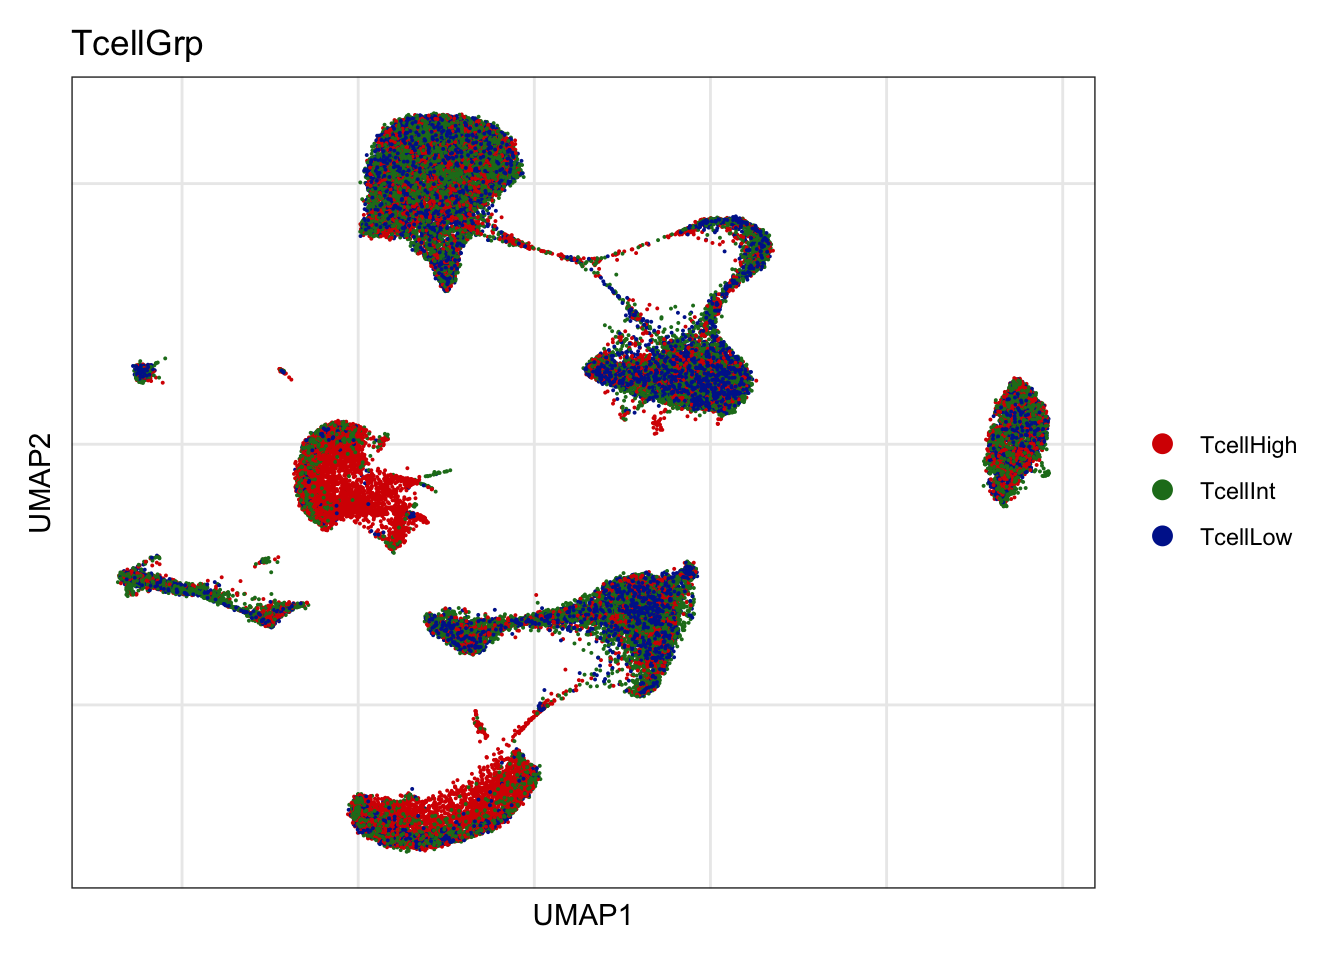
| Version | Author | Date |
|---|---|---|
| 66c2208 | mluetge | 2022-12-08 |
DimPlot(seurat, reduction = "umap", group.by = "TcellGrp", cols=colTgrp,
        shuffle = T)+
  theme_void()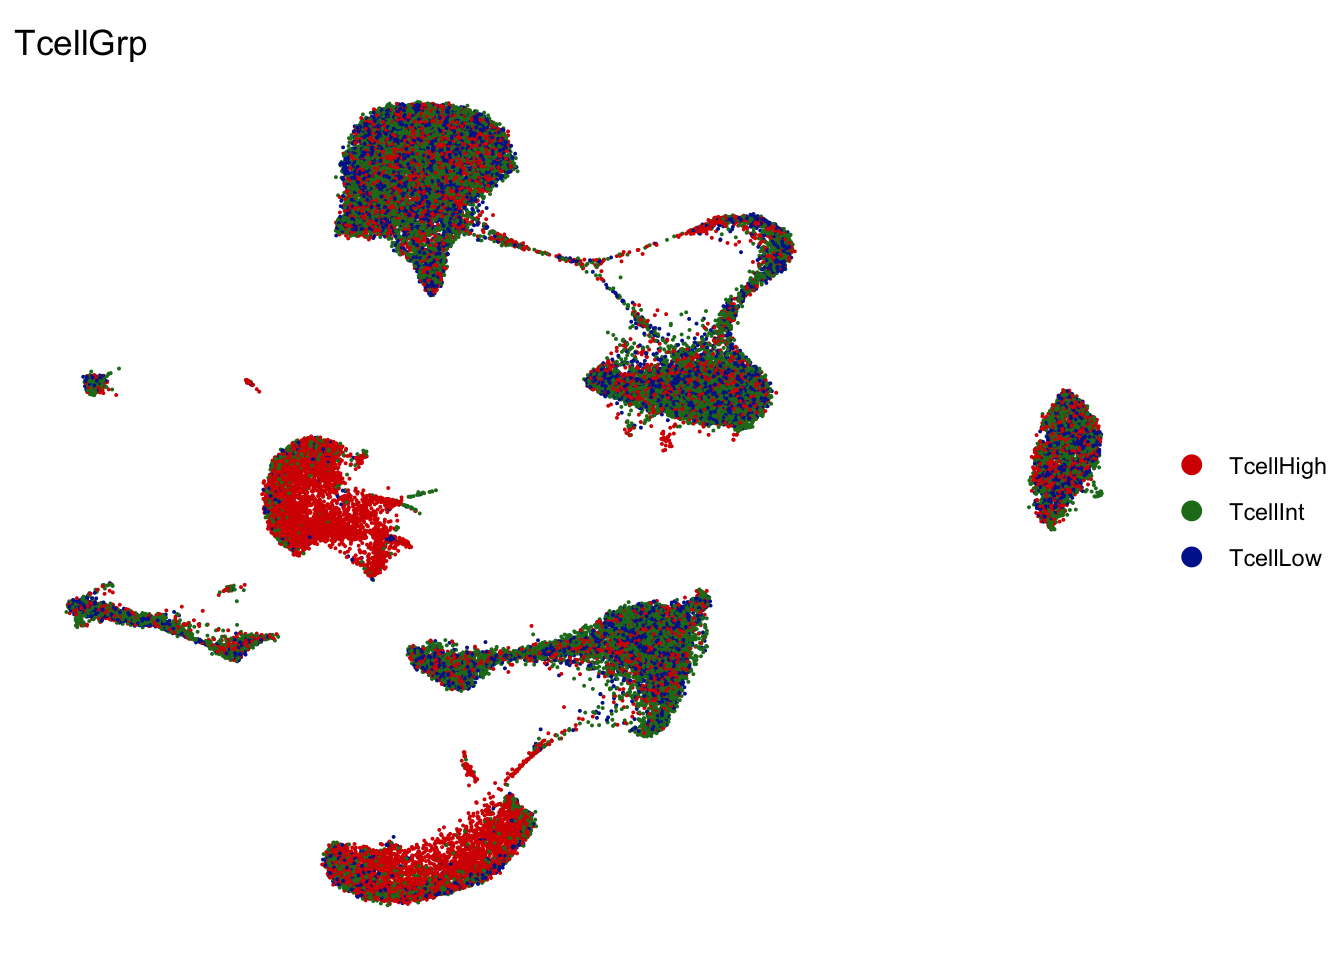
| Version | Author | Date |
|---|---|---|
| 66c2208 | mluetge | 2022-12-08 |
label split by T cell Grp
DimPlot(seurat, reduction = "umap", group.by = "label", cols=colLab,
        split.by = "TcellGrp", shuffle = T)+
  theme_void()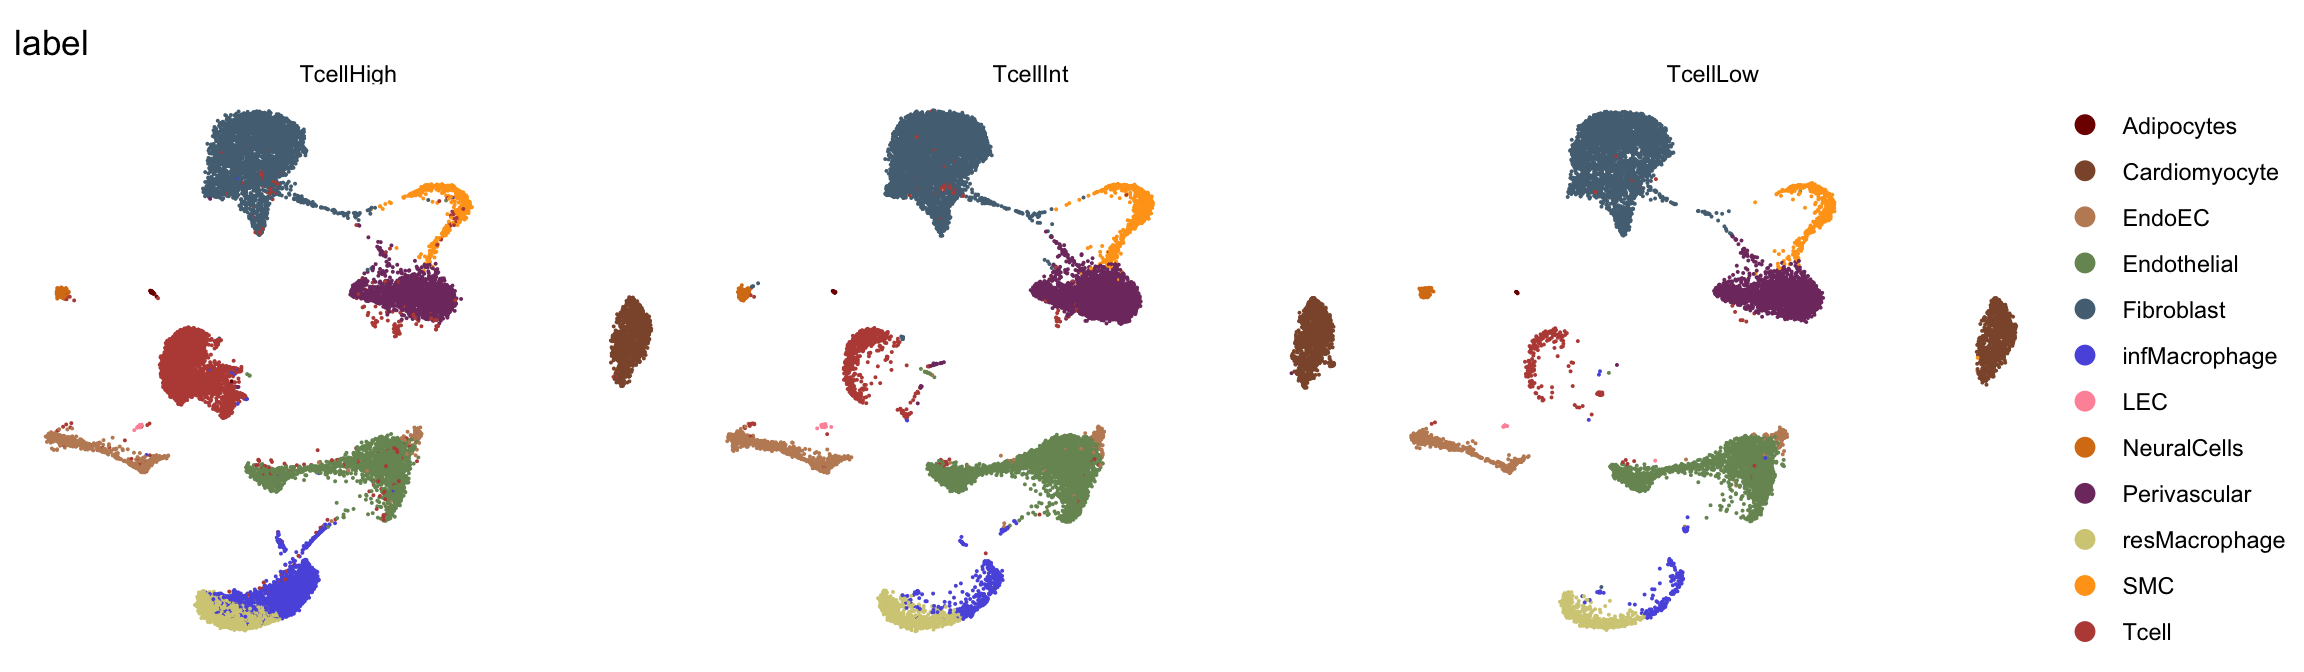
| Version | Author | Date |
|---|---|---|
| 66c2208 | mluetge | 2022-12-08 |
project signatures
signature cut 2
signDat <- read_delim(file = paste0(basedir,
                    "/data/GSEA/selGenesSignature.txt"),
                    delim = "\t")
genes <- data.frame(geneID=rownames(seurat)) %>%
  mutate(gene=gsub("^.*\\.", "", geneID))
signDat <- signDat %>% left_join(.,genes, by="gene")
allSign <- unique(signDat$signature)

sce <- as.SingleCellExperiment(seurat)

## add reduced dim
seurat2 <- seurat
DefaultAssay(object = seurat2) <- "integrated"
sce2 <- as.SingleCellExperiment(seurat2)
reducedDims(sce) <- reducedDims(sce2)
remove(seurat2)
remove(sce2)

treatGrps <- unique(sce$TcellGrp)

cutOff <- 2
pal = viridis(100)
sc <- scale_colour_gradientn(colours = pal, limits=c(0, cutOff))

lapply(unique(signDat$signature), function(sign){
  signGenes <- signDat %>% dplyr::filter(signature == sign)
  sceSub <- sce[which(rownames(sce) %in% signGenes$geneID),]
  cntMat <- rowSums(t(as.matrix(sceSub@assays@data$logcounts)))/nrow(signGenes)
  sceSub$sign <- cntMat
  sceSub$sign[which(sceSub$sign > cutOff)] <- cutOff
  sceSub$sign[which(sceSub$sign < 0)] <- 0
  lapply(treatGrps, function(treat){
    sceSubT <- sceSub[, which(sceSub$TcellGrp == treat)]
    p <- visGroup_adapt(sceSubT, 'sign', dim_red = 'UMAP') +
    sc +
    guides(colour = guide_colourbar(title = '')) +
    ggtitle(paste0(sign, ' signature - ', treat)) +
    theme_classic() +
    theme(axis.text = element_blank(),
          axis.ticks = element_blank()) +
    labs(x='Dimension 1', y='Dimension 2')
    p
  })
})
[[1]]
[[1]][[1]]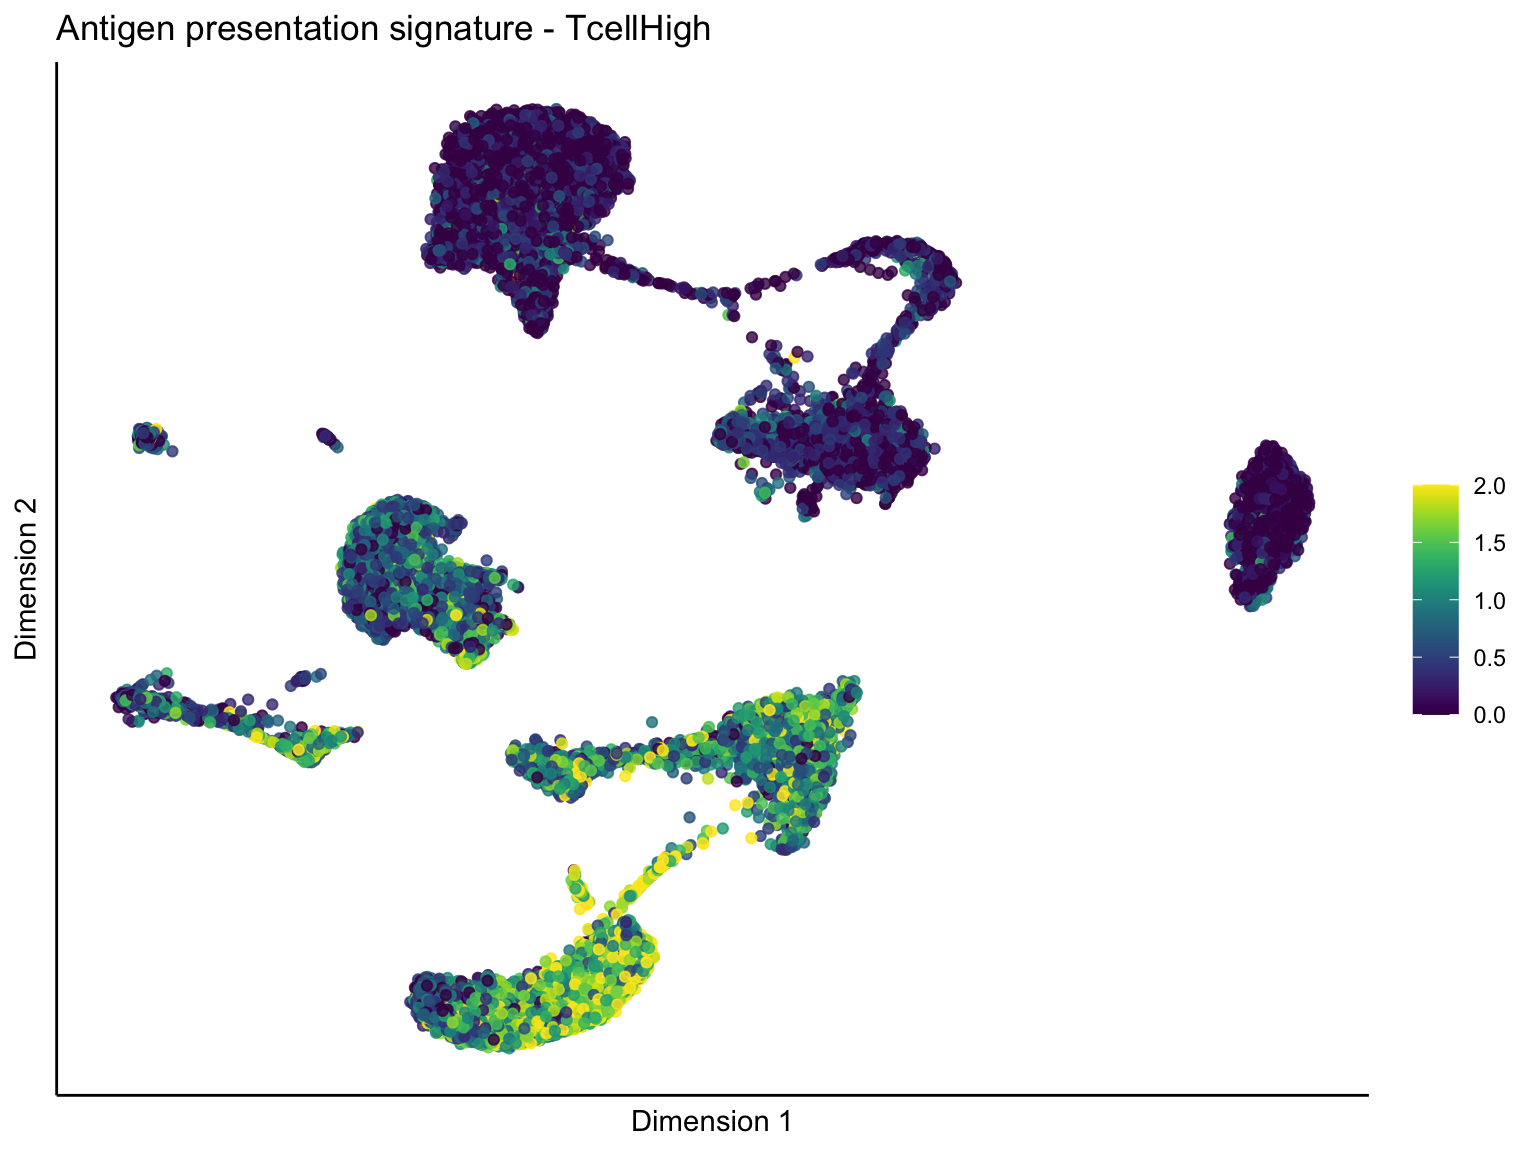
| Version | Author | Date |
|---|---|---|
| 66c2208 | mluetge | 2022-12-08 |
[[1]][[2]]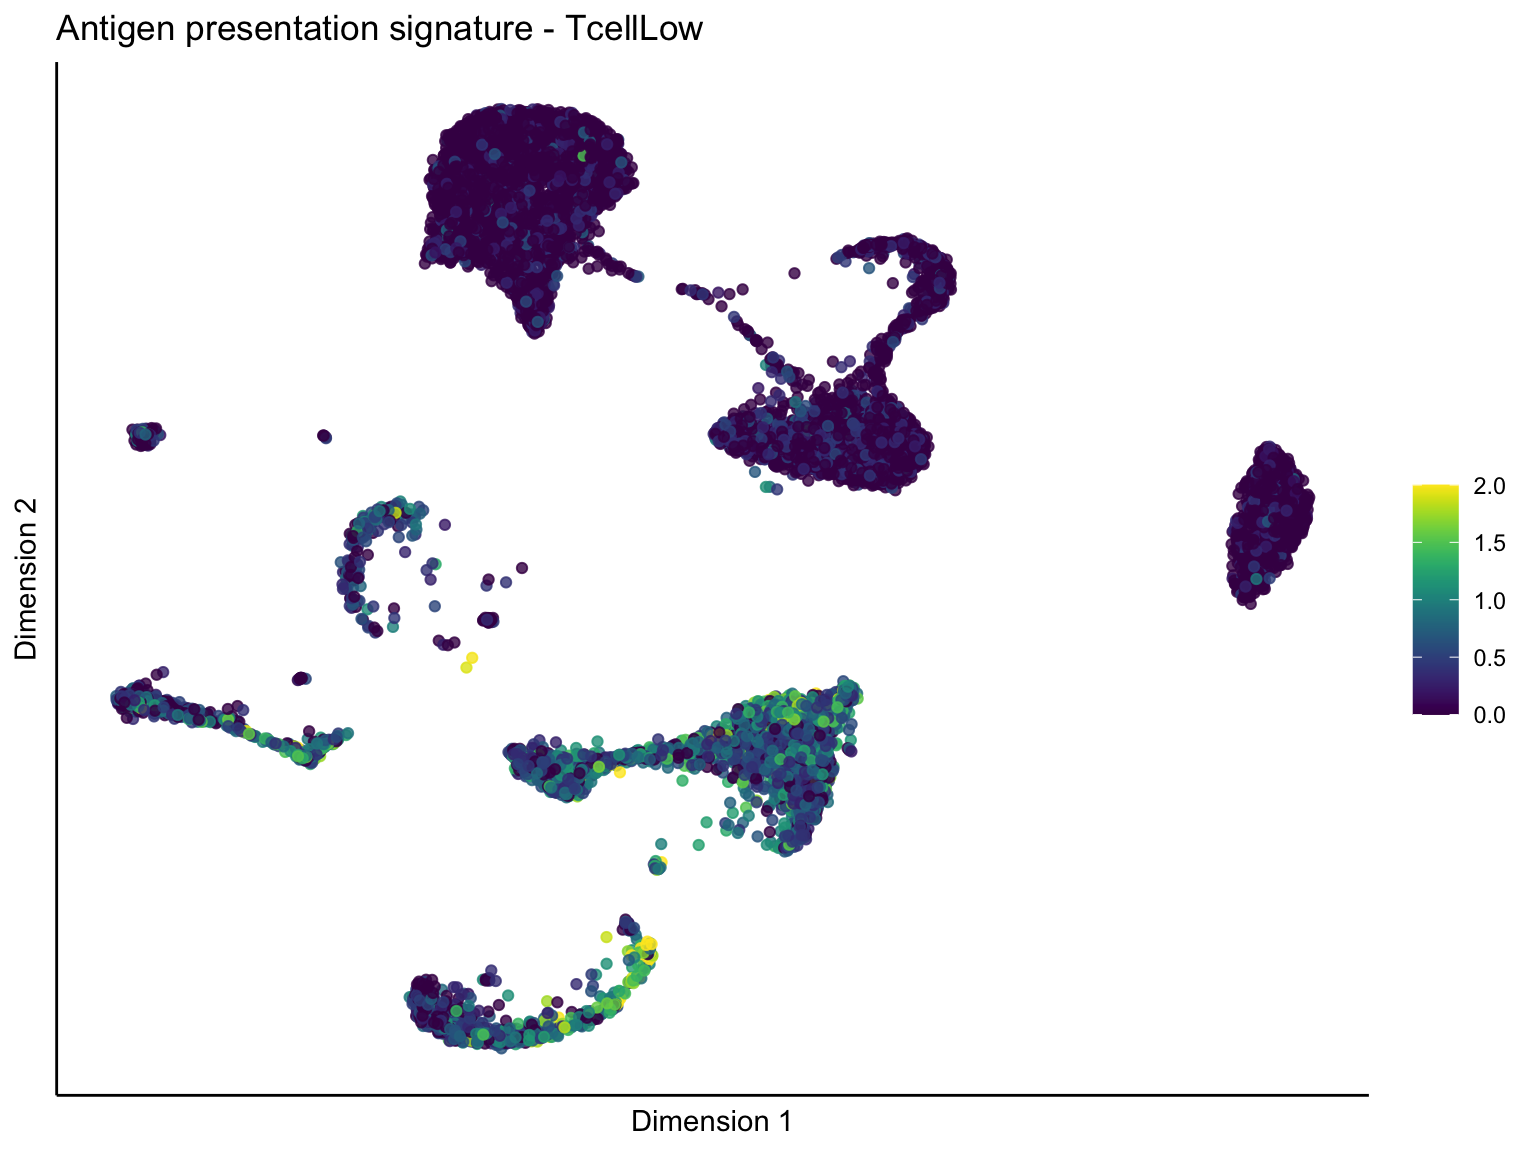
| Version | Author | Date |
|---|---|---|
| 66c2208 | mluetge | 2022-12-08 |
[[1]][[3]]
| Version | Author | Date |
|---|---|---|
| 66c2208 | mluetge | 2022-12-08 |
[[2]]
[[2]][[1]]
| Version | Author | Date |
|---|---|---|
| 66c2208 | mluetge | 2022-12-08 |
[[2]][[2]]
| Version | Author | Date |
|---|---|---|
| 66c2208 | mluetge | 2022-12-08 |
[[2]][[3]]
| Version | Author | Date |
|---|---|---|
| 66c2208 | mluetge | 2022-12-08 |
[[3]]
[[3]][[1]]
| Version | Author | Date |
|---|---|---|
| 66c2208 | mluetge | 2022-12-08 |
[[3]][[2]]
| Version | Author | Date |
|---|---|---|
| 66c2208 | mluetge | 2022-12-08 |
[[3]][[3]]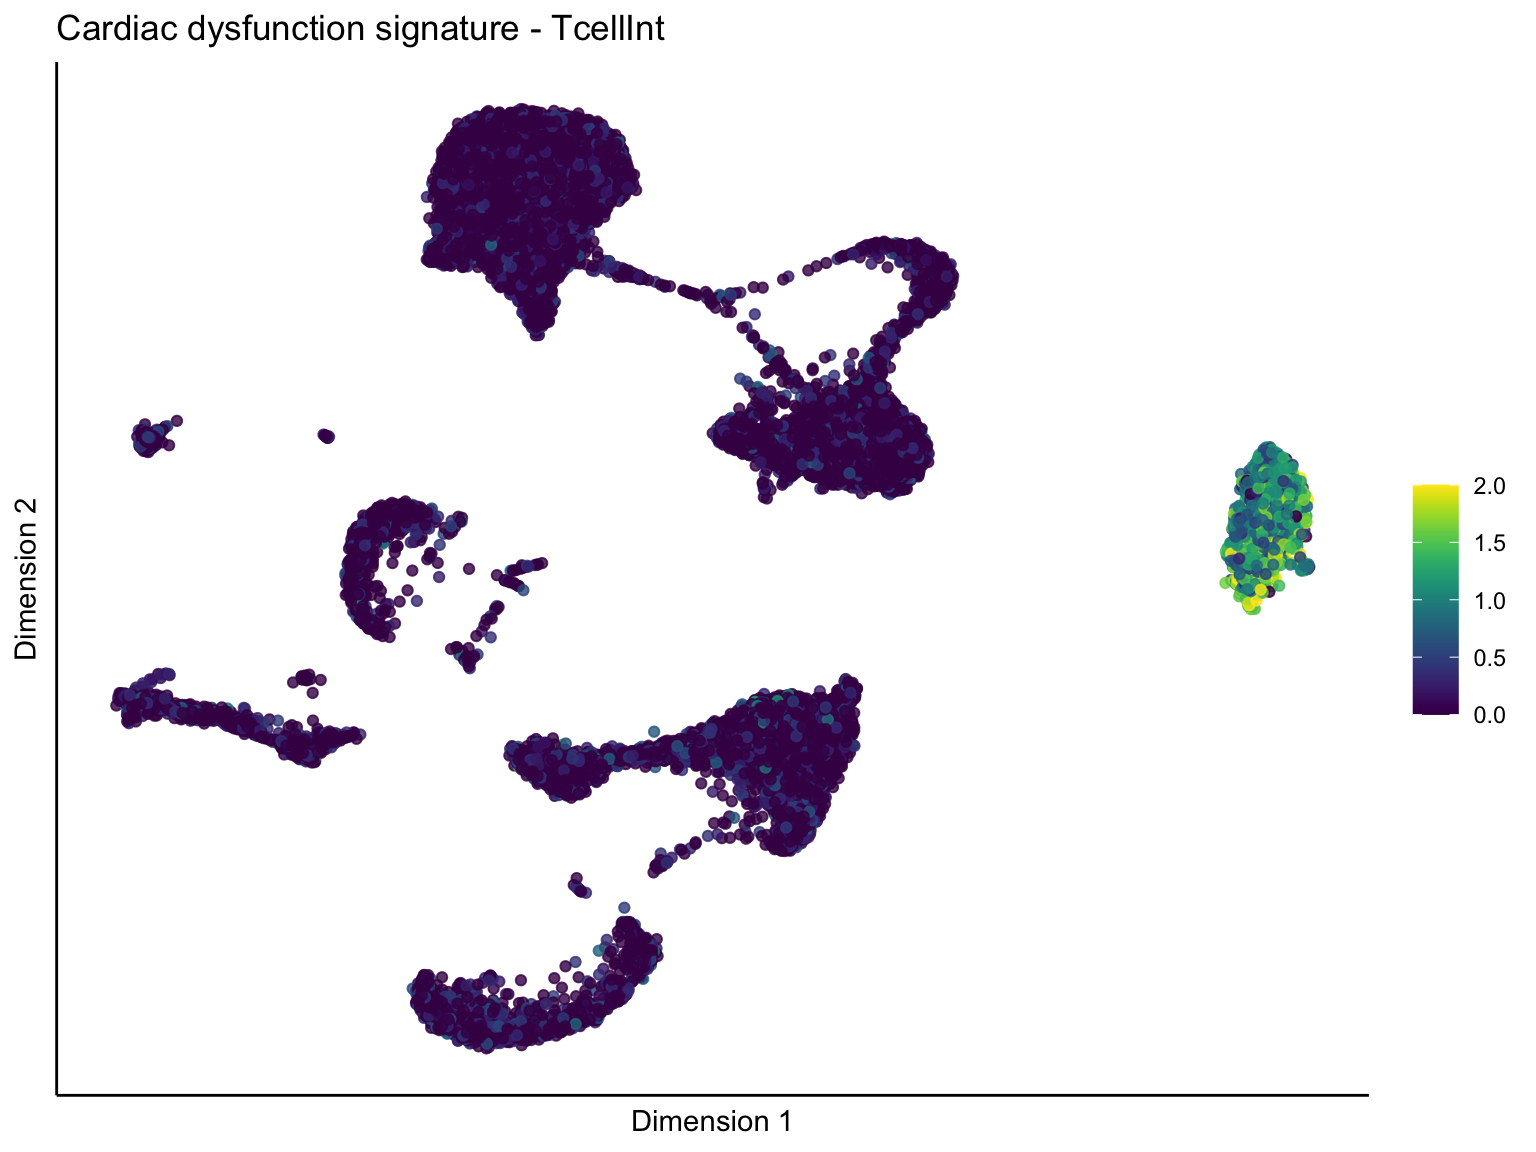
| Version | Author | Date |
|---|---|---|
| 66c2208 | mluetge | 2022-12-08 |
[[4]]
[[4]][[1]]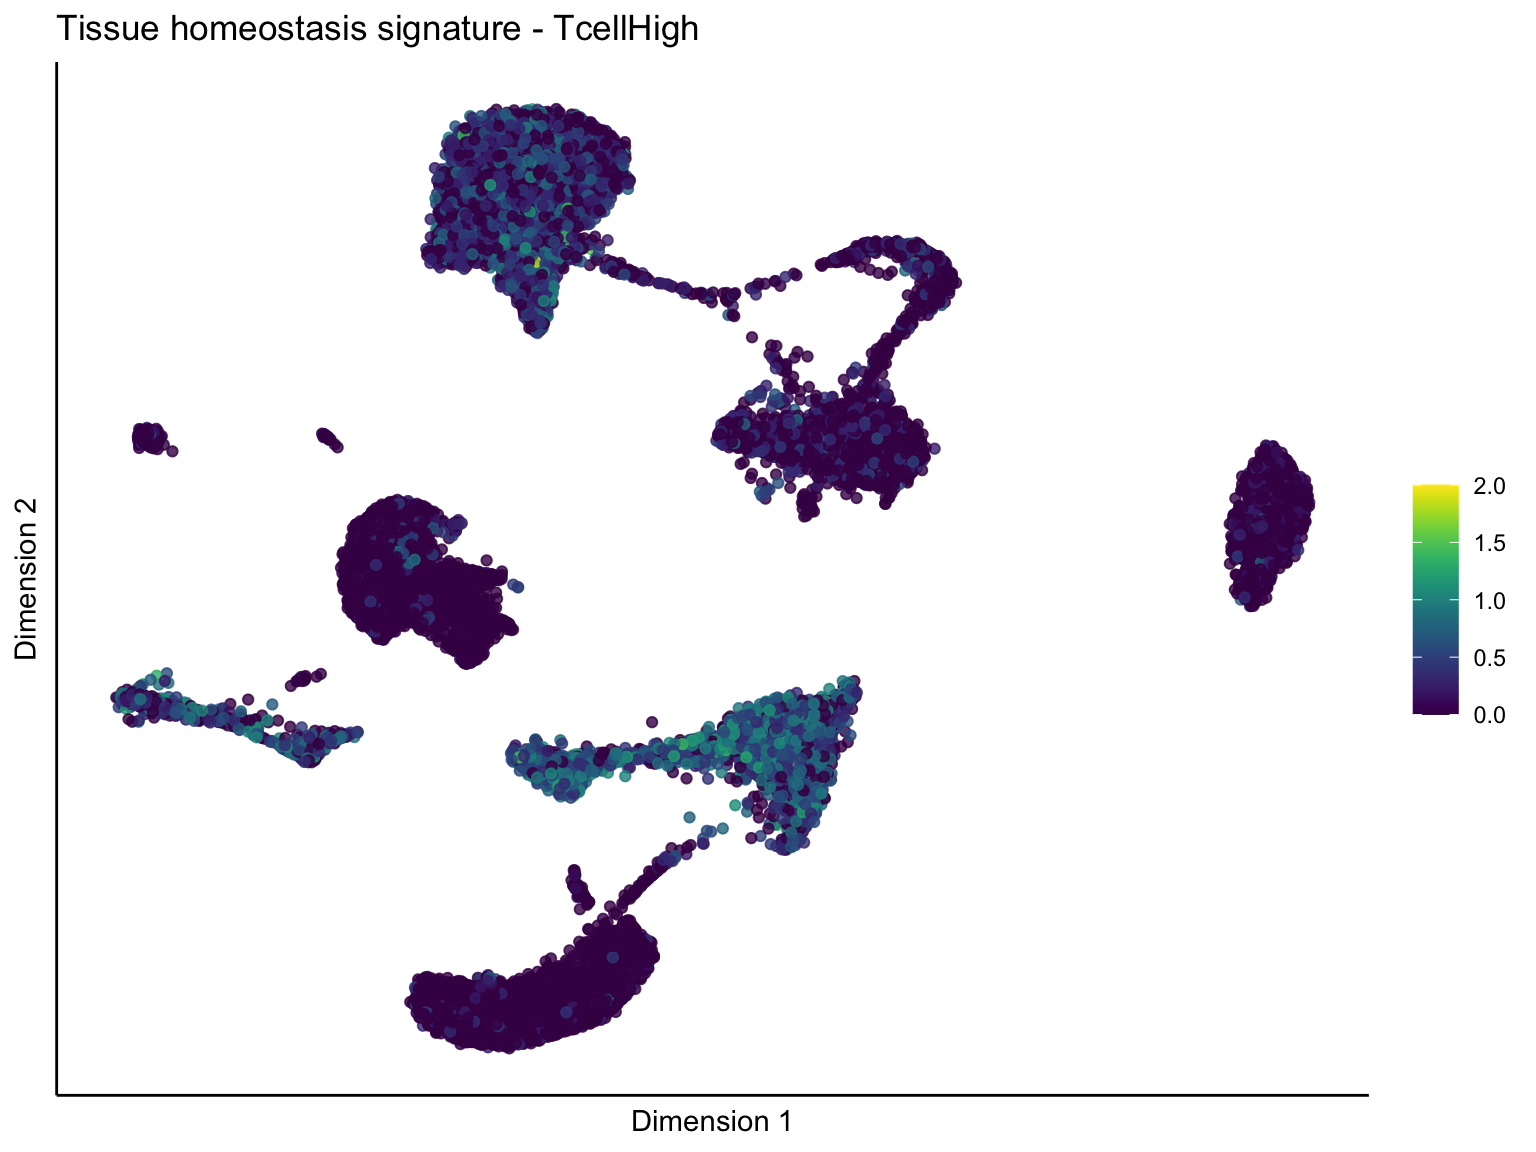
| Version | Author | Date |
|---|---|---|
| 66c2208 | mluetge | 2022-12-08 |
[[4]][[2]]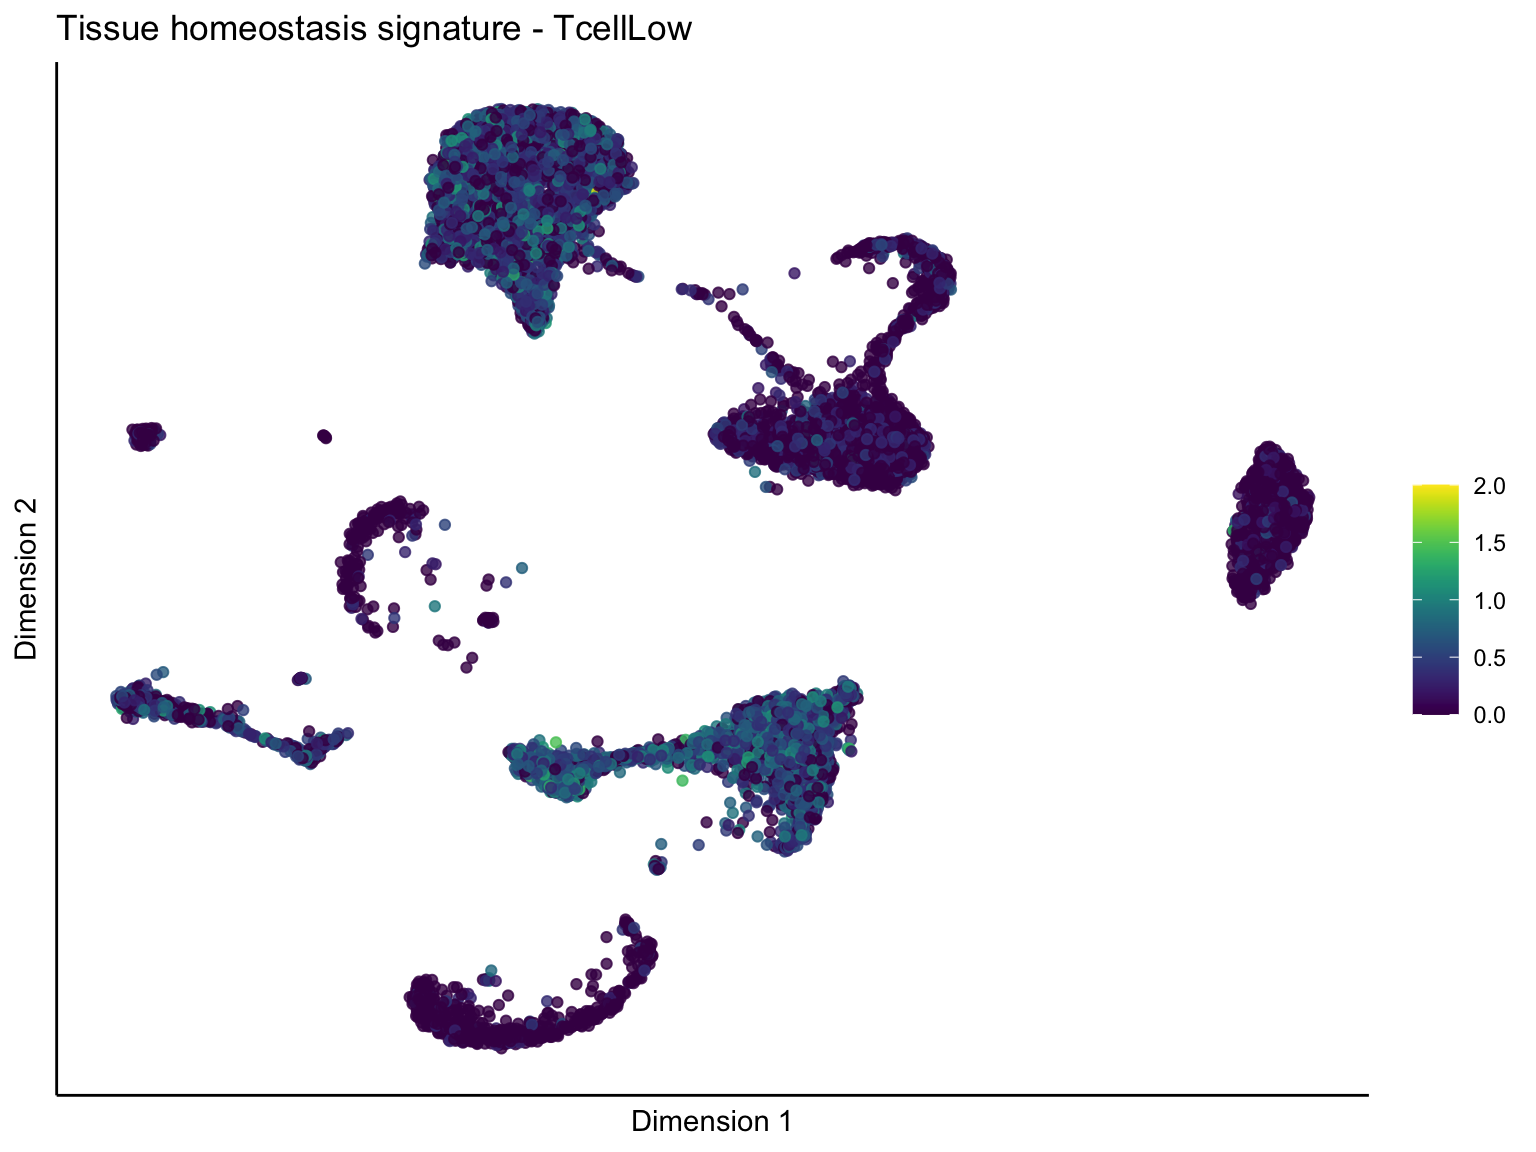
| Version | Author | Date |
|---|---|---|
| 66c2208 | mluetge | 2022-12-08 |
[[4]][[3]]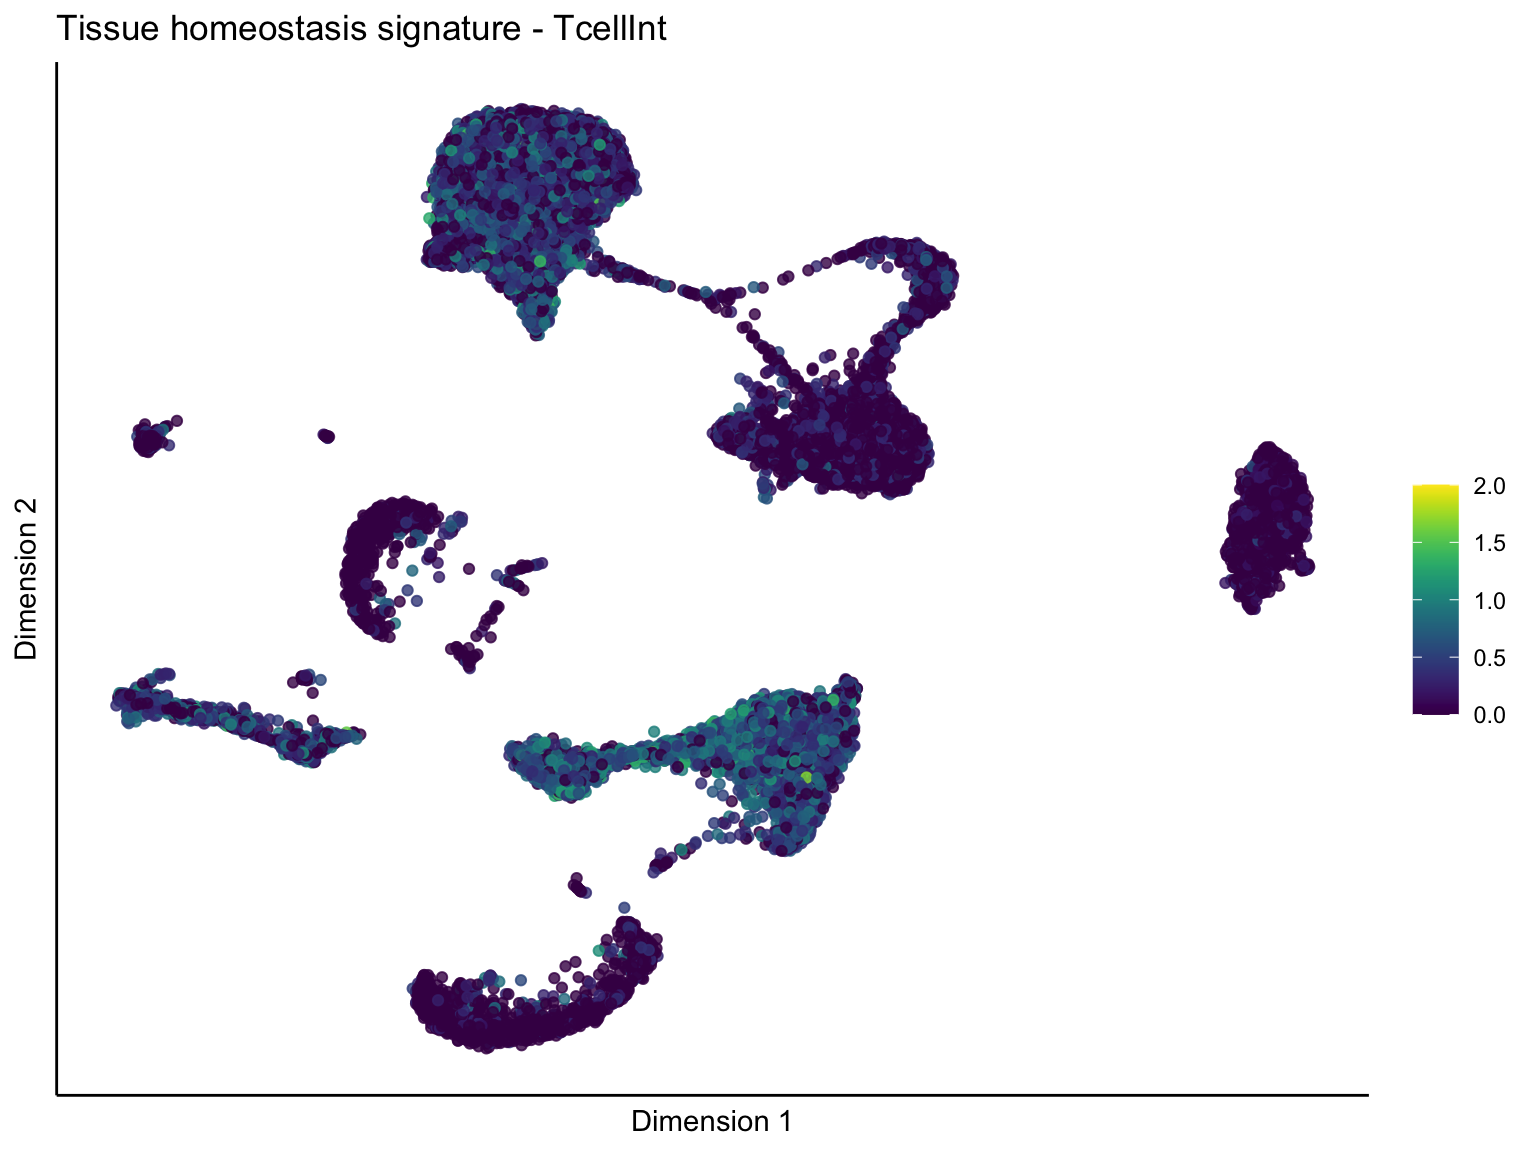
| Version | Author | Date |
|---|---|---|
| 66c2208 | mluetge | 2022-12-08 |
pal = colorRampPalette(rev(brewer.pal(11, 'RdBu')))
sc <- scale_colour_gradientn(colours = pal(100), limits=c(0, cutOff))

lapply(unique(signDat$signature), function(sign){
  signGenes <- signDat %>% dplyr::filter(signature == sign)
  sceSub <- sce[which(rownames(sce) %in% signGenes$geneID),]
  cntMat <- rowSums(t(as.matrix(sceSub@assays@data$logcounts)))/nrow(signGenes)
  sceSub$sign <- cntMat
  sceSub$sign[which(sceSub$sign > cutOff)] <- cutOff
  sceSub$sign[which(sceSub$sign < 0)] <- 0
  lapply(treatGrps, function(treat){
    sceSubT <- sceSub[, which(sceSub$TcellGrp == treat)]
    p <- visGroup_adapt(sceSubT, 'sign', dim_red = 'UMAP') +
    sc +
    guides(colour = guide_colourbar(title = '')) +
    ggtitle(paste0(sign, ' signature - ', treat)) +
    theme_classic() +
    theme(axis.text = element_blank(),
          axis.ticks = element_blank()) +
    labs(x='Dimension 1', y='Dimension 2')
    p
  })
})
[[1]]
[[1]][[1]]
| Version | Author | Date |
|---|---|---|
| 66c2208 | mluetge | 2022-12-08 |
[[1]][[2]]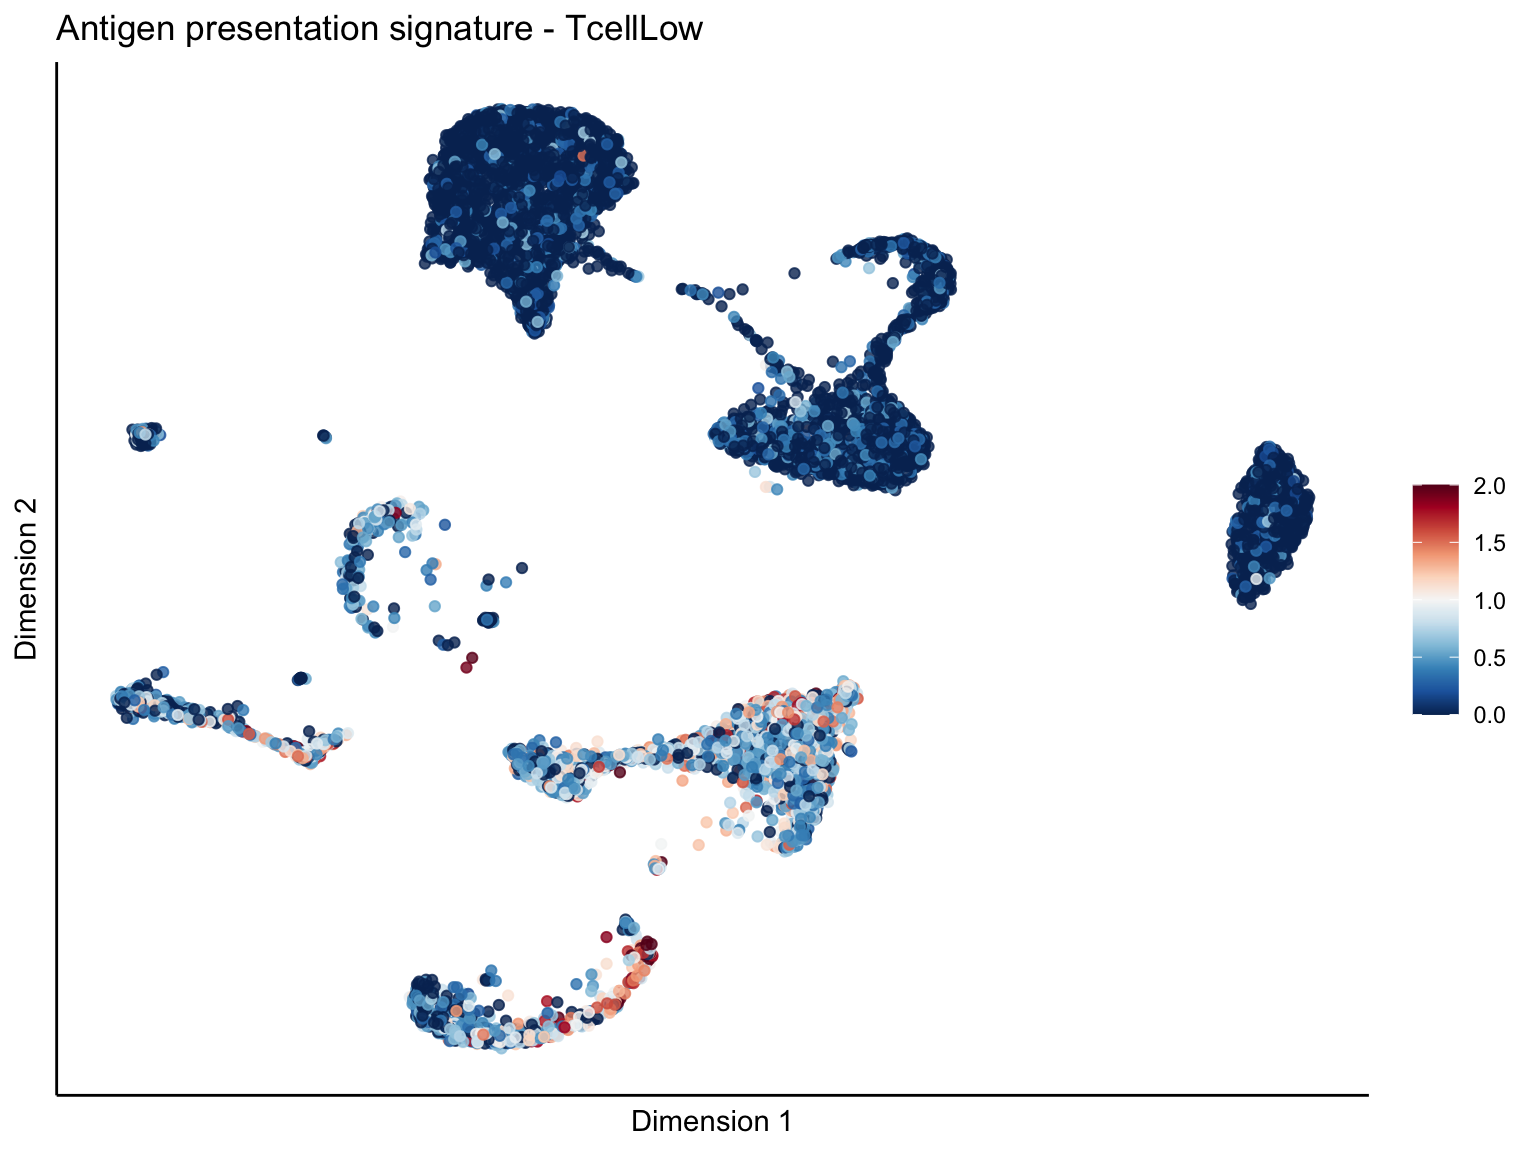
| Version | Author | Date |
|---|---|---|
| 66c2208 | mluetge | 2022-12-08 |
[[1]][[3]]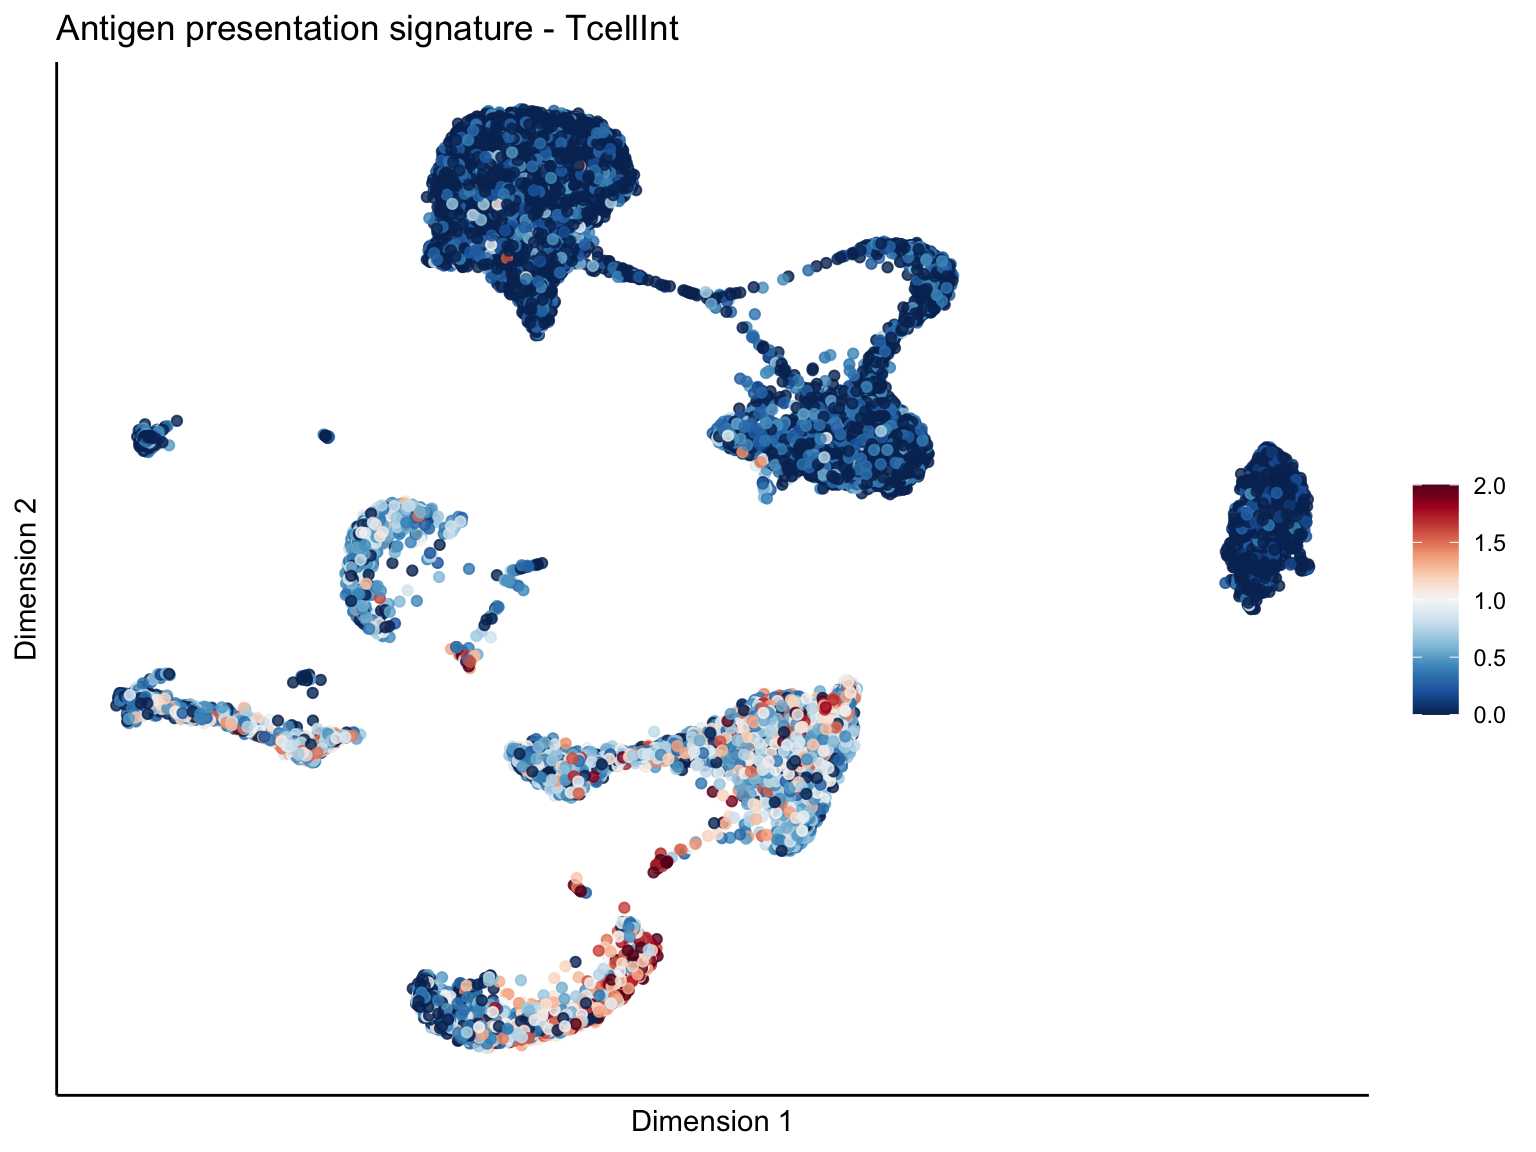
| Version | Author | Date |
|---|---|---|
| 66c2208 | mluetge | 2022-12-08 |
[[2]]
[[2]][[1]]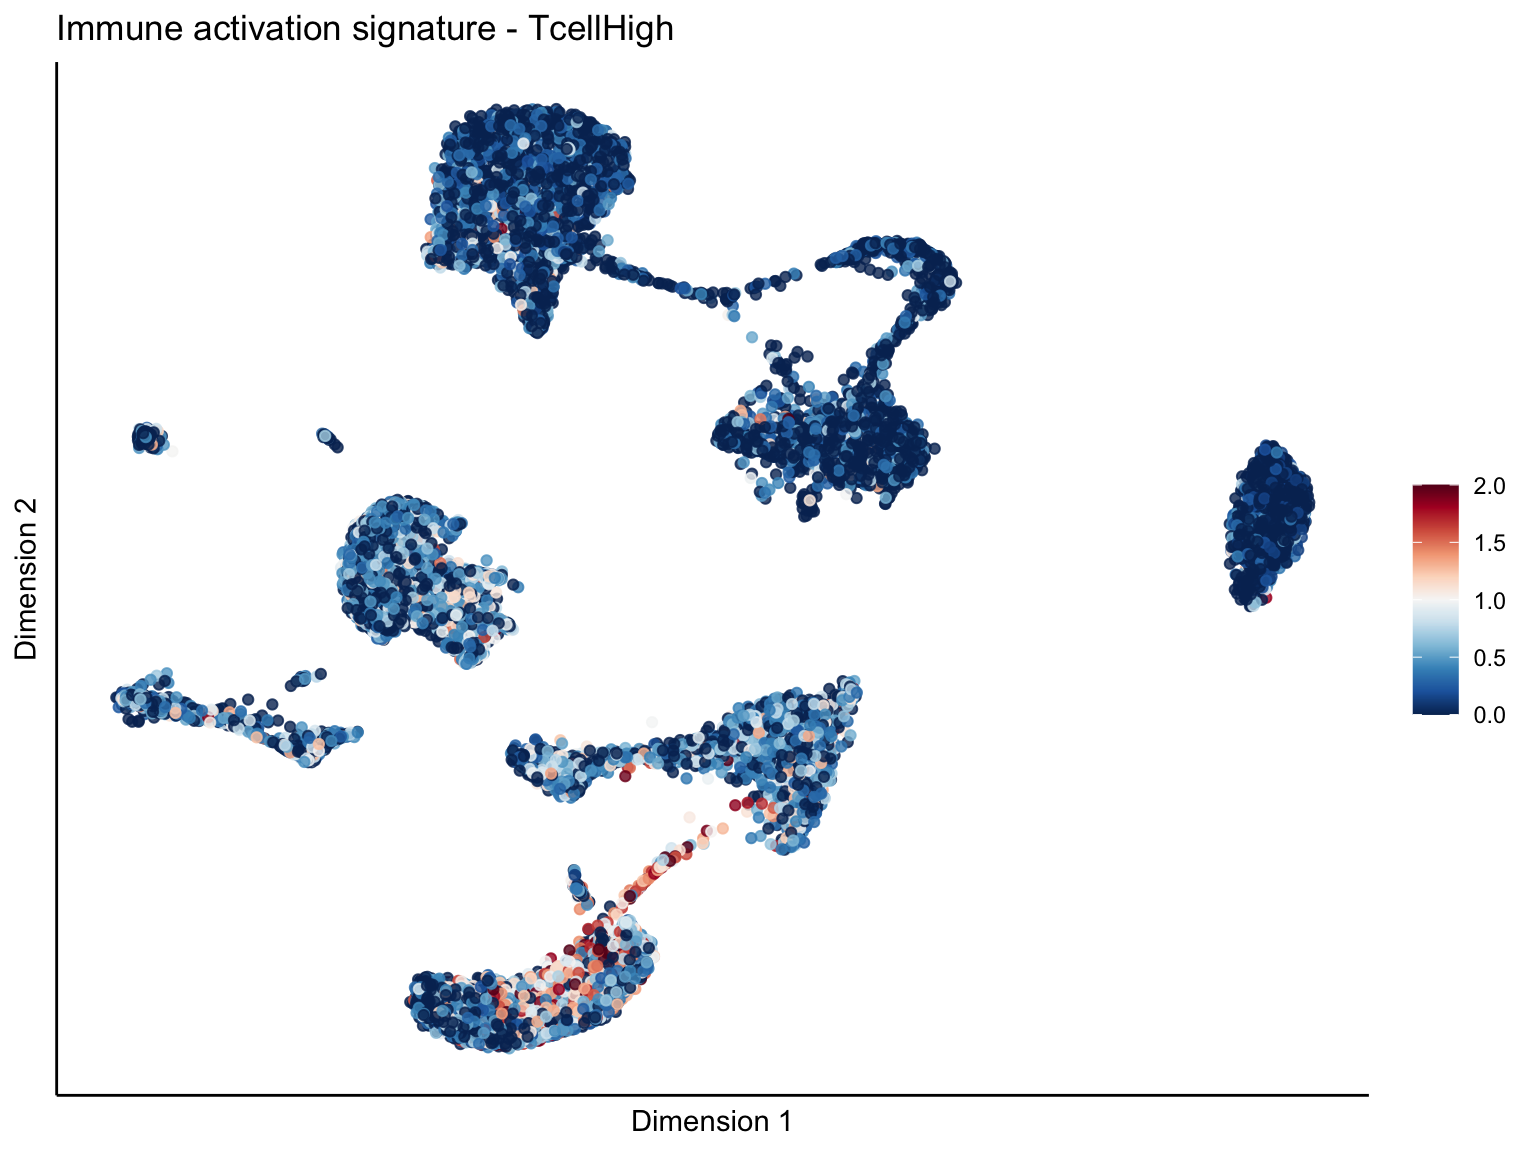
| Version | Author | Date |
|---|---|---|
| 66c2208 | mluetge | 2022-12-08 |
[[2]][[2]]
| Version | Author | Date |
|---|---|---|
| 66c2208 | mluetge | 2022-12-08 |
[[2]][[3]]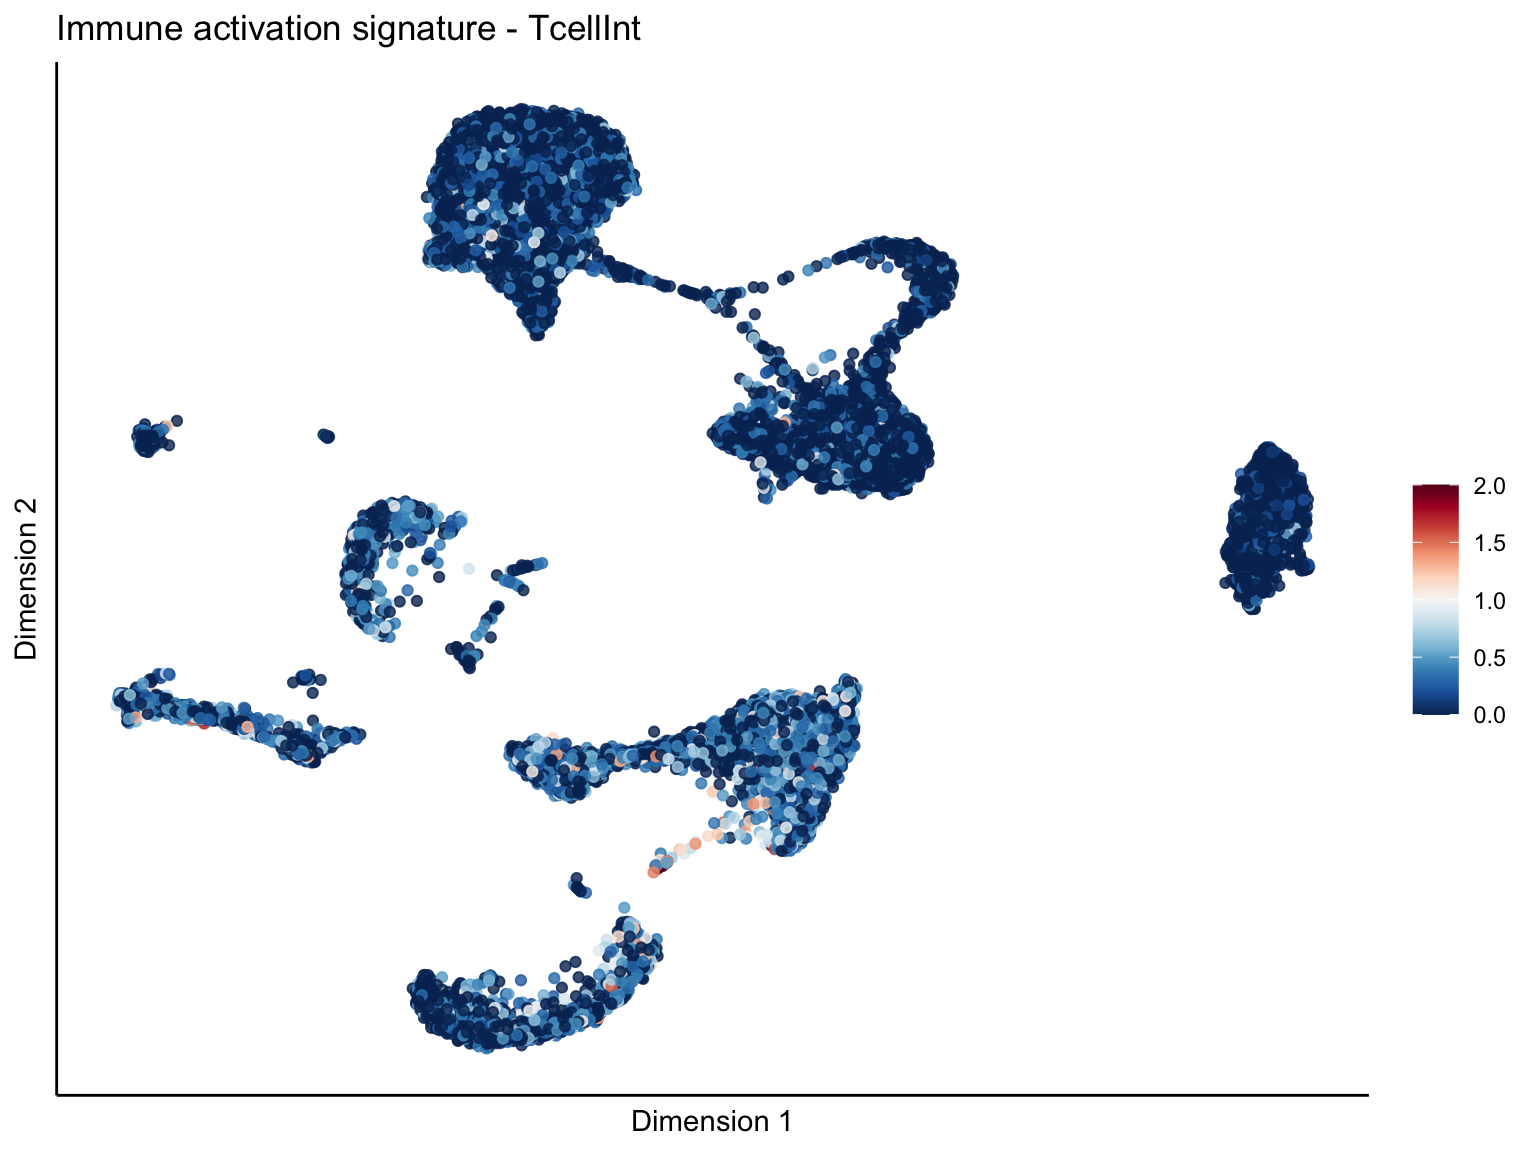
| Version | Author | Date |
|---|---|---|
| 66c2208 | mluetge | 2022-12-08 |
[[3]]
[[3]][[1]]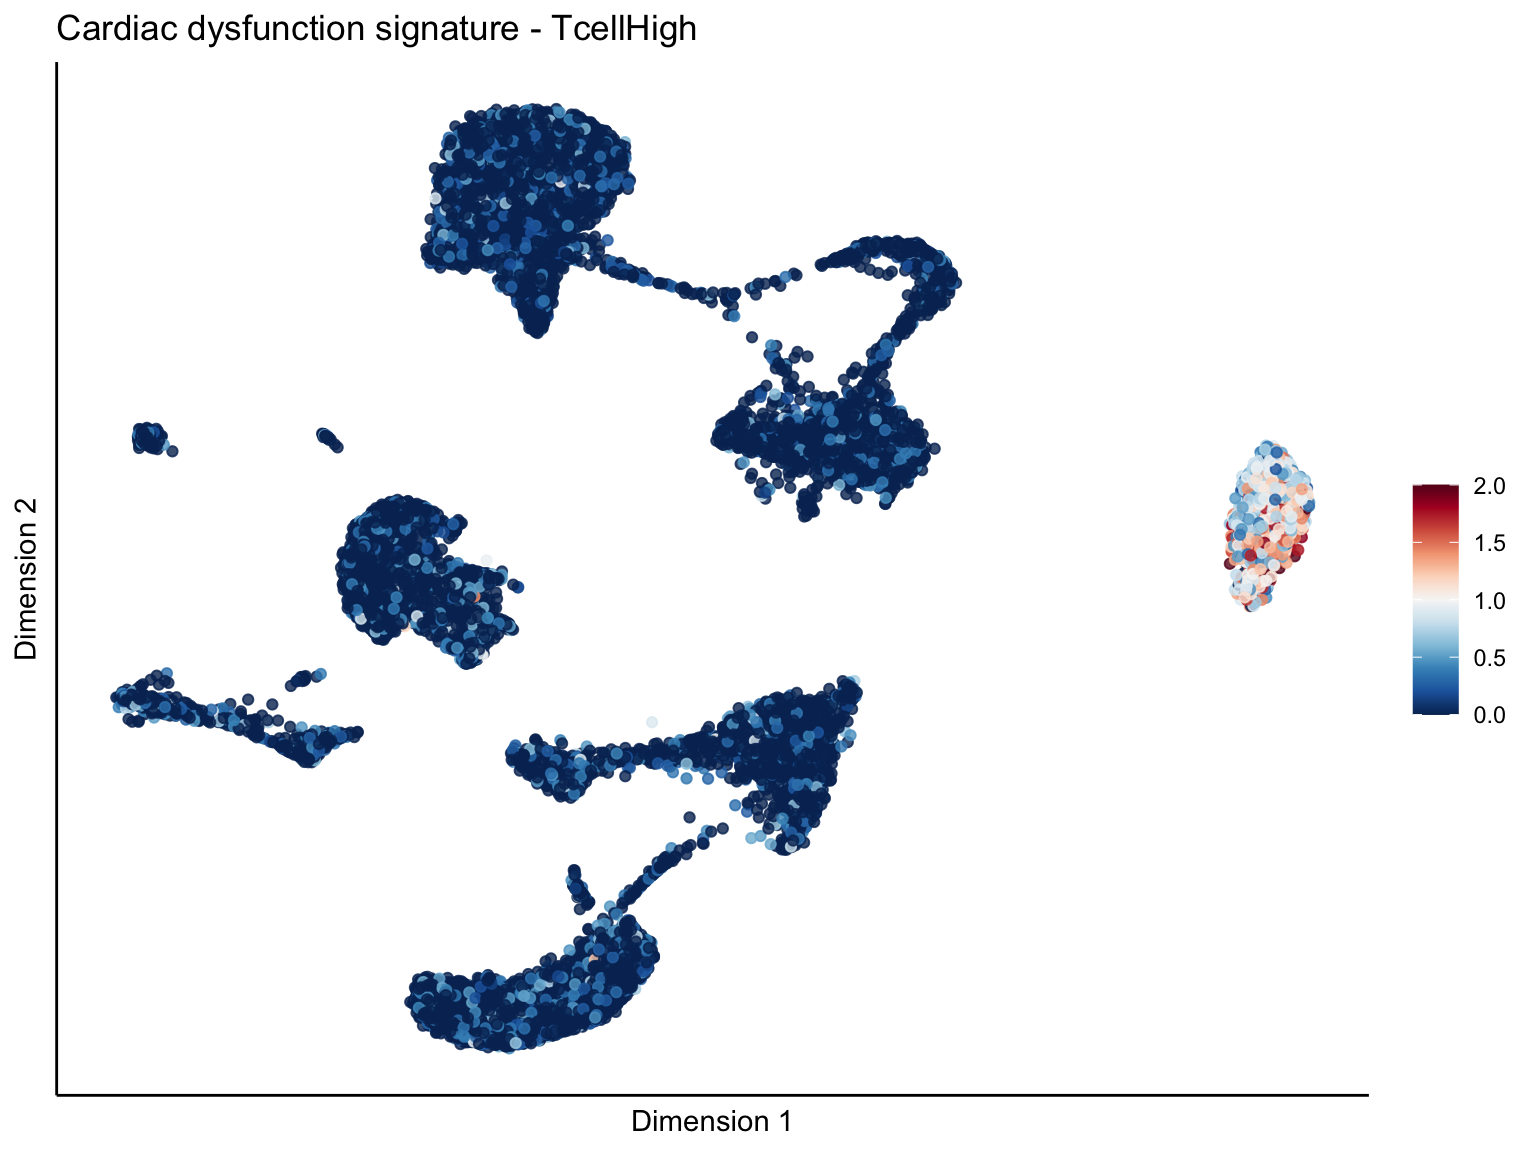
| Version | Author | Date |
|---|---|---|
| 66c2208 | mluetge | 2022-12-08 |
[[3]][[2]]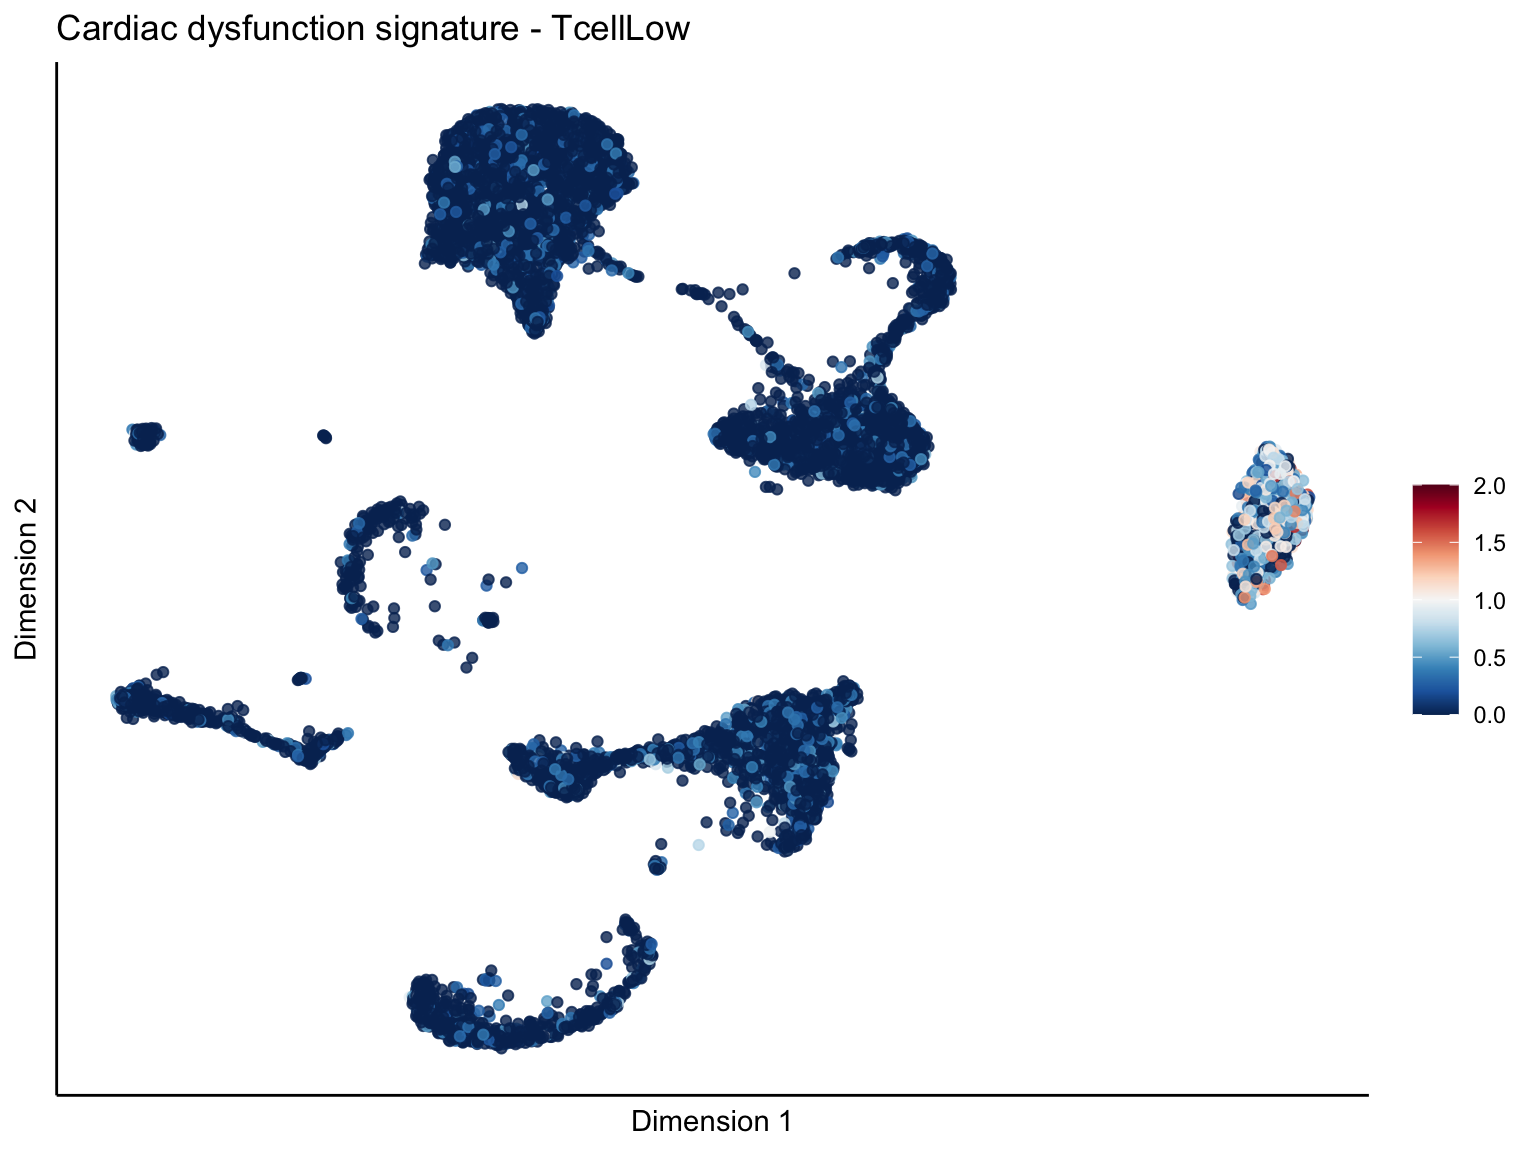
| Version | Author | Date |
|---|---|---|
| 66c2208 | mluetge | 2022-12-08 |
[[3]][[3]]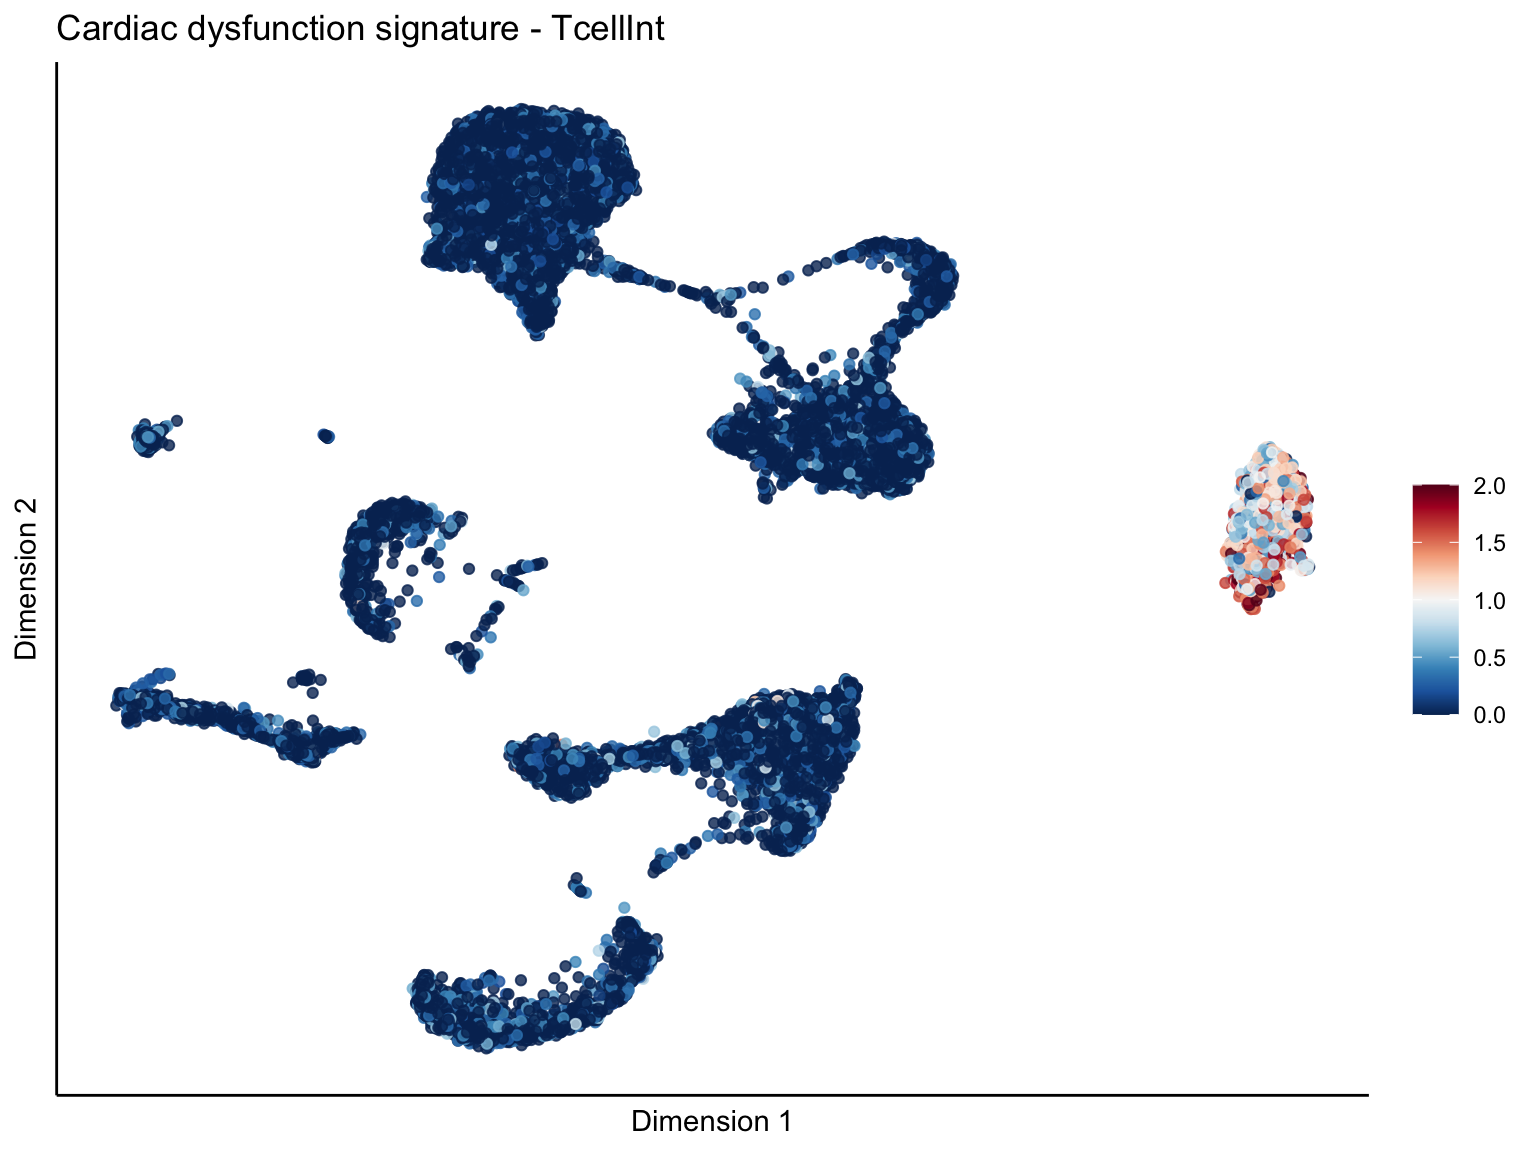
| Version | Author | Date |
|---|---|---|
| 66c2208 | mluetge | 2022-12-08 |
[[4]]
[[4]][[1]]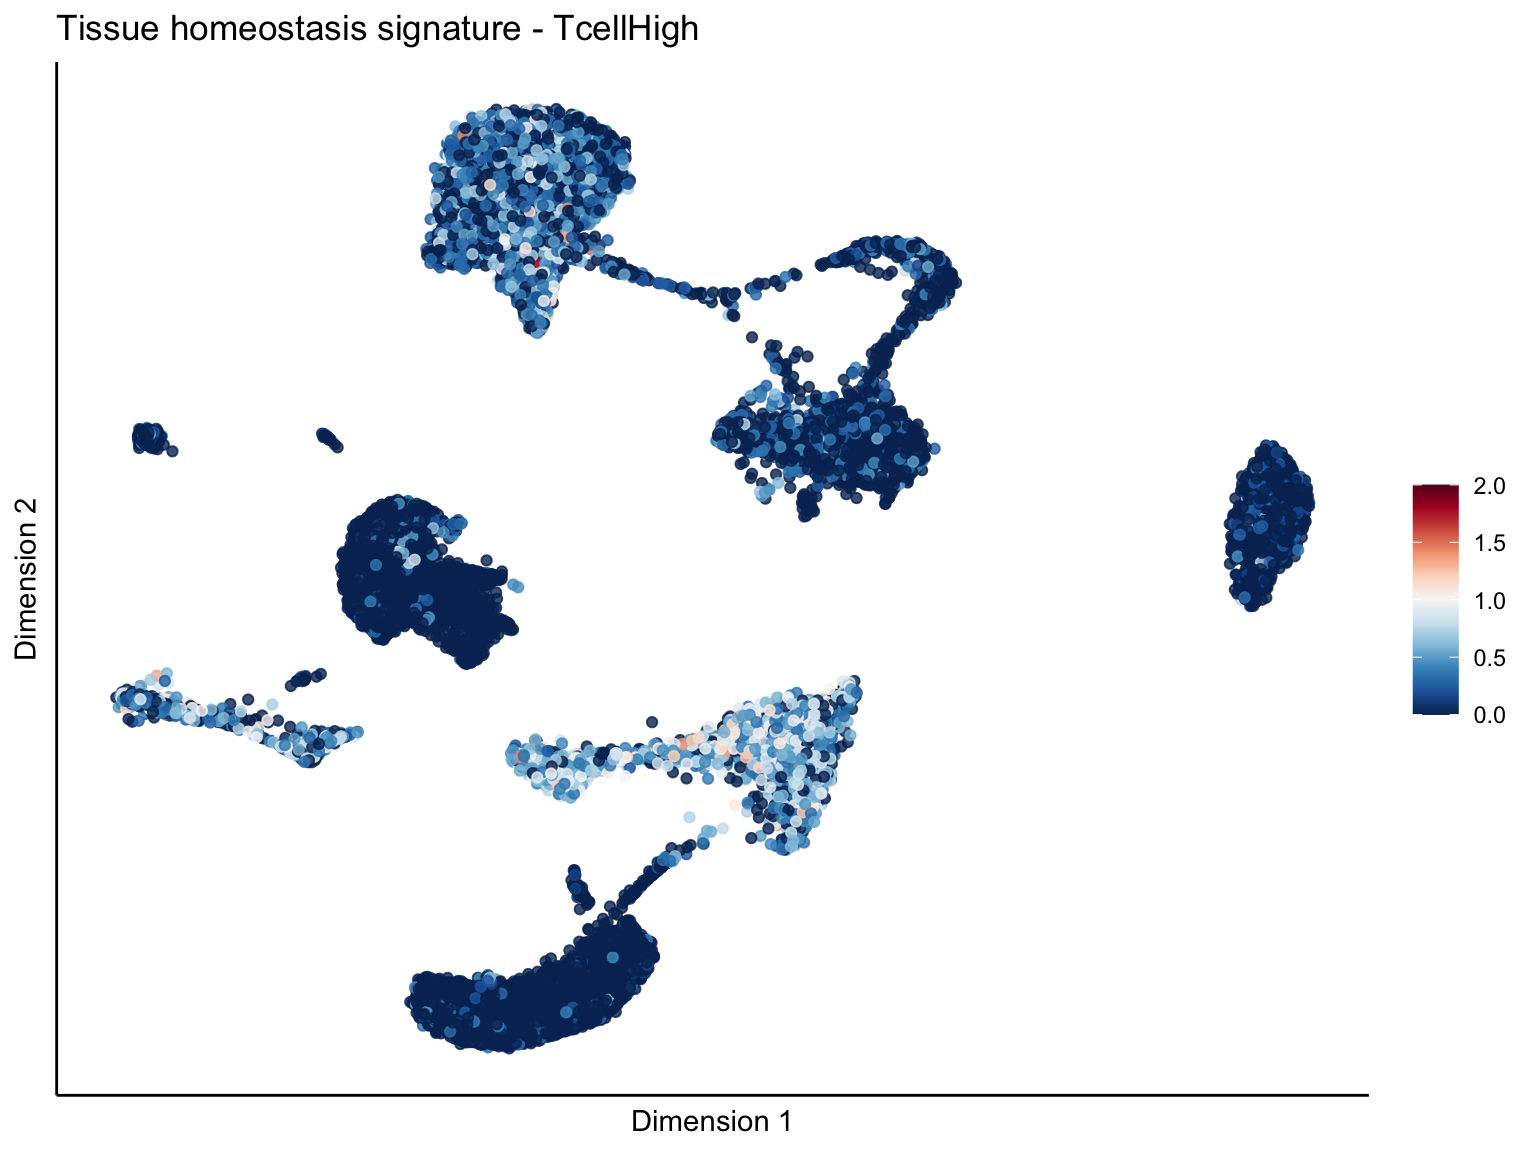
| Version | Author | Date |
|---|---|---|
| 66c2208 | mluetge | 2022-12-08 |
[[4]][[2]]
| Version | Author | Date |
|---|---|---|
| 66c2208 | mluetge | 2022-12-08 |
[[4]][[3]]
| Version | Author | Date |
|---|---|---|
| 66c2208 | mluetge | 2022-12-08 |
signature cut 1.5
cutOff <- 1.5
pal = colorRampPalette(rev(brewer.pal(11, 'RdBu')))
sc <- scale_colour_gradientn(colours = pal(100), limits=c(0, cutOff))

lapply(unique(signDat$signature), function(sign){
  signGenes <- signDat %>% dplyr::filter(signature == sign)
  sceSub <- sce[which(rownames(sce) %in% signGenes$geneID),]
  cntMat <- rowSums(t(as.matrix(sceSub@assays@data$logcounts)))/nrow(signGenes)
  sceSub$sign <- cntMat
  sceSub$sign[which(sceSub$sign > cutOff)] <- cutOff
  sceSub$sign[which(sceSub$sign < 0)] <- 0
  lapply(treatGrps, function(treat){
    sceSubT <- sceSub[, which(sceSub$TcellGrp == treat)]
    p <- visGroup_adapt(sceSubT, 'sign', dim_red = 'UMAP') +
    sc +
    guides(colour = guide_colourbar(title = '')) +
    ggtitle(paste0(sign, ' signature - ', treat)) +
    theme_classic() +
    theme(axis.text = element_blank(),
          axis.ticks = element_blank()) +
    labs(x='Dimension 1', y='Dimension 2')
    p
  })
})
[[1]]
[[1]][[1]]
| Version | Author | Date |
|---|---|---|
| 66c2208 | mluetge | 2022-12-08 |
[[1]][[2]]
| Version | Author | Date |
|---|---|---|
| 66c2208 | mluetge | 2022-12-08 |
[[1]][[3]]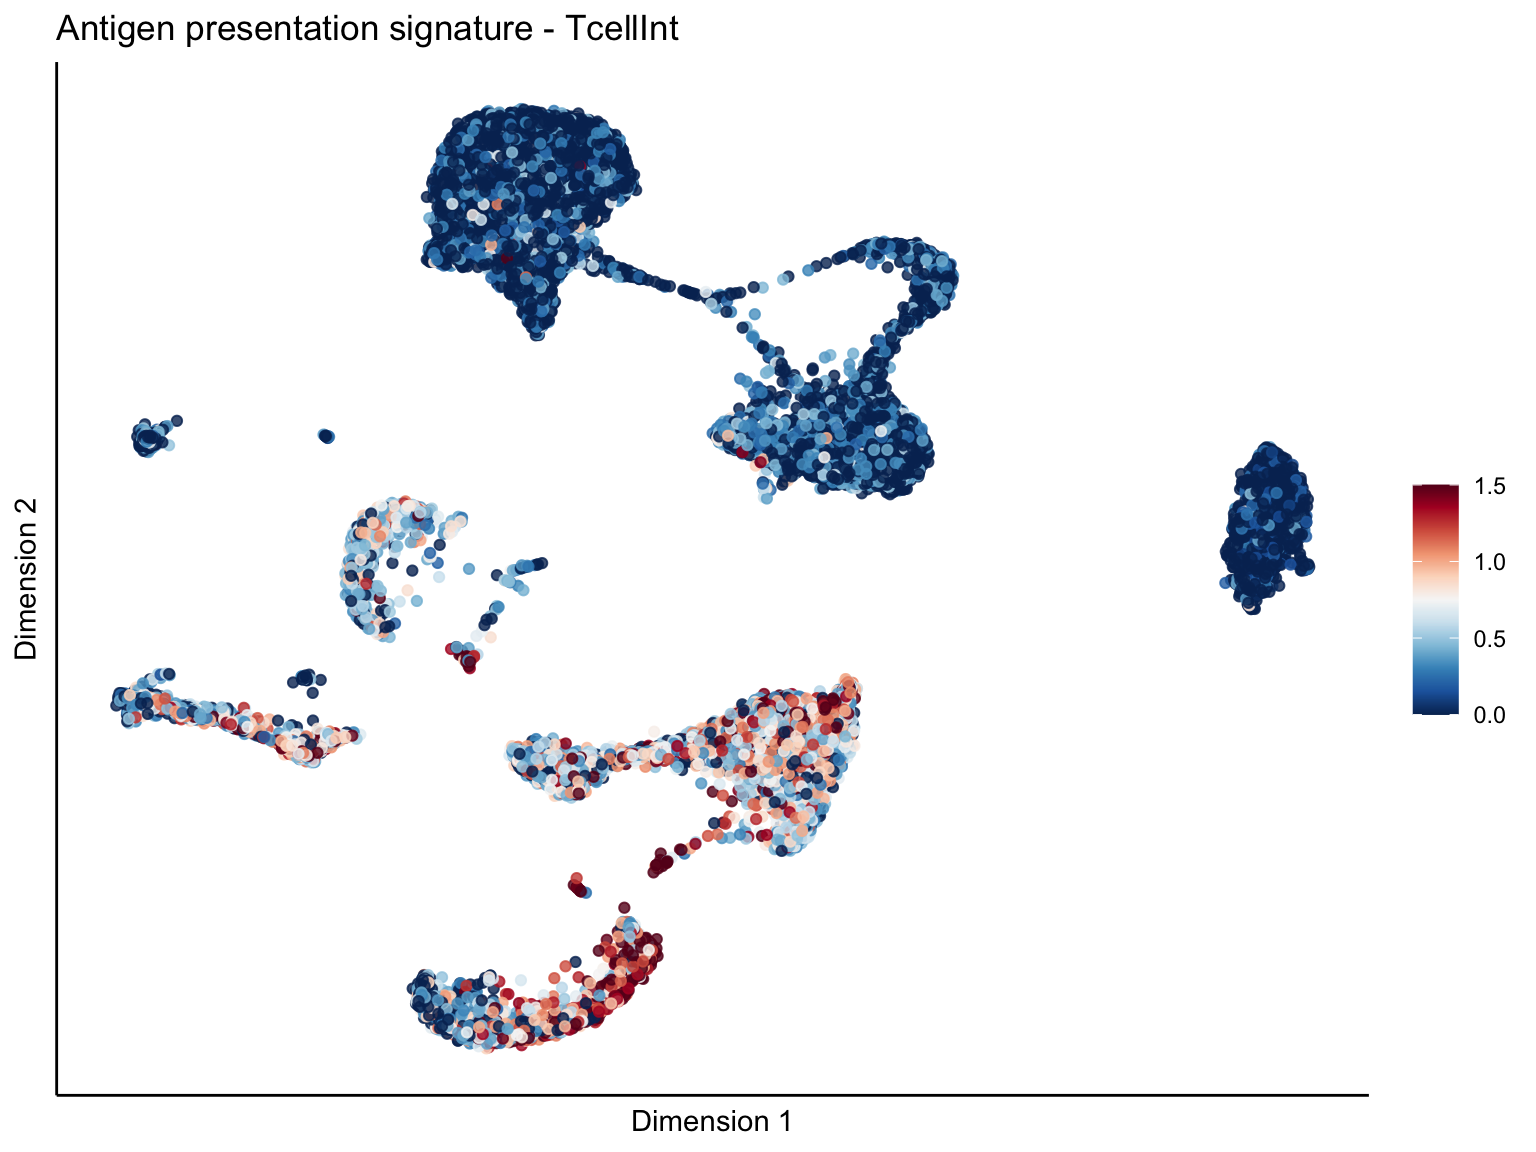
| Version | Author | Date |
|---|---|---|
| 66c2208 | mluetge | 2022-12-08 |
[[2]]
[[2]][[1]]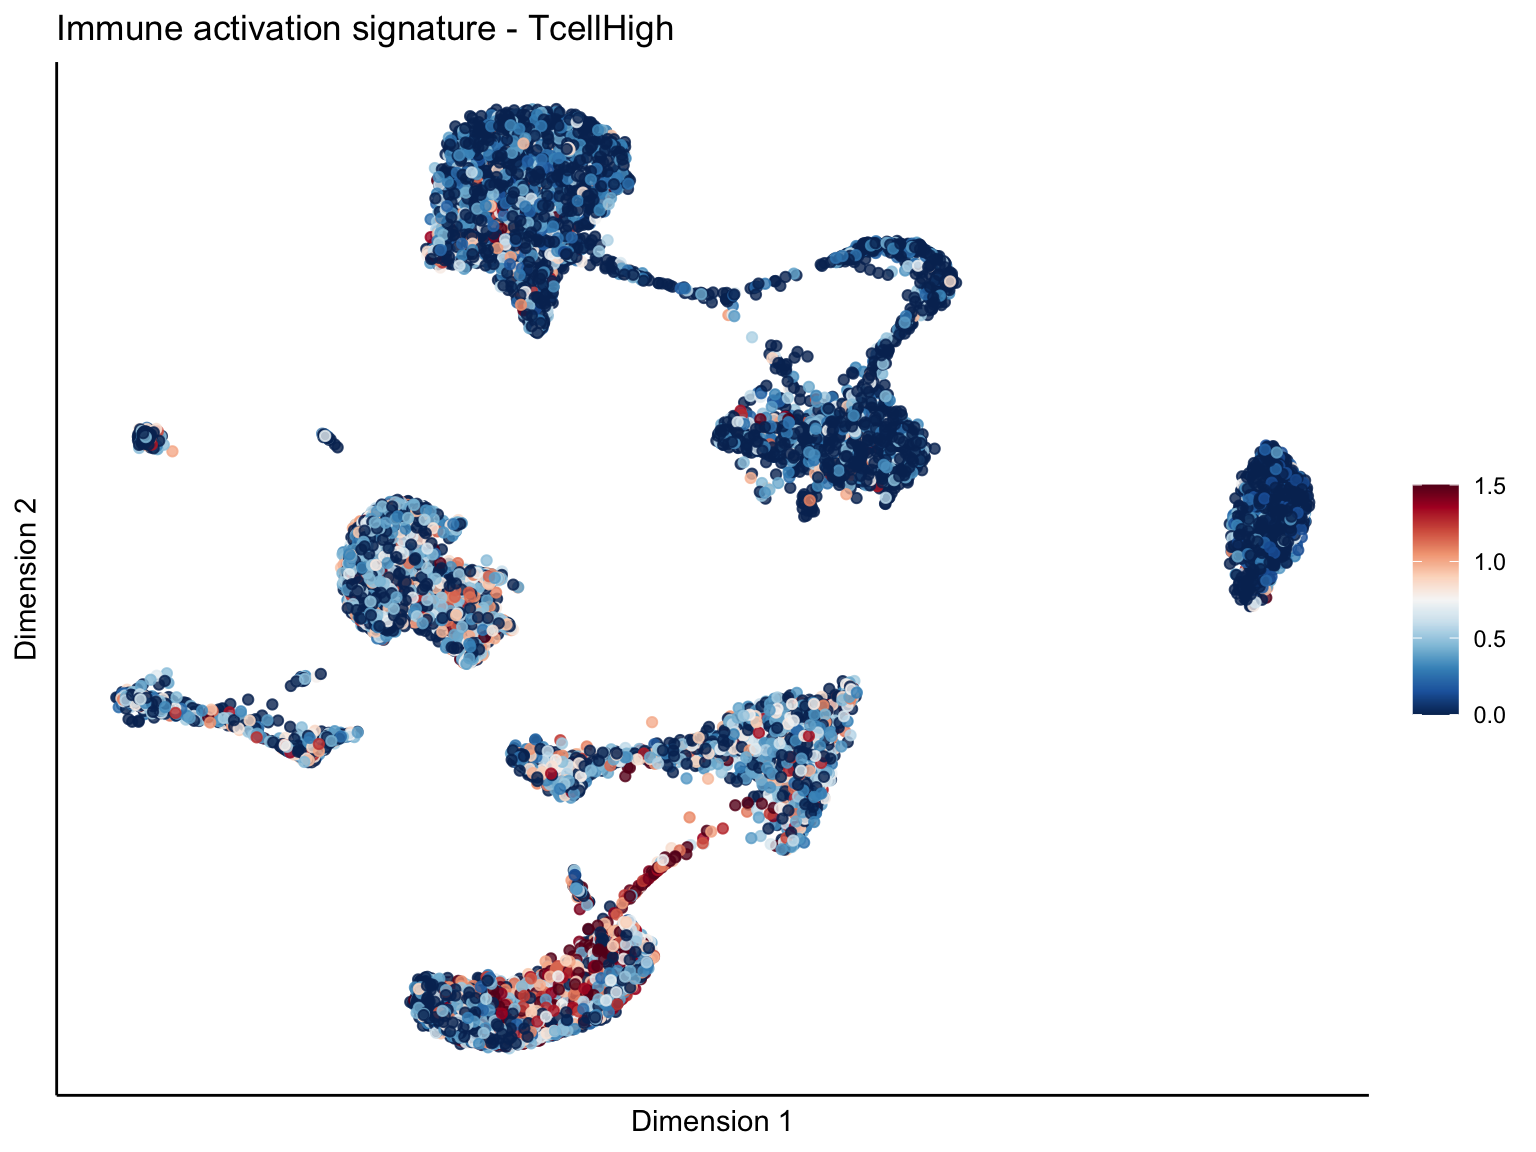
| Version | Author | Date |
|---|---|---|
| 66c2208 | mluetge | 2022-12-08 |
[[2]][[2]]
| Version | Author | Date |
|---|---|---|
| 66c2208 | mluetge | 2022-12-08 |
[[2]][[3]]
| Version | Author | Date |
|---|---|---|
| 66c2208 | mluetge | 2022-12-08 |
[[3]]
[[3]][[1]]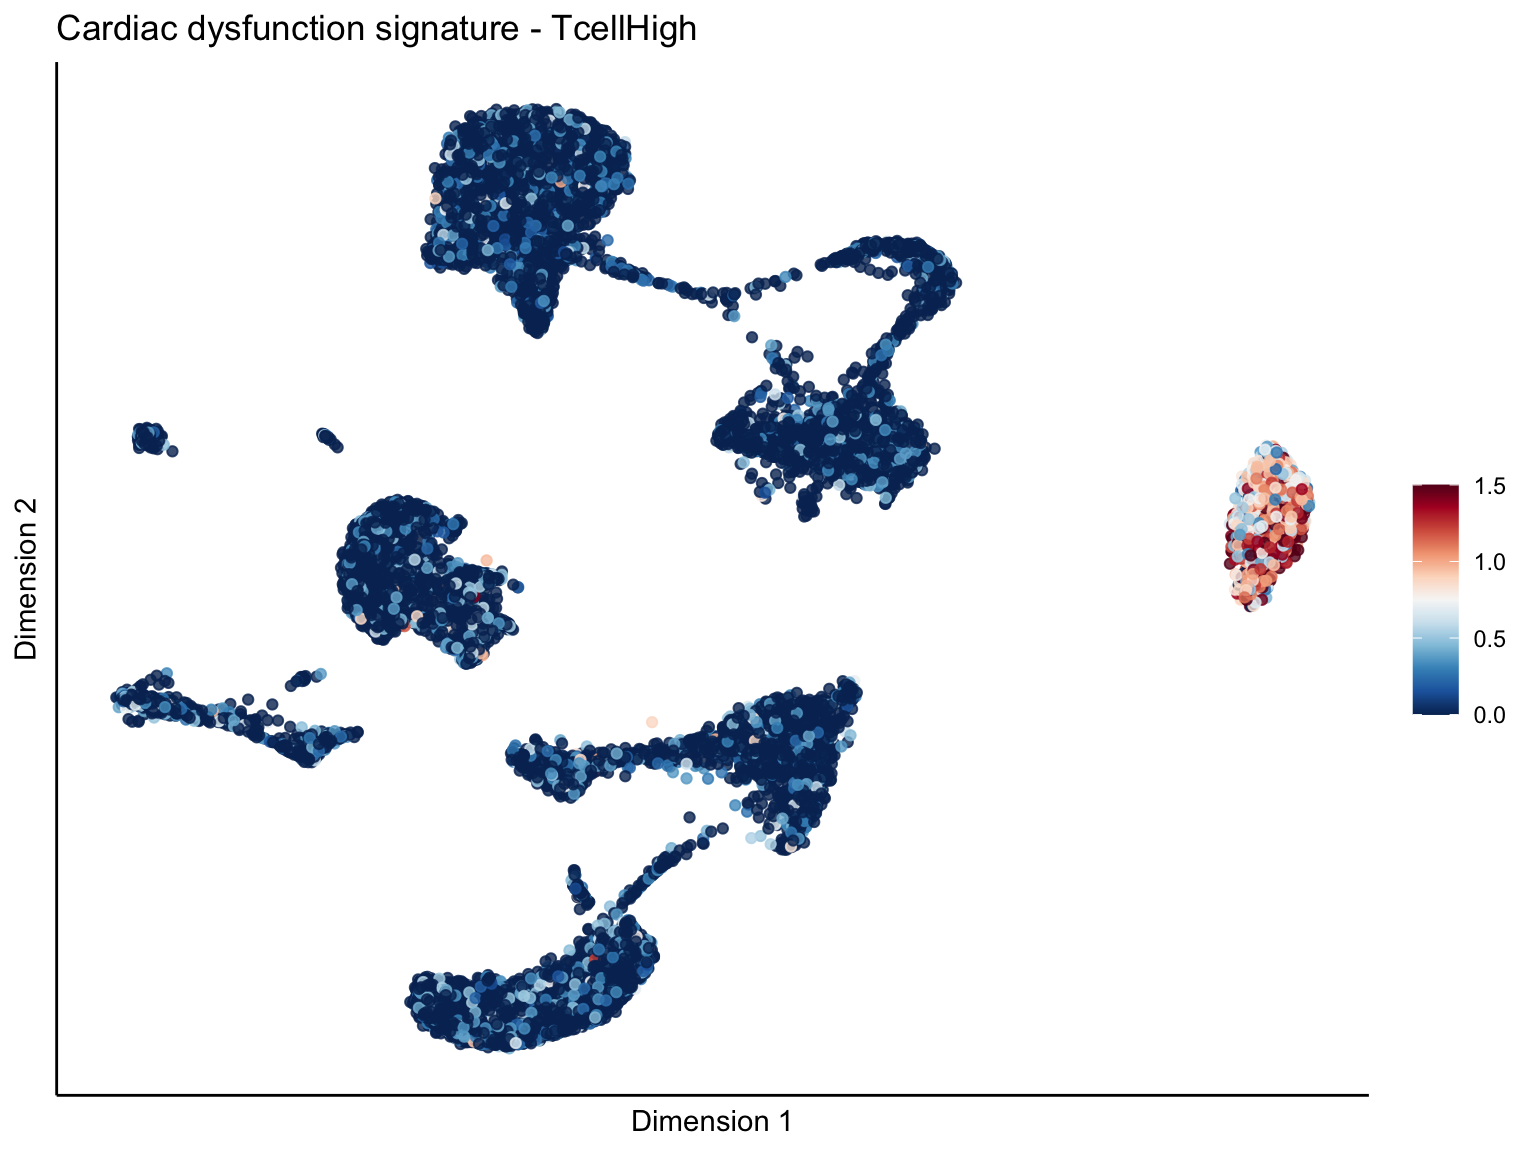
| Version | Author | Date |
|---|---|---|
| 66c2208 | mluetge | 2022-12-08 |
[[3]][[2]]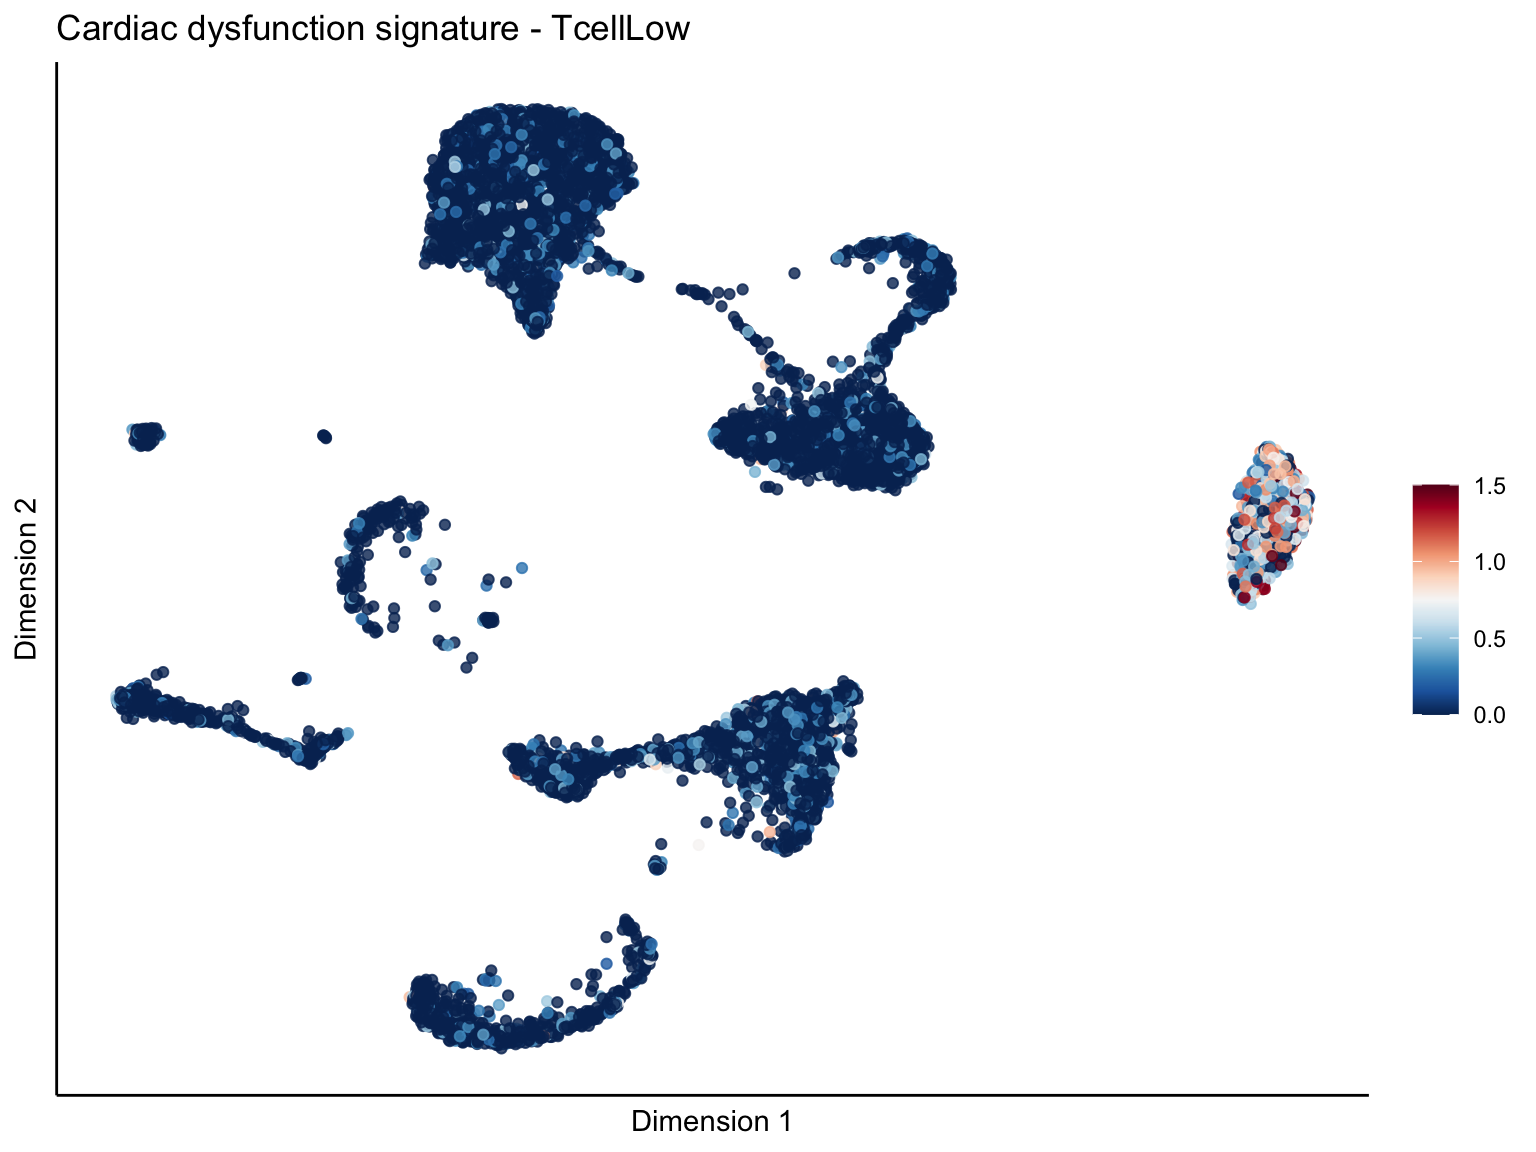
| Version | Author | Date |
|---|---|---|
| 66c2208 | mluetge | 2022-12-08 |
[[3]][[3]]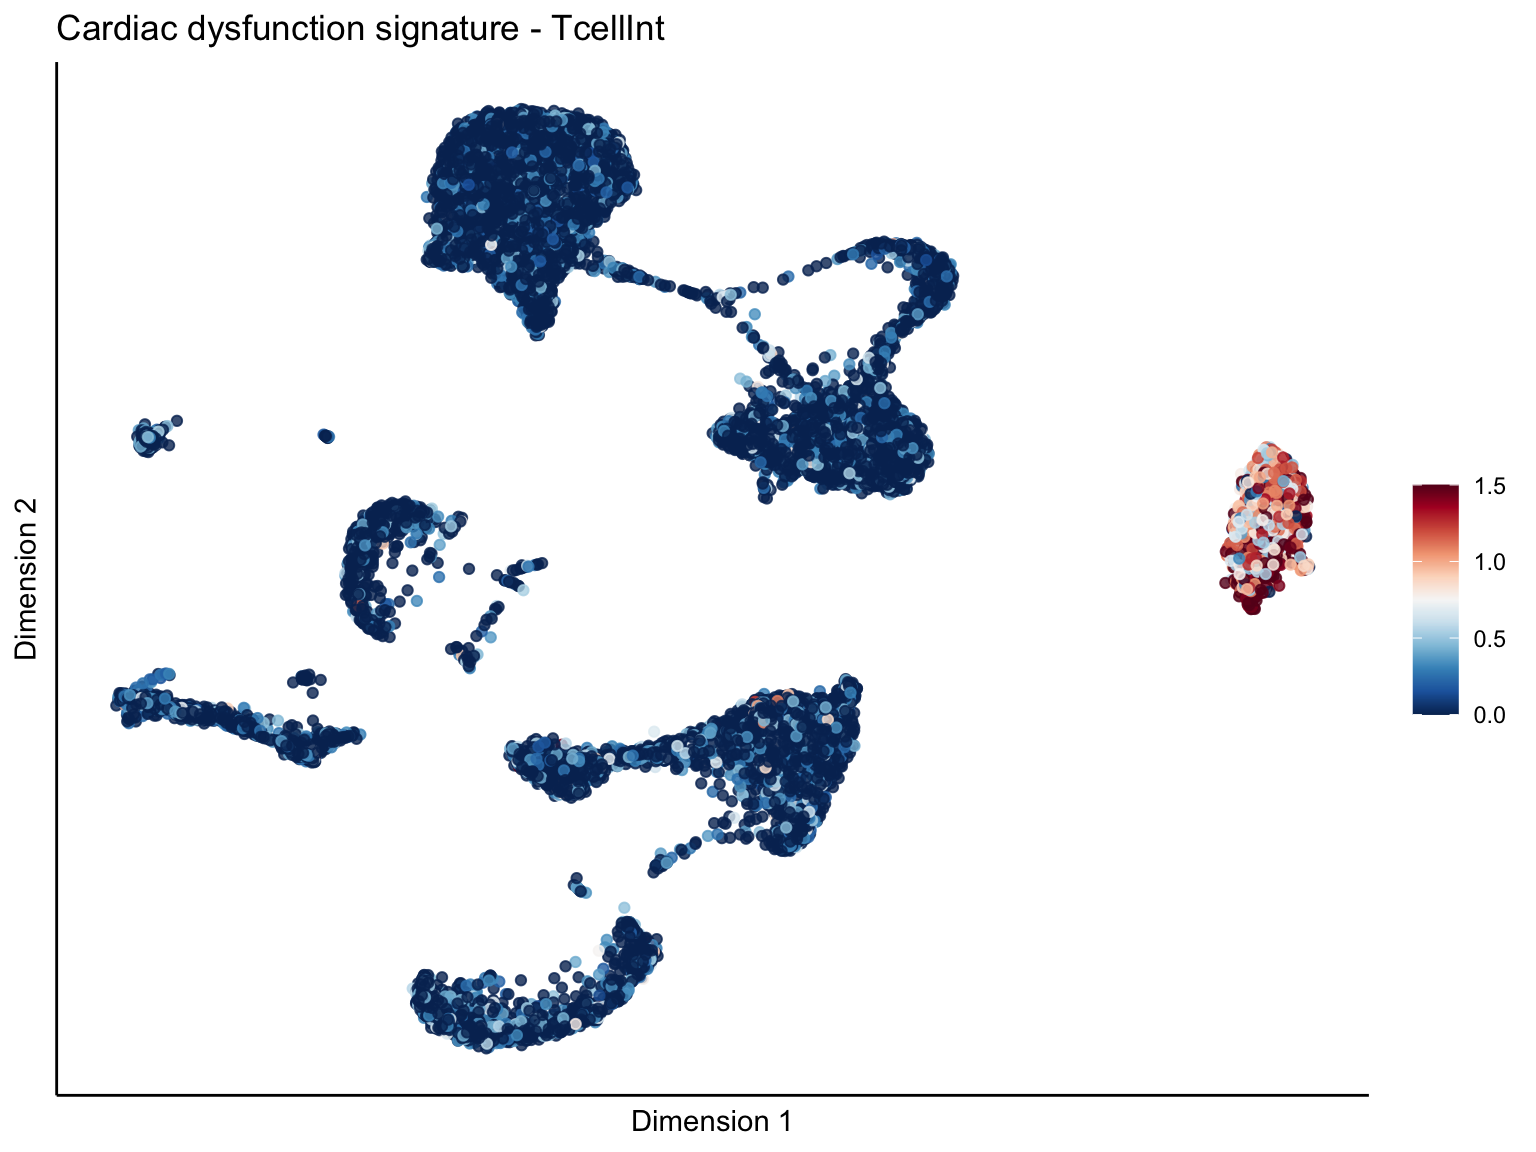
| Version | Author | Date |
|---|---|---|
| 66c2208 | mluetge | 2022-12-08 |
[[4]]
[[4]][[1]]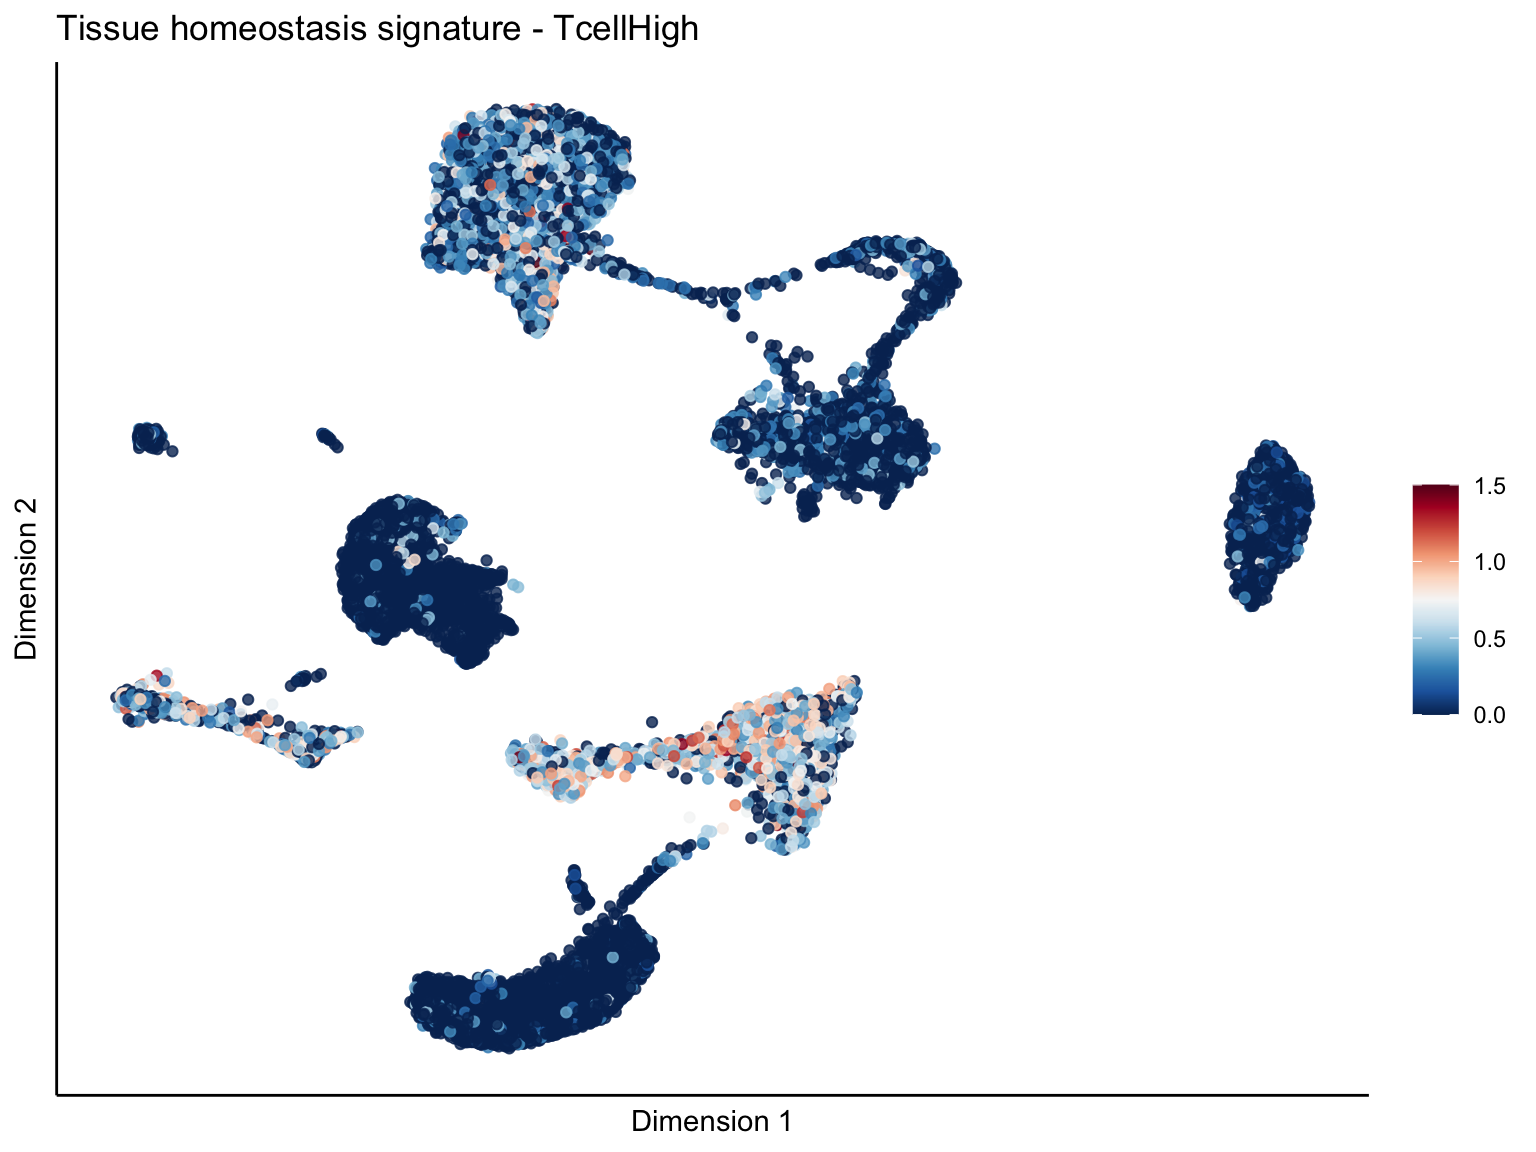
| Version | Author | Date |
|---|---|---|
| 66c2208 | mluetge | 2022-12-08 |
[[4]][[2]]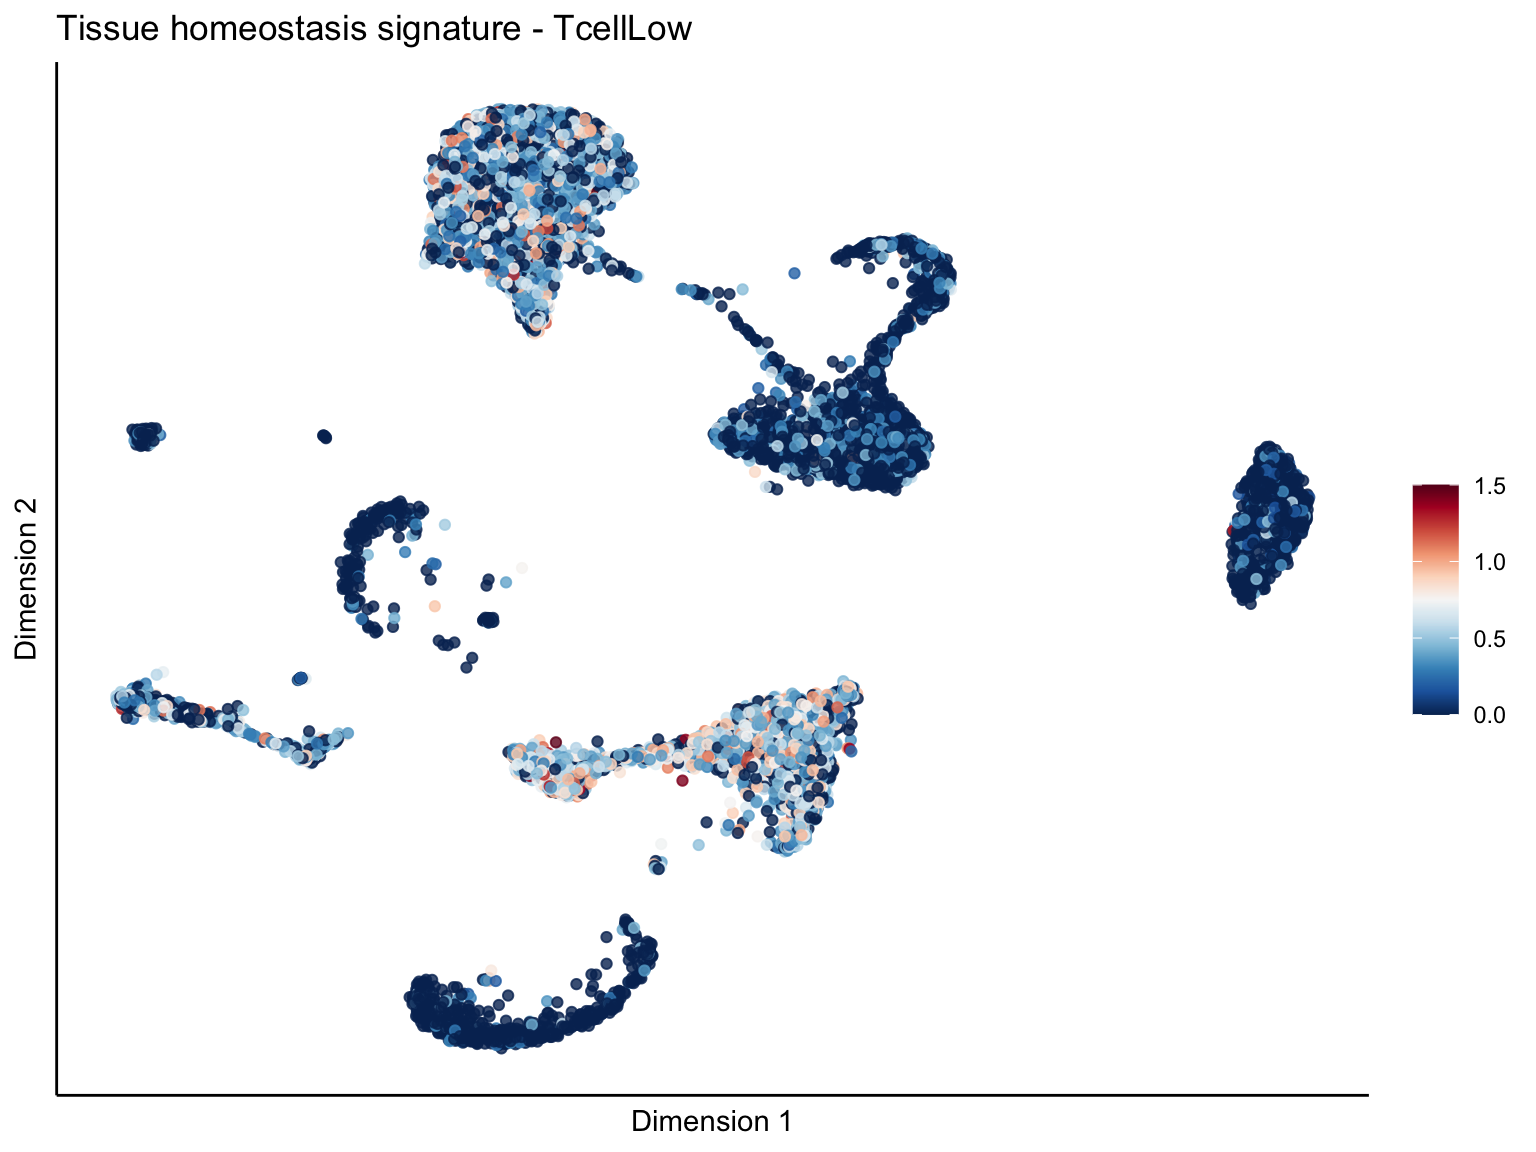
| Version | Author | Date |
|---|---|---|
| 66c2208 | mluetge | 2022-12-08 |
[[4]][[3]]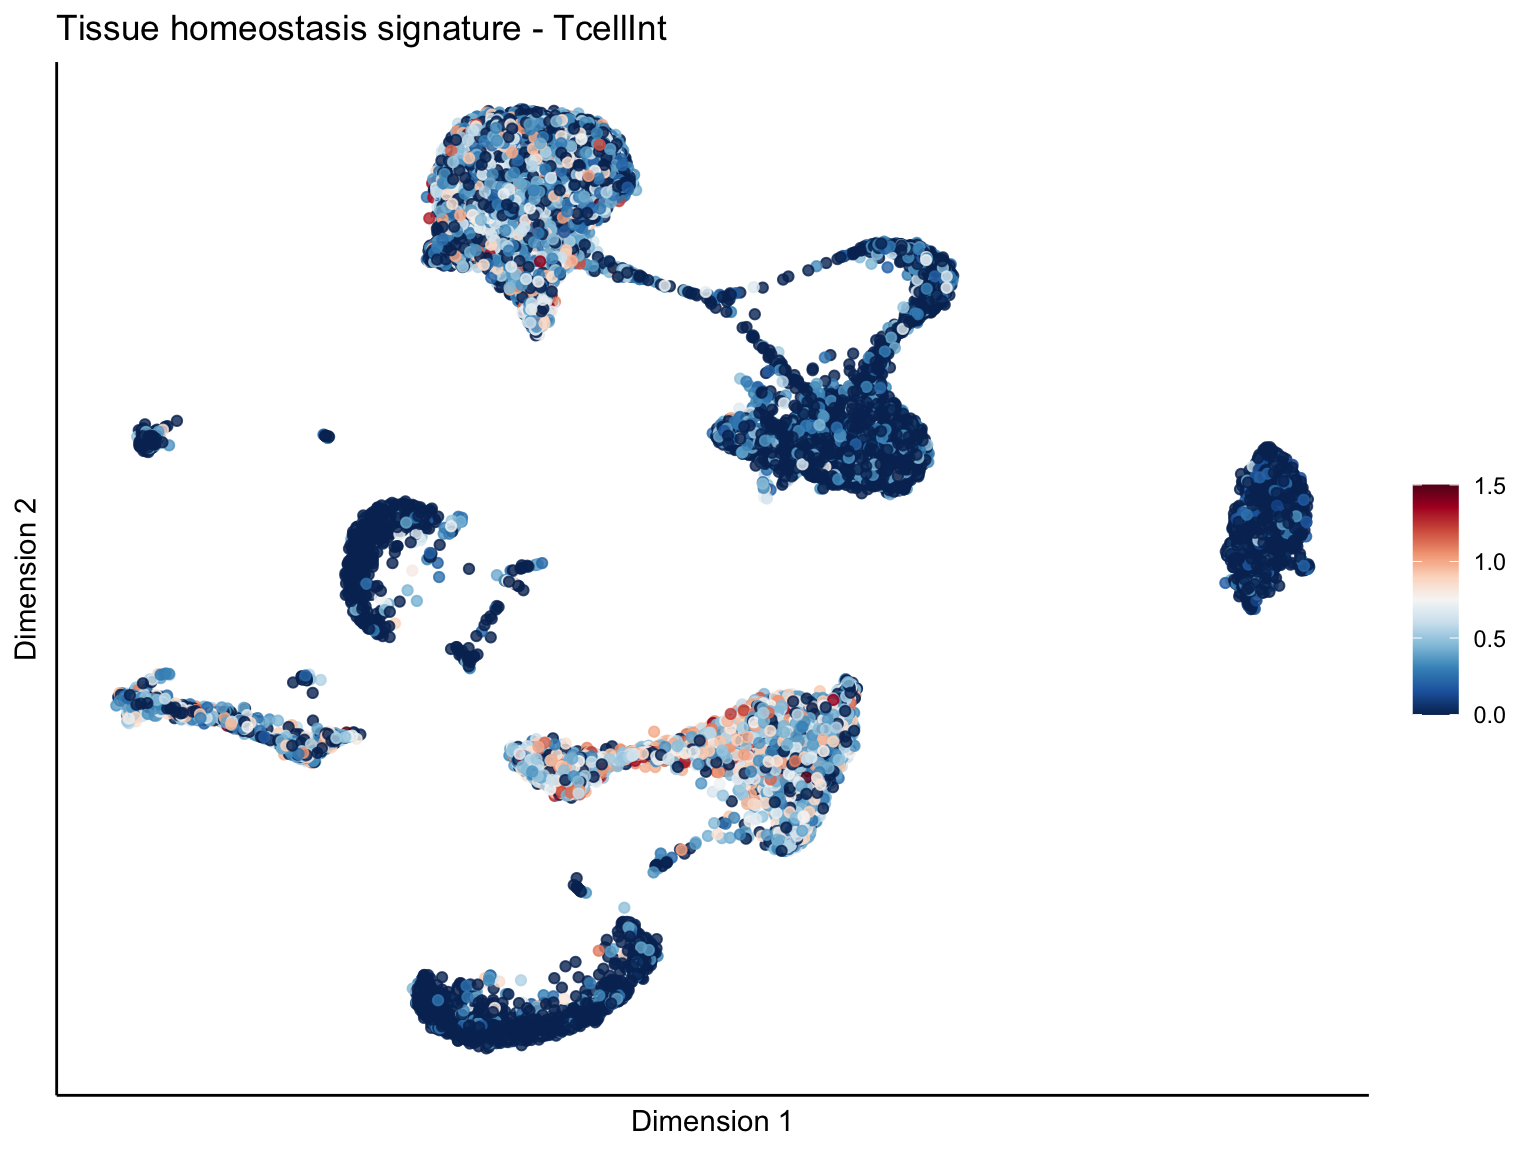
| Version | Author | Date |
|---|---|---|
| 66c2208 | mluetge | 2022-12-08 |
pal = viridis(100)
sc <- scale_colour_gradientn(colours = pal, limits=c(0, cutOff))
lapply(unique(signDat$signature), function(sign){
  signGenes <- signDat %>% dplyr::filter(signature == sign)
  sceSub <- sce[which(rownames(sce) %in% signGenes$geneID),]
  cntMat <- rowSums(t(as.matrix(sceSub@assays@data$logcounts)))/nrow(signGenes)
  sceSub$sign <- cntMat
  sceSub$sign[which(sceSub$sign > cutOff)] <- cutOff
  sceSub$sign[which(sceSub$sign < 0)] <- 0
  lapply(treatGrps, function(treat){
    sceSubT <- sceSub[, which(sceSub$TcellGrp == treat)]
    p <- visGroup_adapt(sceSubT, 'sign', dim_red = 'UMAP') +
    sc +
    guides(colour = guide_colourbar(title = '')) +
    ggtitle(paste0(sign, ' signature - ', treat)) +
    theme_classic() +
    theme(axis.text = element_blank(),
          axis.ticks = element_blank()) +
    labs(x='Dimension 1', y='Dimension 2')
    p
  })
})
[[1]]
[[1]][[1]]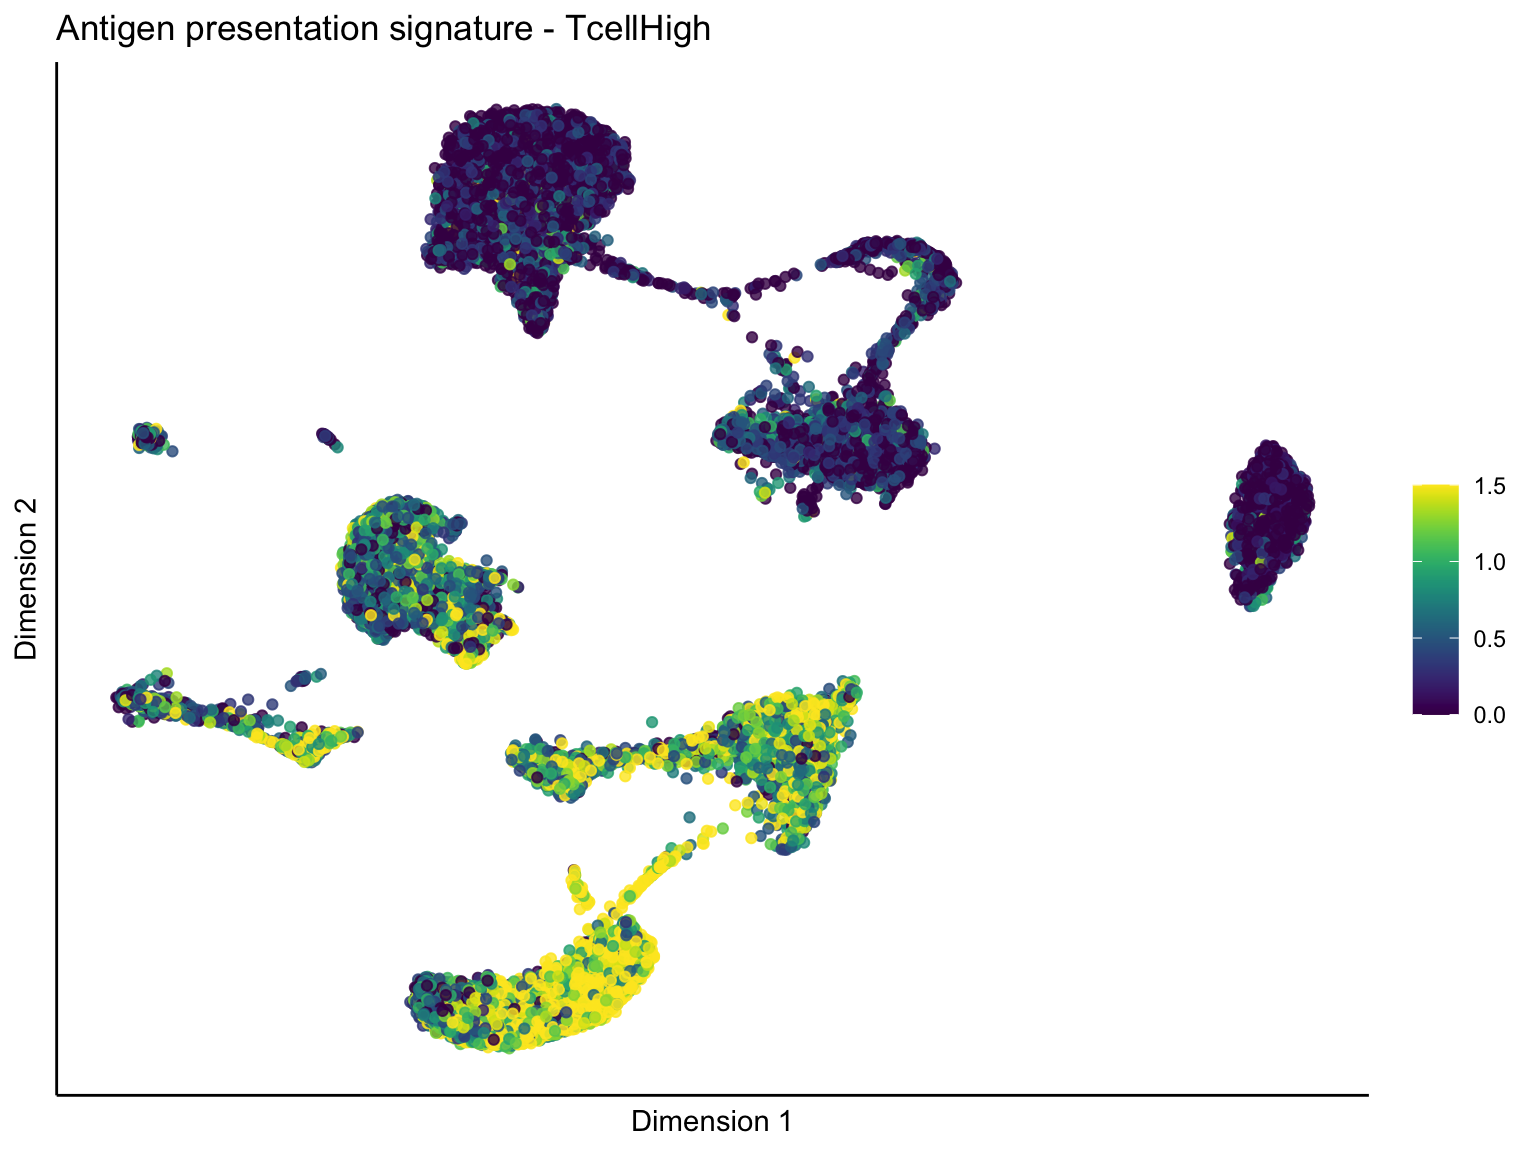
| Version | Author | Date |
|---|---|---|
| 66c2208 | mluetge | 2022-12-08 |
[[1]][[2]]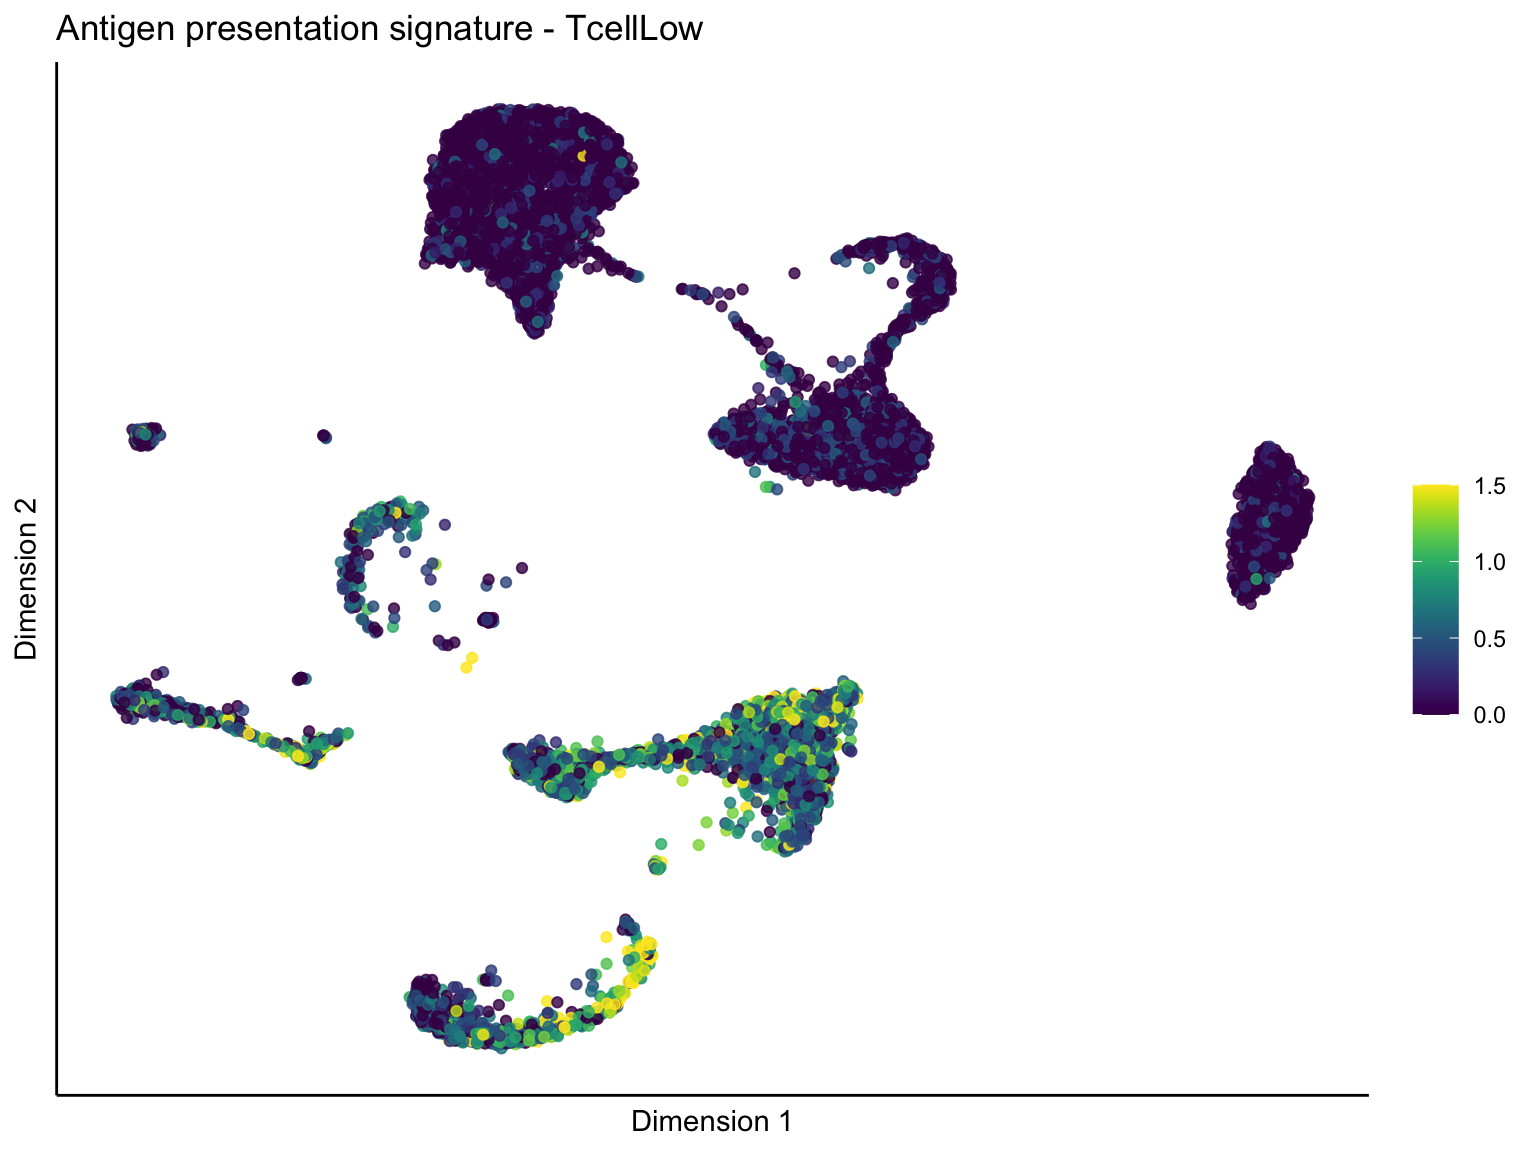
| Version | Author | Date |
|---|---|---|
| 66c2208 | mluetge | 2022-12-08 |
[[1]][[3]]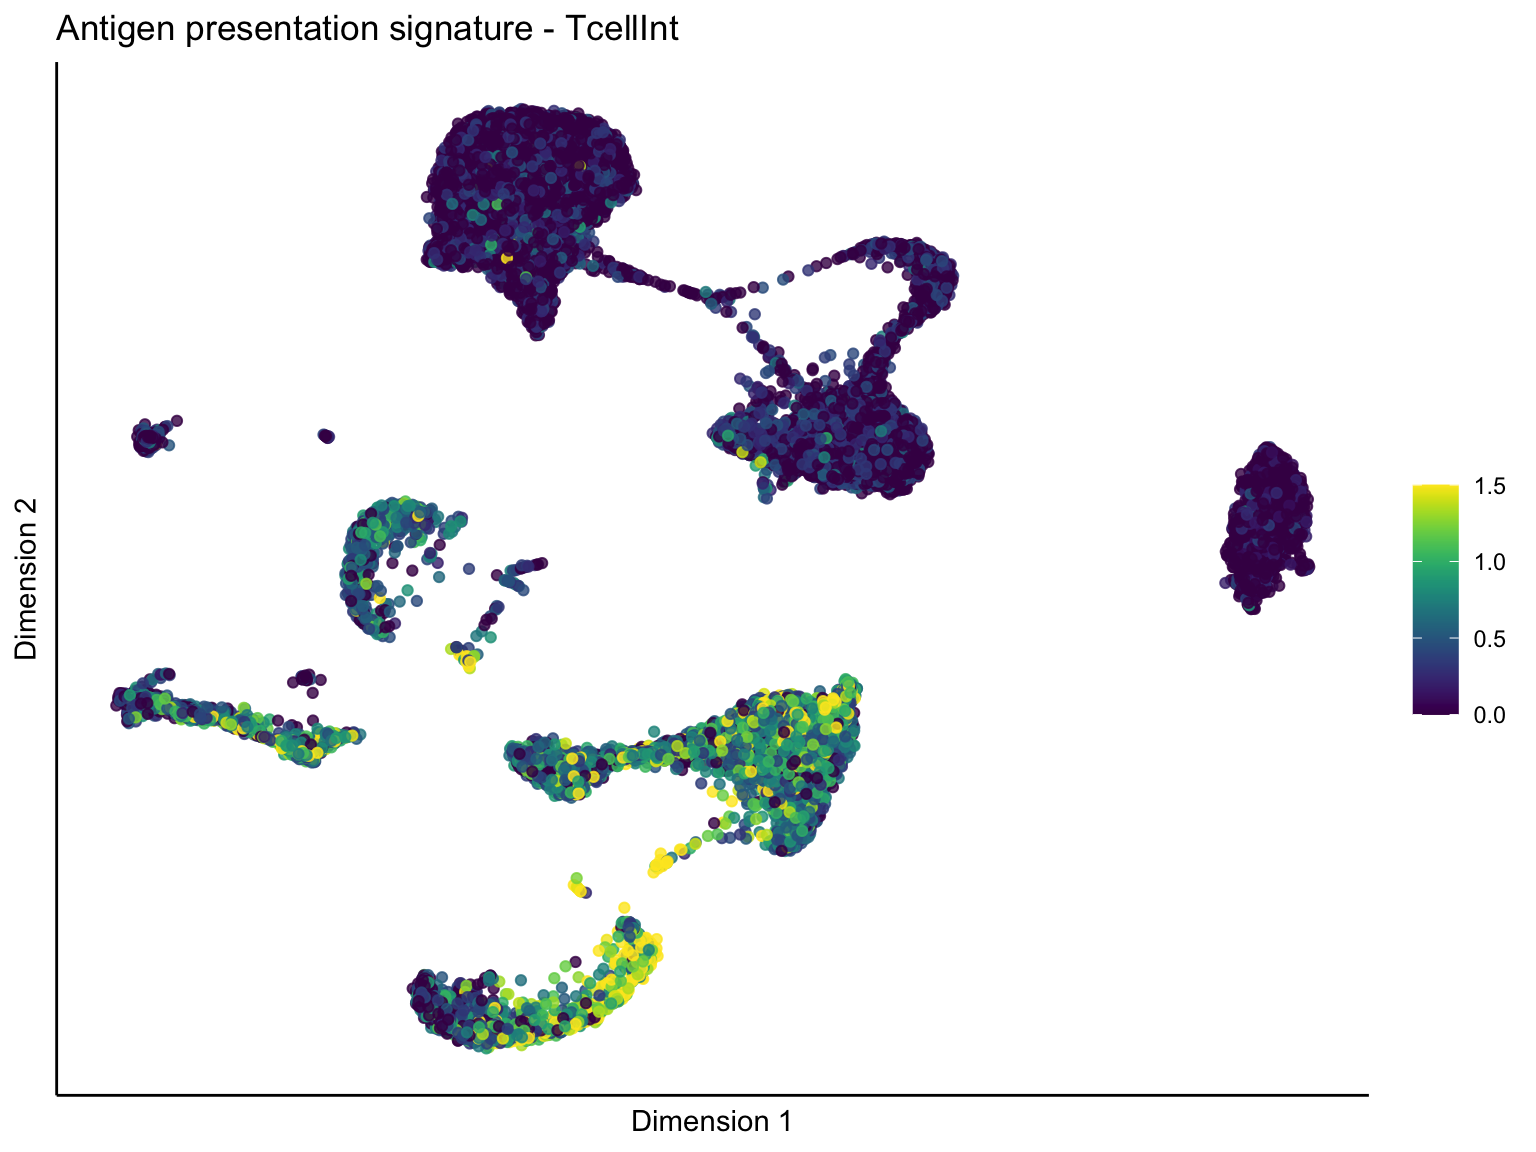
| Version | Author | Date |
|---|---|---|
| 66c2208 | mluetge | 2022-12-08 |
[[2]]
[[2]][[1]]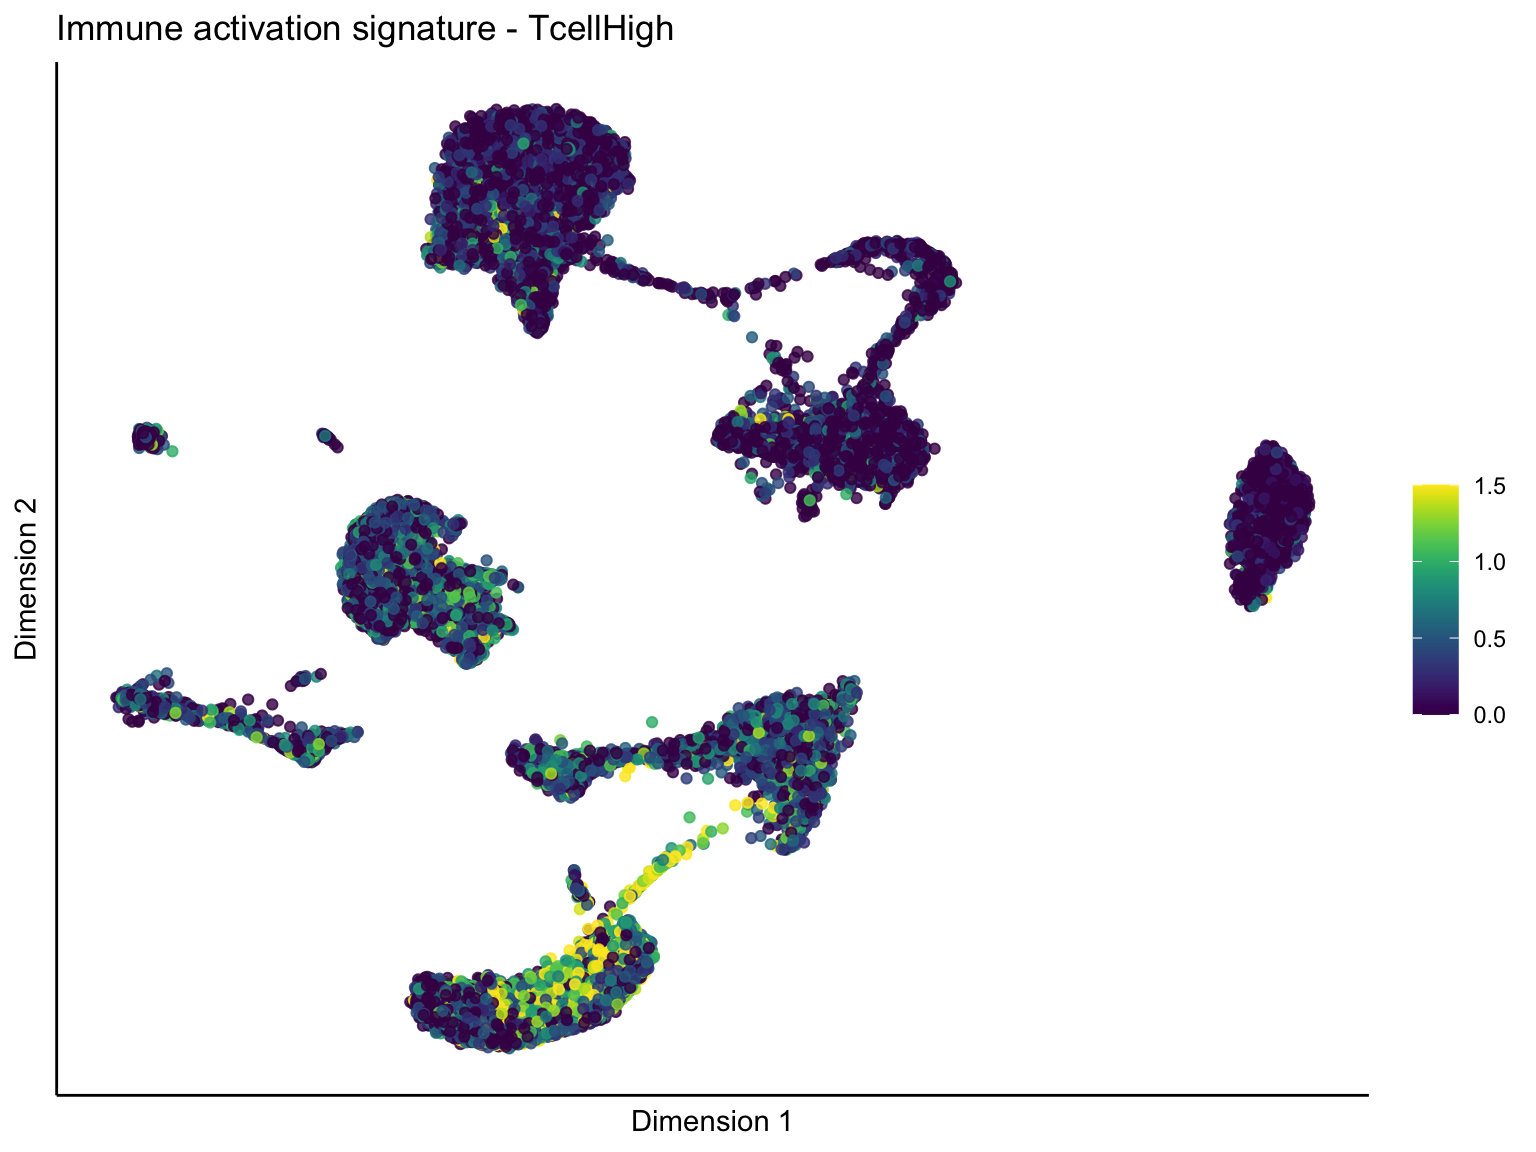
| Version | Author | Date |
|---|---|---|
| 66c2208 | mluetge | 2022-12-08 |
[[2]][[2]]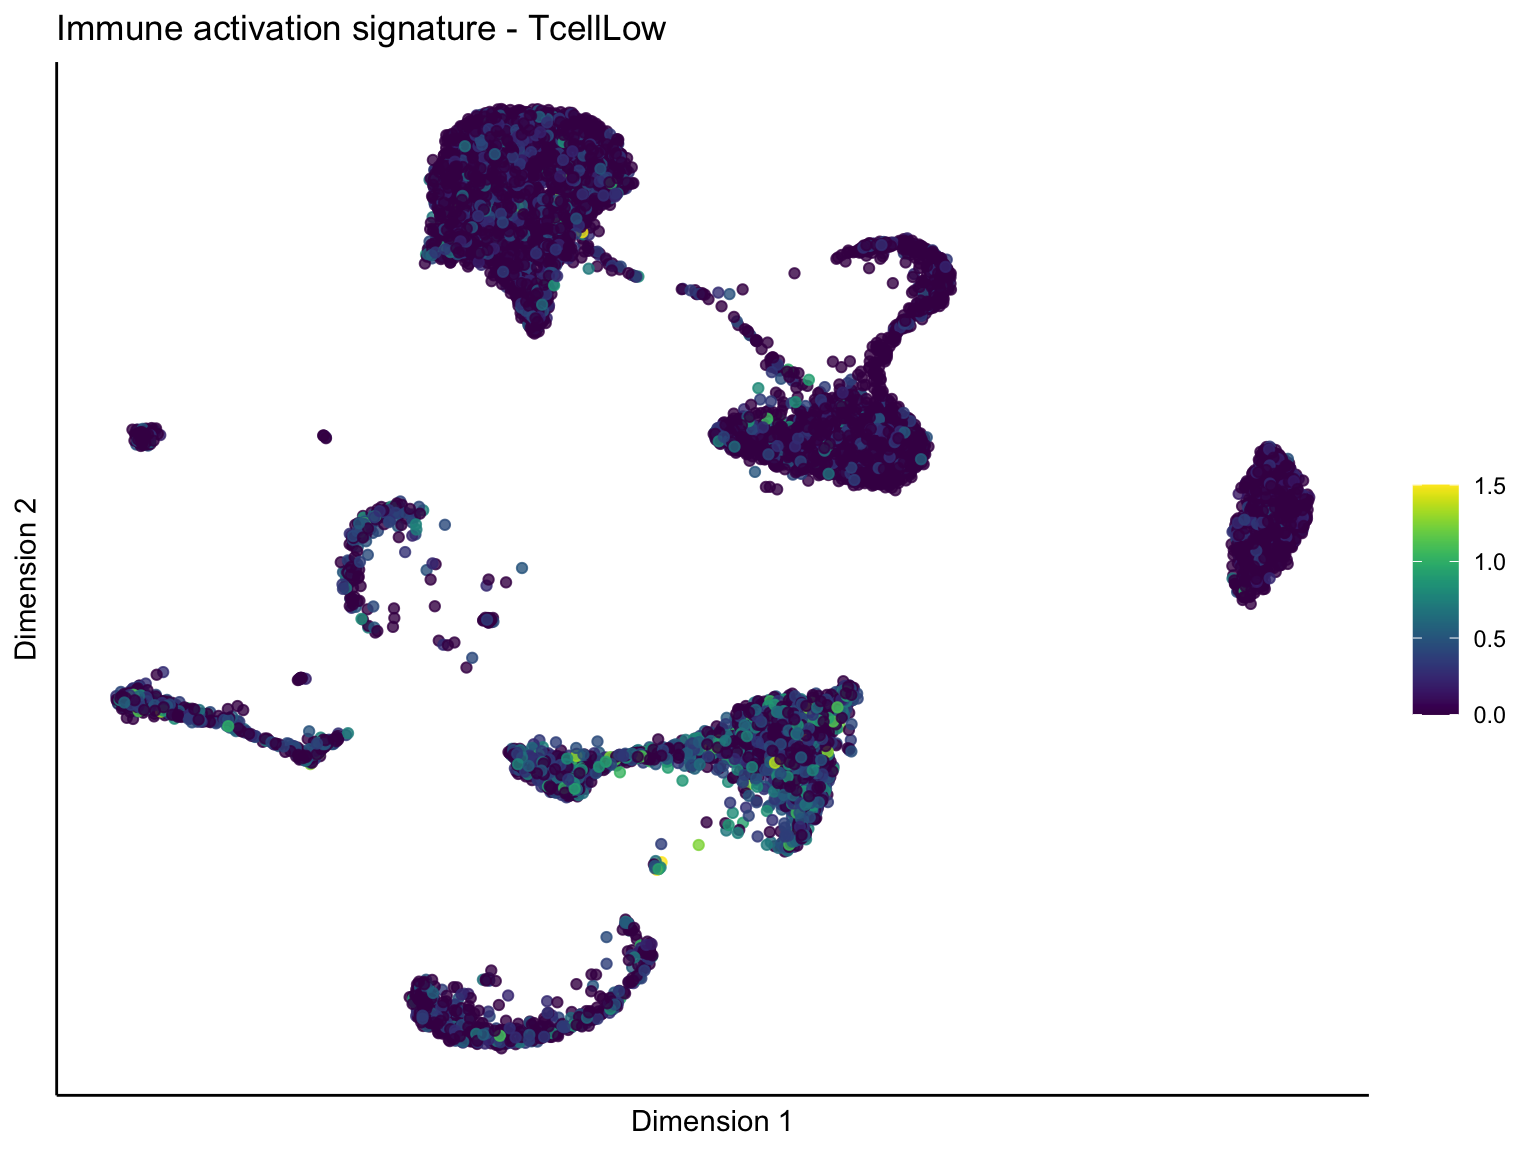
| Version | Author | Date |
|---|---|---|
| 66c2208 | mluetge | 2022-12-08 |
[[2]][[3]]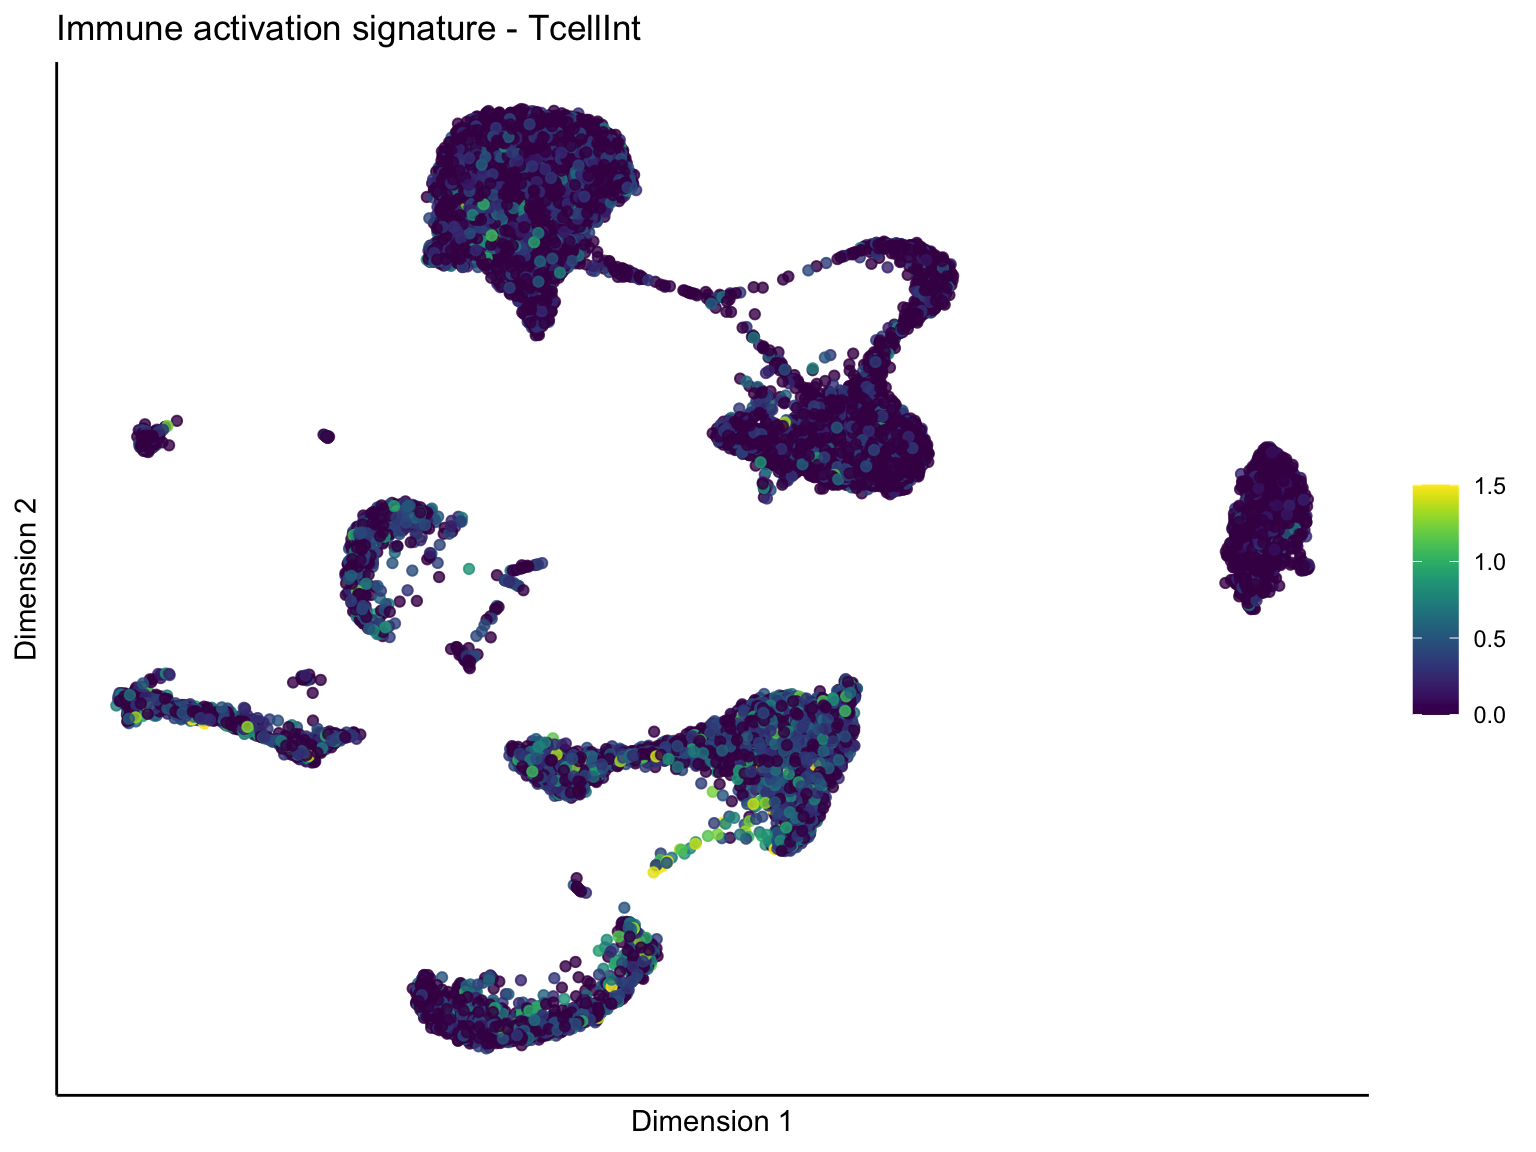
| Version | Author | Date |
|---|---|---|
| 66c2208 | mluetge | 2022-12-08 |
[[3]]
[[3]][[1]]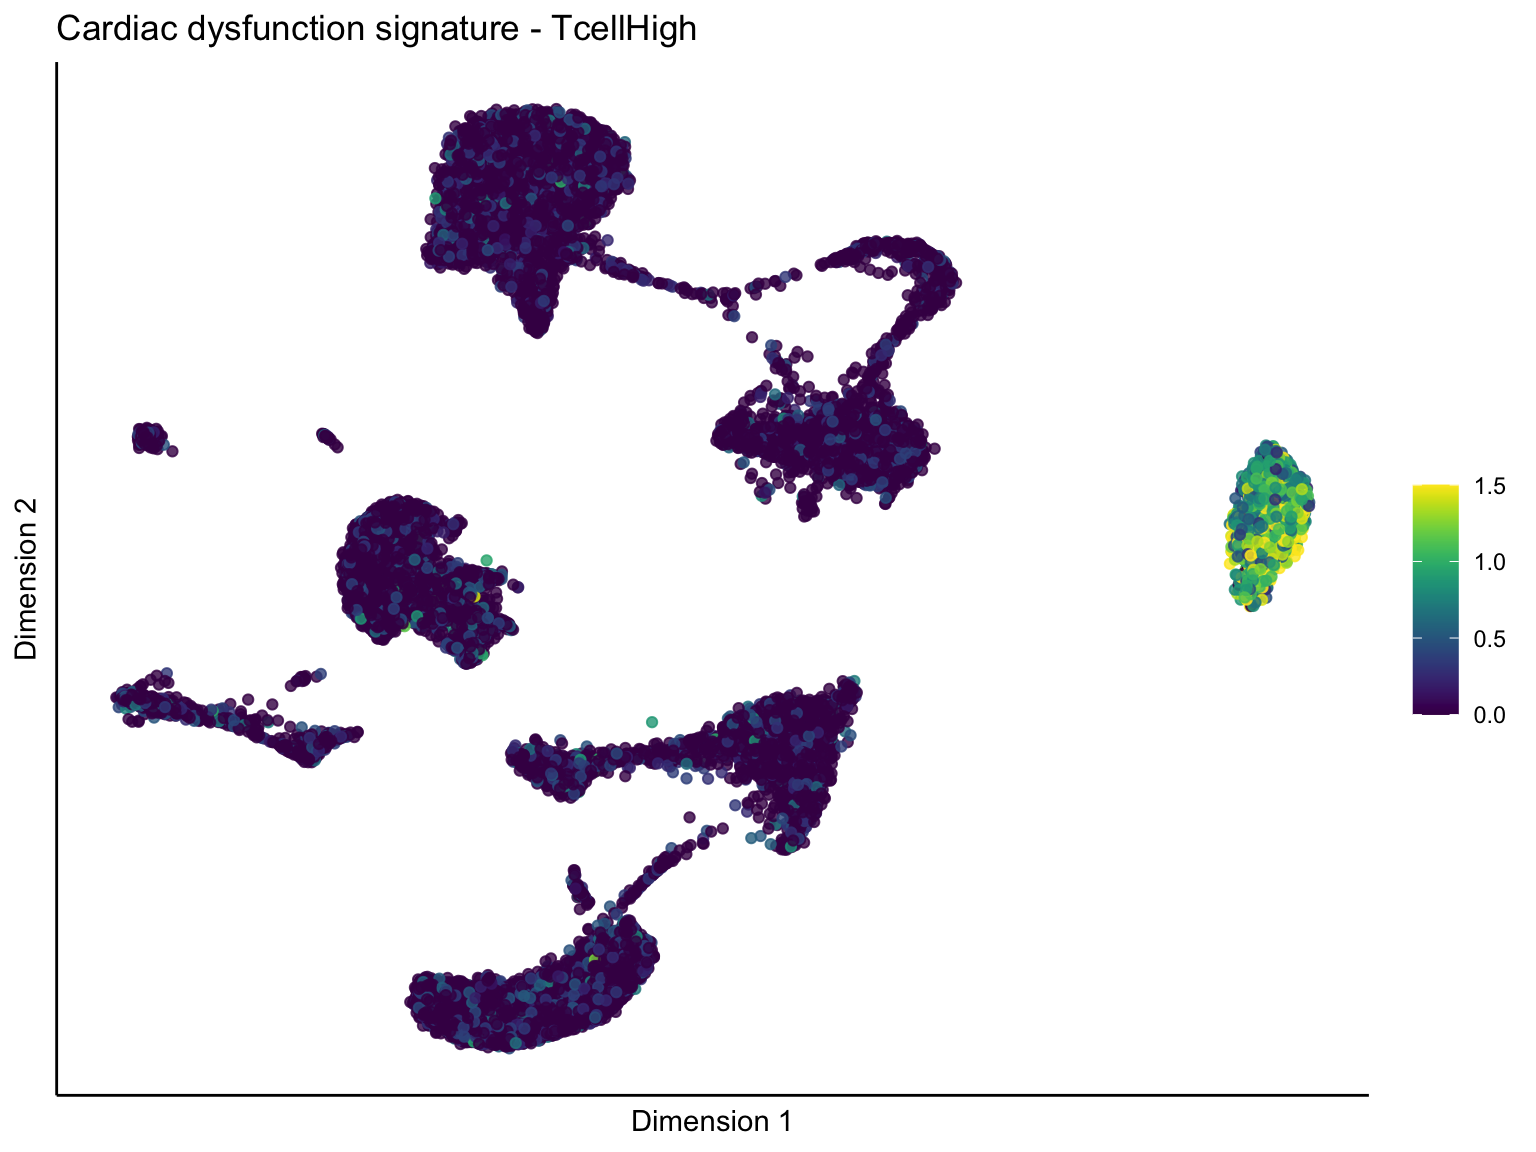
| Version | Author | Date |
|---|---|---|
| 66c2208 | mluetge | 2022-12-08 |
[[3]][[2]]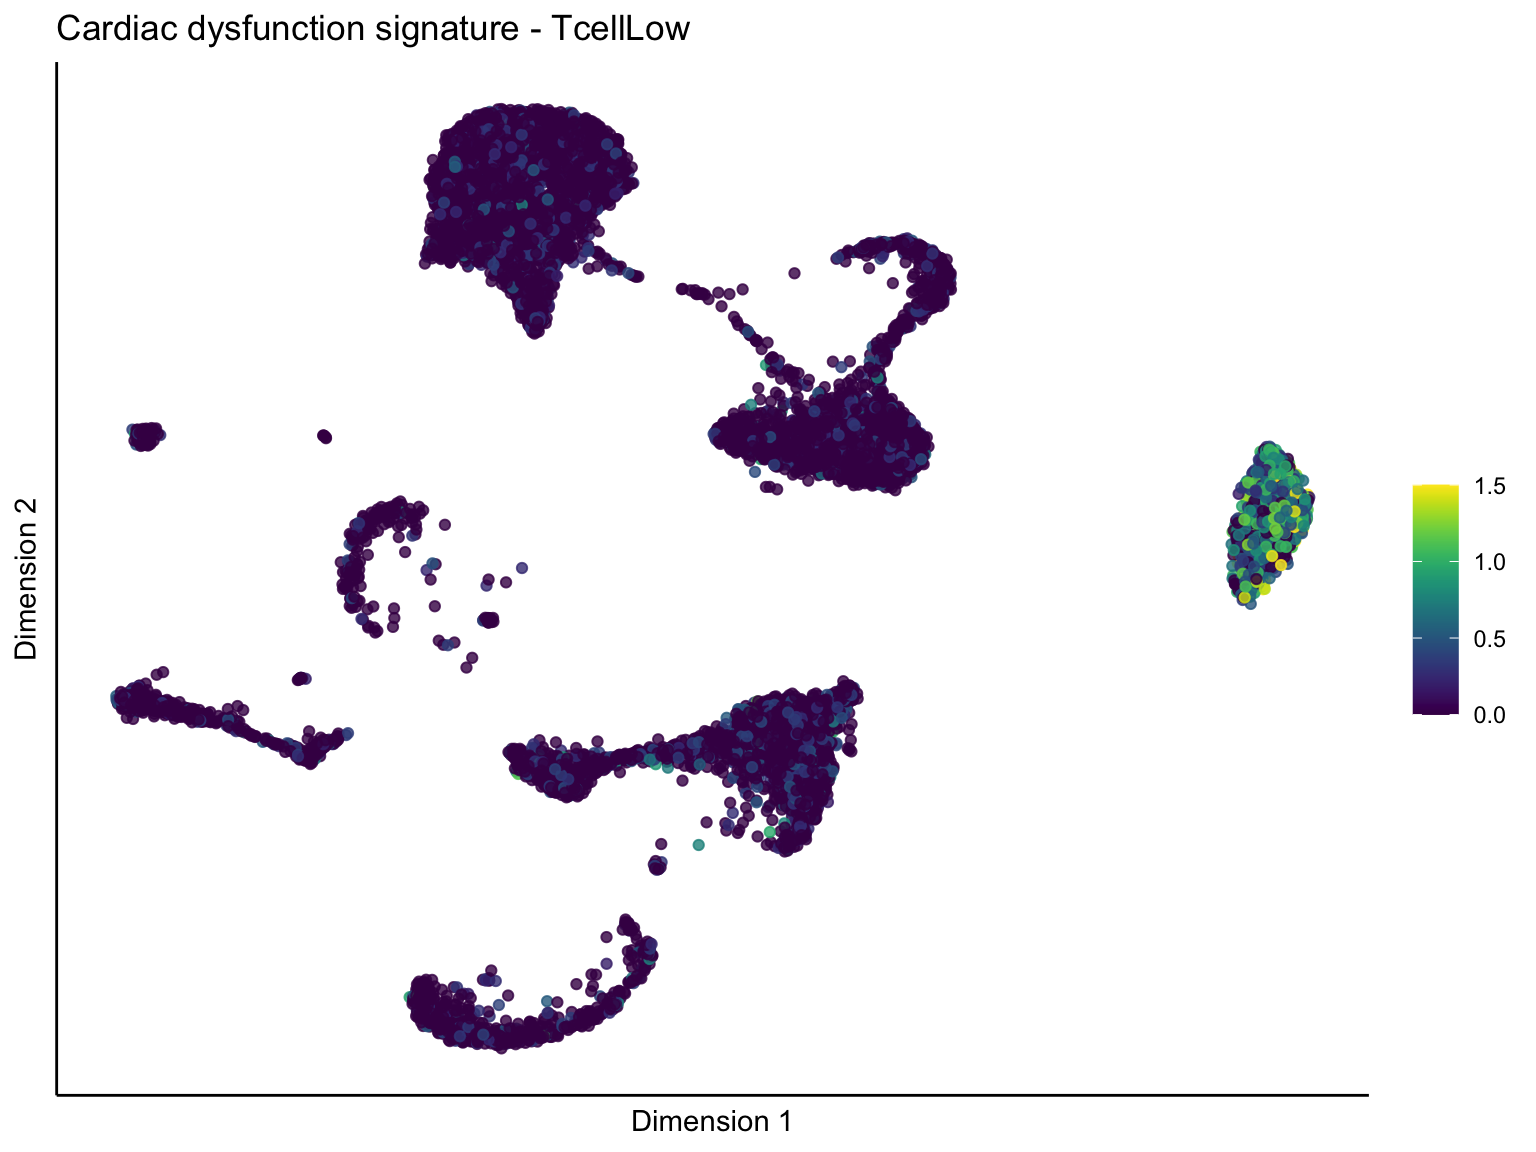
| Version | Author | Date |
|---|---|---|
| 66c2208 | mluetge | 2022-12-08 |
[[3]][[3]]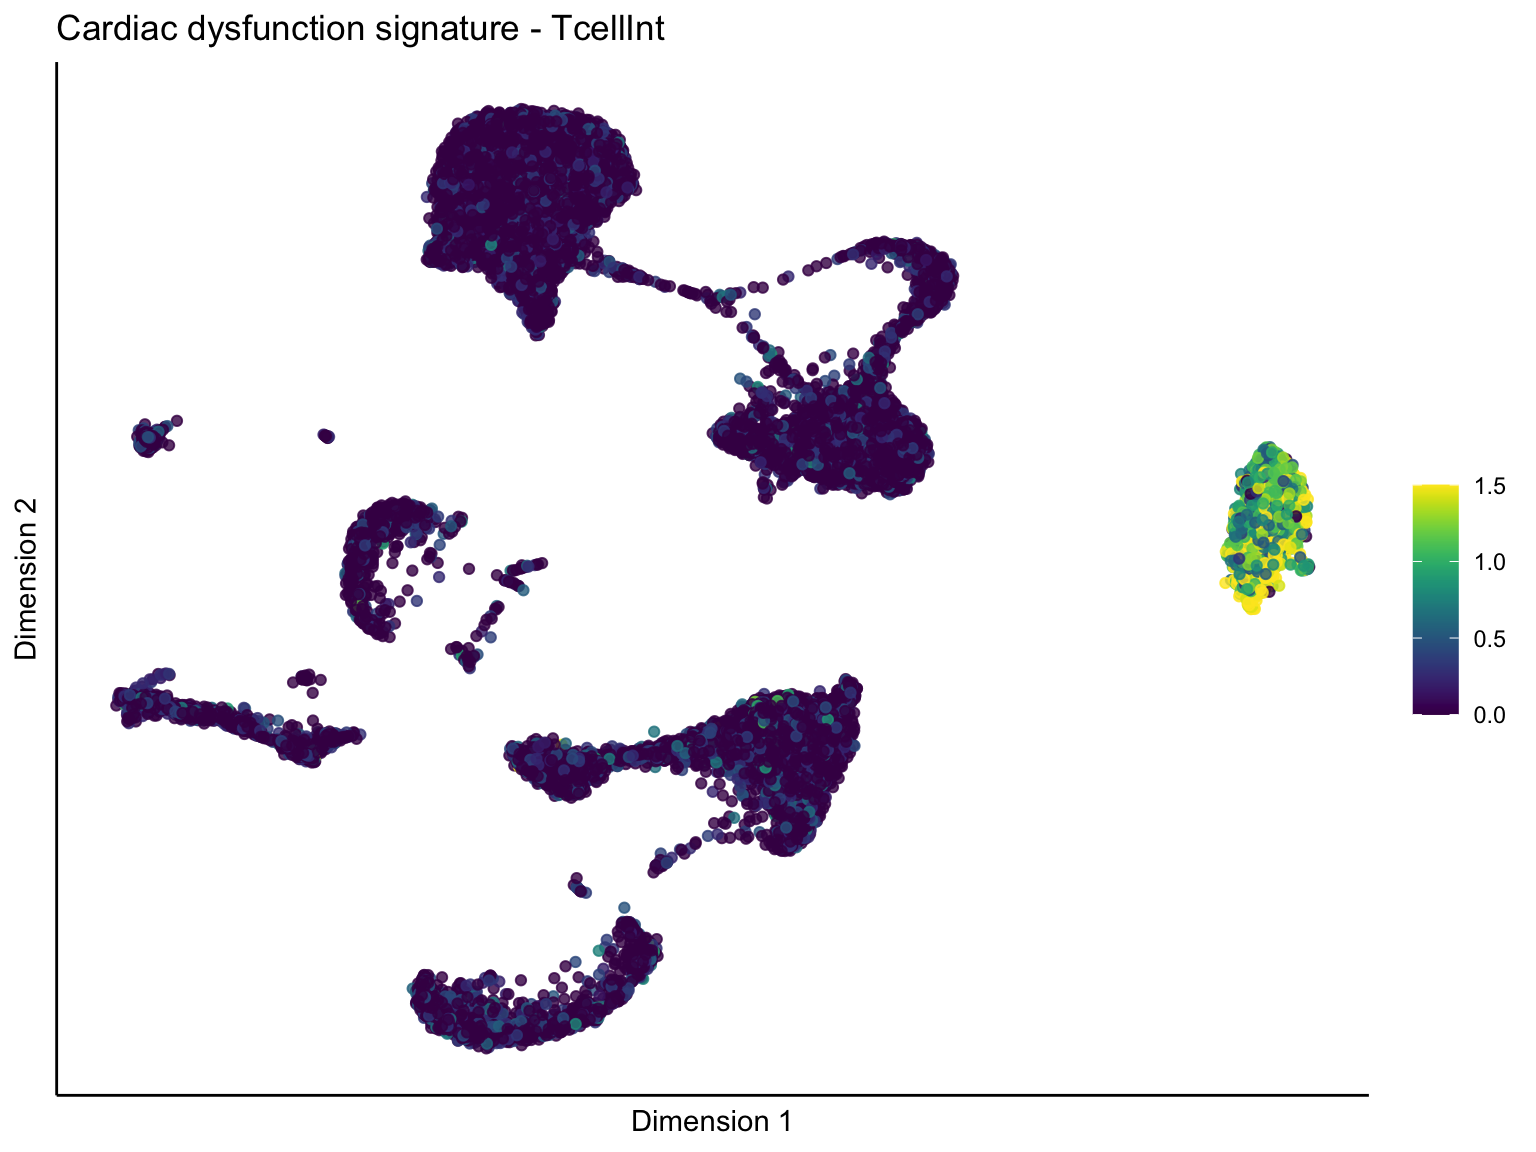
| Version | Author | Date |
|---|---|---|
| 66c2208 | mluetge | 2022-12-08 |
[[4]]
[[4]][[1]]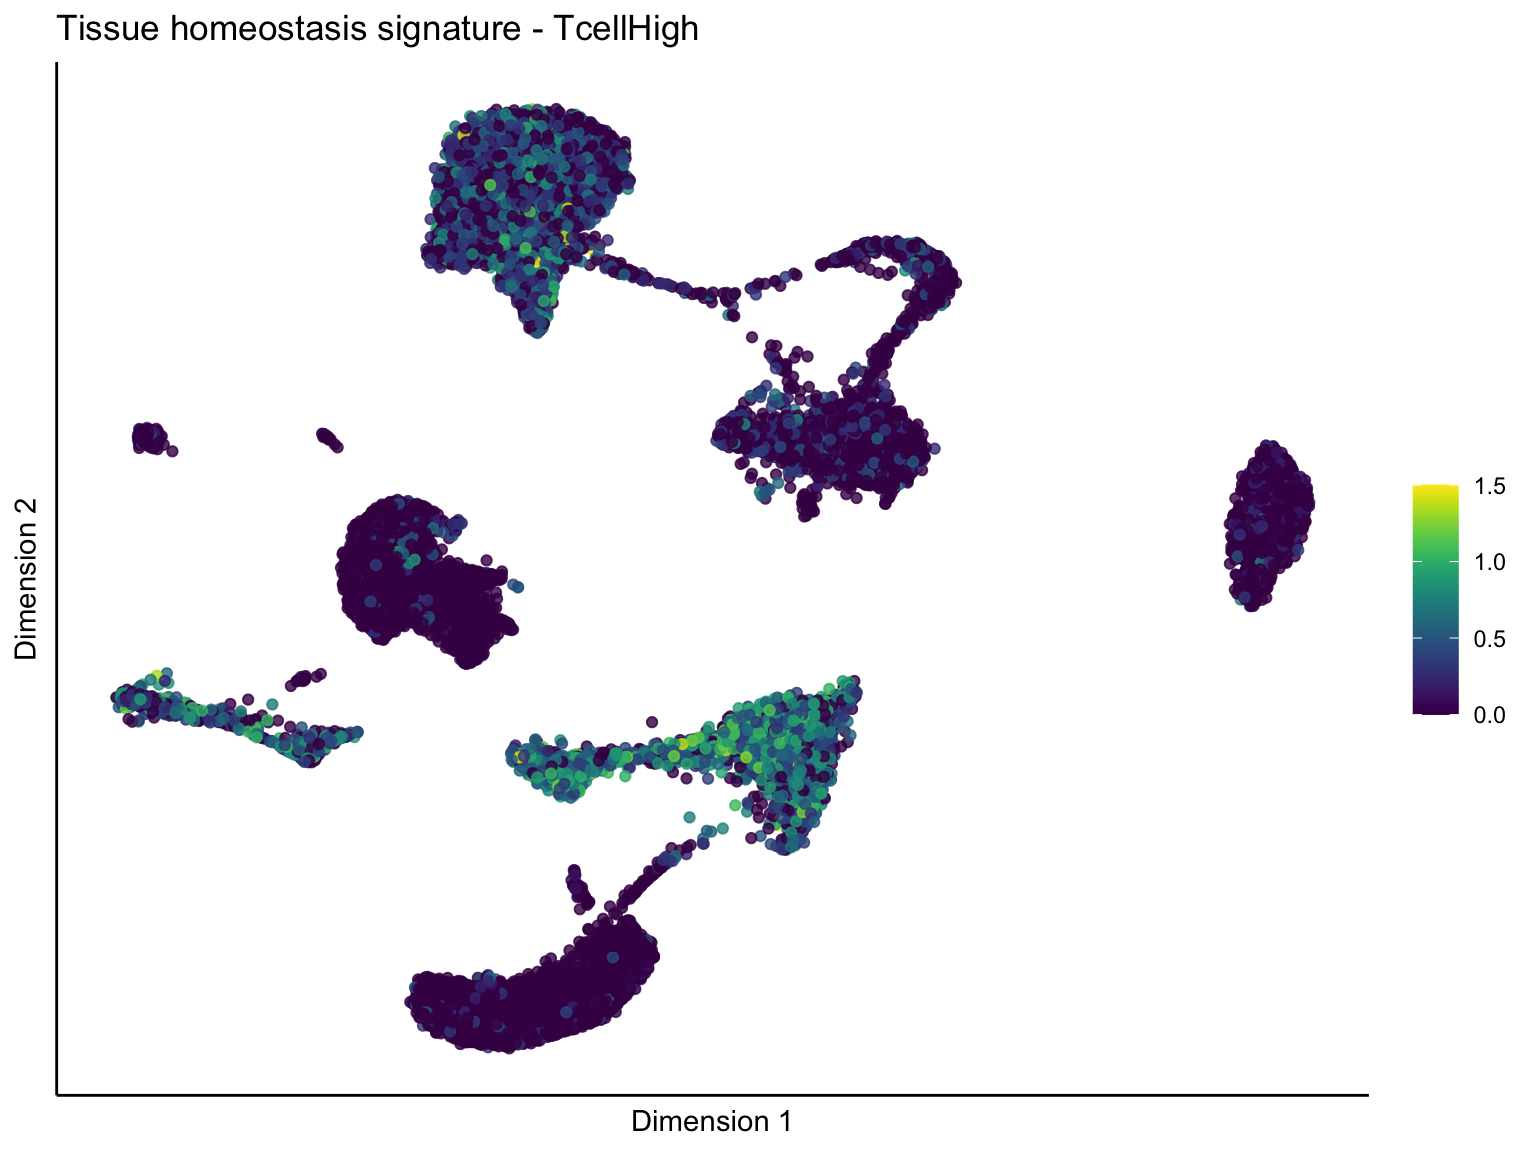
| Version | Author | Date |
|---|---|---|
| 66c2208 | mluetge | 2022-12-08 |
[[4]][[2]]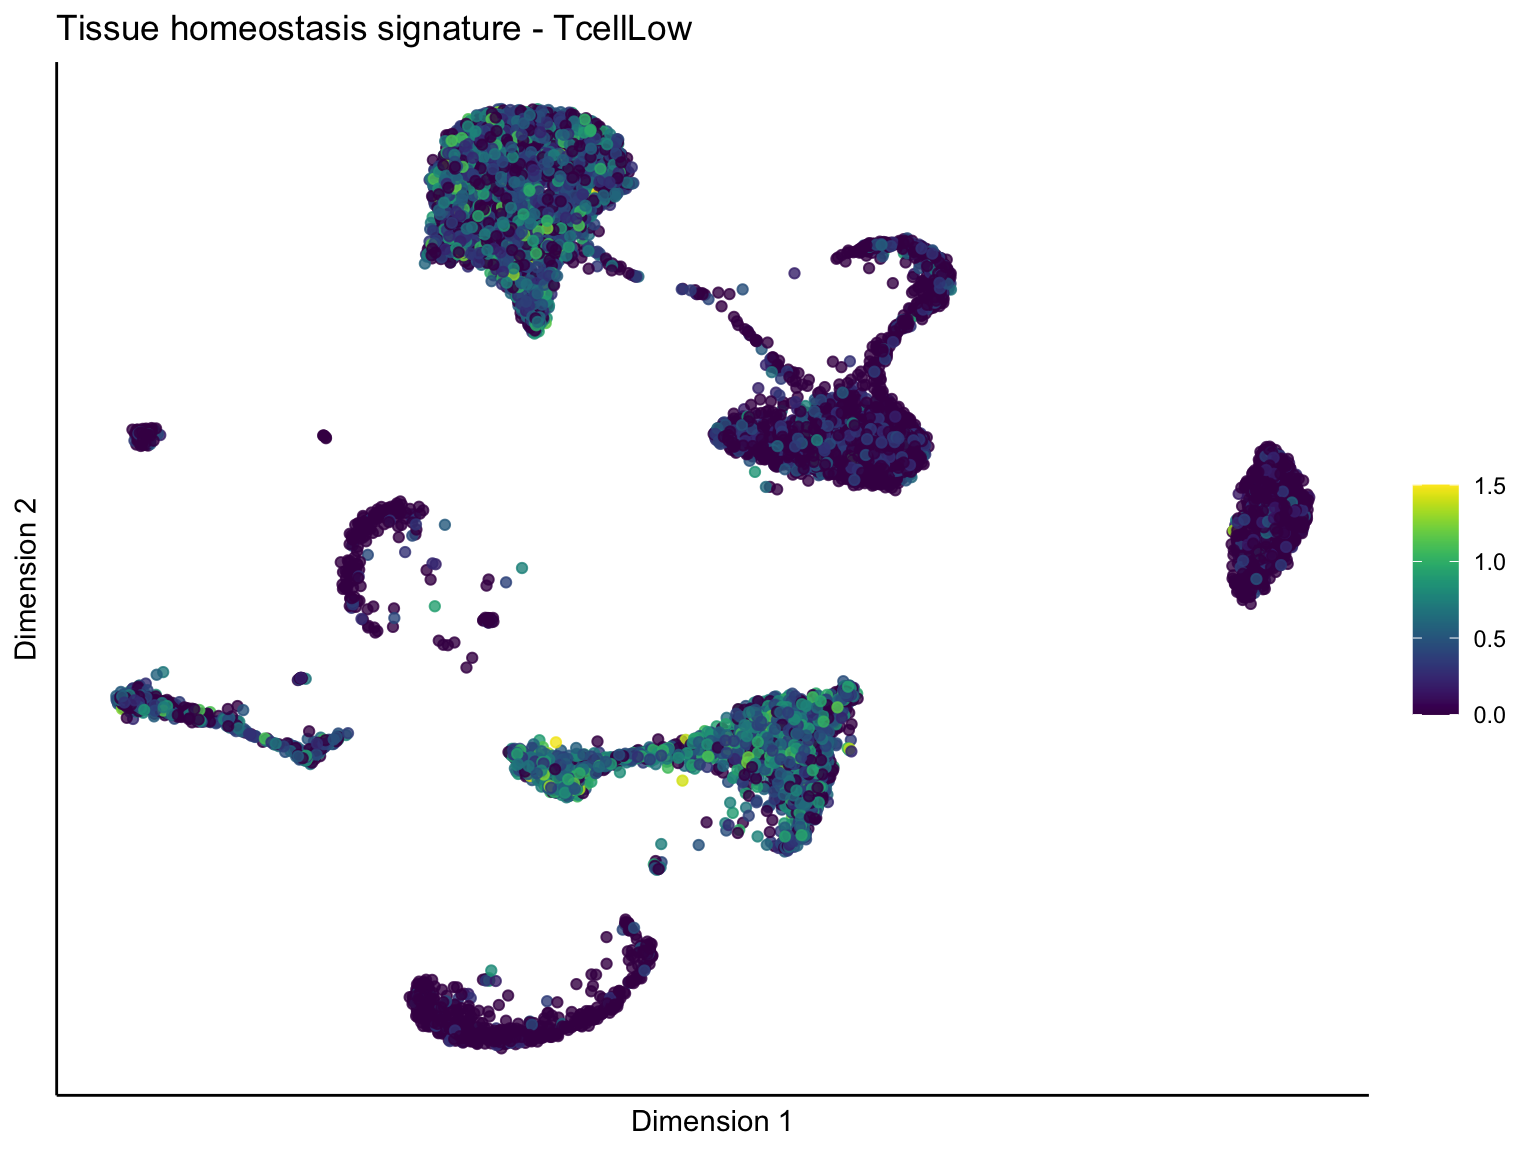
| Version | Author | Date |
|---|---|---|
| 66c2208 | mluetge | 2022-12-08 |
[[4]][[3]]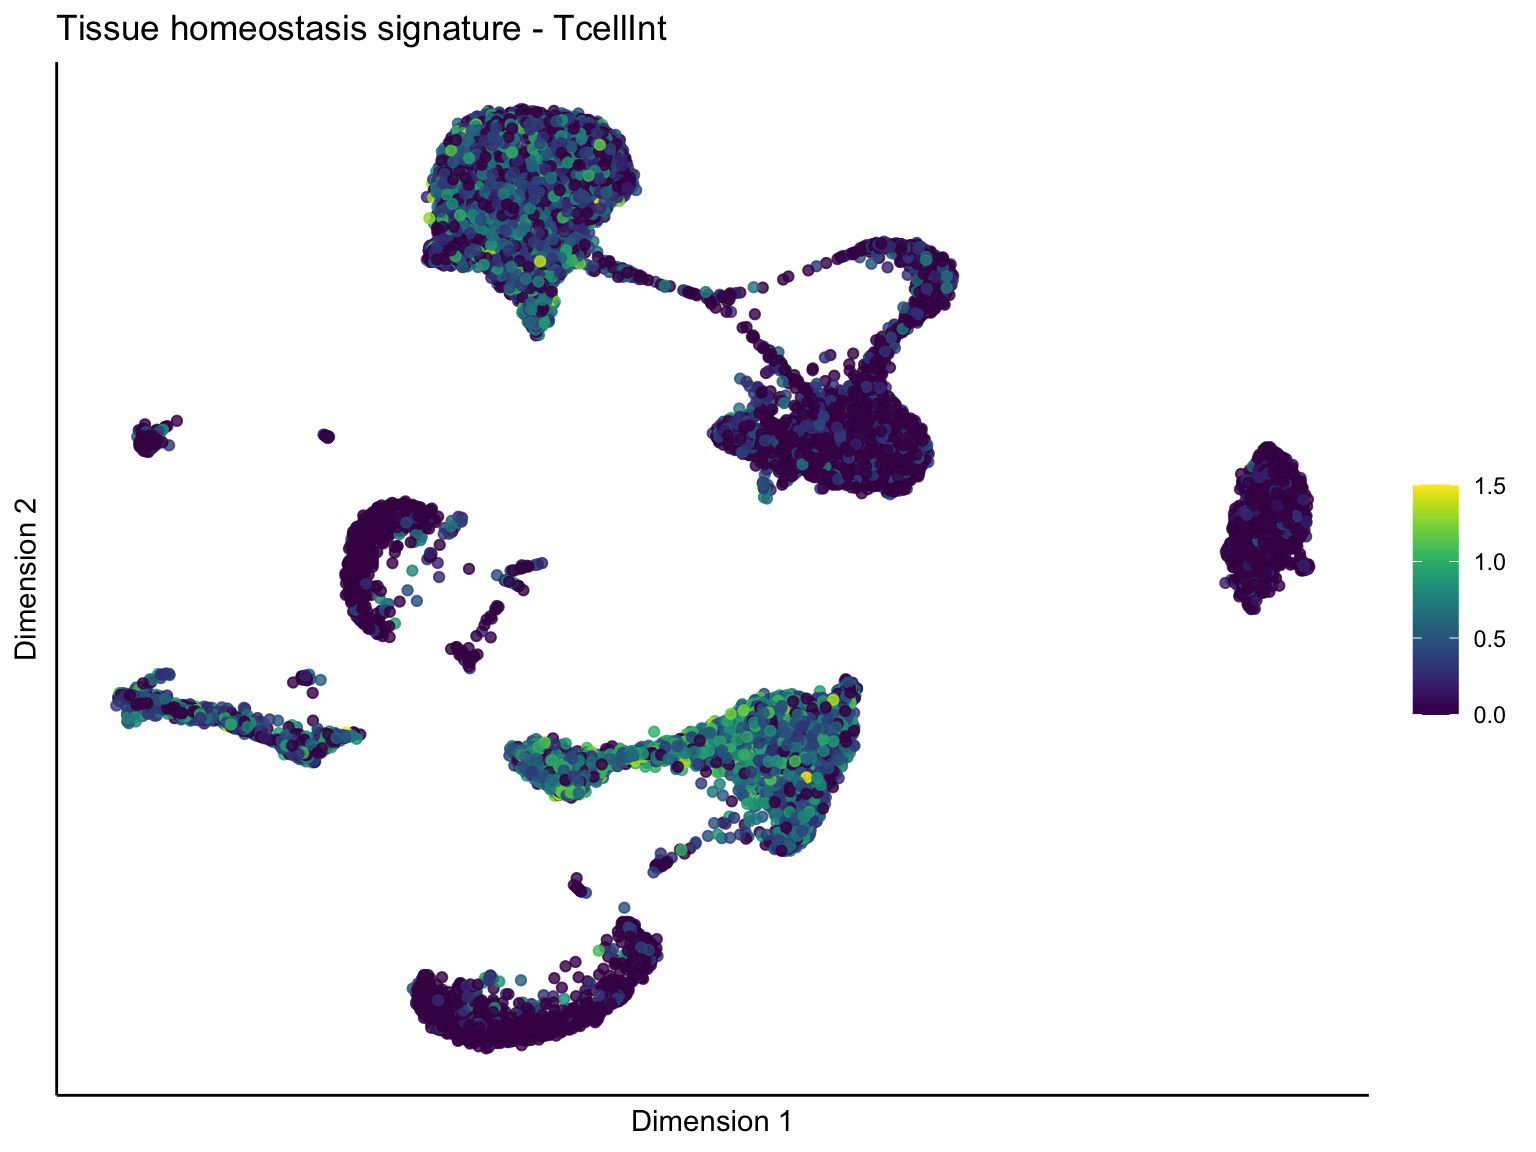
| Version | Author | Date |
|---|---|---|
| 66c2208 | mluetge | 2022-12-08 |
signature cut 1
cutOff <- 1
pal = colorRampPalette(rev(brewer.pal(11, 'RdBu')))
sc <- scale_colour_gradientn(colours = pal(100), limits=c(0, cutOff))

lapply(unique(signDat$signature), function(sign){
  signGenes <- signDat %>% dplyr::filter(signature == sign)
  sceSub <- sce[which(rownames(sce) %in% signGenes$geneID),]
  cntMat <- rowSums(t(as.matrix(sceSub@assays@data$logcounts)))/nrow(signGenes)
  sceSub$sign <- cntMat
  sceSub$sign[which(sceSub$sign > cutOff)] <- cutOff
  sceSub$sign[which(sceSub$sign < 0)] <- 0
  lapply(treatGrps, function(treat){
    sceSubT <- sceSub[, which(sceSub$TcellGrp == treat)]
    p <- visGroup_adapt(sceSubT, 'sign', dim_red = 'UMAP') +
    sc +
    guides(colour = guide_colourbar(title = '')) +
    ggtitle(paste0(sign, ' signature - ', treat)) +
    theme_classic() +
    theme(axis.text = element_blank(),
          axis.ticks = element_blank()) +
    labs(x='Dimension 1', y='Dimension 2')
    p
  })
})
[[1]]
[[1]][[1]]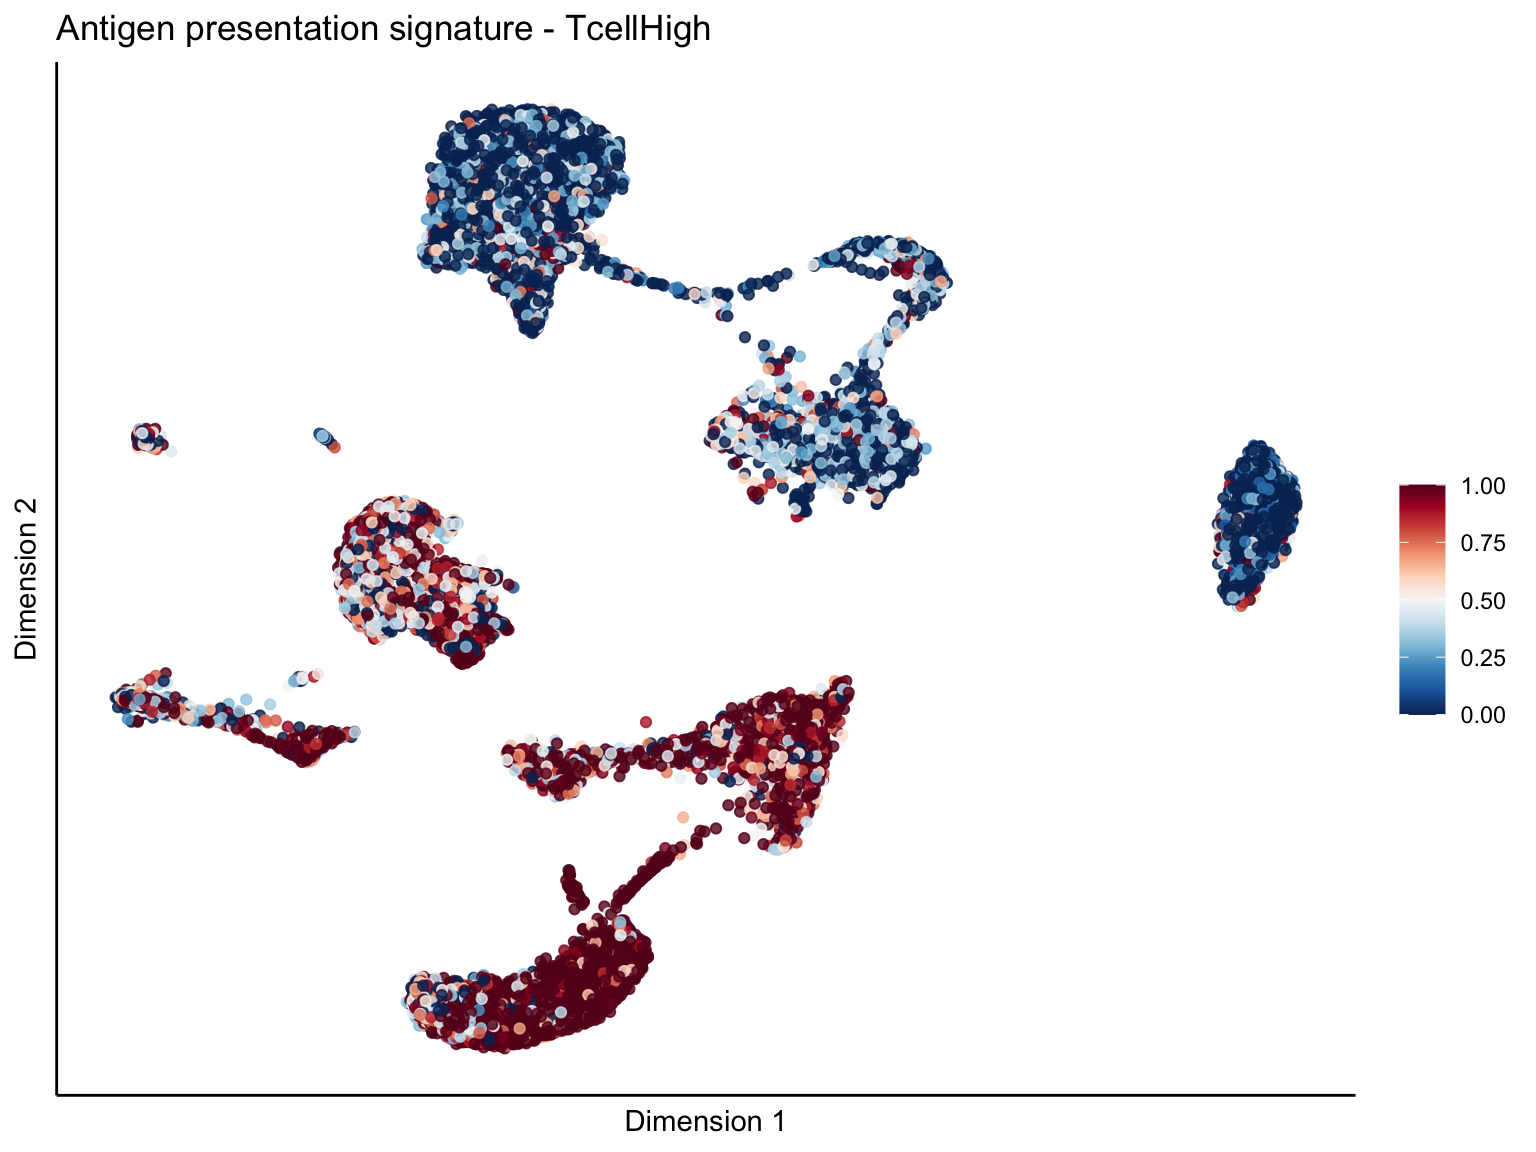
| Version | Author | Date |
|---|---|---|
| 66c2208 | mluetge | 2022-12-08 |
[[1]][[2]]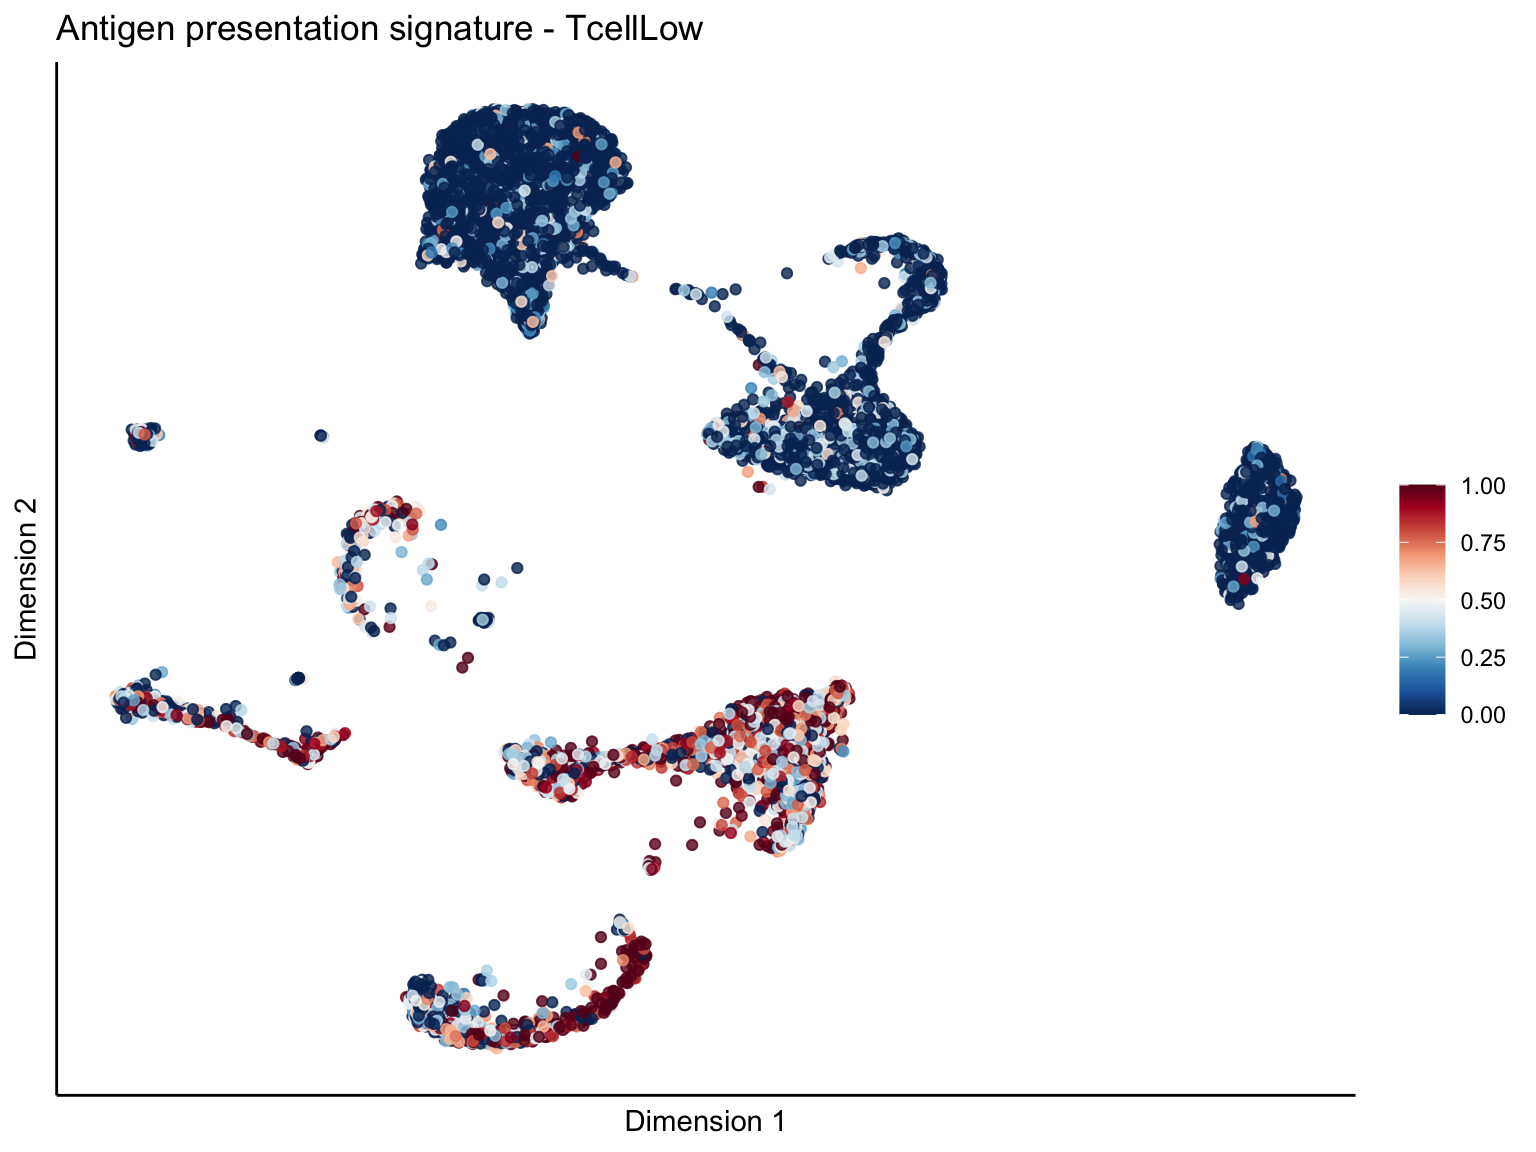
| Version | Author | Date |
|---|---|---|
| 66c2208 | mluetge | 2022-12-08 |
[[1]][[3]]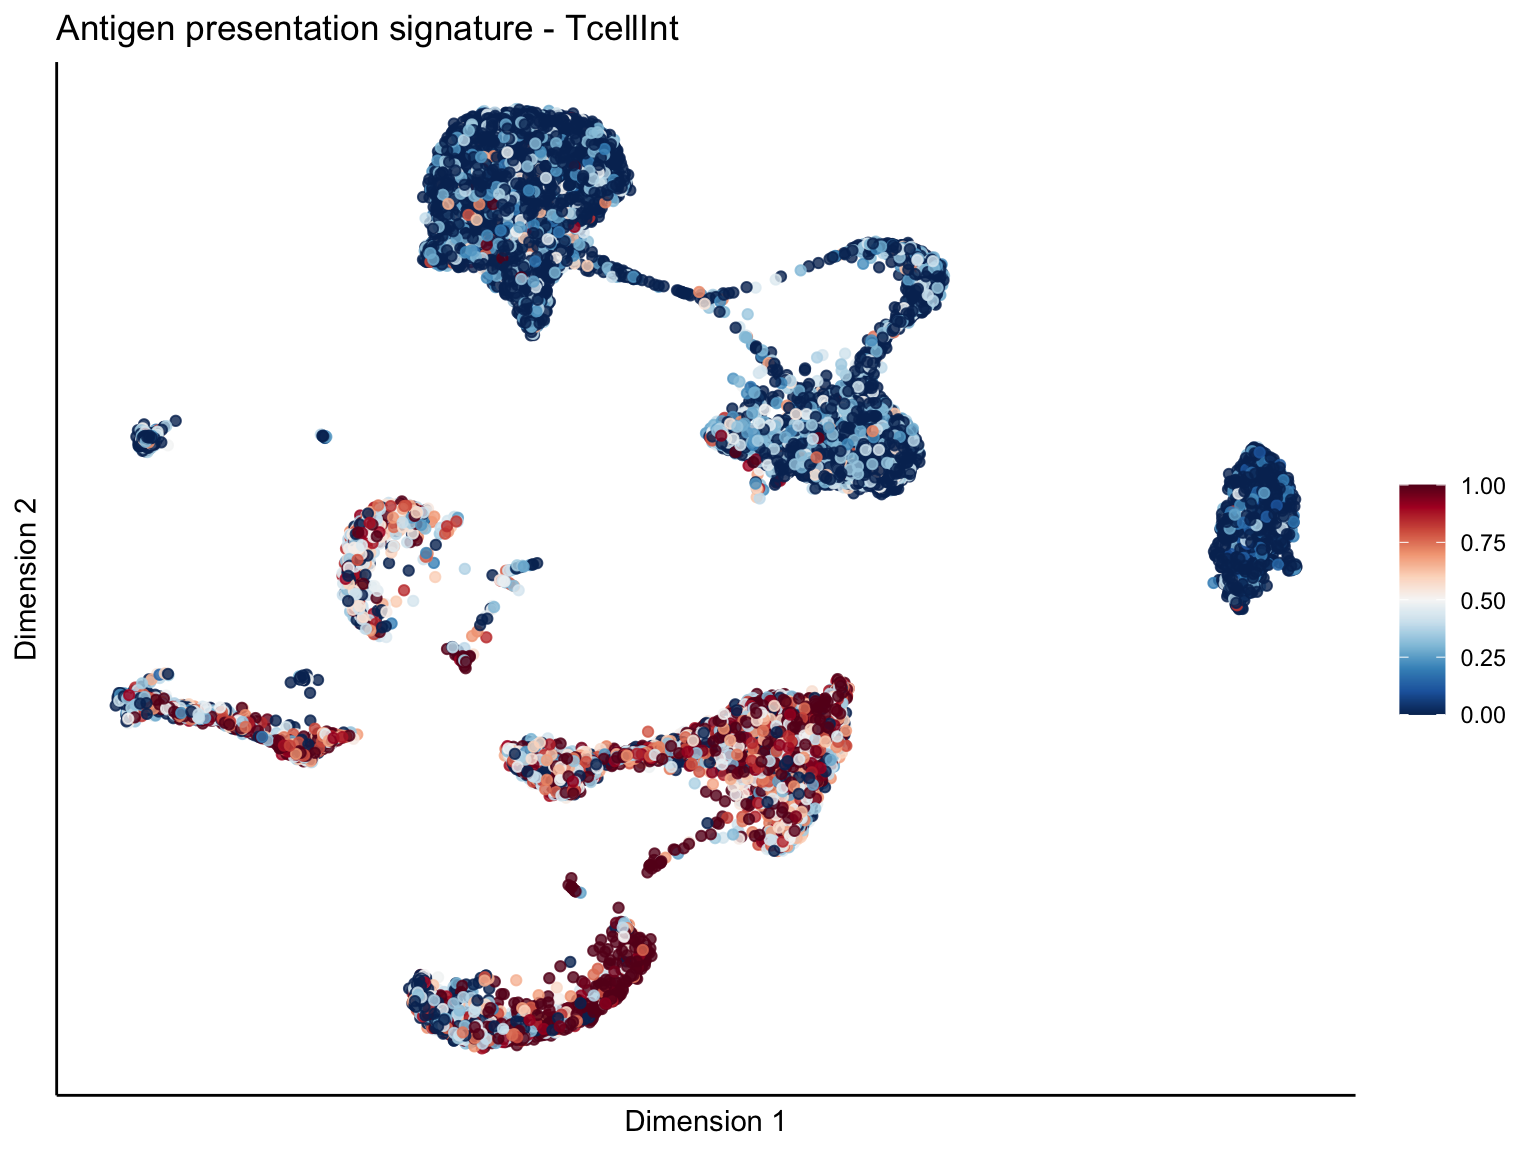
| Version | Author | Date |
|---|---|---|
| 66c2208 | mluetge | 2022-12-08 |
[[2]]
[[2]][[1]]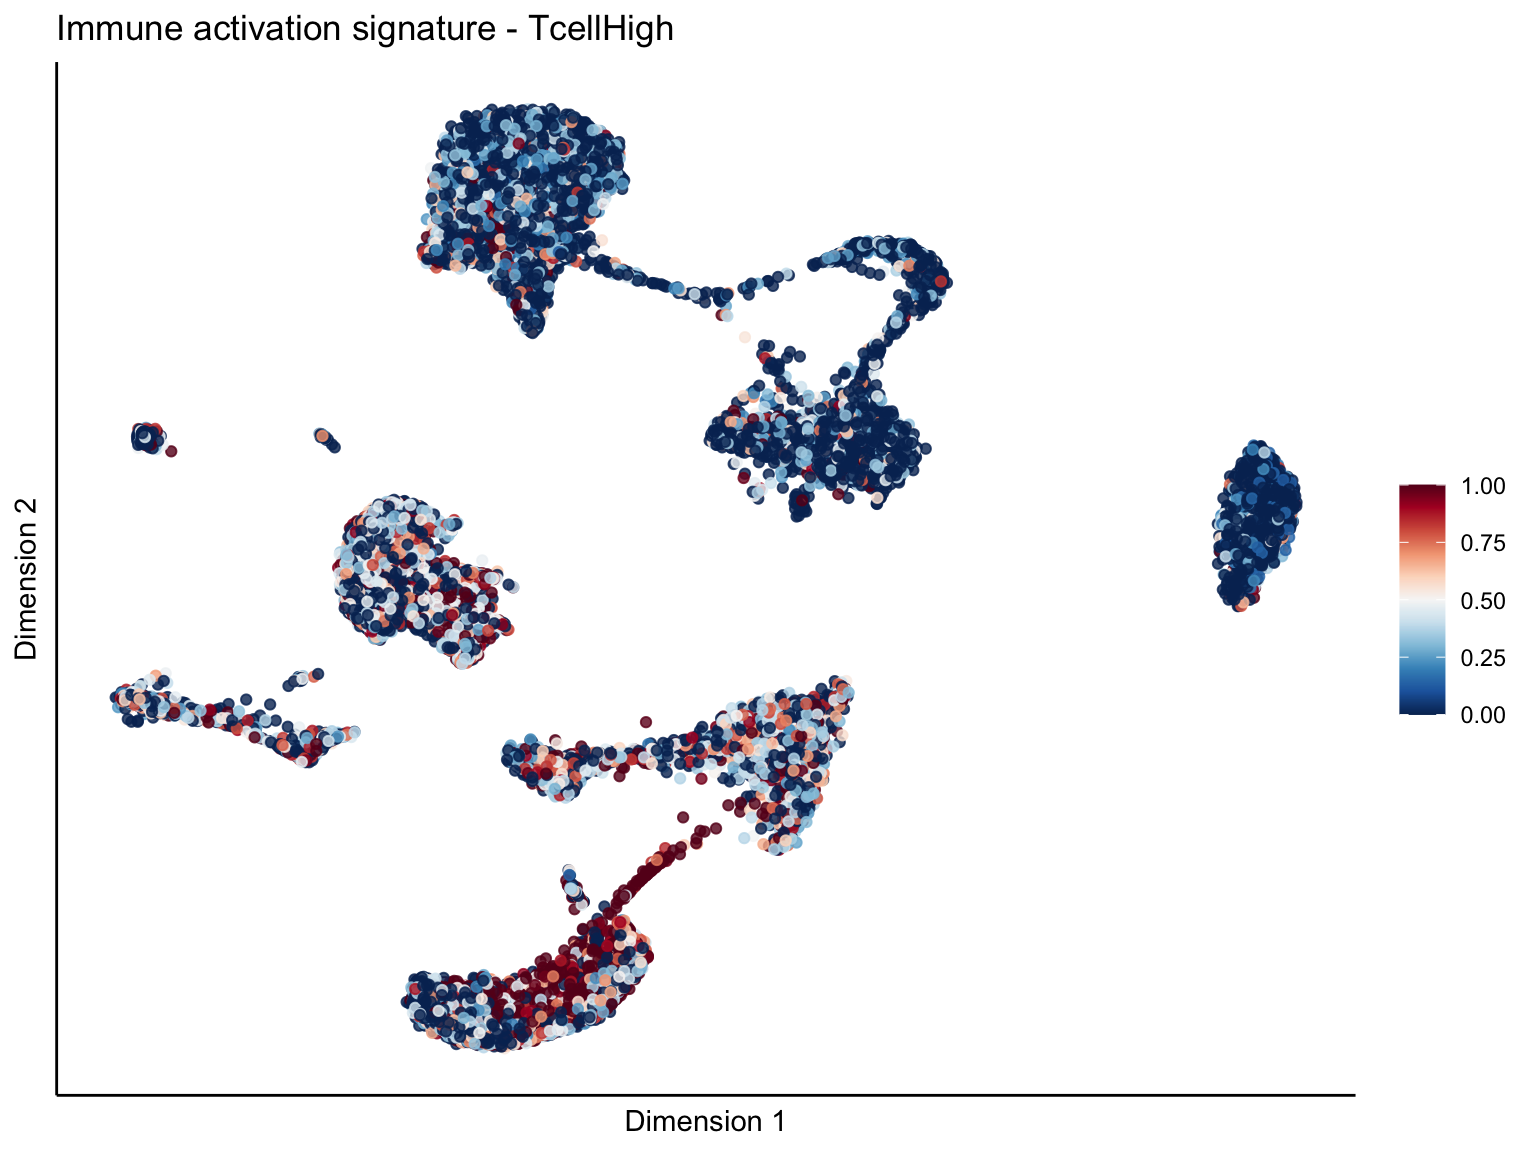
| Version | Author | Date |
|---|---|---|
| 66c2208 | mluetge | 2022-12-08 |
[[2]][[2]]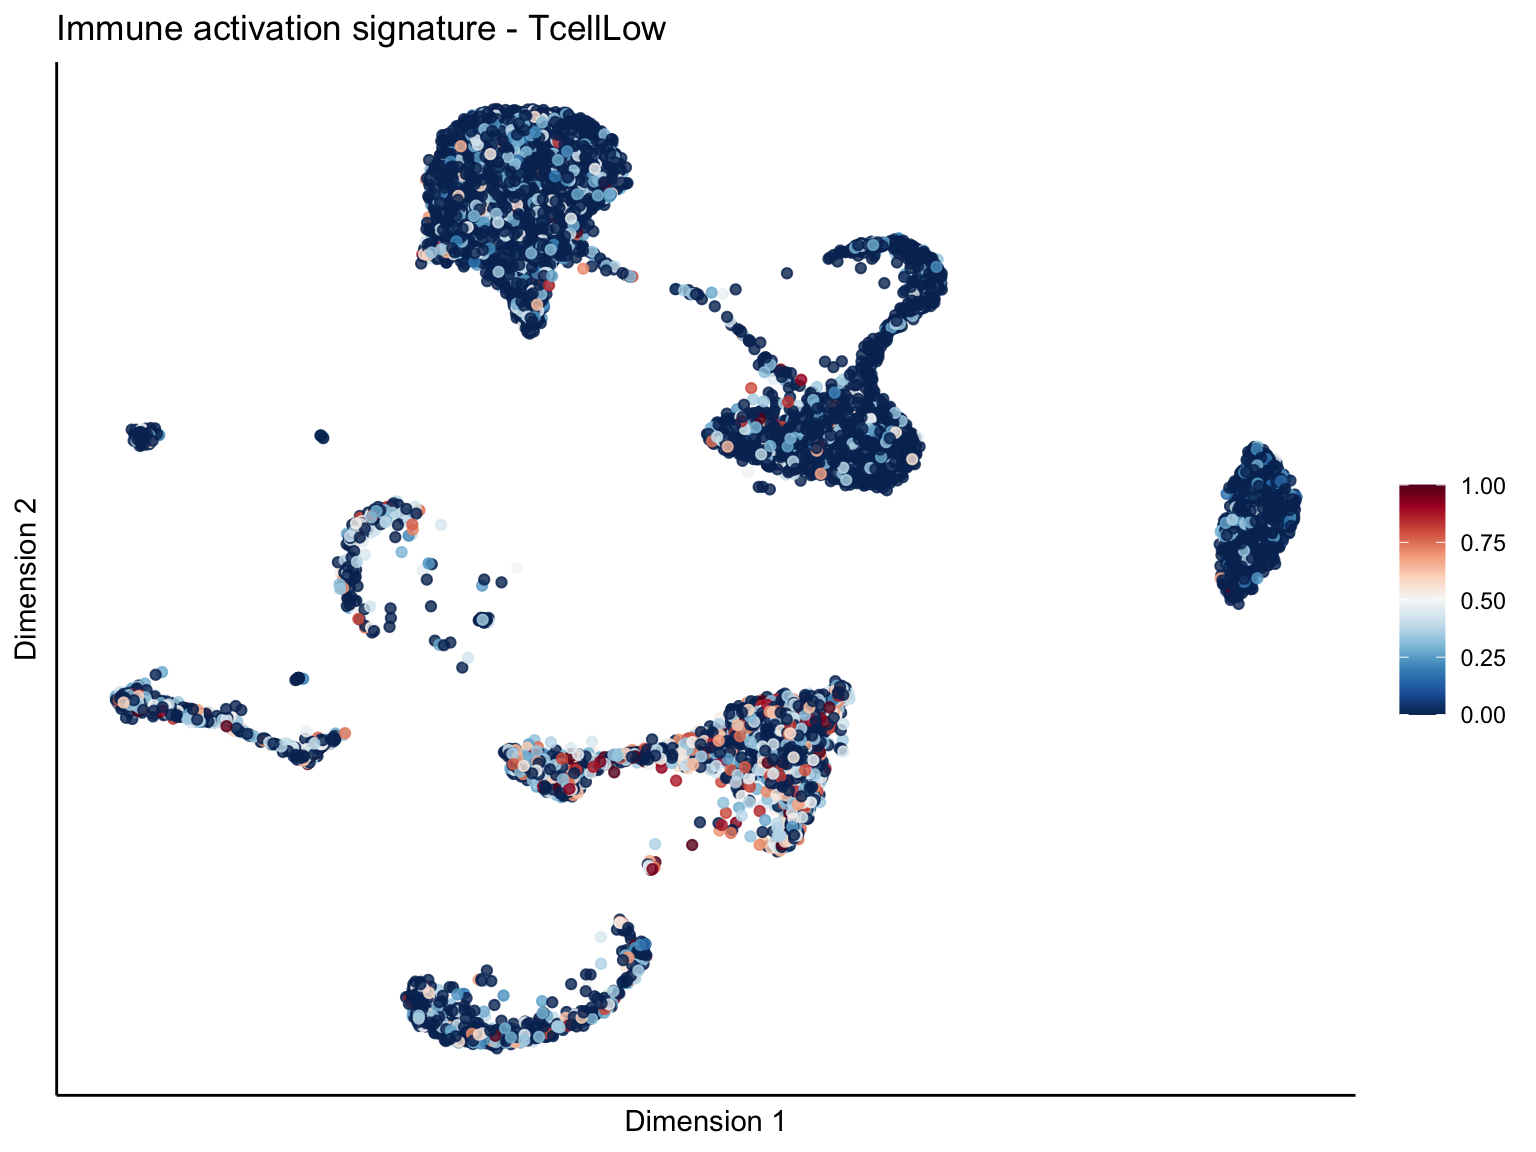
| Version | Author | Date |
|---|---|---|
| 66c2208 | mluetge | 2022-12-08 |
[[2]][[3]]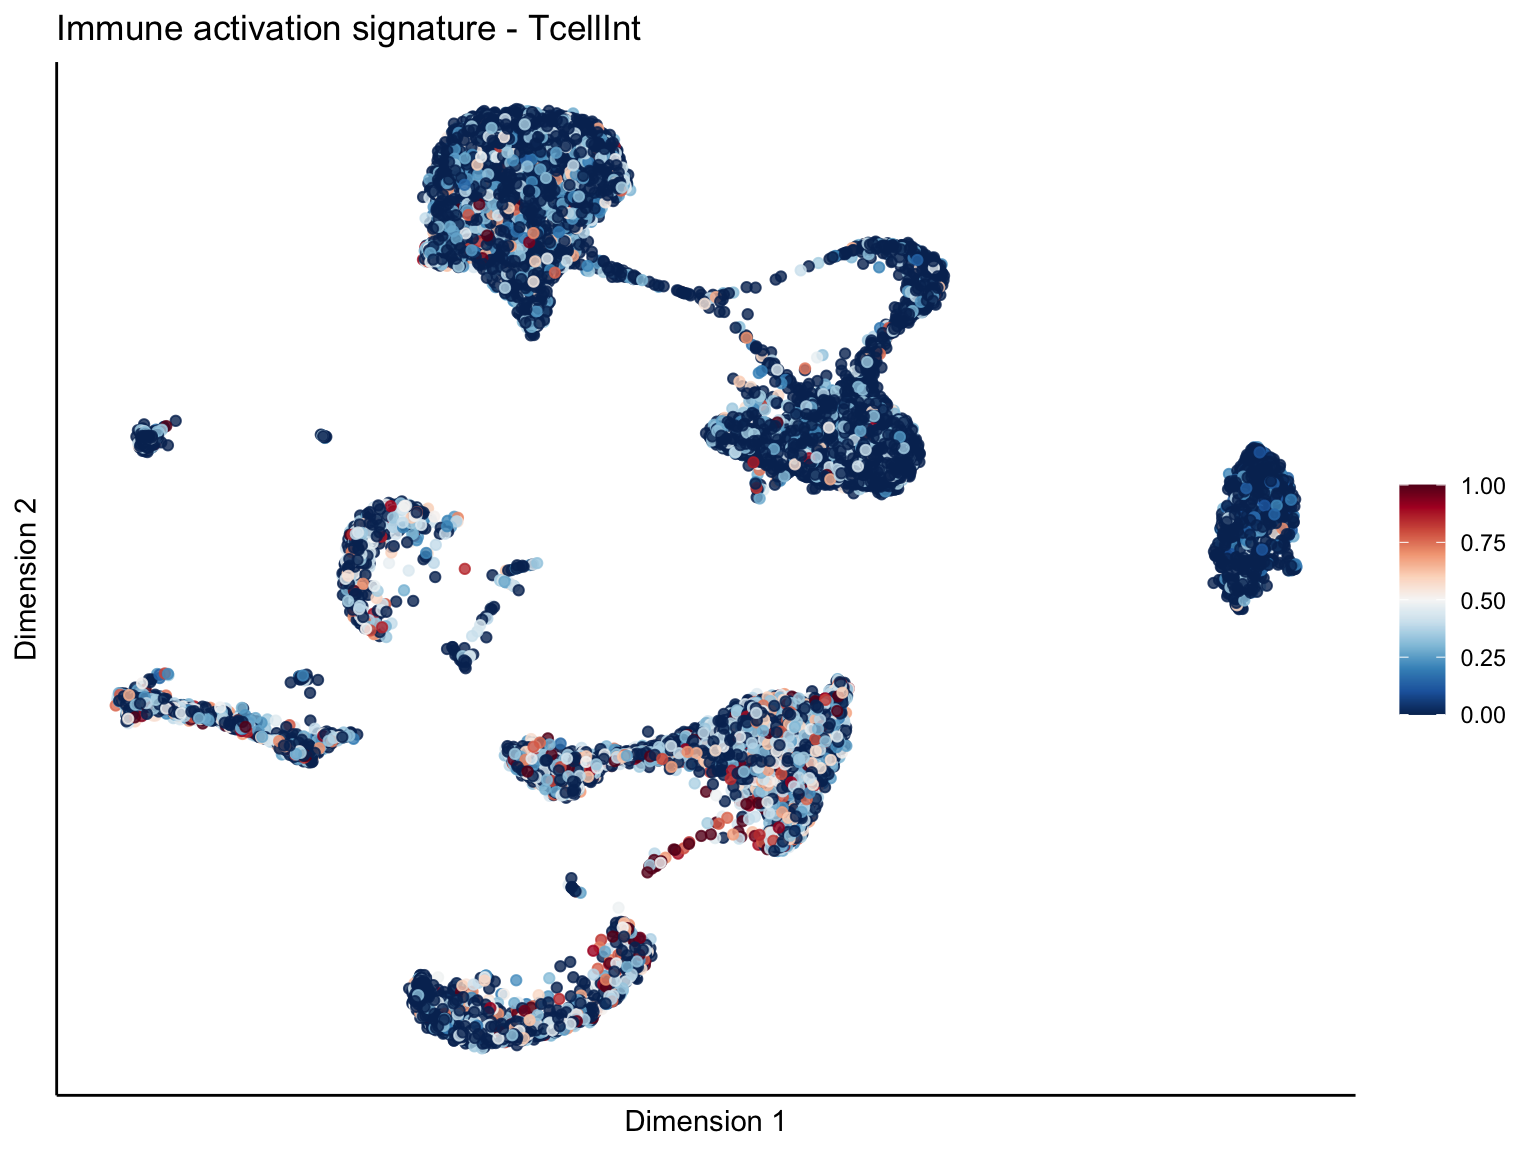
| Version | Author | Date |
|---|---|---|
| 66c2208 | mluetge | 2022-12-08 |
[[3]]
[[3]][[1]]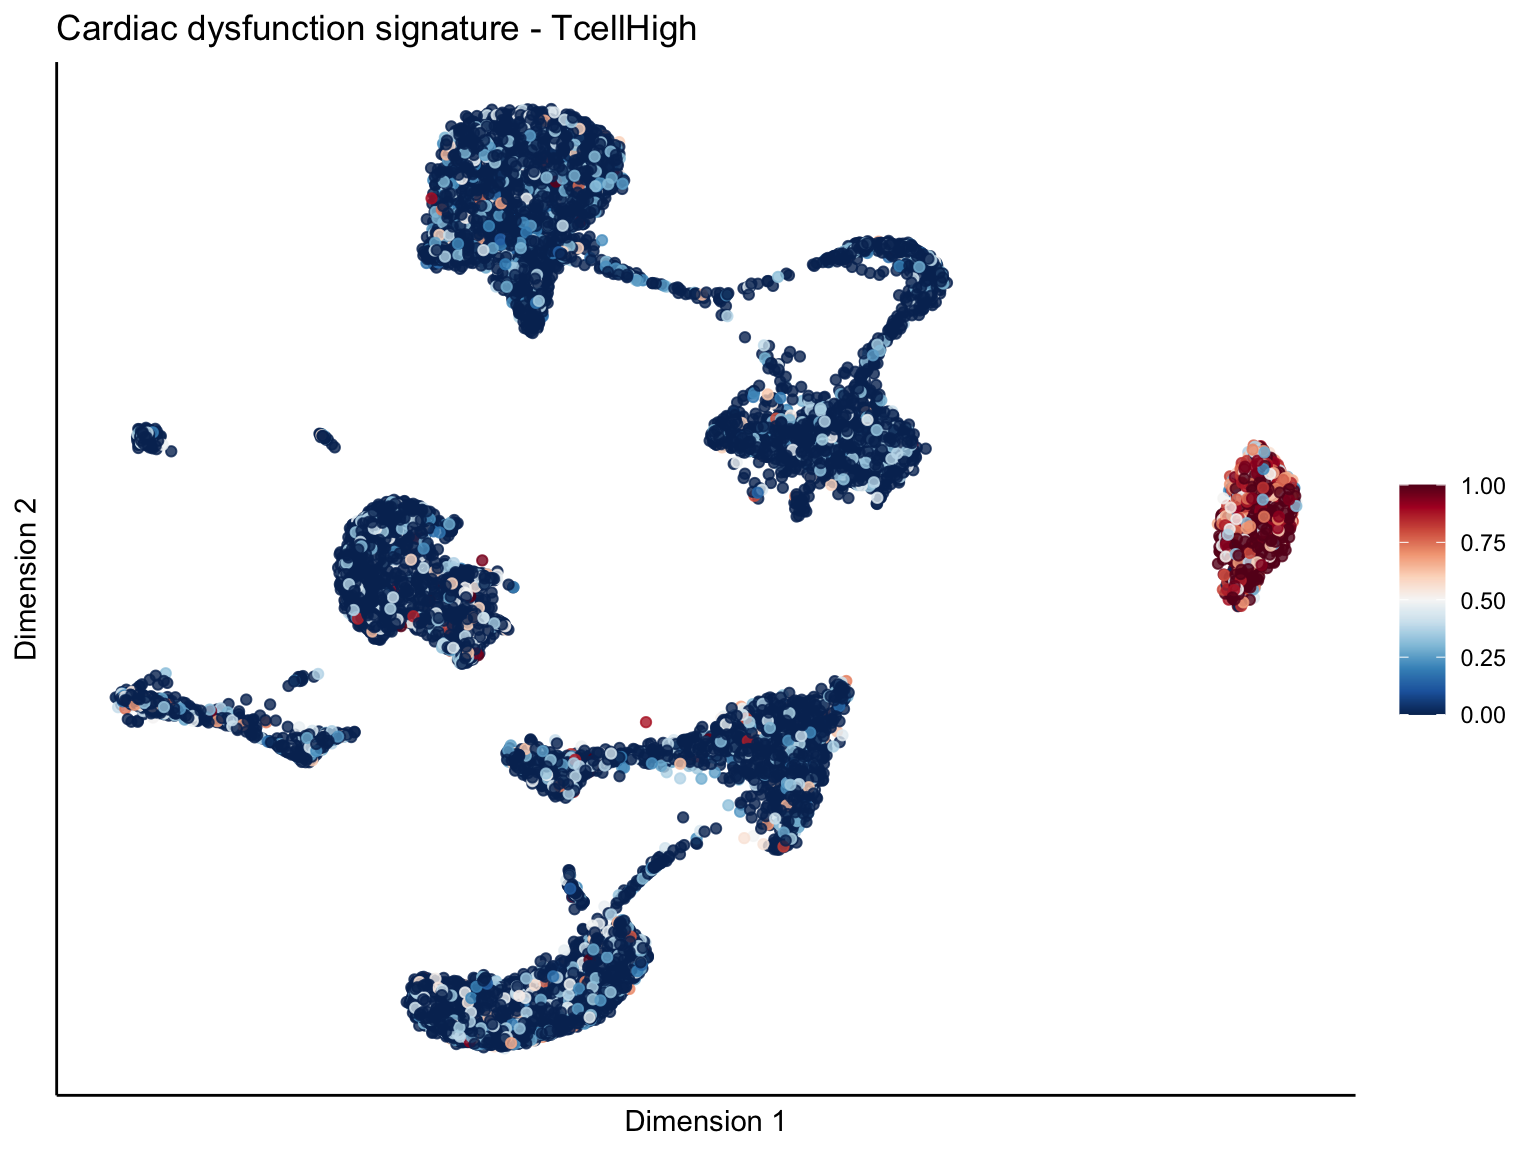
| Version | Author | Date |
|---|---|---|
| 66c2208 | mluetge | 2022-12-08 |
[[3]][[2]]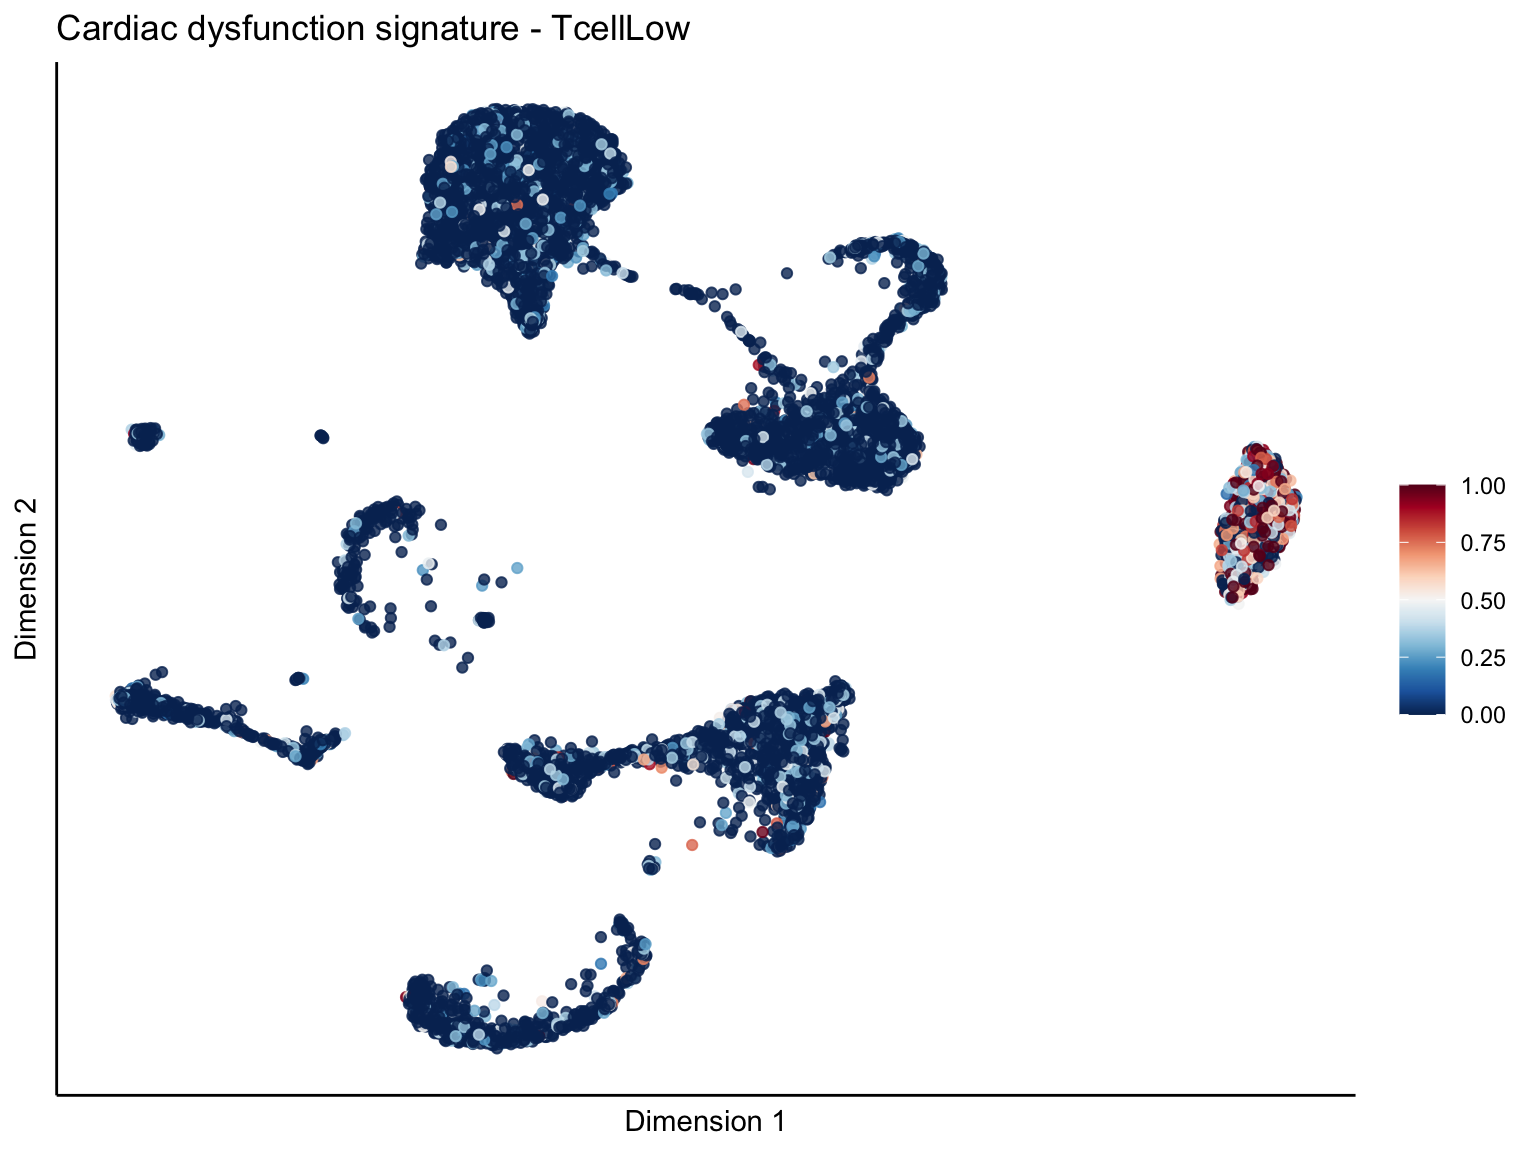
| Version | Author | Date |
|---|---|---|
| 66c2208 | mluetge | 2022-12-08 |
[[3]][[3]]
| Version | Author | Date |
|---|---|---|
| 66c2208 | mluetge | 2022-12-08 |
[[4]]
[[4]][[1]]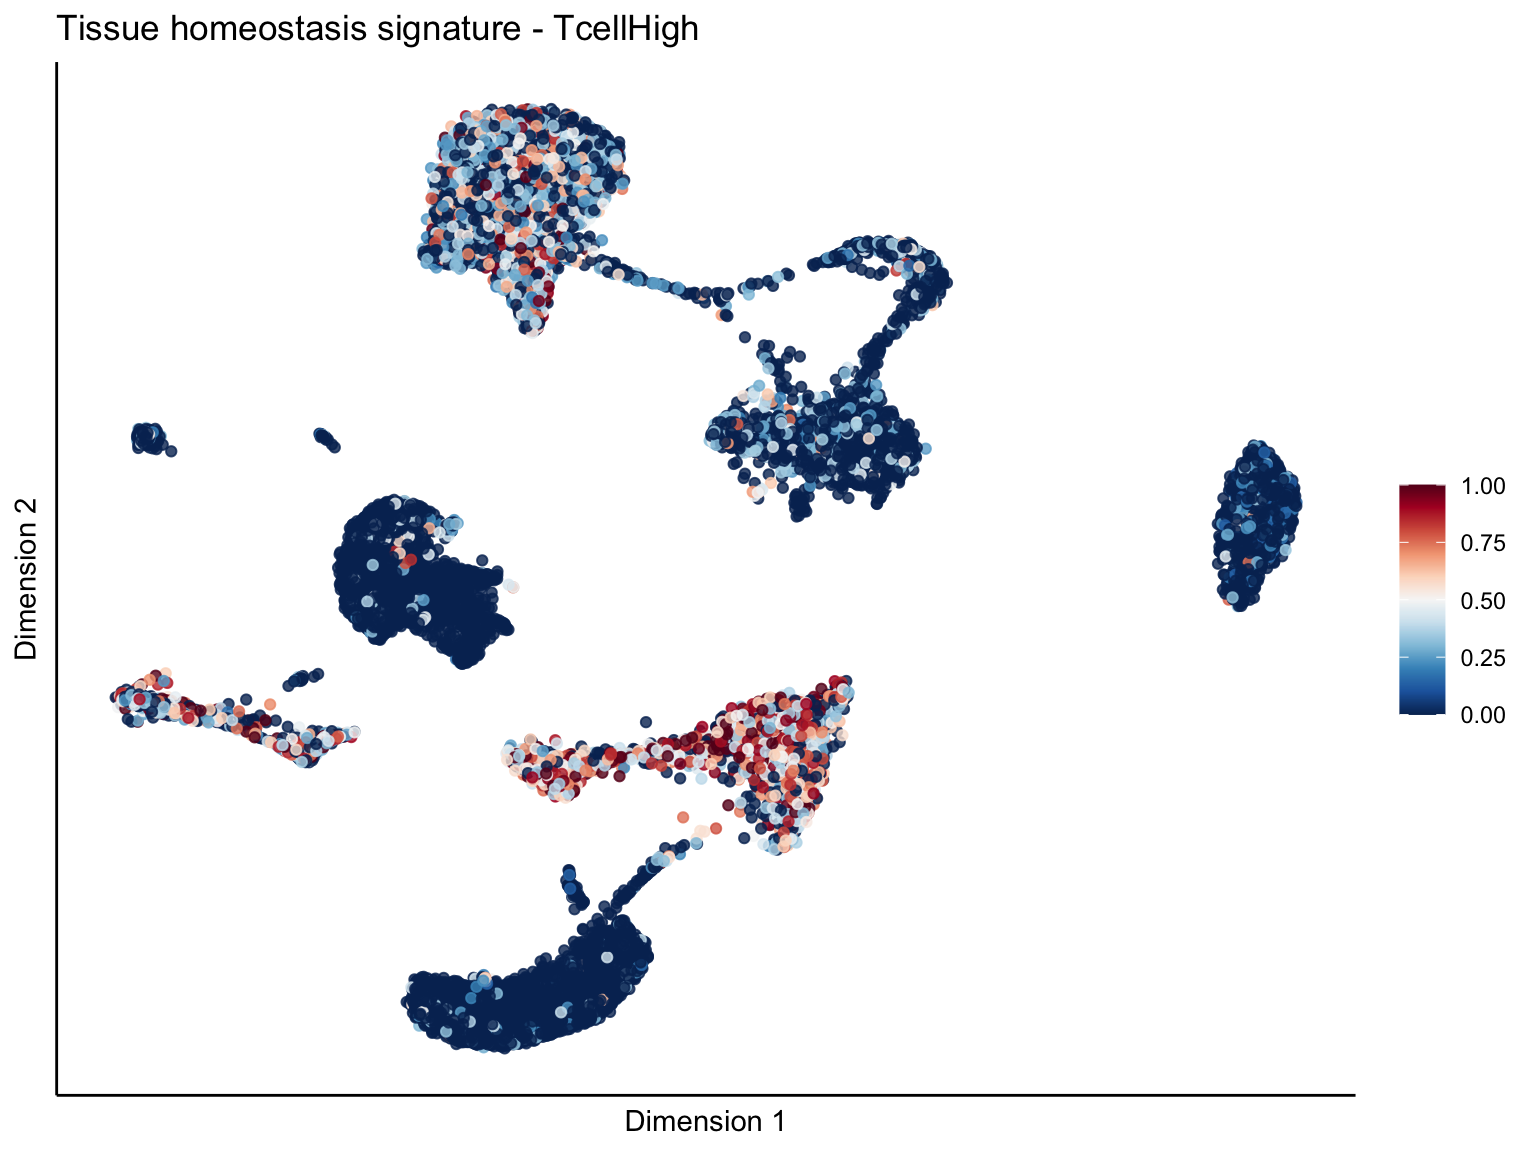
| Version | Author | Date |
|---|---|---|
| 66c2208 | mluetge | 2022-12-08 |
[[4]][[2]]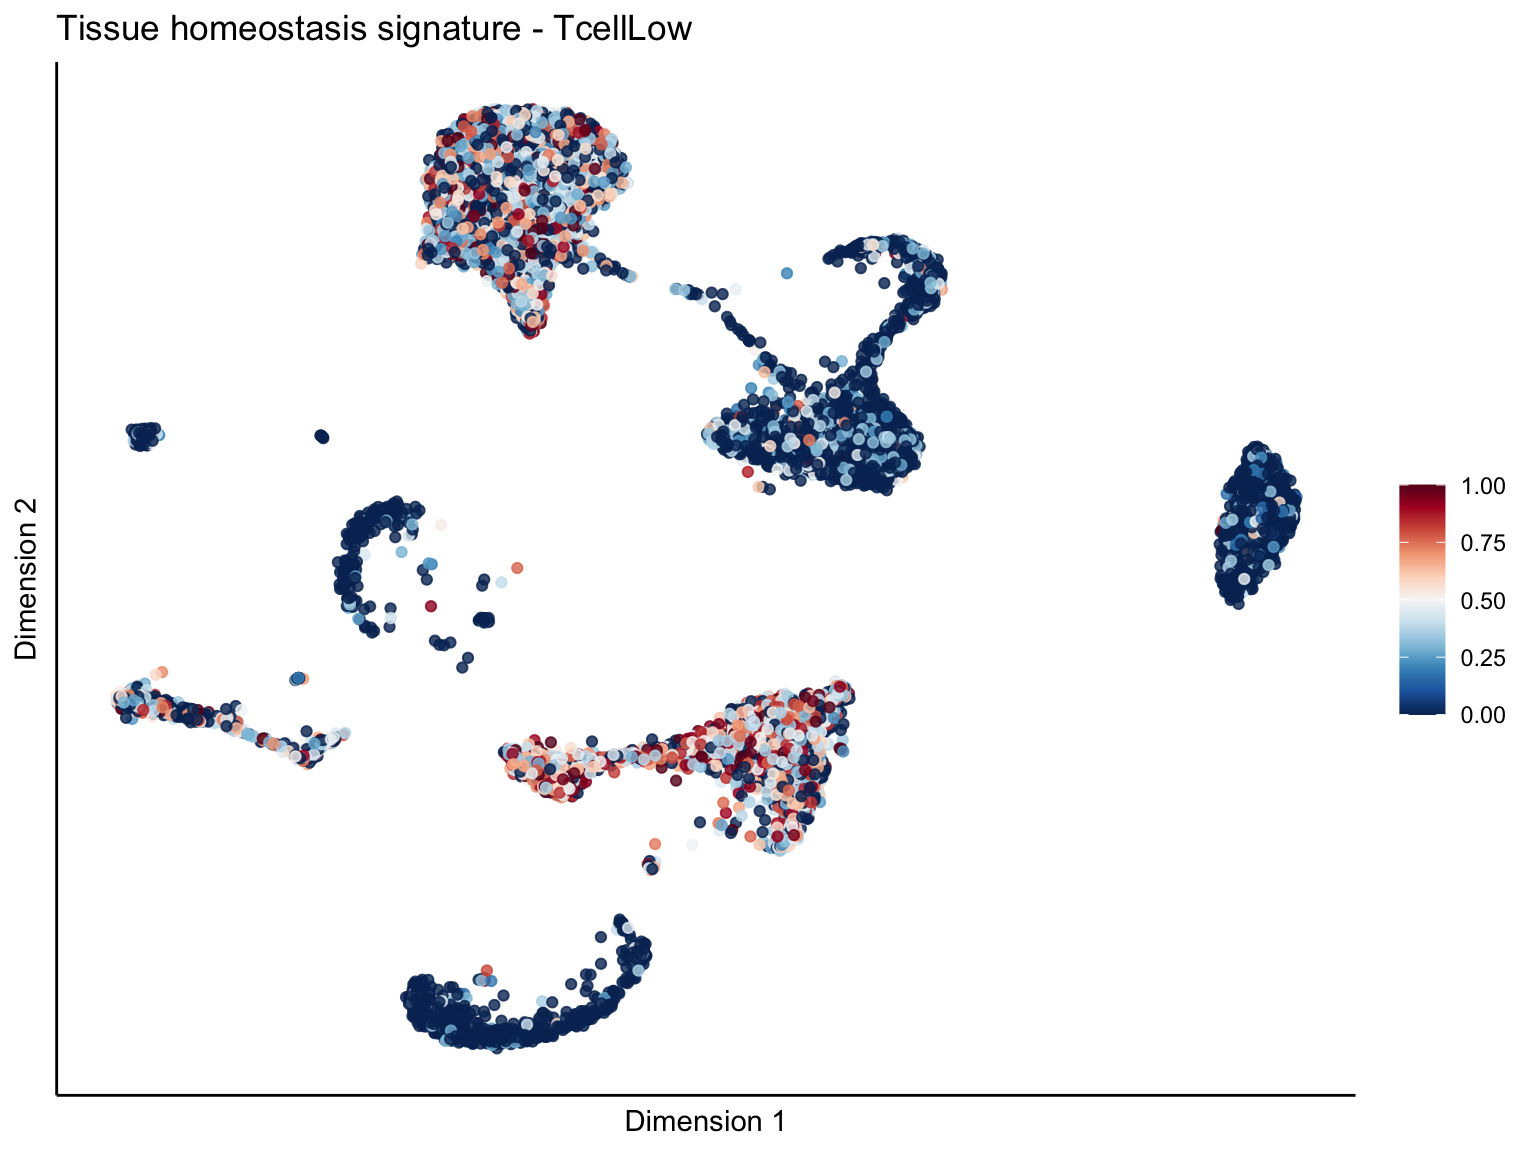
| Version | Author | Date |
|---|---|---|
| 66c2208 | mluetge | 2022-12-08 |
[[4]][[3]]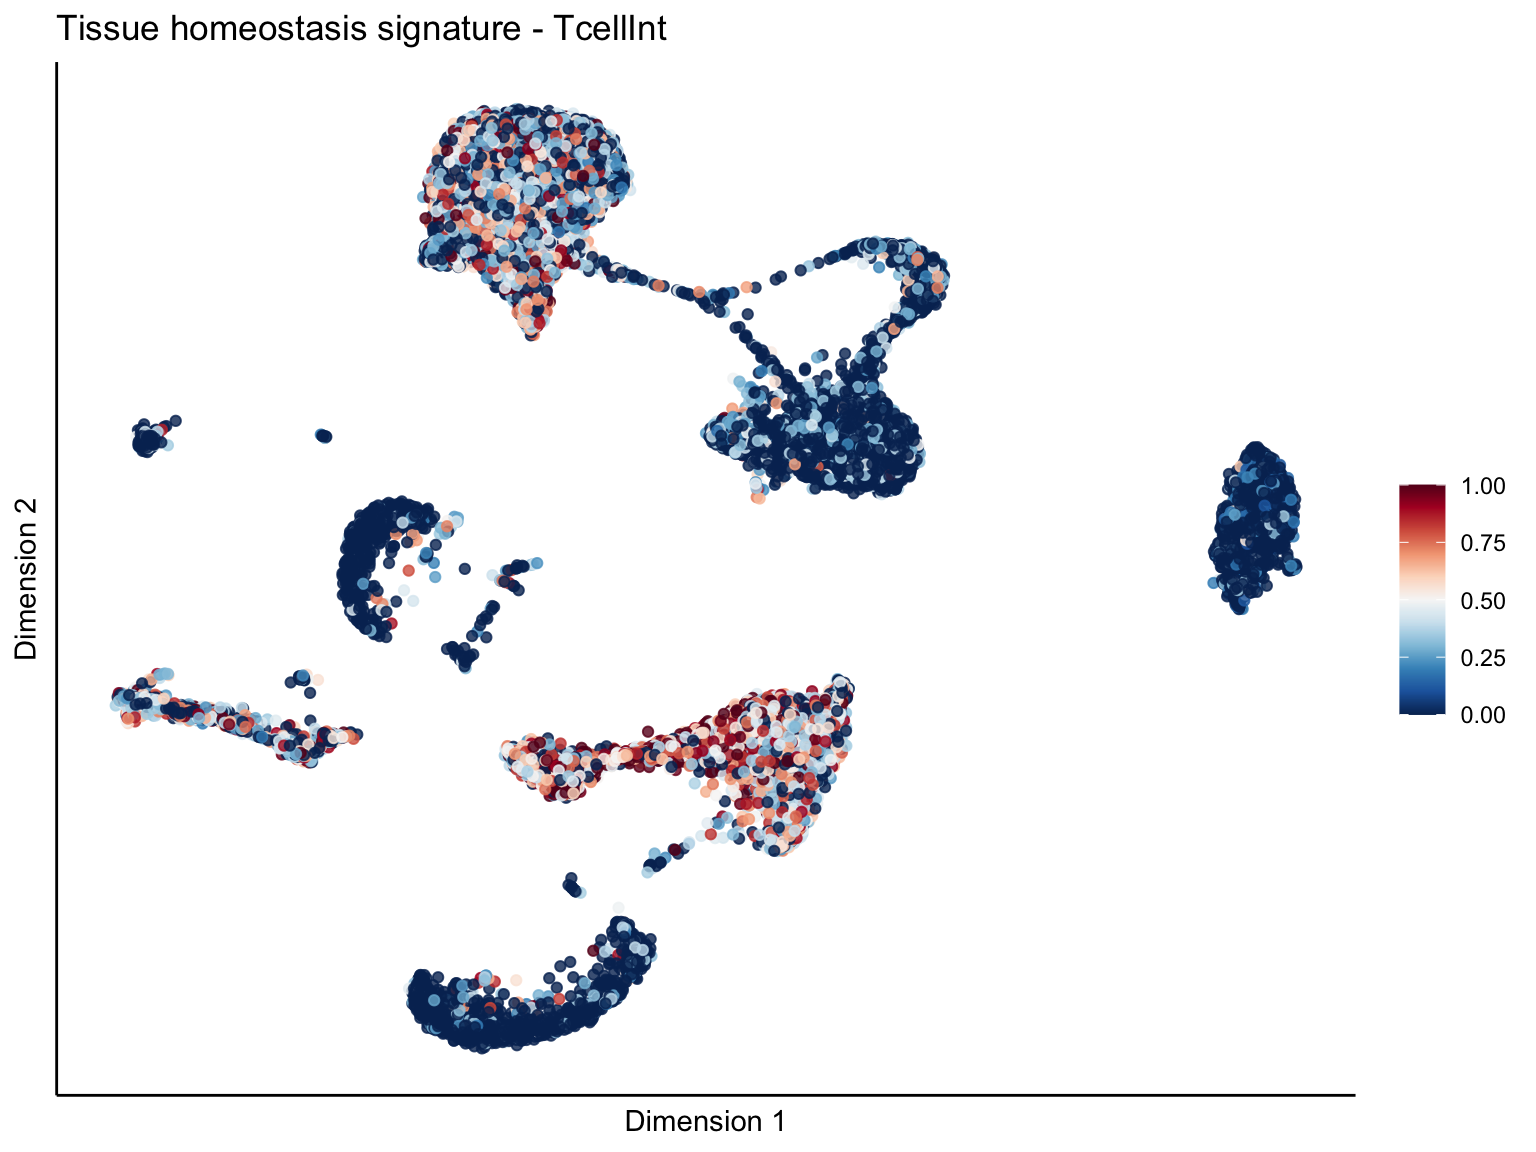
| Version | Author | Date |
|---|---|---|
| 66c2208 | mluetge | 2022-12-08 |
pal = viridis(100)
sc <- scale_colour_gradientn(colours = pal, limits=c(0, cutOff))
lapply(unique(signDat$signature), function(sign){
  signGenes <- signDat %>% dplyr::filter(signature == sign)
  sceSub <- sce[which(rownames(sce) %in% signGenes$geneID),]
  cntMat <- rowSums(t(as.matrix(sceSub@assays@data$logcounts)))/nrow(signGenes)
  sceSub$sign <- cntMat
  sceSub$sign[which(sceSub$sign > cutOff)] <- cutOff
  sceSub$sign[which(sceSub$sign < 0)] <- 0
  lapply(treatGrps, function(treat){
    sceSubT <- sceSub[, which(sceSub$TcellGrp == treat)]
    p <- visGroup_adapt(sceSubT, 'sign', dim_red = 'UMAP') +
    sc +
    guides(colour = guide_colourbar(title = '')) +
    ggtitle(paste0(sign, ' signature - ', treat)) +
    theme_classic() +
    theme(axis.text = element_blank(),
          axis.ticks = element_blank()) +
    labs(x='Dimension 1', y='Dimension 2')
    p
  })
})
[[1]]
[[1]][[1]]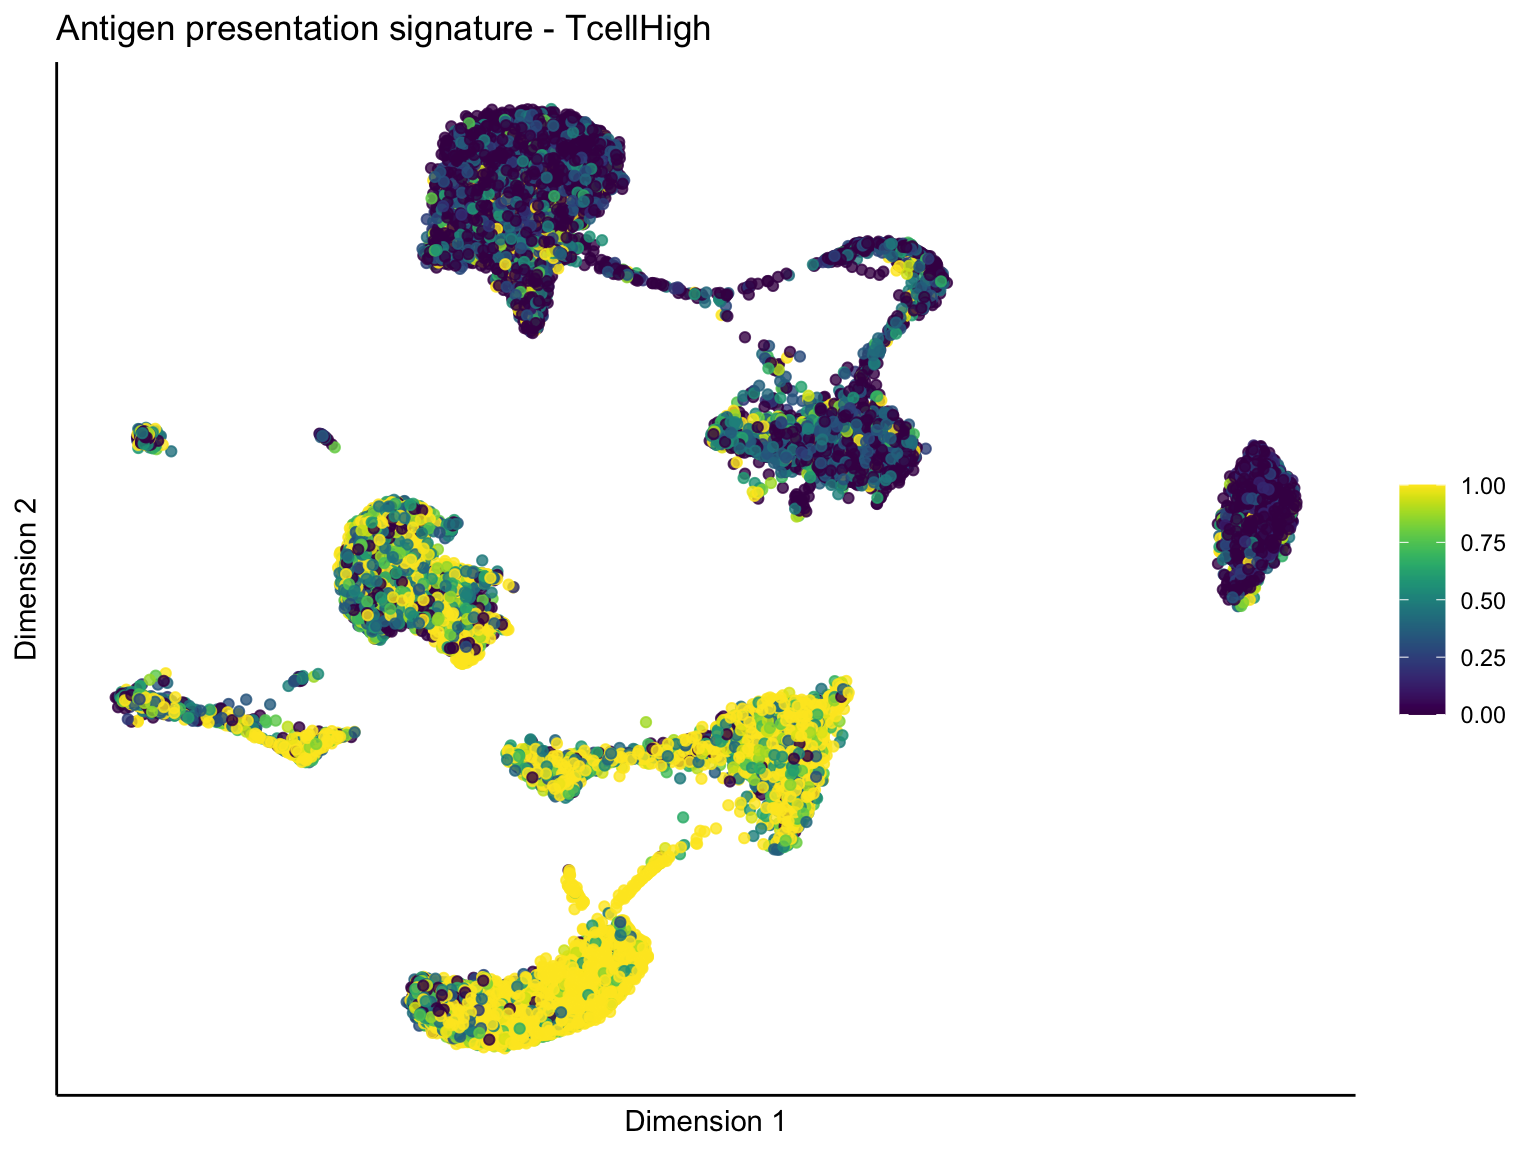
| Version | Author | Date |
|---|---|---|
| 66c2208 | mluetge | 2022-12-08 |
[[1]][[2]]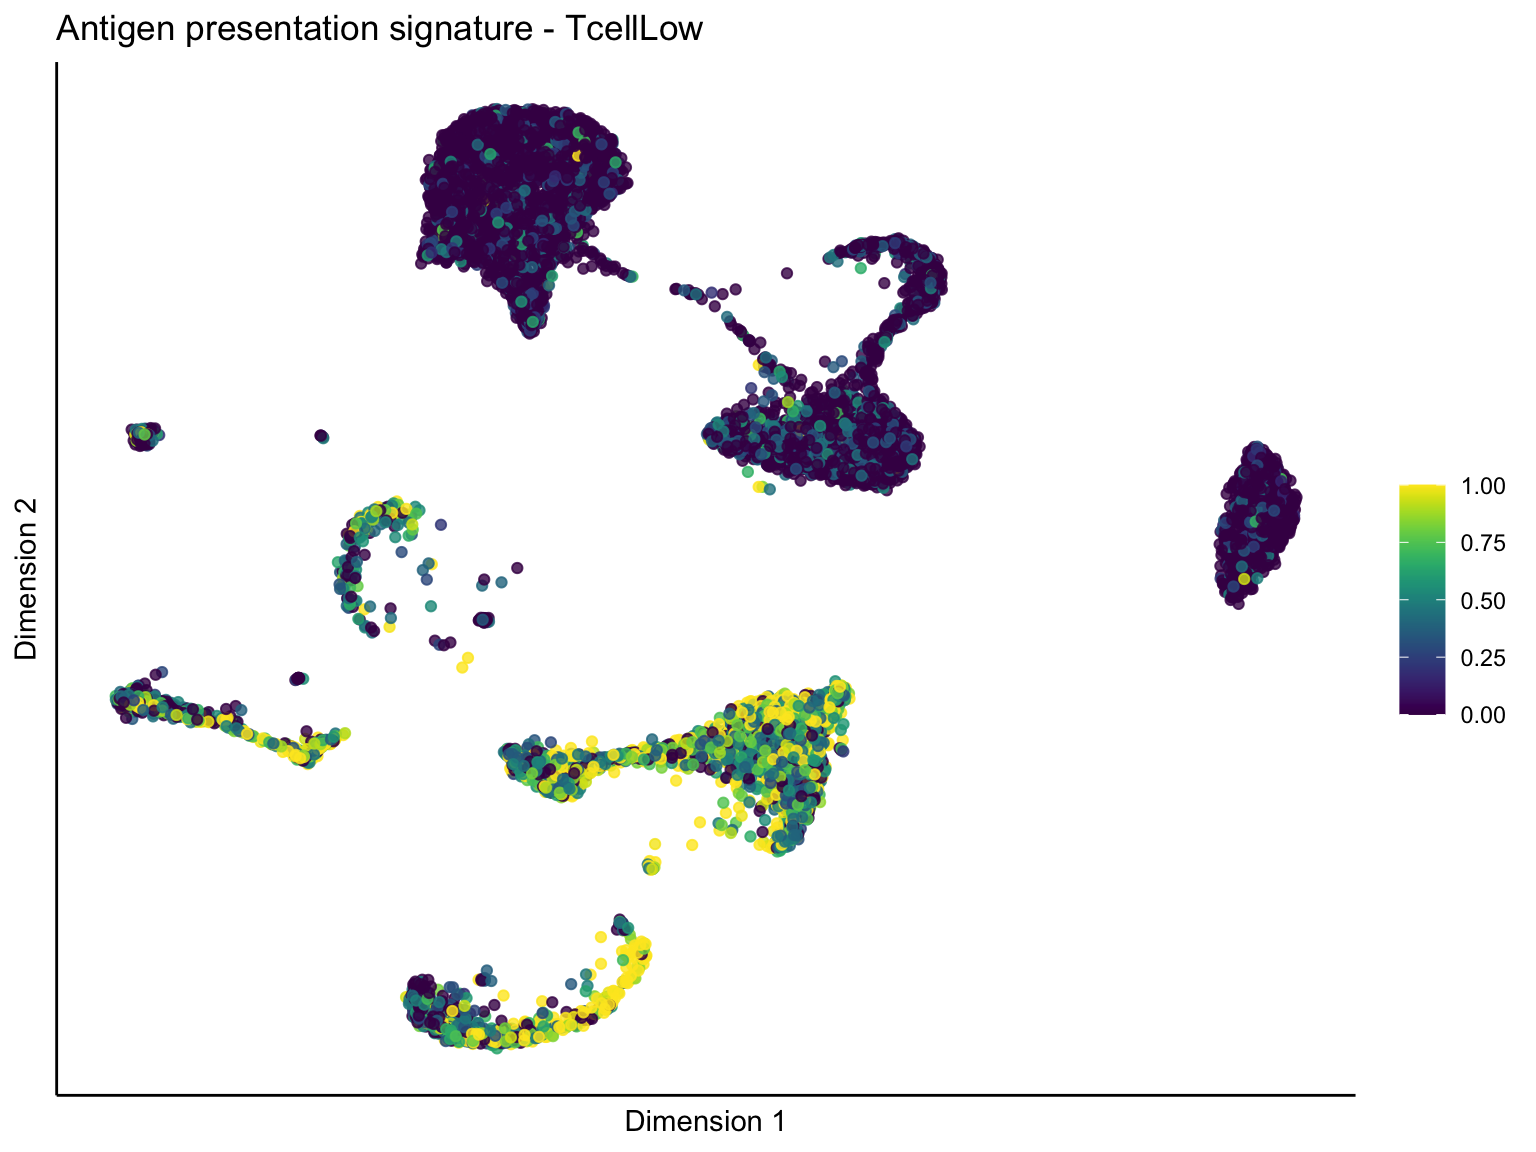
| Version | Author | Date |
|---|---|---|
| 66c2208 | mluetge | 2022-12-08 |
[[1]][[3]]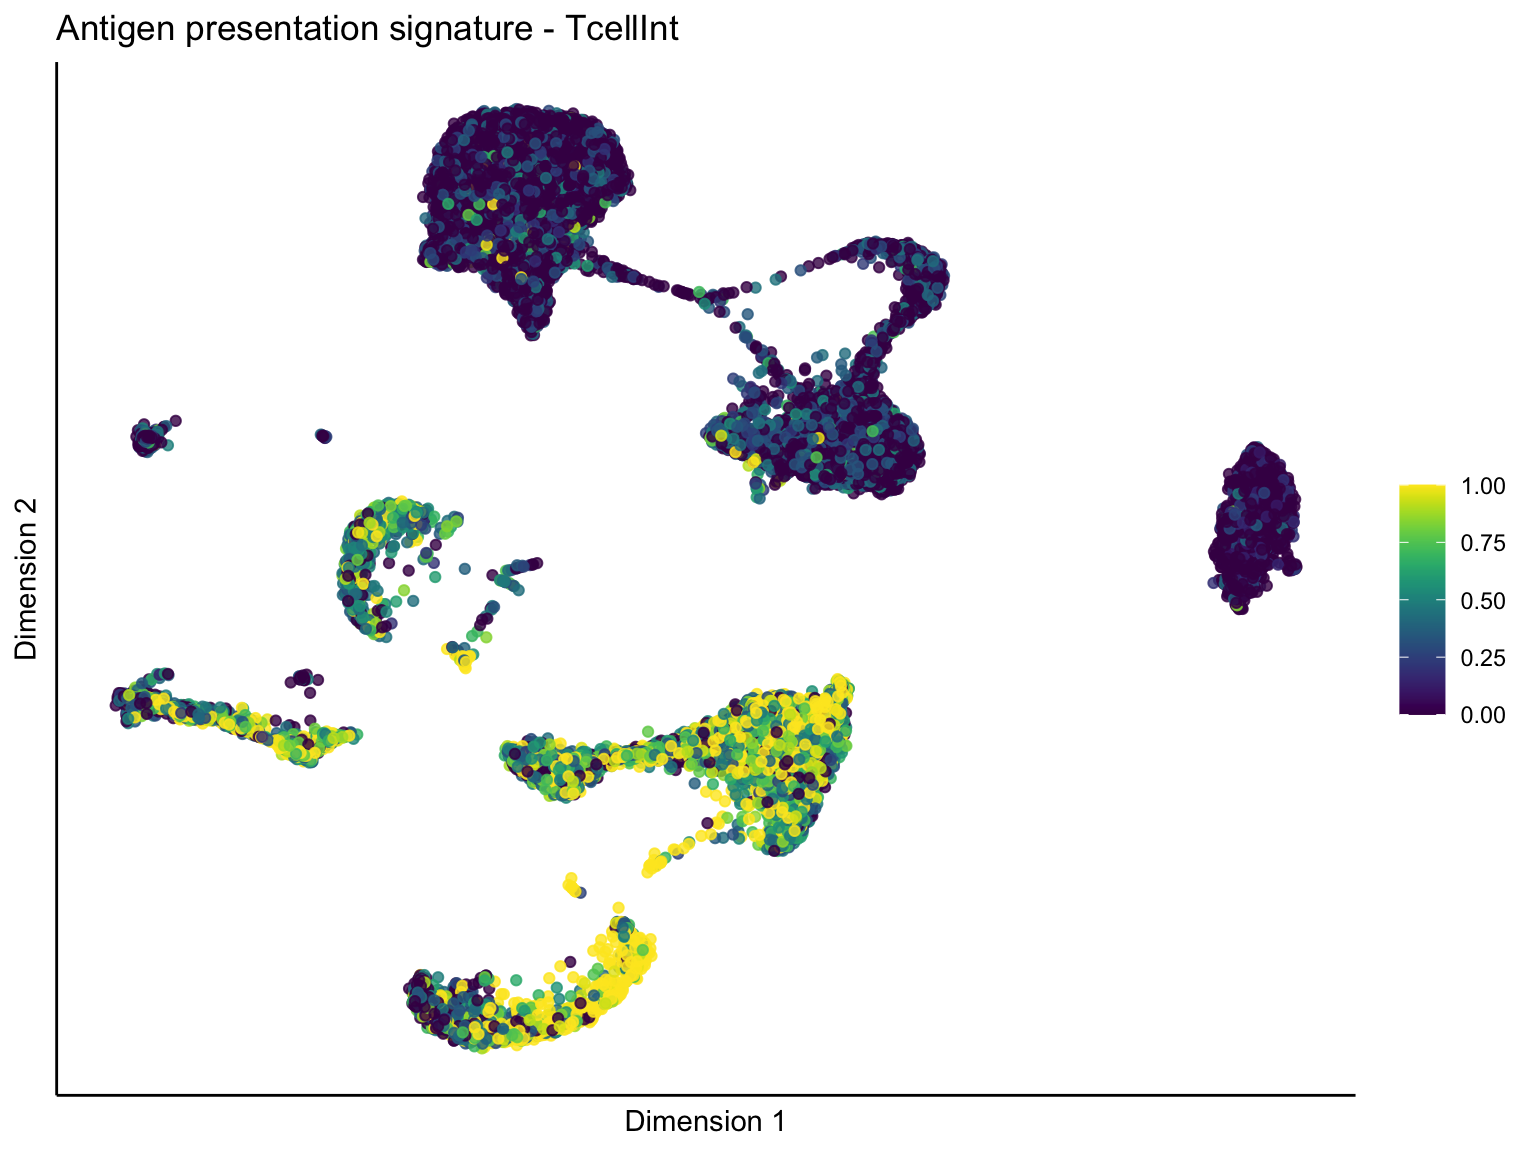
| Version | Author | Date |
|---|---|---|
| 66c2208 | mluetge | 2022-12-08 |
[[2]]
[[2]][[1]]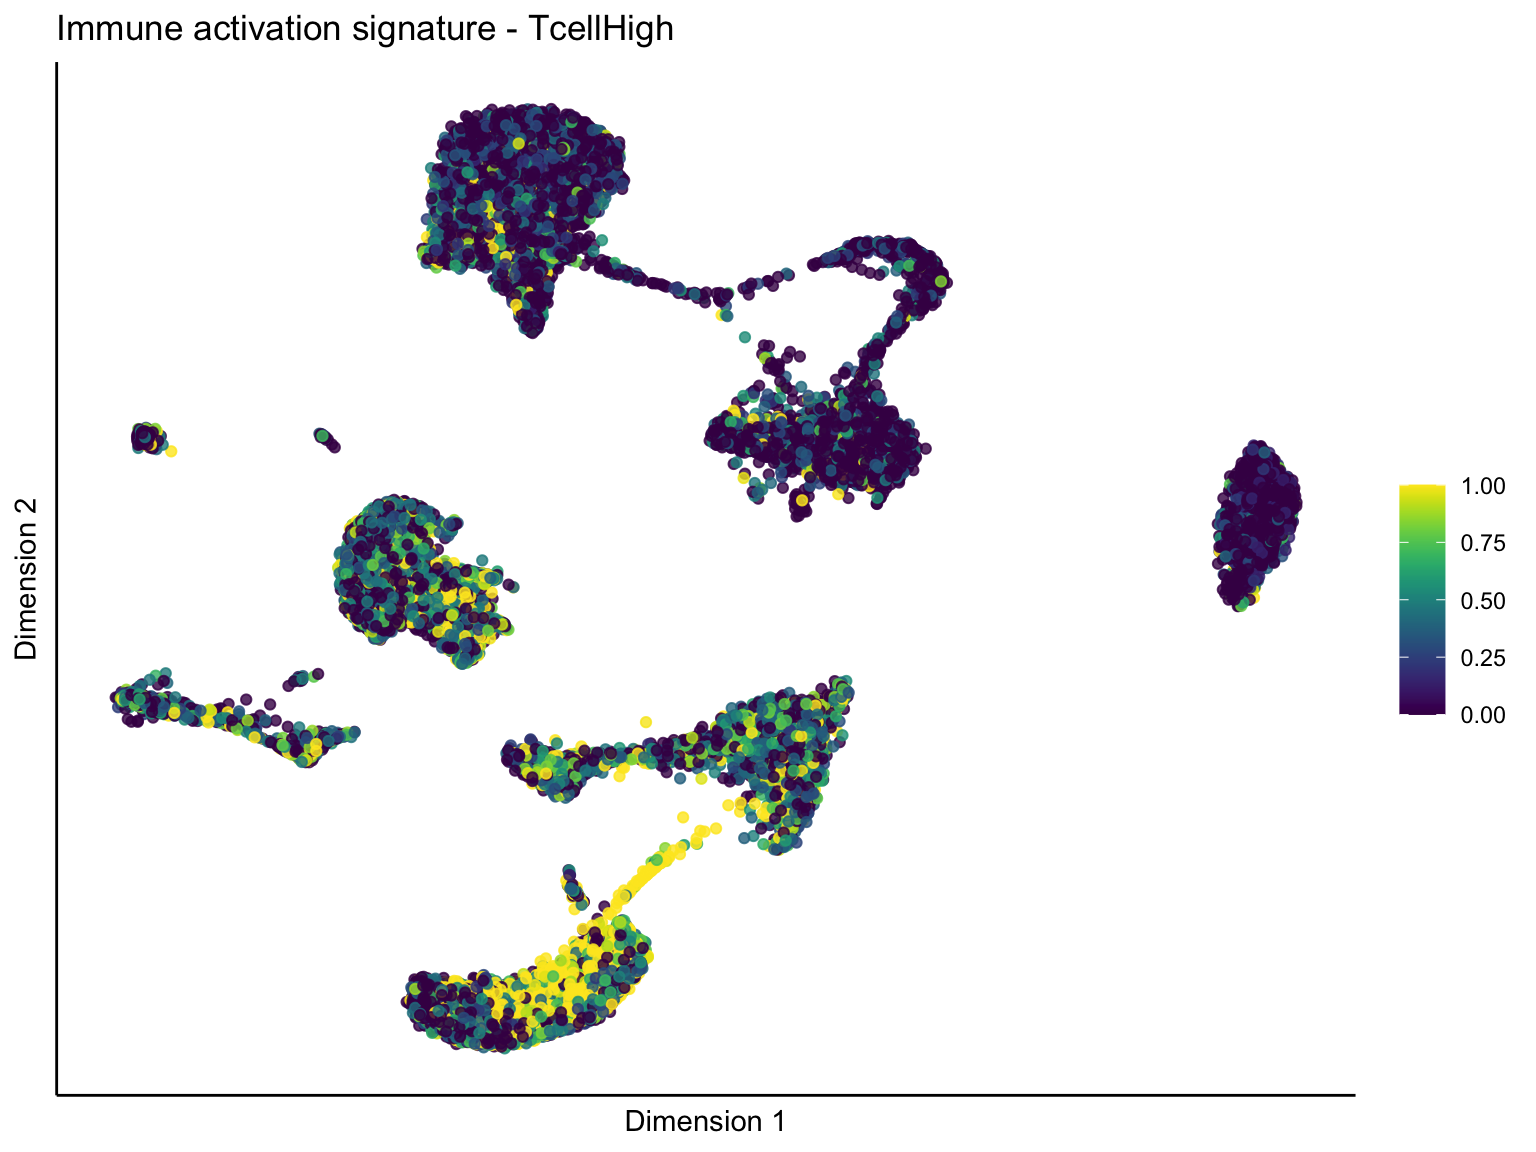
| Version | Author | Date |
|---|---|---|
| 66c2208 | mluetge | 2022-12-08 |
[[2]][[2]]
| Version | Author | Date |
|---|---|---|
| 66c2208 | mluetge | 2022-12-08 |
[[2]][[3]]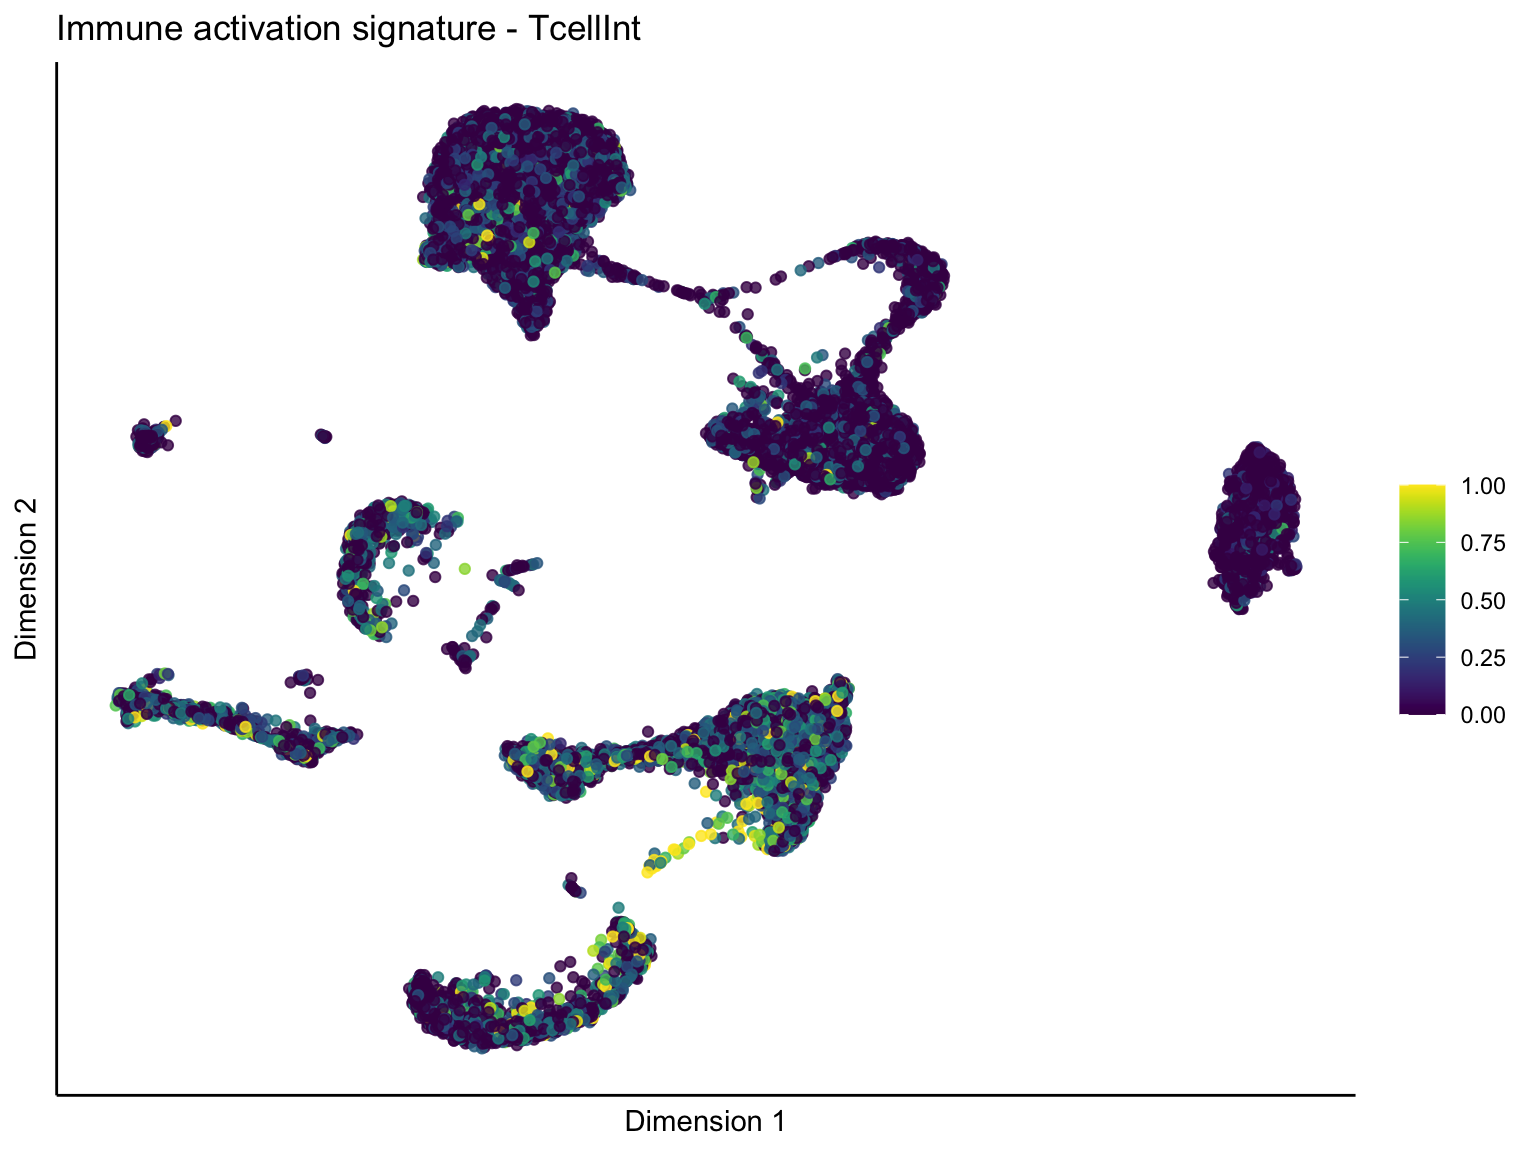
| Version | Author | Date |
|---|---|---|
| 66c2208 | mluetge | 2022-12-08 |
[[3]]
[[3]][[1]]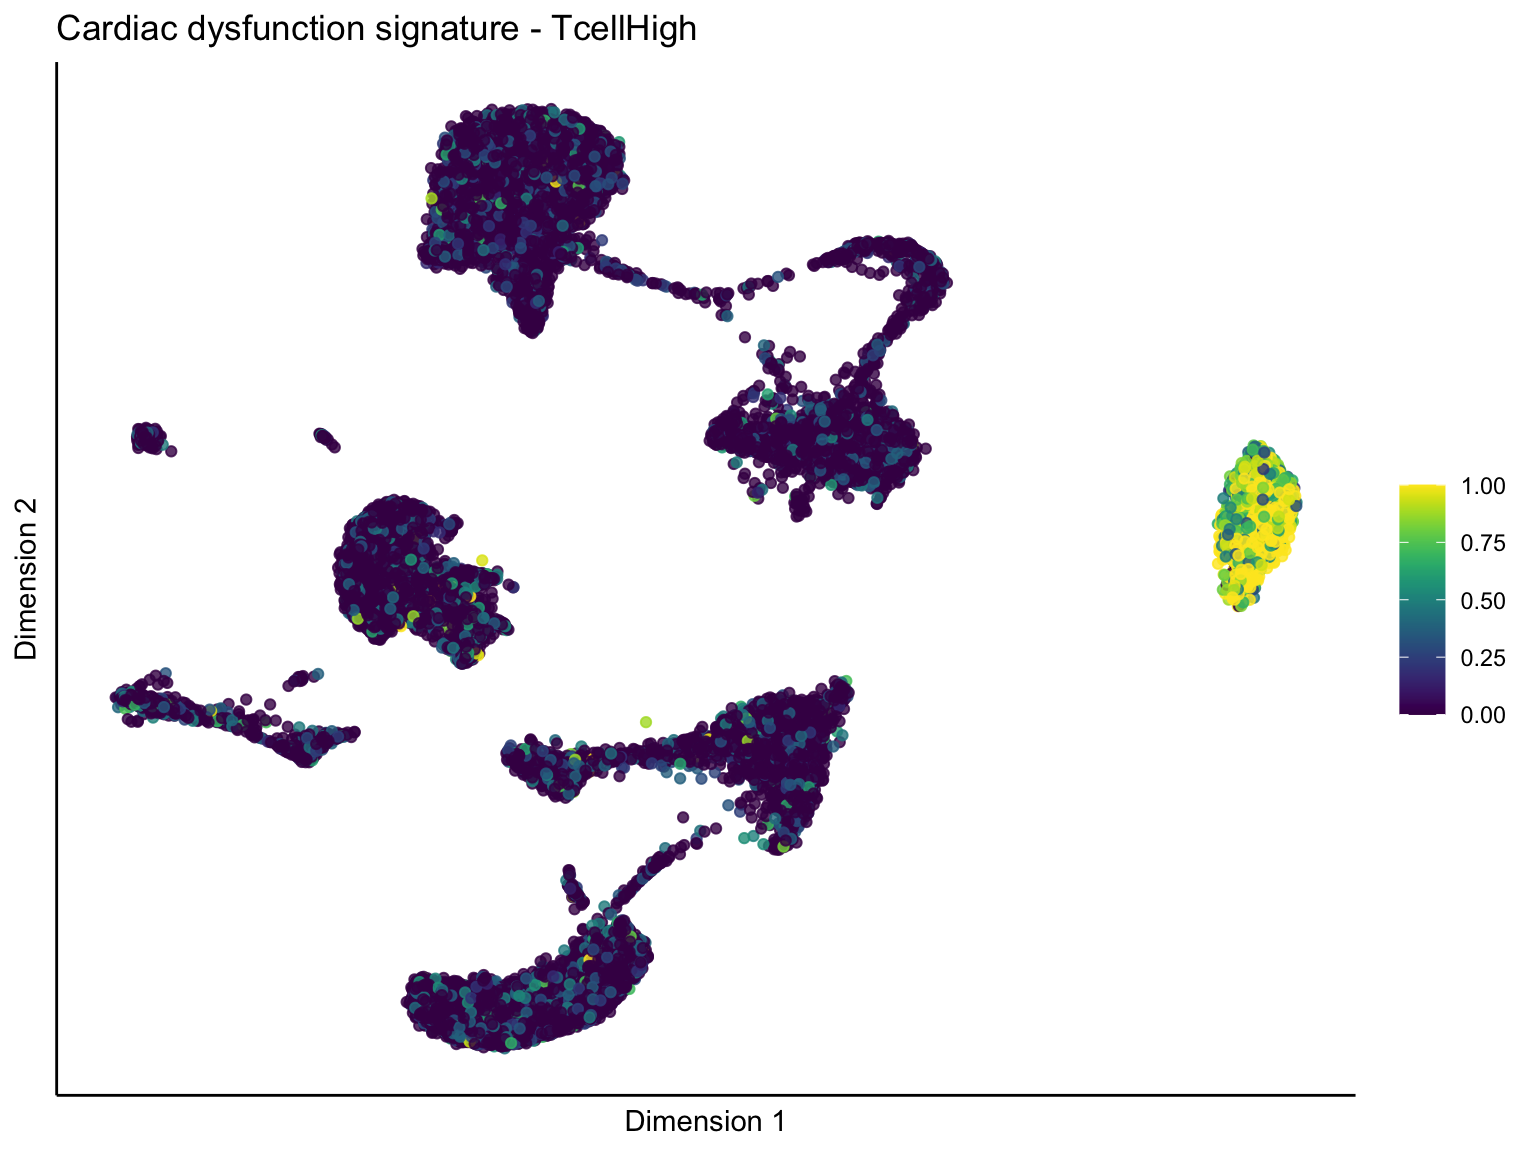
| Version | Author | Date |
|---|---|---|
| 66c2208 | mluetge | 2022-12-08 |
[[3]][[2]]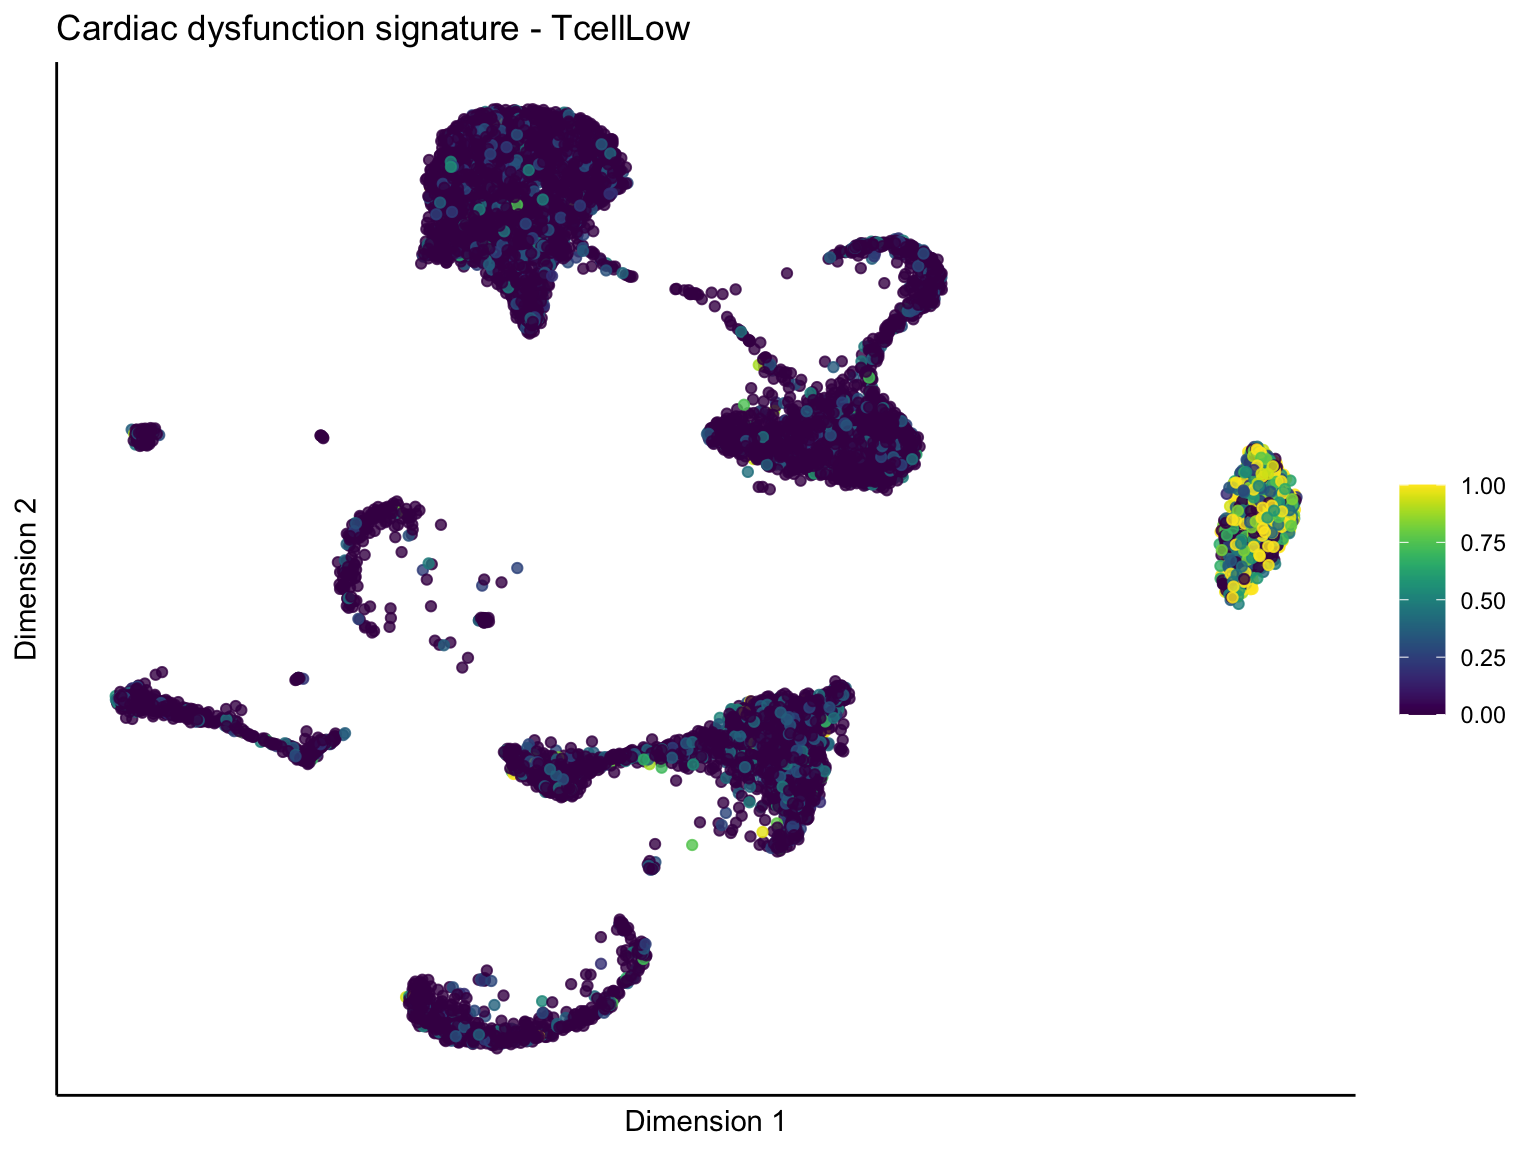
| Version | Author | Date |
|---|---|---|
| 66c2208 | mluetge | 2022-12-08 |
[[3]][[3]]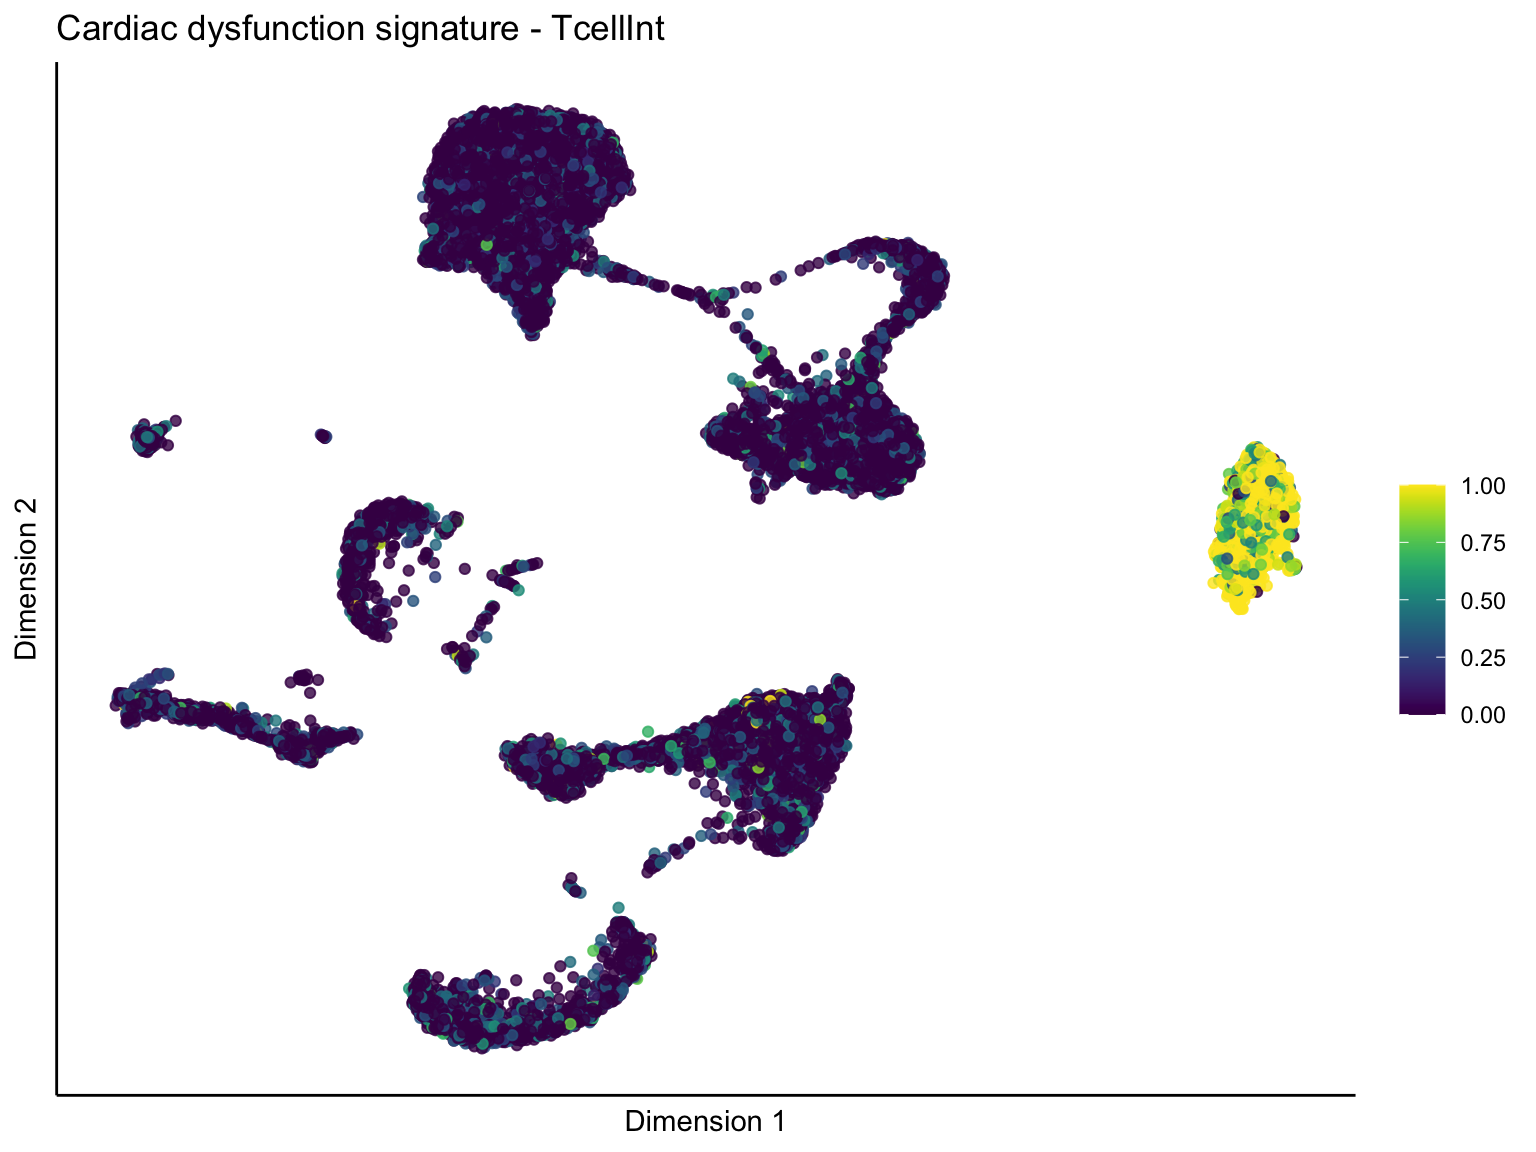
| Version | Author | Date |
|---|---|---|
| 66c2208 | mluetge | 2022-12-08 |
[[4]]
[[4]][[1]]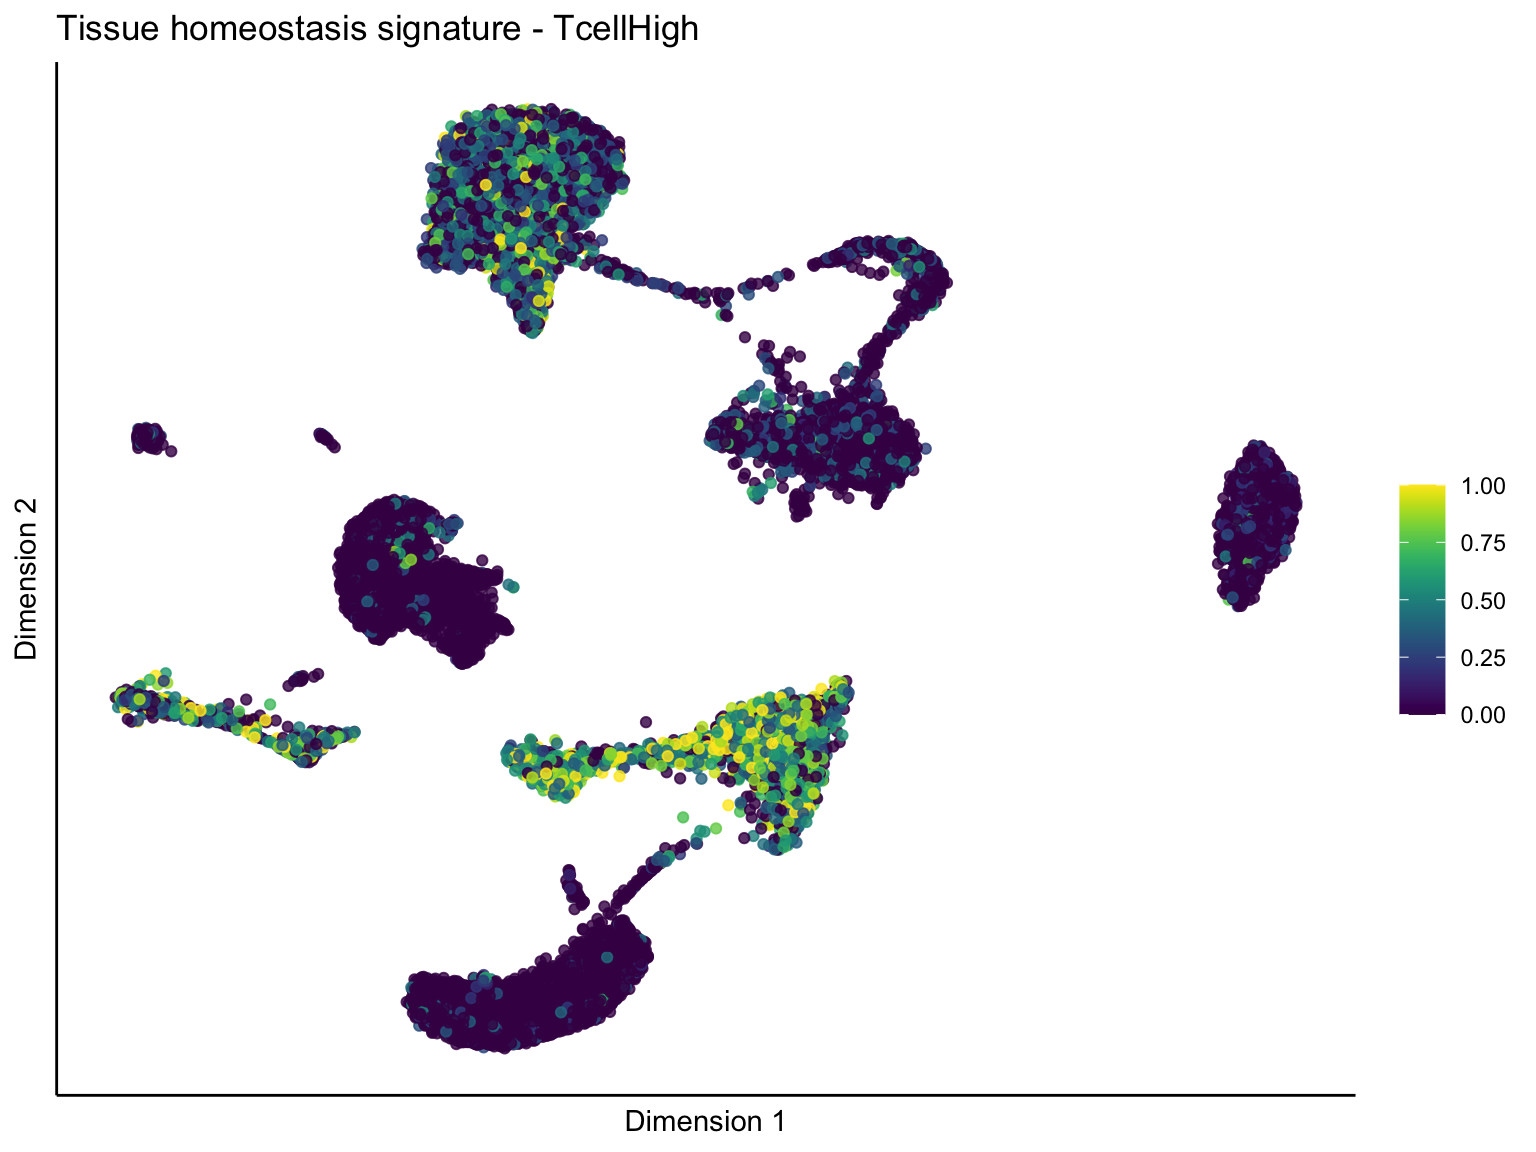
| Version | Author | Date |
|---|---|---|
| 66c2208 | mluetge | 2022-12-08 |
[[4]][[2]]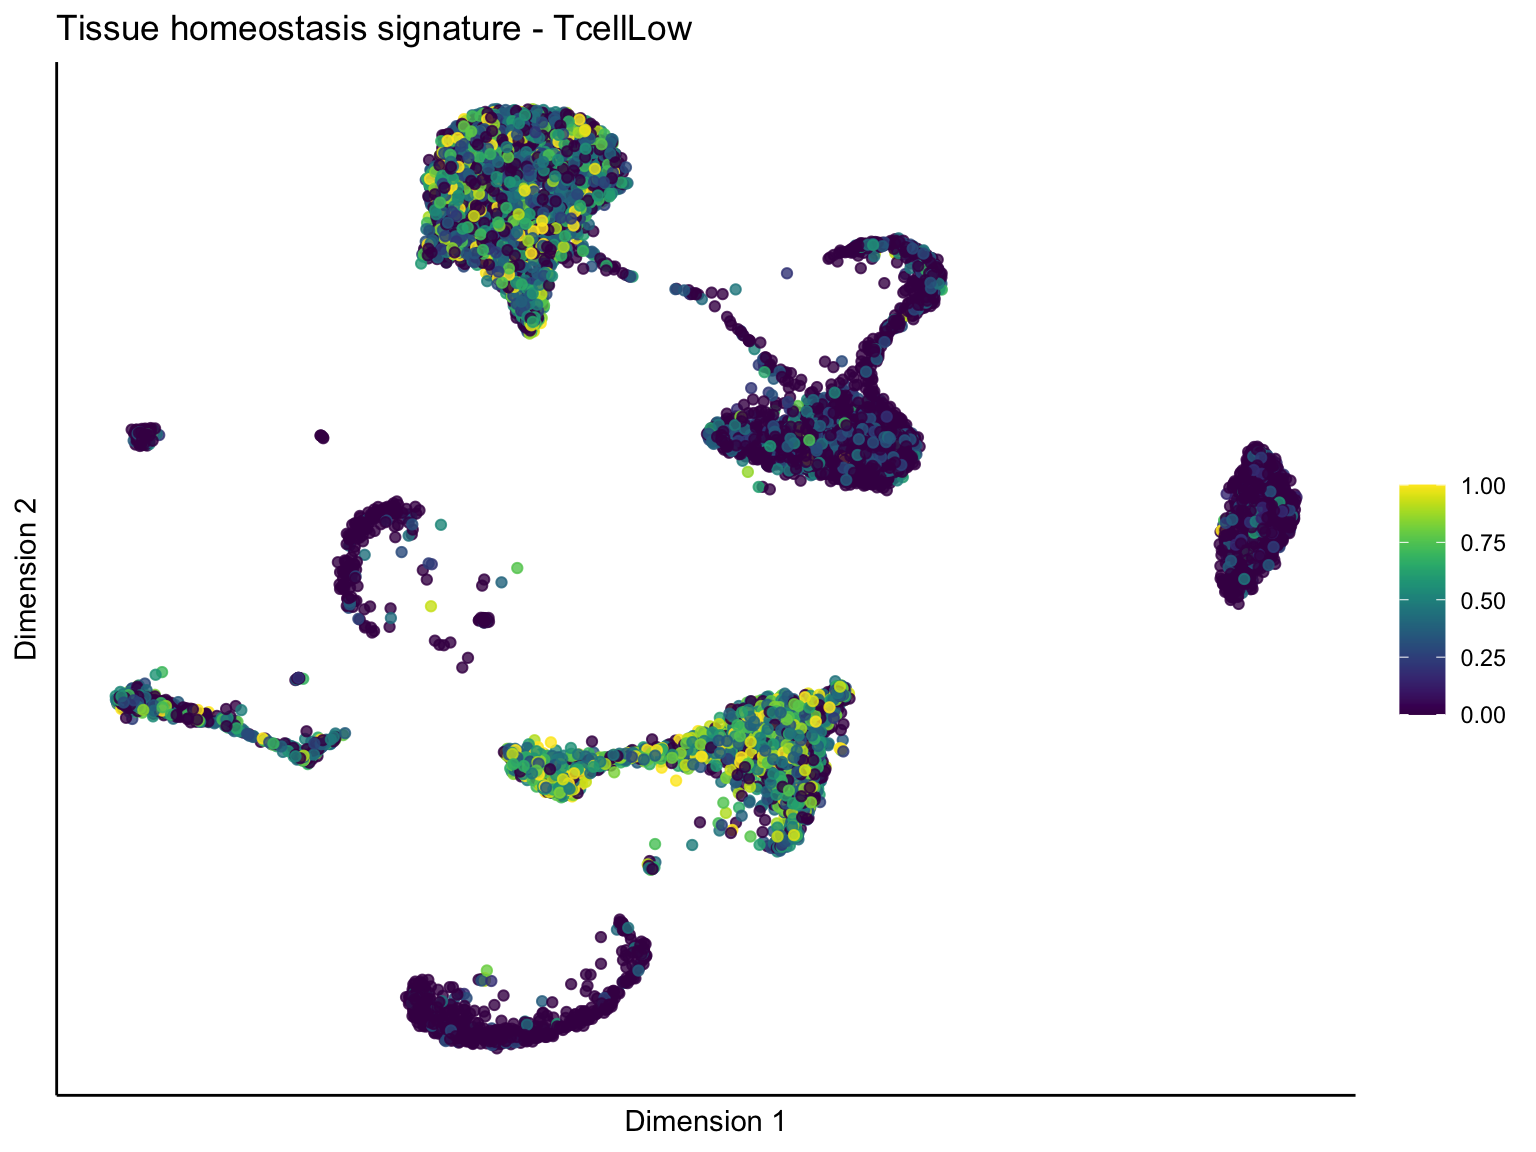
| Version | Author | Date |
|---|---|---|
| 66c2208 | mluetge | 2022-12-08 |
[[4]][[3]]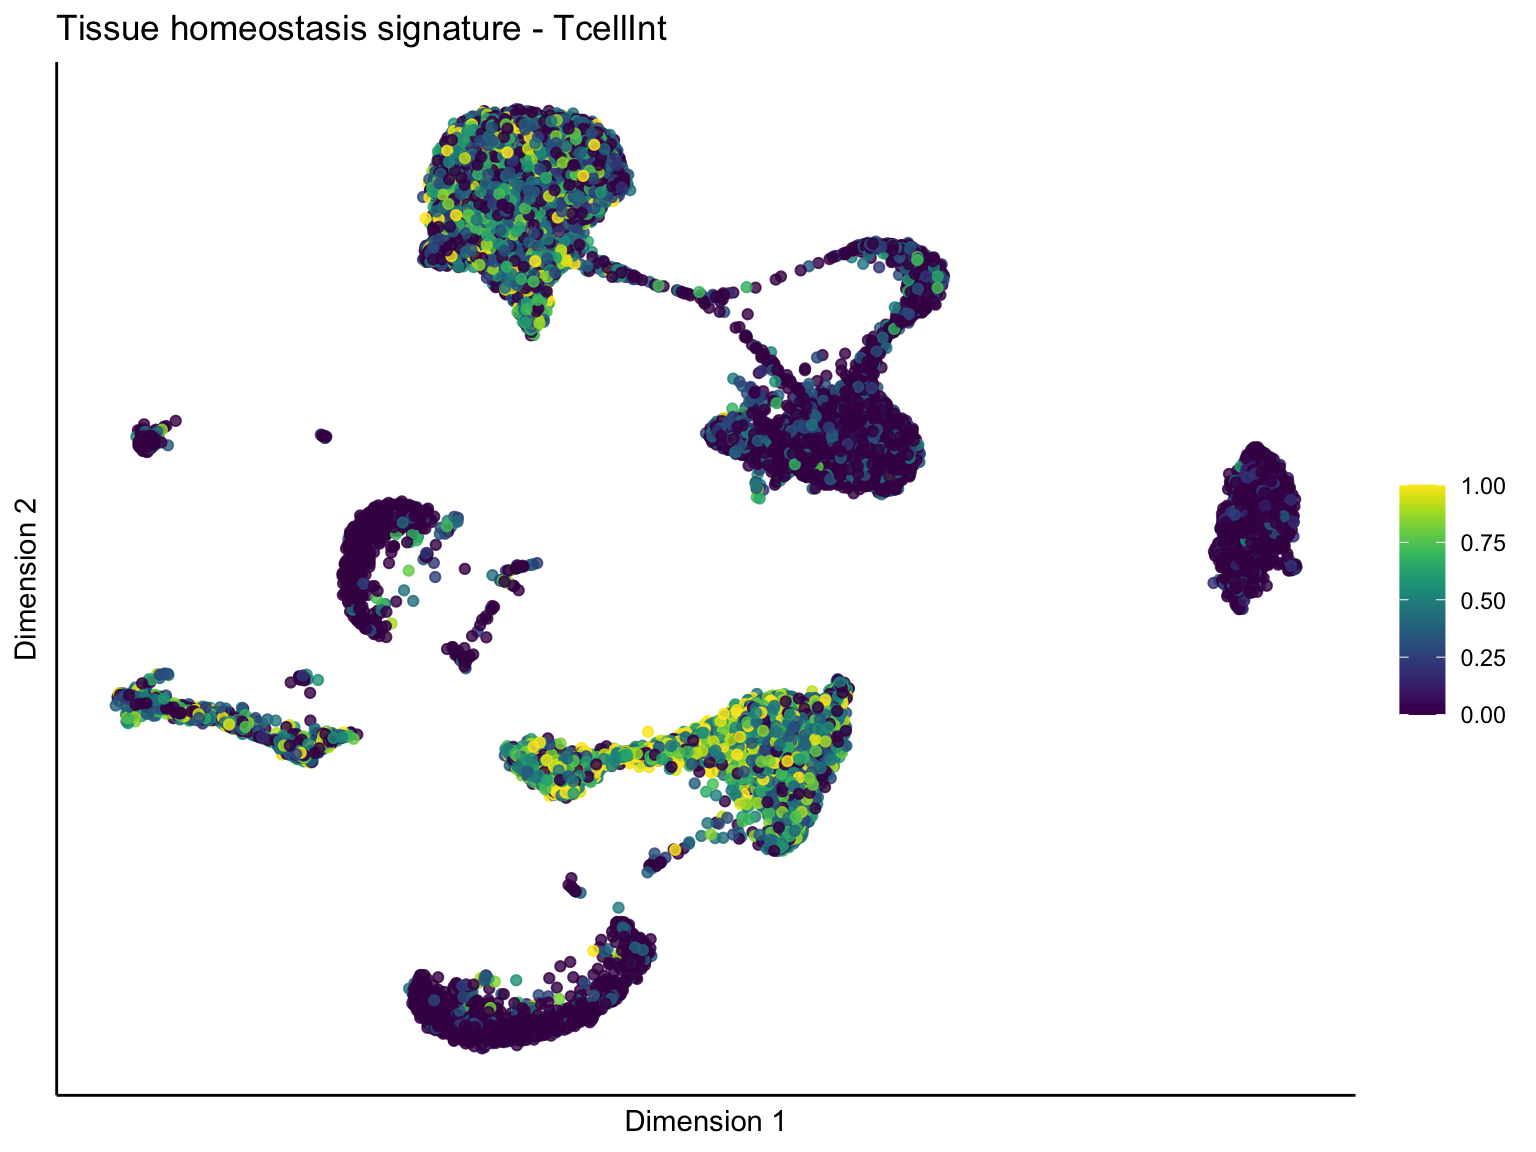
| Version | Author | Date |
|---|---|---|
| 66c2208 | mluetge | 2022-12-08 |
project signatures on heatmap
signDat <- read_delim(file = paste0(basedir,
                    "/data/GSEA/selGenesSignature2.txt"),
                    delim = "\t")
genes <- data.frame(geneID=rownames(seurat)) %>%
  mutate(gene=gsub("^.*\\.", "", geneID))
signDat <- signDat %>% left_join(.,genes, by="gene")

## only CM, Fibroblasts, Tcells and Myeloids
selLabel <- c("Tcell","resMacrophage", "Fibroblast","infMacrophage",
              "Cardiomyocyte")
seurat <- subset(seurat, label %in% selLabel)
seurat$label2 <- seurat$label
seurat$label2[which(seurat$label %in% c("resMacrophage",
                                        "infMacrophage"))] <- "Macrophage"
seurat$label2_plus_grp <- paste0(seurat$label2, "_", seurat$TcellGrp)
table(seurat$label2_plus_grp)
Cardiomyocyte_TcellHigh  Cardiomyocyte_TcellInt  Cardiomyocyte_TcellLow
                   1101                    1260                     871
   Fibroblast_TcellHigh     Fibroblast_TcellInt     Fibroblast_TcellLow
                   3165                    4849                    3162
   Macrophage_TcellHigh     Macrophage_TcellInt     Macrophage_TcellLow
                   3571                    1121                     604
        Tcell_TcellHigh          Tcell_TcellInt          Tcell_TcellLow
                   4409                     728                     231
seurat$label2_plus_grp <- as.factor(seurat$label2_plus_grp)
Idents(seurat) <- seurat$label2_plus_grp
gapVecCol <- seq(3, length(levels(seurat$label2_plus_grp)), by=3)
gapVecDat <- signDat %>% group_by(signature) %>% summarise(cnt=n())
gapVecRow <- cumsum(gapVecDat$cnt)
colLab2 <- c("#ba4e45", "#d4cc84", "#546f82", "#8d5639")
names(colLab2) <- c("Tcell","Macrophage","Fibroblast","Cardiomyocyte")
pOut <- avgHeatmap(seurat = seurat, selGenes = signDat,
colVecIdent = colLab2, colVecCond=colTgrp,
ordVec=levels(seurat),
gapVecR=gapVecRow, gapVecC=gapVecCol,cc=FALSE,
cr=F, condCol=T)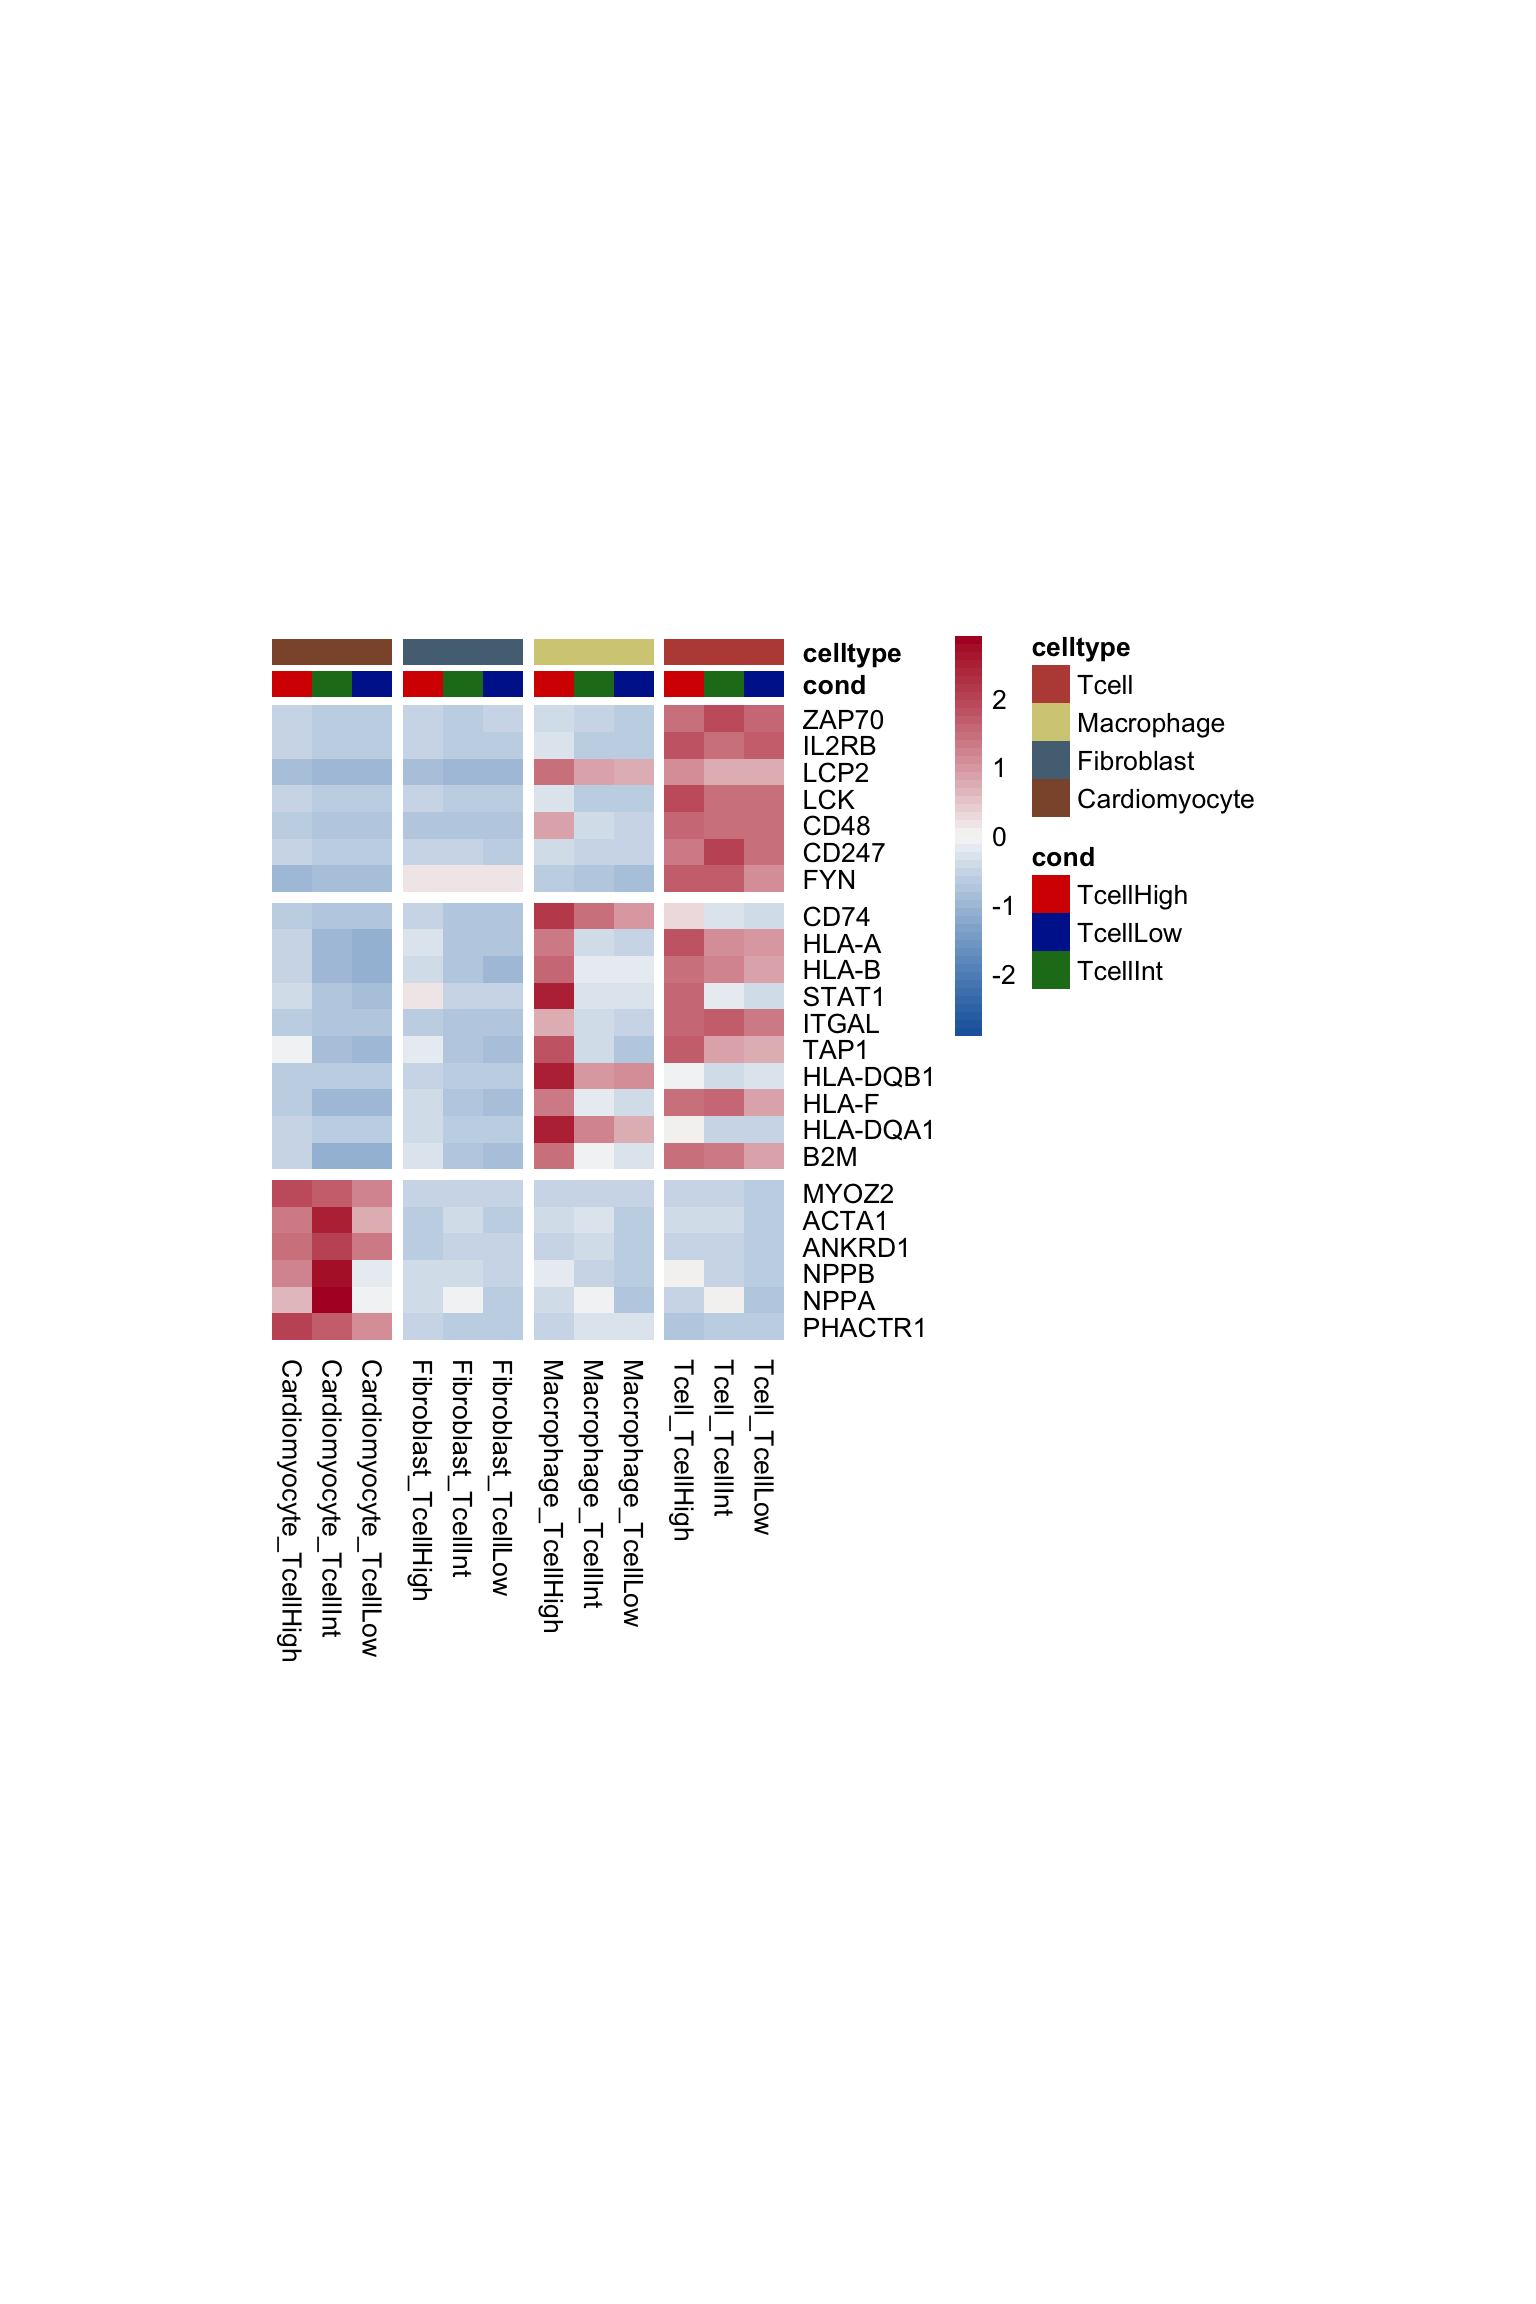
session info
sessionInfo()R version 4.2.1 (2022-06-23)
Platform: x86_64-apple-darwin17.0 (64-bit)
Running under: macOS Big Sur ... 10.16
Matrix products: default
BLAS: /Library/Frameworks/R.framework/Versions/4.2/Resources/lib/libRblas.0.dylib
LAPACK: /Library/Frameworks/R.framework/Versions/4.2/Resources/lib/libRlapack.dylib
locale:
[1] en_US.UTF-8/en_US.UTF-8/en_US.UTF-8/C/en_US.UTF-8/en_US.UTF-8
attached base packages:
[1] stats4 stats graphics grDevices utils datasets methods
[8] base
other attached packages:
[1] viridis_0.6.2 viridisLite_0.4.1
[3] RColorBrewer_1.1-3 ggpubr_0.5.0
[5] pheatmap_1.0.12 ggsci_2.9
[7] runSeurat3_0.1.0 here_1.0.1
[9] magrittr_2.0.3 SeuratObject_4.1.3
[11] Seurat_4.3.0 forcats_0.5.2
[13] stringr_1.5.0 dplyr_1.0.10
[15] purrr_0.3.5 readr_2.1.3
[17] tidyr_1.2.1 tibble_3.1.8
[19] ggplot2_3.4.0 tidyverse_1.3.2
[21] SingleCellExperiment_1.18.1 SummarizedExperiment_1.26.1
[23] Biobase_2.56.0 GenomicRanges_1.48.0
[25] GenomeInfoDb_1.32.4 IRanges_2.30.1
[27] S4Vectors_0.34.0 BiocGenerics_0.42.0
[29] MatrixGenerics_1.8.1 matrixStats_0.63.0
loaded via a namespace (and not attached):
[1] utf8_1.2.2 spatstat.explore_3.0-5 reticulate_1.26
[4] tidyselect_1.2.0 htmlwidgets_1.5.4 grid_4.2.1
[7] Rtsne_0.16 munsell_0.5.0 codetools_0.2-18
[10] ica_1.0-3 future_1.29.0 miniUI_0.1.1.1
[13] withr_2.5.0 spatstat.random_3.0-1 colorspace_2.0-3
[16] progressr_0.11.0 highr_0.9 knitr_1.41
[19] rstudioapi_0.14 ROCR_1.0-11 ggsignif_0.6.4
[22] tensor_1.5 listenv_0.8.0 labeling_0.4.2
[25] git2r_0.30.1 GenomeInfoDbData_1.2.8 polyclip_1.10-4
[28] bit64_4.0.5 farver_2.1.1 rprojroot_2.0.3
[31] parallelly_1.32.1 vctrs_0.5.1 generics_0.1.3
[34] xfun_0.35 timechange_0.1.1 R6_2.5.1
[37] bitops_1.0-7 spatstat.utils_3.0-1 cachem_1.0.6
[40] DelayedArray_0.22.0 assertthat_0.2.1 vroom_1.6.0
[43] promises_1.2.0.1 scales_1.2.1 googlesheets4_1.0.1
[46] gtable_0.3.1 globals_0.16.2 goftest_1.2-3
[49] workflowr_1.7.0 rlang_1.0.6 splines_4.2.1
[52] rstatix_0.7.1 lazyeval_0.2.2 gargle_1.2.1
[55] spatstat.geom_3.0-3 broom_1.0.1 yaml_2.3.6
[58] reshape2_1.4.4 abind_1.4-5 modelr_0.1.10
[61] backports_1.4.1 httpuv_1.6.6 tools_4.2.1
[64] ellipsis_0.3.2 jquerylib_0.1.4 ggridges_0.5.4
[67] Rcpp_1.0.9 plyr_1.8.8 zlibbioc_1.42.0
[70] RCurl_1.98-1.9 deldir_1.0-6 pbapply_1.6-0
[73] cowplot_1.1.1 zoo_1.8-11 haven_2.5.1
[76] ggrepel_0.9.2 cluster_2.1.4 fs_1.5.2
[79] data.table_1.14.6 scattermore_0.8 lmtest_0.9-40
[82] reprex_2.0.2 RANN_2.6.1 googledrive_2.0.0
[85] whisker_0.4 fitdistrplus_1.1-8 hms_1.1.2
[88] patchwork_1.1.2 mime_0.12 evaluate_0.18
[91] xtable_1.8-4 readxl_1.4.1 gridExtra_2.3
[94] compiler_4.2.1 KernSmooth_2.23-20 crayon_1.5.2
[97] htmltools_0.5.3 later_1.3.0 tzdb_0.3.0
[100] lubridate_1.9.0 DBI_1.1.3 dbplyr_2.2.1
[103] MASS_7.3-58.1 Matrix_1.5-3 car_3.1-1
[106] cli_3.4.1 parallel_4.2.1 igraph_1.3.5
[109] pkgconfig_2.0.3 sp_1.5-1 plotly_4.10.1
[112] spatstat.sparse_3.0-0 xml2_1.3.3 bslib_0.4.1
[115] XVector_0.36.0 rvest_1.0.3 digest_0.6.30
[118] sctransform_0.3.5 RcppAnnoy_0.0.20 spatstat.data_3.0-0
[121] rmarkdown_2.18 cellranger_1.1.0 leiden_0.4.3
[124] uwot_0.1.14 shiny_1.7.3 lifecycle_1.0.3
[127] nlme_3.1-160 jsonlite_1.8.3 carData_3.0-5
[130] fansi_1.0.3 pillar_1.8.1 lattice_0.20-45
[133] fastmap_1.1.0 httr_1.4.4 survival_3.4-0
[136] glue_1.6.2 png_0.1-8 bit_4.0.5
[139] stringi_1.7.8 sass_0.4.4 irlba_2.3.5.1
[142] future.apply_1.10.0 date()[1] "Fri Dec 9 17:16:25 2022"
sessionInfo()R version 4.2.1 (2022-06-23)
Platform: x86_64-apple-darwin17.0 (64-bit)
Running under: macOS Big Sur ... 10.16
Matrix products: default
BLAS: /Library/Frameworks/R.framework/Versions/4.2/Resources/lib/libRblas.0.dylib
LAPACK: /Library/Frameworks/R.framework/Versions/4.2/Resources/lib/libRlapack.dylib
locale:
[1] en_US.UTF-8/en_US.UTF-8/en_US.UTF-8/C/en_US.UTF-8/en_US.UTF-8
attached base packages:
[1] stats4 stats graphics grDevices utils datasets methods
[8] base
other attached packages:
[1] viridis_0.6.2 viridisLite_0.4.1
[3] RColorBrewer_1.1-3 ggpubr_0.5.0
[5] pheatmap_1.0.12 ggsci_2.9
[7] runSeurat3_0.1.0 here_1.0.1
[9] magrittr_2.0.3 SeuratObject_4.1.3
[11] Seurat_4.3.0 forcats_0.5.2
[13] stringr_1.5.0 dplyr_1.0.10
[15] purrr_0.3.5 readr_2.1.3
[17] tidyr_1.2.1 tibble_3.1.8
[19] ggplot2_3.4.0 tidyverse_1.3.2
[21] SingleCellExperiment_1.18.1 SummarizedExperiment_1.26.1
[23] Biobase_2.56.0 GenomicRanges_1.48.0
[25] GenomeInfoDb_1.32.4 IRanges_2.30.1
[27] S4Vectors_0.34.0 BiocGenerics_0.42.0
[29] MatrixGenerics_1.8.1 matrixStats_0.63.0
loaded via a namespace (and not attached):
[1] utf8_1.2.2 spatstat.explore_3.0-5 reticulate_1.26
[4] tidyselect_1.2.0 htmlwidgets_1.5.4 grid_4.2.1
[7] Rtsne_0.16 munsell_0.5.0 codetools_0.2-18
[10] ica_1.0-3 future_1.29.0 miniUI_0.1.1.1
[13] withr_2.5.0 spatstat.random_3.0-1 colorspace_2.0-3
[16] progressr_0.11.0 highr_0.9 knitr_1.41
[19] rstudioapi_0.14 ROCR_1.0-11 ggsignif_0.6.4
[22] tensor_1.5 listenv_0.8.0 labeling_0.4.2
[25] git2r_0.30.1 GenomeInfoDbData_1.2.8 polyclip_1.10-4
[28] bit64_4.0.5 farver_2.1.1 rprojroot_2.0.3
[31] parallelly_1.32.1 vctrs_0.5.1 generics_0.1.3
[34] xfun_0.35 timechange_0.1.1 R6_2.5.1
[37] bitops_1.0-7 spatstat.utils_3.0-1 cachem_1.0.6
[40] DelayedArray_0.22.0 assertthat_0.2.1 vroom_1.6.0
[43] promises_1.2.0.1 scales_1.2.1 googlesheets4_1.0.1
[46] gtable_0.3.1 globals_0.16.2 goftest_1.2-3
[49] workflowr_1.7.0 rlang_1.0.6 splines_4.2.1
[52] rstatix_0.7.1 lazyeval_0.2.2 gargle_1.2.1
[55] spatstat.geom_3.0-3 broom_1.0.1 yaml_2.3.6
[58] reshape2_1.4.4 abind_1.4-5 modelr_0.1.10
[61] backports_1.4.1 httpuv_1.6.6 tools_4.2.1
[64] ellipsis_0.3.2 jquerylib_0.1.4 ggridges_0.5.4
[67] Rcpp_1.0.9 plyr_1.8.8 zlibbioc_1.42.0
[70] RCurl_1.98-1.9 deldir_1.0-6 pbapply_1.6-0
[73] cowplot_1.1.1 zoo_1.8-11 haven_2.5.1
[76] ggrepel_0.9.2 cluster_2.1.4 fs_1.5.2
[79] data.table_1.14.6 scattermore_0.8 lmtest_0.9-40
[82] reprex_2.0.2 RANN_2.6.1 googledrive_2.0.0
[85] whisker_0.4 fitdistrplus_1.1-8 hms_1.1.2
[88] patchwork_1.1.2 mime_0.12 evaluate_0.18
[91] xtable_1.8-4 readxl_1.4.1 gridExtra_2.3
[94] compiler_4.2.1 KernSmooth_2.23-20 crayon_1.5.2
[97] htmltools_0.5.3 later_1.3.0 tzdb_0.3.0
[100] lubridate_1.9.0 DBI_1.1.3 dbplyr_2.2.1
[103] MASS_7.3-58.1 Matrix_1.5-3 car_3.1-1
[106] cli_3.4.1 parallel_4.2.1 igraph_1.3.5
[109] pkgconfig_2.0.3 sp_1.5-1 plotly_4.10.1
[112] spatstat.sparse_3.0-0 xml2_1.3.3 bslib_0.4.1
[115] XVector_0.36.0 rvest_1.0.3 digest_0.6.30
[118] sctransform_0.3.5 RcppAnnoy_0.0.20 spatstat.data_3.0-0
[121] rmarkdown_2.18 cellranger_1.1.0 leiden_0.4.3
[124] uwot_0.1.14 shiny_1.7.3 lifecycle_1.0.3
[127] nlme_3.1-160 jsonlite_1.8.3 carData_3.0-5
[130] fansi_1.0.3 pillar_1.8.1 lattice_0.20-45
[133] fastmap_1.1.0 httr_1.4.4 survival_3.4-0
[136] glue_1.6.2 png_0.1-8 bit_4.0.5
[139] stringi_1.7.8 sass_0.4.4 irlba_2.3.5.1
[142] future.apply_1.10.0