Merge samples
Mechthild Lütge
14 May 2020
Last updated: 2022-07-26
Checks: 6 1
Knit directory: humanCardiacFibroblasts/
This reproducible R Markdown analysis was created with workflowr (version 1.7.0). The Checks tab describes the reproducibility checks that were applied when the results were created. The Past versions tab lists the development history.
The R Markdown file has unstaged changes. To know which version of
the R Markdown file created these results, you’ll want to first commit
it to the Git repo. If you’re still working on the analysis, you can
ignore this warning. When you’re finished, you can run
wflow_publish to commit the R Markdown file and build the
HTML.
Great job! The global environment was empty. Objects defined in the global environment can affect the analysis in your R Markdown file in unknown ways. For reproduciblity it’s best to always run the code in an empty environment.
The command set.seed(20210903) was run prior to running
the code in the R Markdown file. Setting a seed ensures that any results
that rely on randomness, e.g. subsampling or permutations, are
reproducible.
Great job! Recording the operating system, R version, and package versions is critical for reproducibility.
Nice! There were no cached chunks for this analysis, so you can be confident that you successfully produced the results during this run.
Great job! Using relative paths to the files within your workflowr project makes it easier to run your code on other machines.
Great! You are using Git for version control. Tracking code development and connecting the code version to the results is critical for reproducibility.
The results in this page were generated with repository version c5d06fc. See the Past versions tab to see a history of the changes made to the R Markdown and HTML files.
Note that you need to be careful to ensure that all relevant files for
the analysis have been committed to Git prior to generating the results
(you can use wflow_publish or
wflow_git_commit). workflowr only checks the R Markdown
file, but you know if there are other scripts or data files that it
depends on. Below is the status of the Git repository when the results
were generated:
Ignored files:
    Ignored:    .DS_Store
    Ignored:    .Rhistory
    Ignored:    .Rproj.user/
    Ignored:    data/GSEA/
    Ignored:    data/humanFibroblast/

Unstaged changes:
    Modified:   analysis/DEgenesGZplusSG_Groups.Rmd
    Deleted:    figure/DEgenesGZplusSG_Groups.Rmd/avgHeat cwDE Cardiomyocyte-1.pdf
    Deleted:    figure/DEgenesGZplusSG_Groups.Rmd/avgHeat cwDE Cardiomyocyte-1.png
    Deleted:    figure/DEgenesGZplusSG_Groups.Rmd/avgHeat cwDE Endothelial-1.pdf
    Deleted:    figure/DEgenesGZplusSG_Groups.Rmd/avgHeat cwDE Endothelial-1.png
    Deleted:    figure/DEgenesGZplusSG_Groups.Rmd/avgHeat cwDE Fibroblast-1.pdf
    Deleted:    figure/DEgenesGZplusSG_Groups.Rmd/avgHeat cwDE Fibroblast-1.png
    Deleted:    figure/DEgenesGZplusSG_Groups.Rmd/avgHeat cwDE MonocyteMacrophage-1.pdf
    Deleted:    figure/DEgenesGZplusSG_Groups.Rmd/avgHeat cwDE MonocyteMacrophage-1.png
    Deleted:    figure/DEgenesGZplusSG_Groups.Rmd/avgHeat cwDE Perivascular-1.pdf
    Deleted:    figure/DEgenesGZplusSG_Groups.Rmd/avgHeat cwDE Perivascular-1.png
    Deleted:    figure/DEgenesGZplusSG_Groups.Rmd/avgHeat cwDE Tcell-1.pdf
    Deleted:    figure/DEgenesGZplusSG_Groups.Rmd/avgHeat cwDE Tcell-1.png
    Deleted:    figure/DEgenesGZplusSG_Groups.Rmd/avgHeat cwDE other-1.pdf
    Deleted:    figure/DEgenesGZplusSG_Groups.Rmd/avgHeat cwDE other-1.png
Note that any generated files, e.g. HTML, png, CSS, etc., are not included in this status report because it is ok for generated content to have uncommitted changes.
These are the previous versions of the repository in which changes were
made to the R Markdown
(analysis/DEgenesGZplusSG_Groups.Rmd) and HTML
(docs/DEgenesGZplusSG_Groups.html) files. If you’ve
configured a remote Git repository (see ?wflow_git_remote),
click on the hyperlinks in the table below to view the files as they
were in that past version.
| File | Version | Author | Date | Message |
|---|---|---|---|---|
| Rmd | c5d06fc | mluetge | 2022-07-22 | vis sel DE genes groups |
| Rmd | 02765dc | mluetge | 2022-07-19 | GSEA across diff groups |
| html | 02765dc | mluetge | 2022-07-19 | GSEA across diff groups |
load packages
suppressPackageStartupMessages({
  library(SingleCellExperiment)
  library(tidyverse)
  library(Seurat)
  library(magrittr)
  library(dplyr)
  library(purrr)
  library(ggplot2)
  library(here)
  library(runSeurat3)
  library(ggsci)
  library(ggpubr)
  library(pheatmap)
  library(viridis)
  library(sctransform)
  library(fgsea)
  library(grid)
  library(gridExtra)
  library(clusterProfiler)
  library(org.Hs.eg.db)
  library(DOSE)
  library(enrichplot)
  library(msigdbr)

})
sign plot funct
## random plotting order
shuf <- function(df){
  return(df[sample(1:dim(df)[1], dim(df)[1]),])
}

## adapted from CellMixS
visGroup_adapt <- function (sce,group,dim_red = "TSNE",col_group=pal_nejm()(8))
{
    if (!is(sce, "SingleCellExperiment")) {
        stop("Error:'sce' must be a 'SingleCellExperiment' object.")
    }
    if (!group %in% names(colData(sce))) {
        stop("Error: 'group' variable must be in 'colData(sce)'")
    }
    cell_names <- colnames(sce)
    if (!dim_red %in% "TSNE") {
        if (!dim_red %in% reducedDimNames(sce)) {
            stop("Please provide a dim_red method listed in reducedDims of sce")
        }
        red_dim <- as.data.frame(reducedDim(sce, dim_red))
    }
    else {
        if (!"TSNE" %in% reducedDimNames(sce)) {
            if ("logcounts" %in% names(assays(sce))) {
                sce <- runTSNE(sce)
            }
            else {
                sce <- runTSNE(sce, exprs_values = "counts")
            }
        }
        red_dim <- as.data.frame(reducedDim(sce, "TSNE"))
    }
    colnames(red_dim) <- c("red_dim1", "red_dim2")
    df <- data.frame(sample_id = cell_names, group_var = colData(sce)[,
        group], red_Dim1 = red_dim$red_dim1, red_Dim2 = red_dim$red_dim2)
    t <- ggplot(shuf(df), aes_string(x = "red_Dim1", y = "red_Dim2")) +
        xlab(paste0(dim_red, "_1")) + ylab(paste0(dim_red, "_2")) +
        theme_void() + theme(aspect.ratio = 1,
                             panel.grid.minor = element_blank(),
        panel.grid.major = element_line(color = "grey", size = 0.3))
    t_group <- t + geom_point(size = 1, alpha = 0.7,
                              aes_string(color = "group_var")) +
        guides(color = guide_legend(override.aes = list(size = 1),
            title = group)) + ggtitle(group)
    if (is.numeric(df$group_var)) {
        t_group <- t_group + scale_color_viridis(option = "D")
    }
    else {
        t_group <- t_group + scale_color_manual(values = col_group)
    }
    t_group
}
integrate data
basedir <- here()
seurat <- readRDS(file = paste0(basedir,
                              "/data/humanHeartsPlusGraz_intPatients_merged",
                              "labeled_seurat.rds"))
myoGrp <- c("GZ1","GZ4","GZ6","SG29","SG32")
myoLTGrp <- c("GZ2","GZ3","GZ5","GZ7","SG31")
CtrlGrp <- c("GZ8","GZ10","GZ11","GZ12")

seurat$cond2 <- "HH"
seurat$cond2[which(seurat$ID %in% myoGrp)] <- "MyocarditisHT"
seurat$cond2[which(seurat$ID %in% myoLTGrp)] <- "MyocarditisLT"

saveRDS(seurat, paste0(basedir, "/data/humanHeartsPlusGraz_intPatients_merged",
                       "labeled_groups_seurat.rds"))
color vectors
colPal <- pal_igv()(length(levels(seurat)))
colTec <- pal_jama()(length(unique(seurat$technique)))
colSmp <- c(pal_uchicago()(8), pal_npg()(8), pal_aaas()(10))[1:length(unique(seurat$dataset))]
colCond <- pal_npg()(length(unique(seurat$cond2)))
colID <- c(pal_jco()(10), pal_npg()(10))[1:length(unique(seurat$ID))]
colOrig <- pal_aaas()(length(unique(seurat$origin)))
colIso <- pal_nejm()(length(unique(seurat$isolation)))
colProc <- pal_aaas()(length(unique(seurat$processing)))
colLab <- pal_futurama()(length(unique(seurat$label)))

names(colPal) <- levels(seurat)
names(colTec) <- unique(seurat$technique)
names(colSmp) <- unique(seurat$dataset)
names(colCond) <- unique(seurat$cond2)
names(colID) <- unique(seurat$ID)
names(colOrig) <- unique(seurat$origin)
names(colIso) <- unique(seurat$isolation)
names(colProc) <- unique(seurat$processing)
names(colLab) <- unique(seurat$label)
vis data
clusters
DimPlot(seurat, reduction = "umap", cols=colPal)+
  theme_bw() +
  theme(axis.text = element_blank(), axis.ticks = element_blank(),
        panel.grid.minor = element_blank()) +
  xlab("UMAP1") +
  ylab("UMAP2")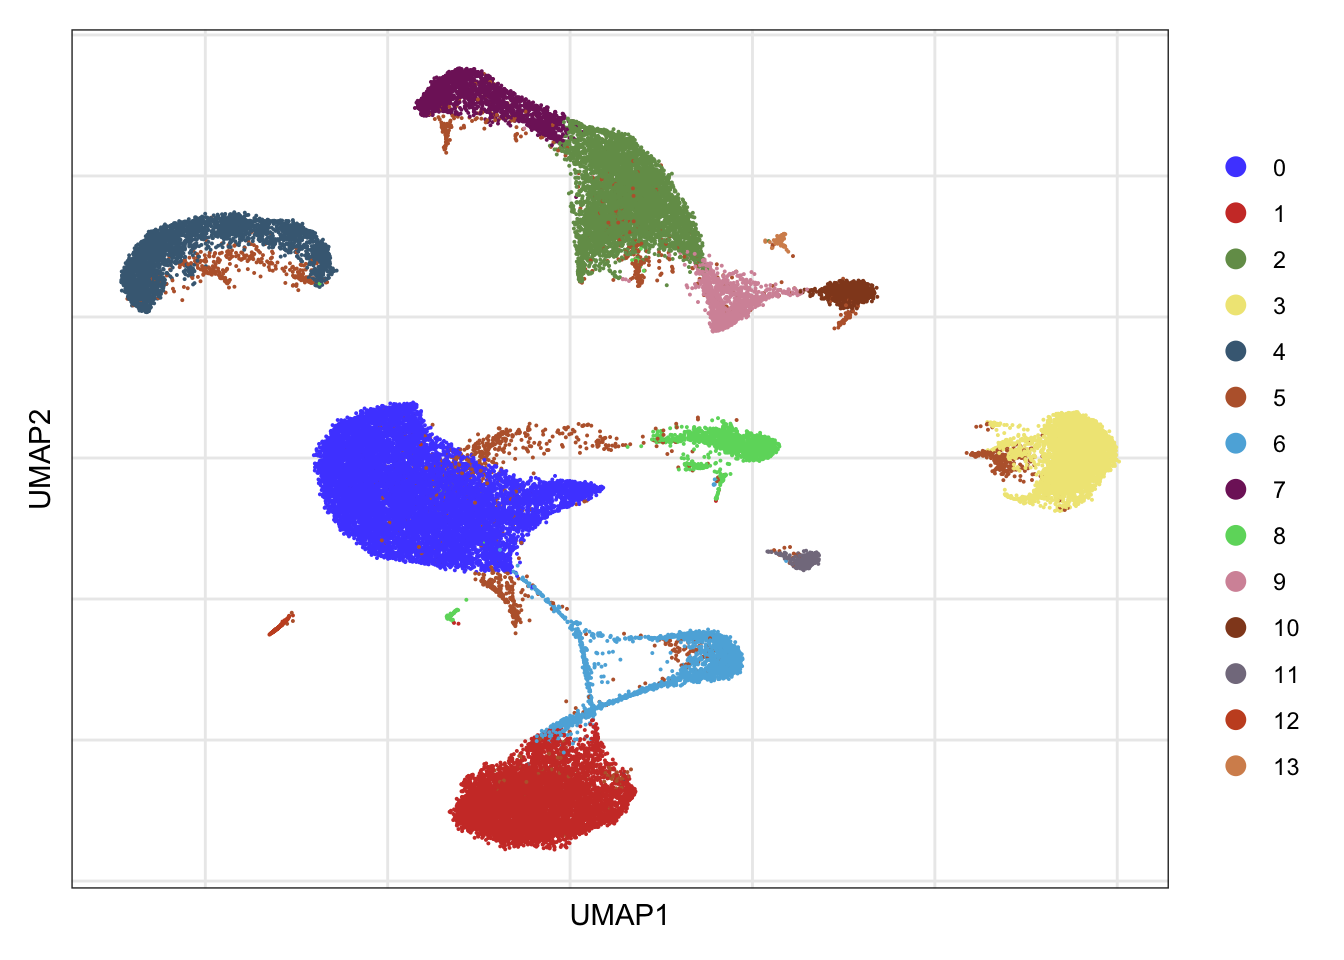
| Version | Author | Date |
|---|---|---|
| 02765dc | mluetge | 2022-07-19 |
label
DimPlot(seurat, reduction = "umap",  group.by = "label", cols=colLab)+
  theme_bw() +
  theme(axis.text = element_blank(), axis.ticks = element_blank(),
        panel.grid.minor = element_blank()) +
  xlab("UMAP1") +
  ylab("UMAP2")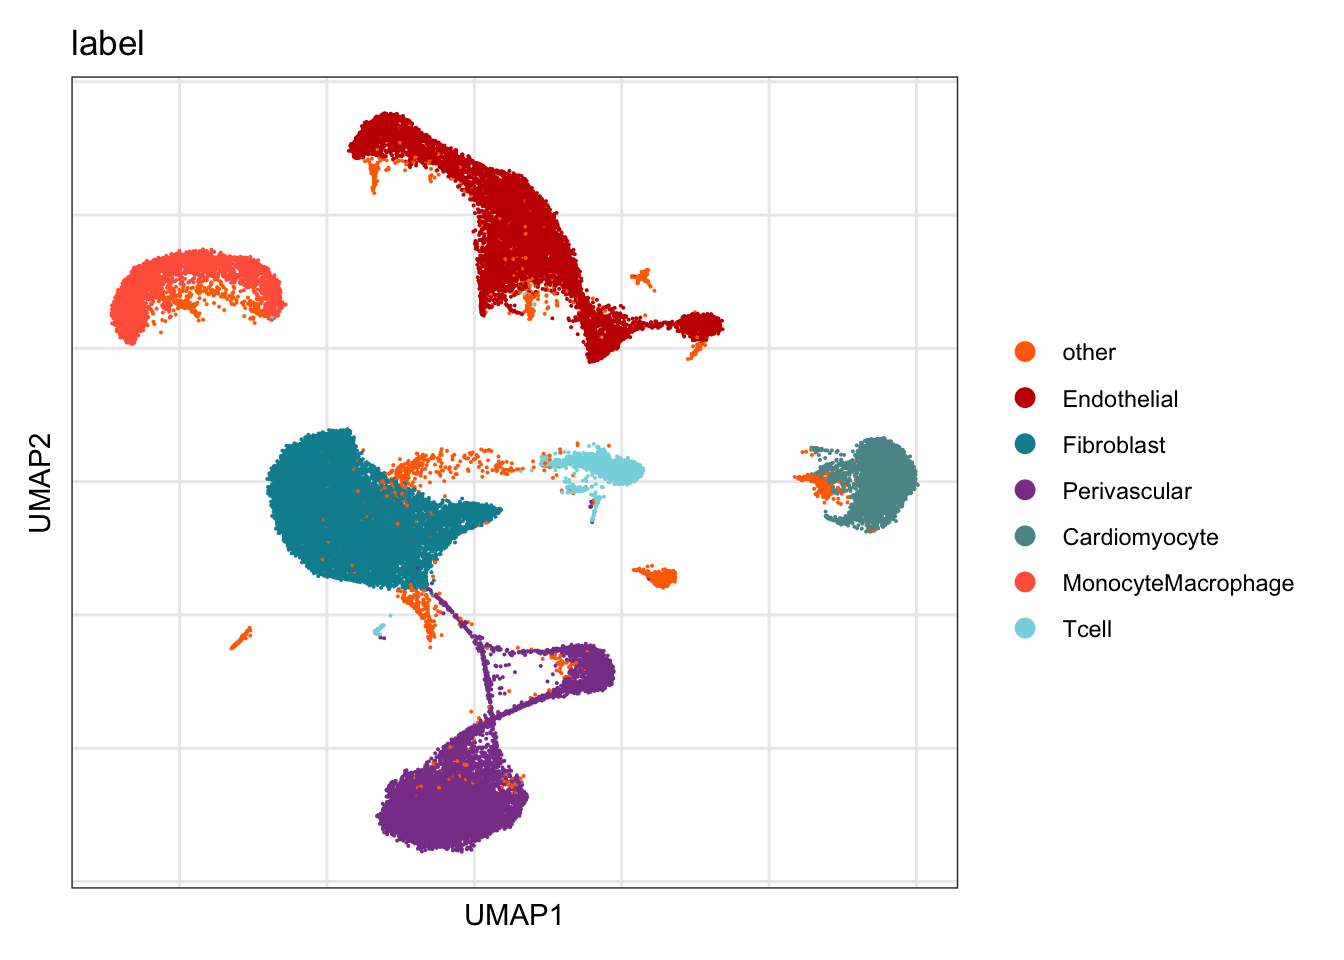
| Version | Author | Date |
|---|---|---|
| 02765dc | mluetge | 2022-07-19 |
technique
DimPlot(seurat, reduction = "umap", group.by = "technique", cols=colTec)+
  theme_bw() +
  theme(axis.text = element_blank(), axis.ticks = element_blank(),
        panel.grid.minor = element_blank()) +
  xlab("UMAP1") +
  ylab("UMAP2")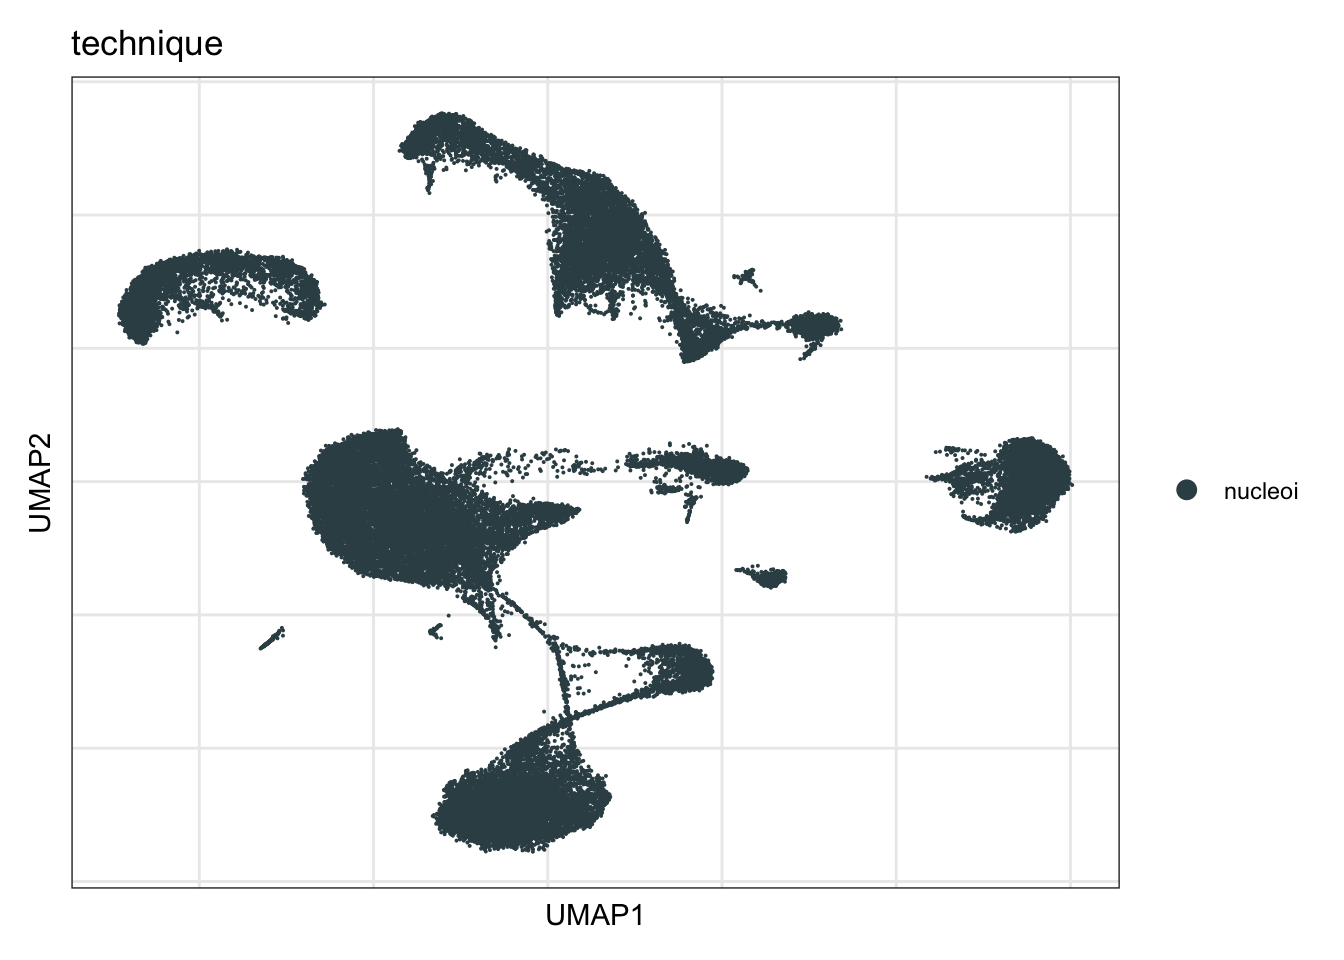
| Version | Author | Date |
|---|---|---|
| 02765dc | mluetge | 2022-07-19 |
Sample
DimPlot(seurat, reduction = "umap", group.by = "dataset", cols=colSmp)+
  theme_bw() +
  theme(axis.text = element_blank(), axis.ticks = element_blank(),
        panel.grid.minor = element_blank()) +
  xlab("UMAP1") +
  ylab("UMAP2")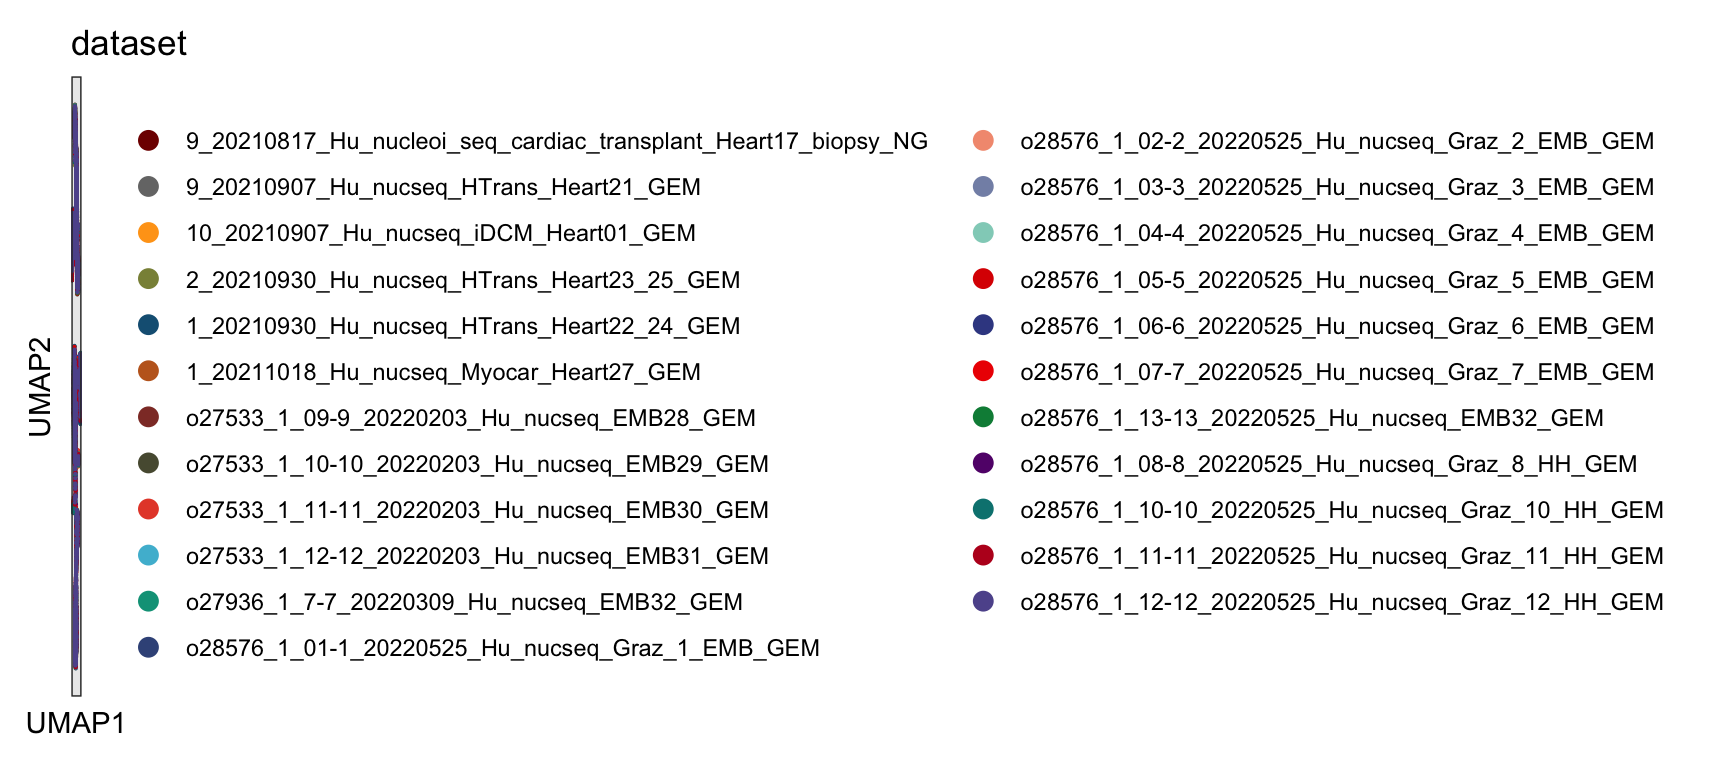
| Version | Author | Date |
|---|---|---|
| 02765dc | mluetge | 2022-07-19 |
ID
DimPlot(seurat, reduction = "umap", group.by = "ID", cols=colID)+
  theme_bw() +
  theme(axis.text = element_blank(), axis.ticks = element_blank(),
        panel.grid.minor = element_blank()) +
  xlab("UMAP1") +
  ylab("UMAP2")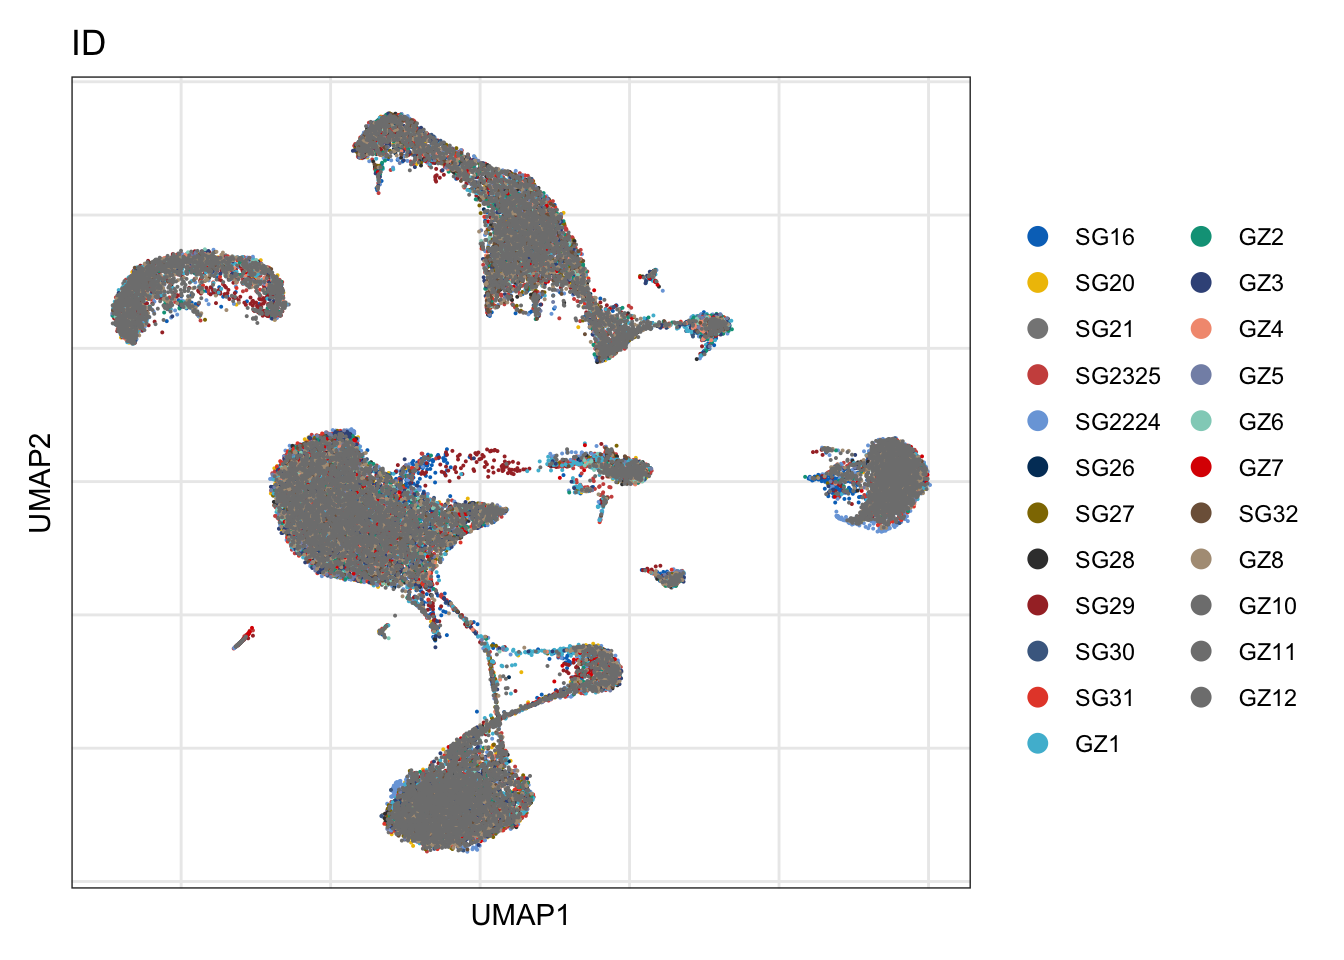
| Version | Author | Date |
|---|---|---|
| 02765dc | mluetge | 2022-07-19 |
Origin
DimPlot(seurat, reduction = "umap", group.by = "origin", cols=colOrig)+
  theme_bw() +
  theme(axis.text = element_blank(), axis.ticks = element_blank(),
        panel.grid.minor = element_blank()) +
  xlab("UMAP1") +
  ylab("UMAP2")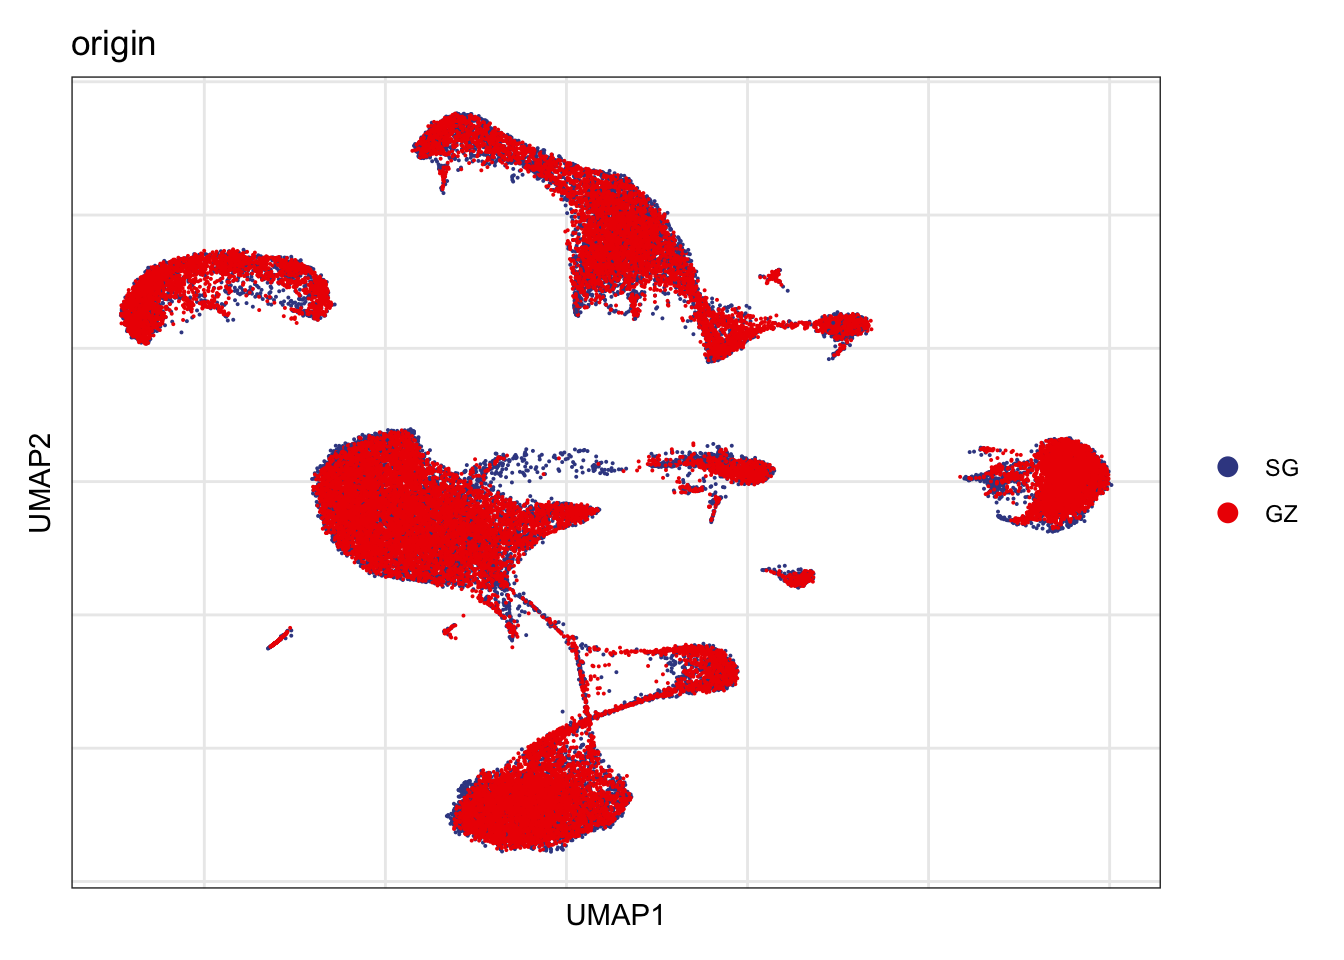
| Version | Author | Date |
|---|---|---|
| 02765dc | mluetge | 2022-07-19 |
isolation
DimPlot(seurat, reduction = "umap", group.by = "isolation", cols=colIso)+
  theme_bw() +
  theme(axis.text = element_blank(), axis.ticks = element_blank(),
        panel.grid.minor = element_blank()) +
  xlab("UMAP1") +
  ylab("UMAP2")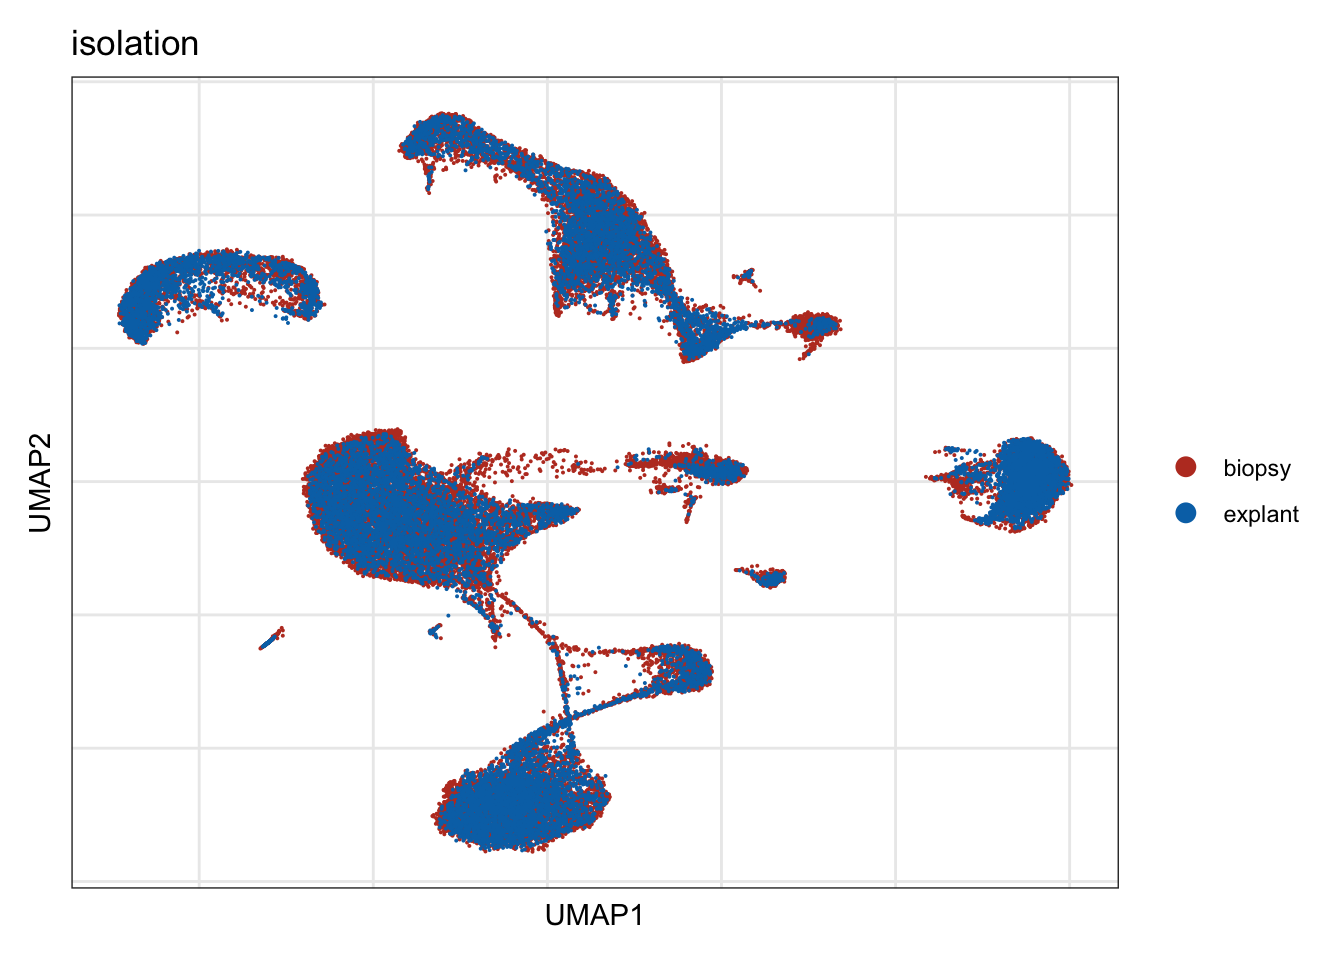
| Version | Author | Date |
|---|---|---|
| 02765dc | mluetge | 2022-07-19 |
cond
DimPlot(seurat, reduction = "umap", group.by = "cond2", cols=colCond)+
  theme_bw() +
  theme(axis.text = element_blank(), axis.ticks = element_blank(),
        panel.grid.minor = element_blank()) +
  xlab("UMAP1") +
  ylab("UMAP2")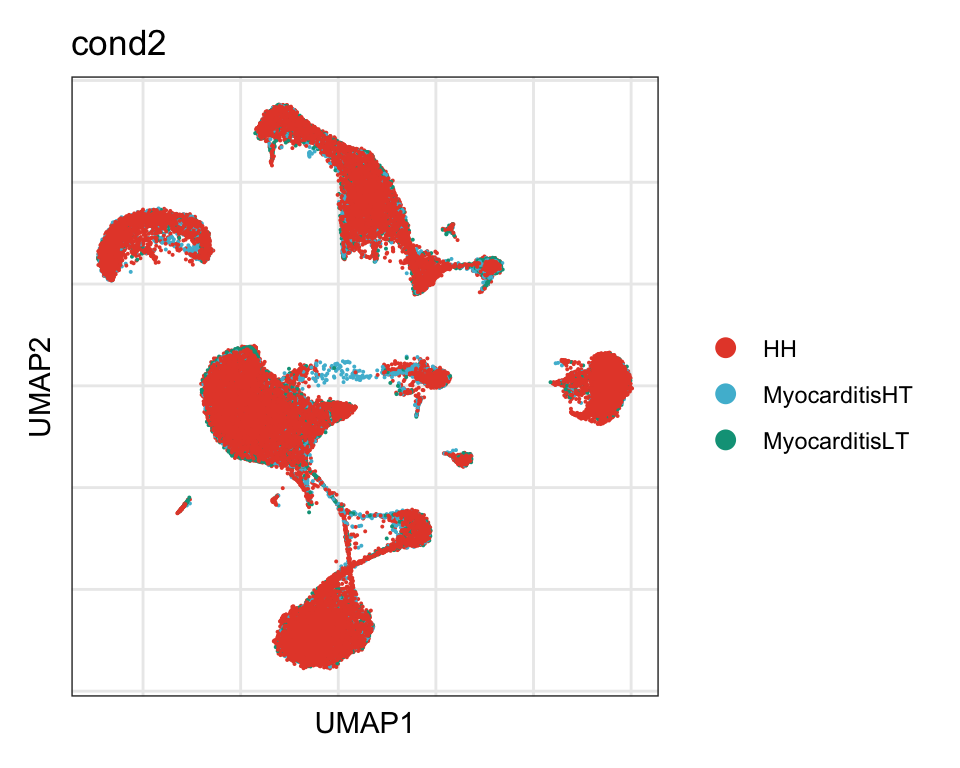
| Version | Author | Date |
|---|---|---|
| 02765dc | mluetge | 2022-07-19 |
processing
DimPlot(seurat, reduction = "umap", group.by = "processing", cols=colProc)+
  theme_bw() +
  theme(axis.text = element_blank(), axis.ticks = element_blank(),
        panel.grid.minor = element_blank()) +
  xlab("UMAP1") +
  ylab("UMAP2")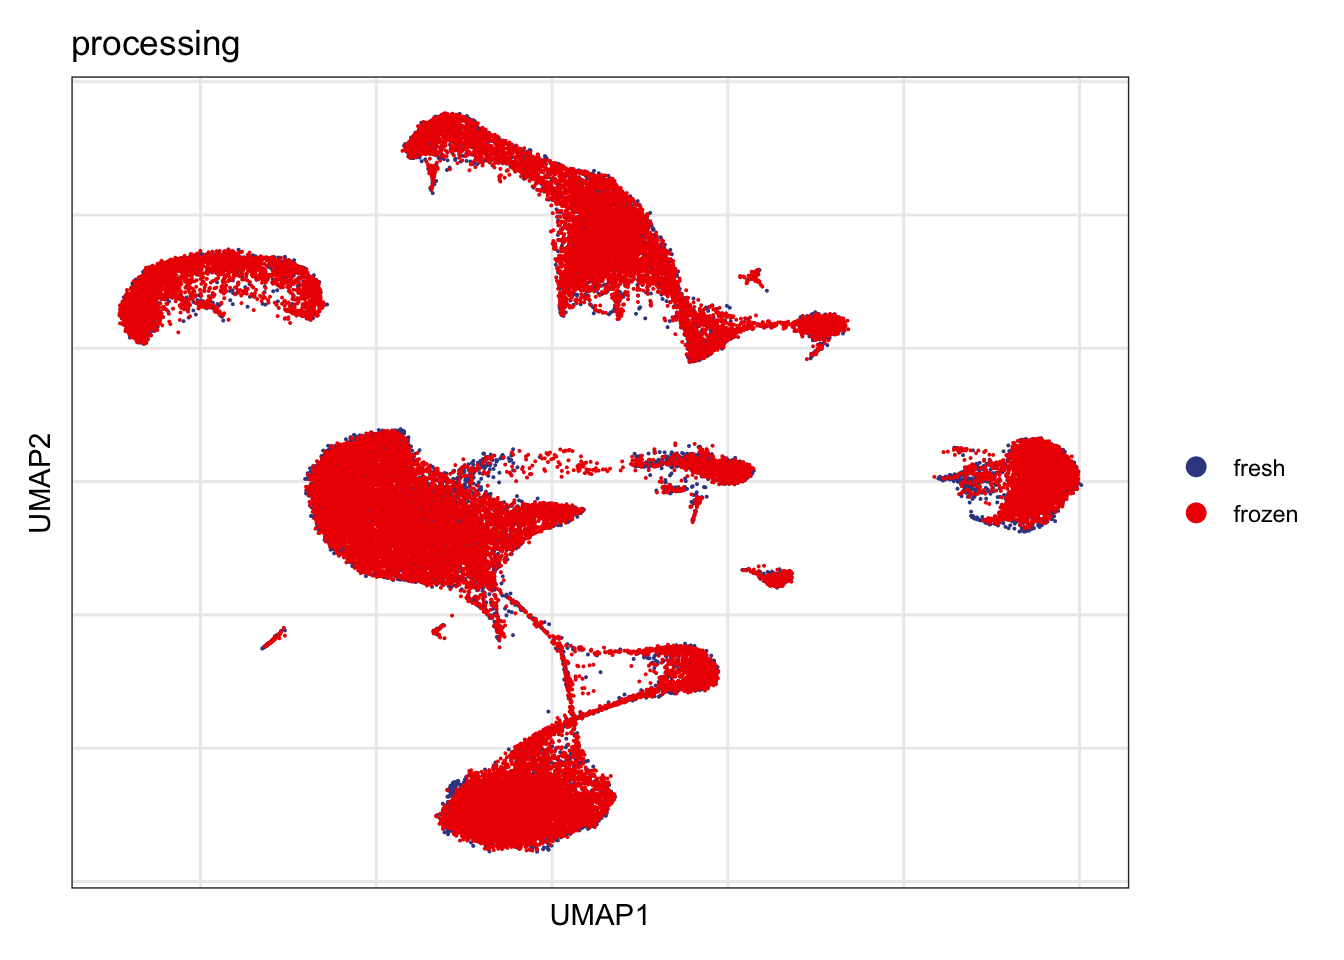
| Version | Author | Date |
|---|---|---|
| 02765dc | mluetge | 2022-07-19 |
overall DE genes
Idents(seurat) <- seurat$cond2
DEgenes <-FindAllMarkers(seurat, only.pos=T, logfc.threshold = 0.1,
                           min.pct = 0.01)


clVec <- unique(seurat$cond2)
GOcons <- lapply(clVec, function(cl){
  clustDE_DatSub <- DEgenes[which(DEgenes$cluster == cl),] %>%
    mutate(ENS=gsub("\\..*$", "", gene)) #%>%
    #slice_min(., max_pval, n=200)
  egoSS <- enrichGO(gene      = unique(clustDE_DatSub$ENS),
                OrgDb         = org.Hs.eg.db,
                keyType       = 'ENSEMBL',
                ont           = "BP",
                pAdjustMethod = "BH",
                pvalueCutoff  = 0.05,
                qvalueCutoff  = 0.05)
  egoSS <- setReadable(egoSS, OrgDb = org.Hs.eg.db)
  egoSSres <- egoSS@result %>% filter(p.adjust < 0.05) %>%
    mutate(subset=cl)
})

names(GOcons) <- clVec

## table to select pathways
GOconsDat <- do.call("rbind", GOcons)

write.table(GOconsDat, quote=F, row.names = T, col.names = T, sep= "\t",
            file = paste0(basedir,"/data/humanHeartsPlusGraz_intPatients_",
                              "merged_Groups_overallDEGO.txt"))
cw DE genes
Idents(seurat) <- seurat$cond2
grpVec <- unique(seurat$label)
clustDE <- lapply(grpVec, function(grp){
grpSub <- unique(seurat$label)[which(
unique(seurat$label)==grp)]
seuratSub <- subset(seurat, label == grpSub)
DEgenes <-FindAllMarkers(seuratSub, only.pos=T, logfc.threshold = 0.1,
min.pct = 0.01)
if(nrow(DEgenes)>1){
DEgenes <- DEgenes %>% filter(p_val_adj<0.01) %>%
mutate(group=paste0(grp, "_", cluster)) %>%
mutate(geneID=gsub(".*\\.", "", gene)) %>%
filter(nchar(geneID)>1)
}
})
names(clustDE) <- grpVec
clustDE_Dat <- data.frame(do.call("rbind", clustDE))
write.table(clustDE_Dat,
file=paste0(basedir,
"/data/humanHeartsPlusGraz_intPatients_",
"merged_Groups_cwDEGenes.txt"),
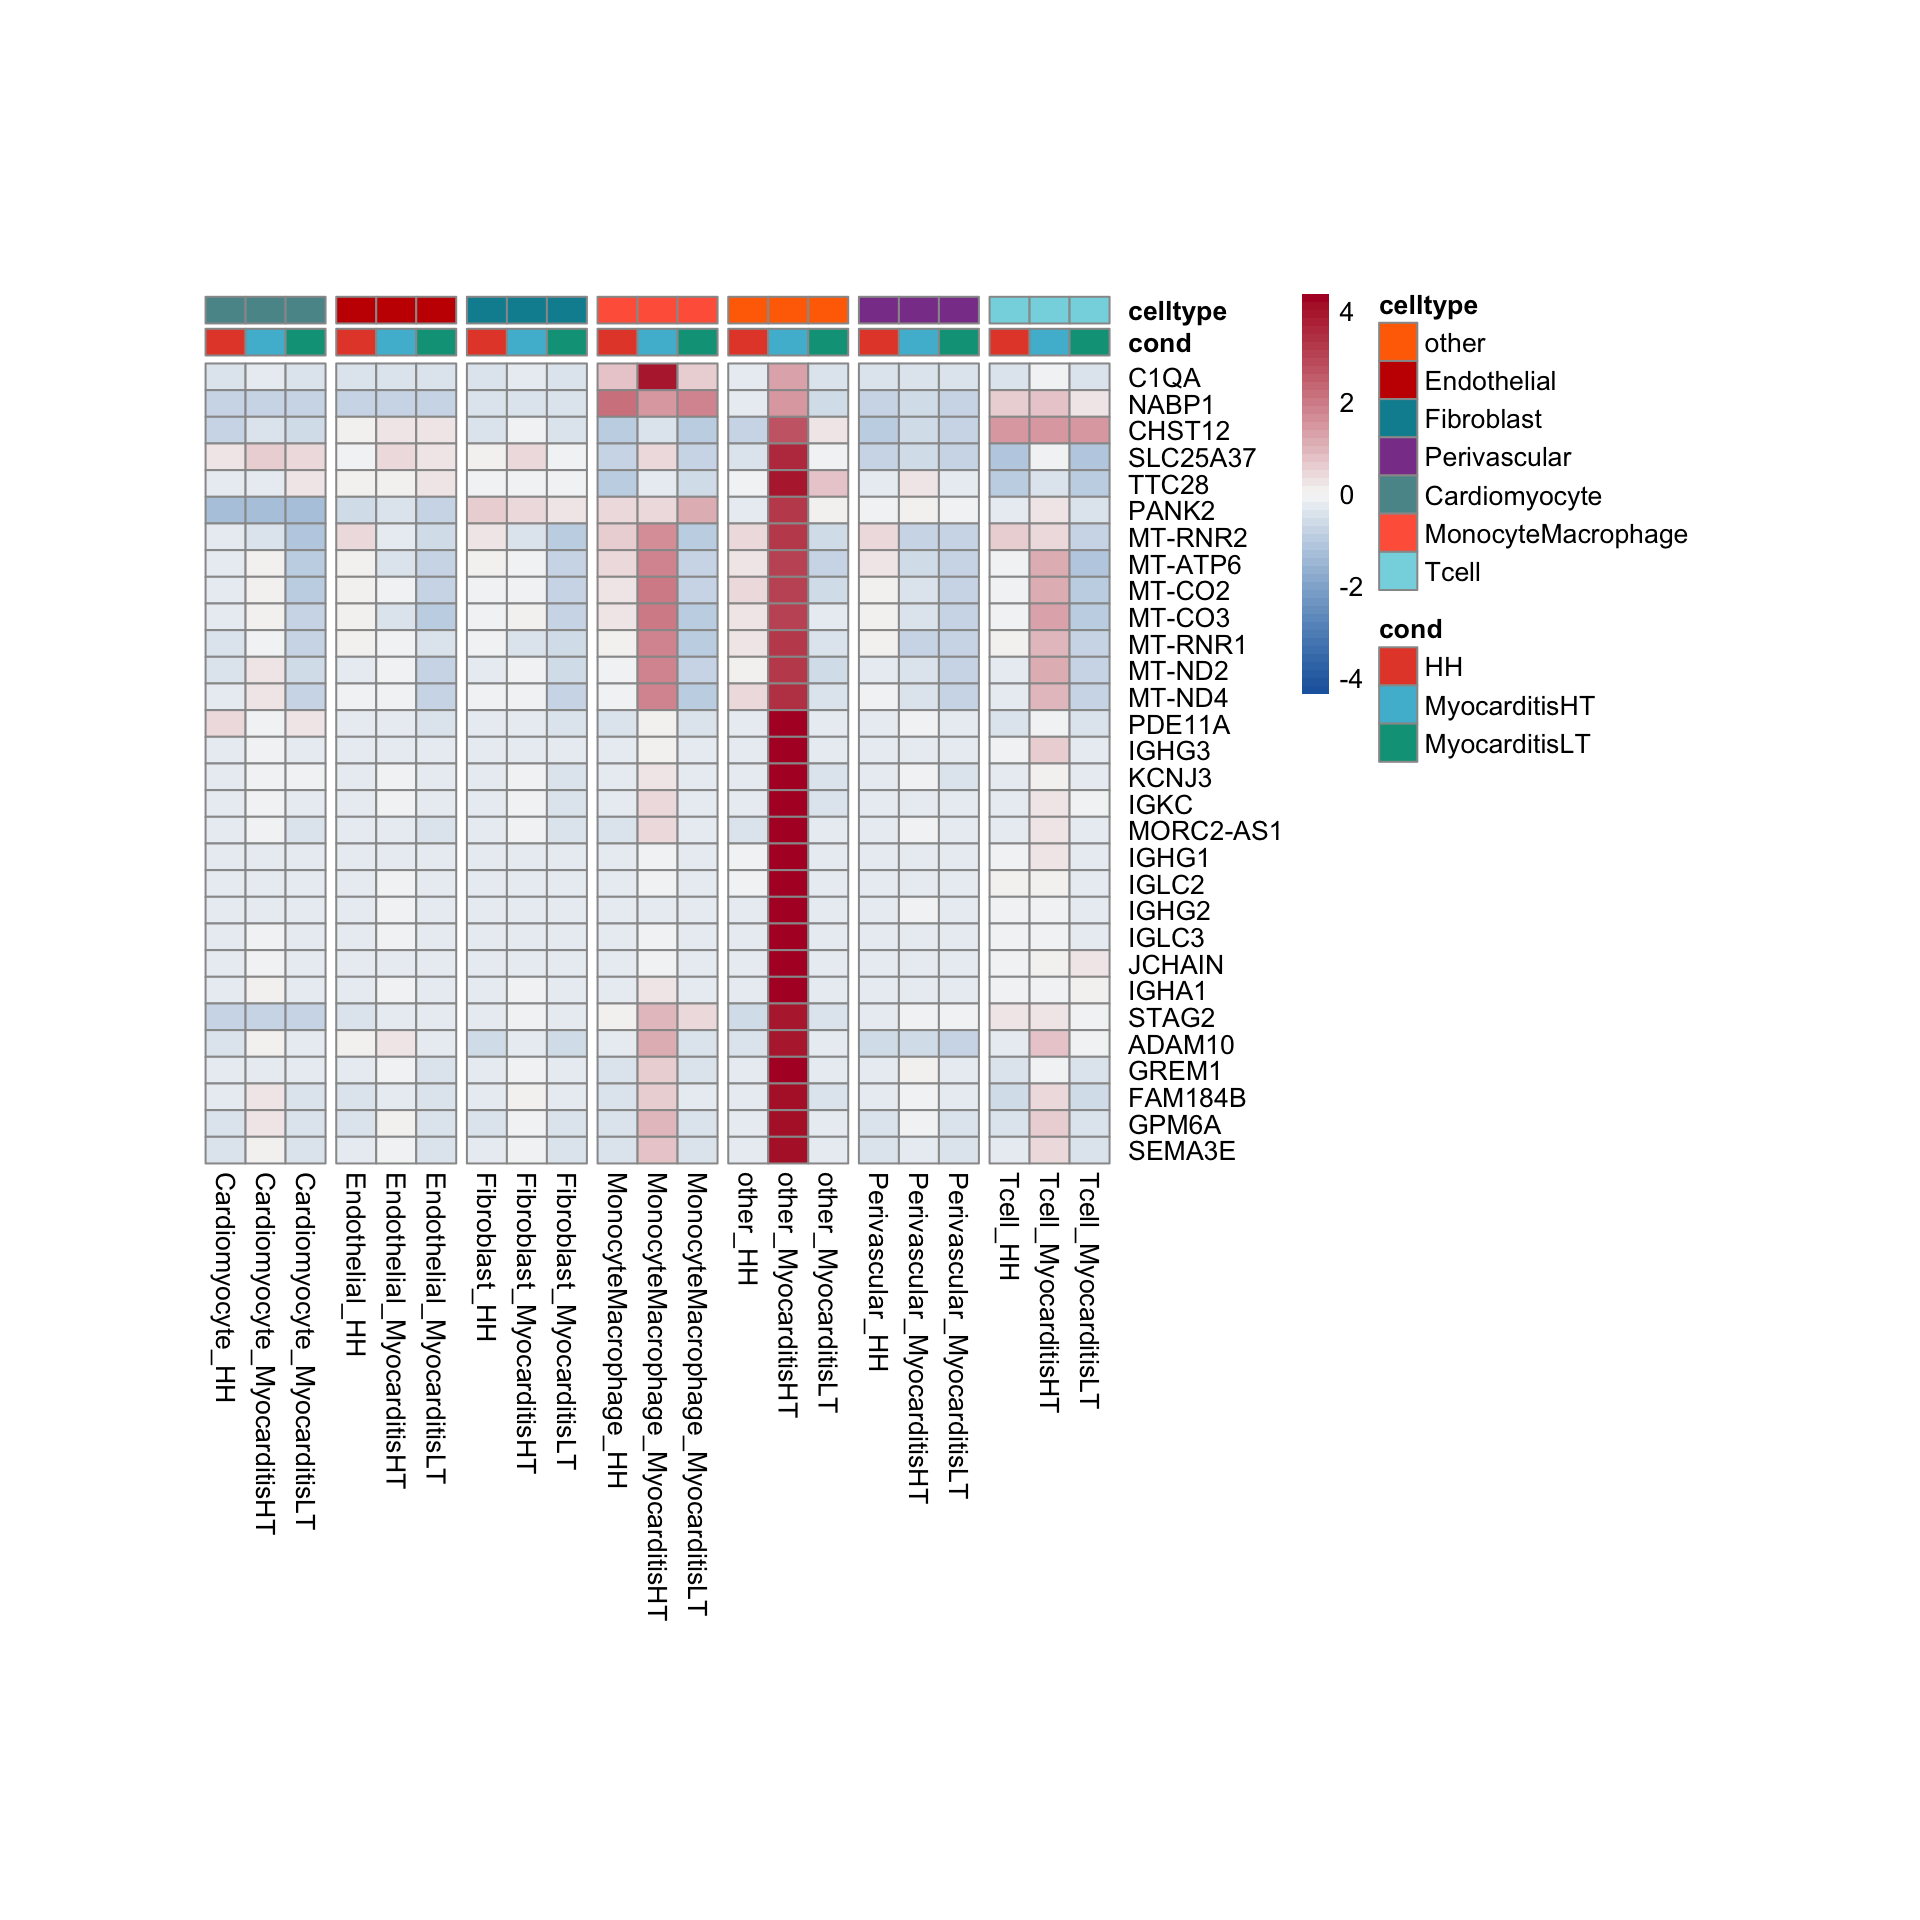
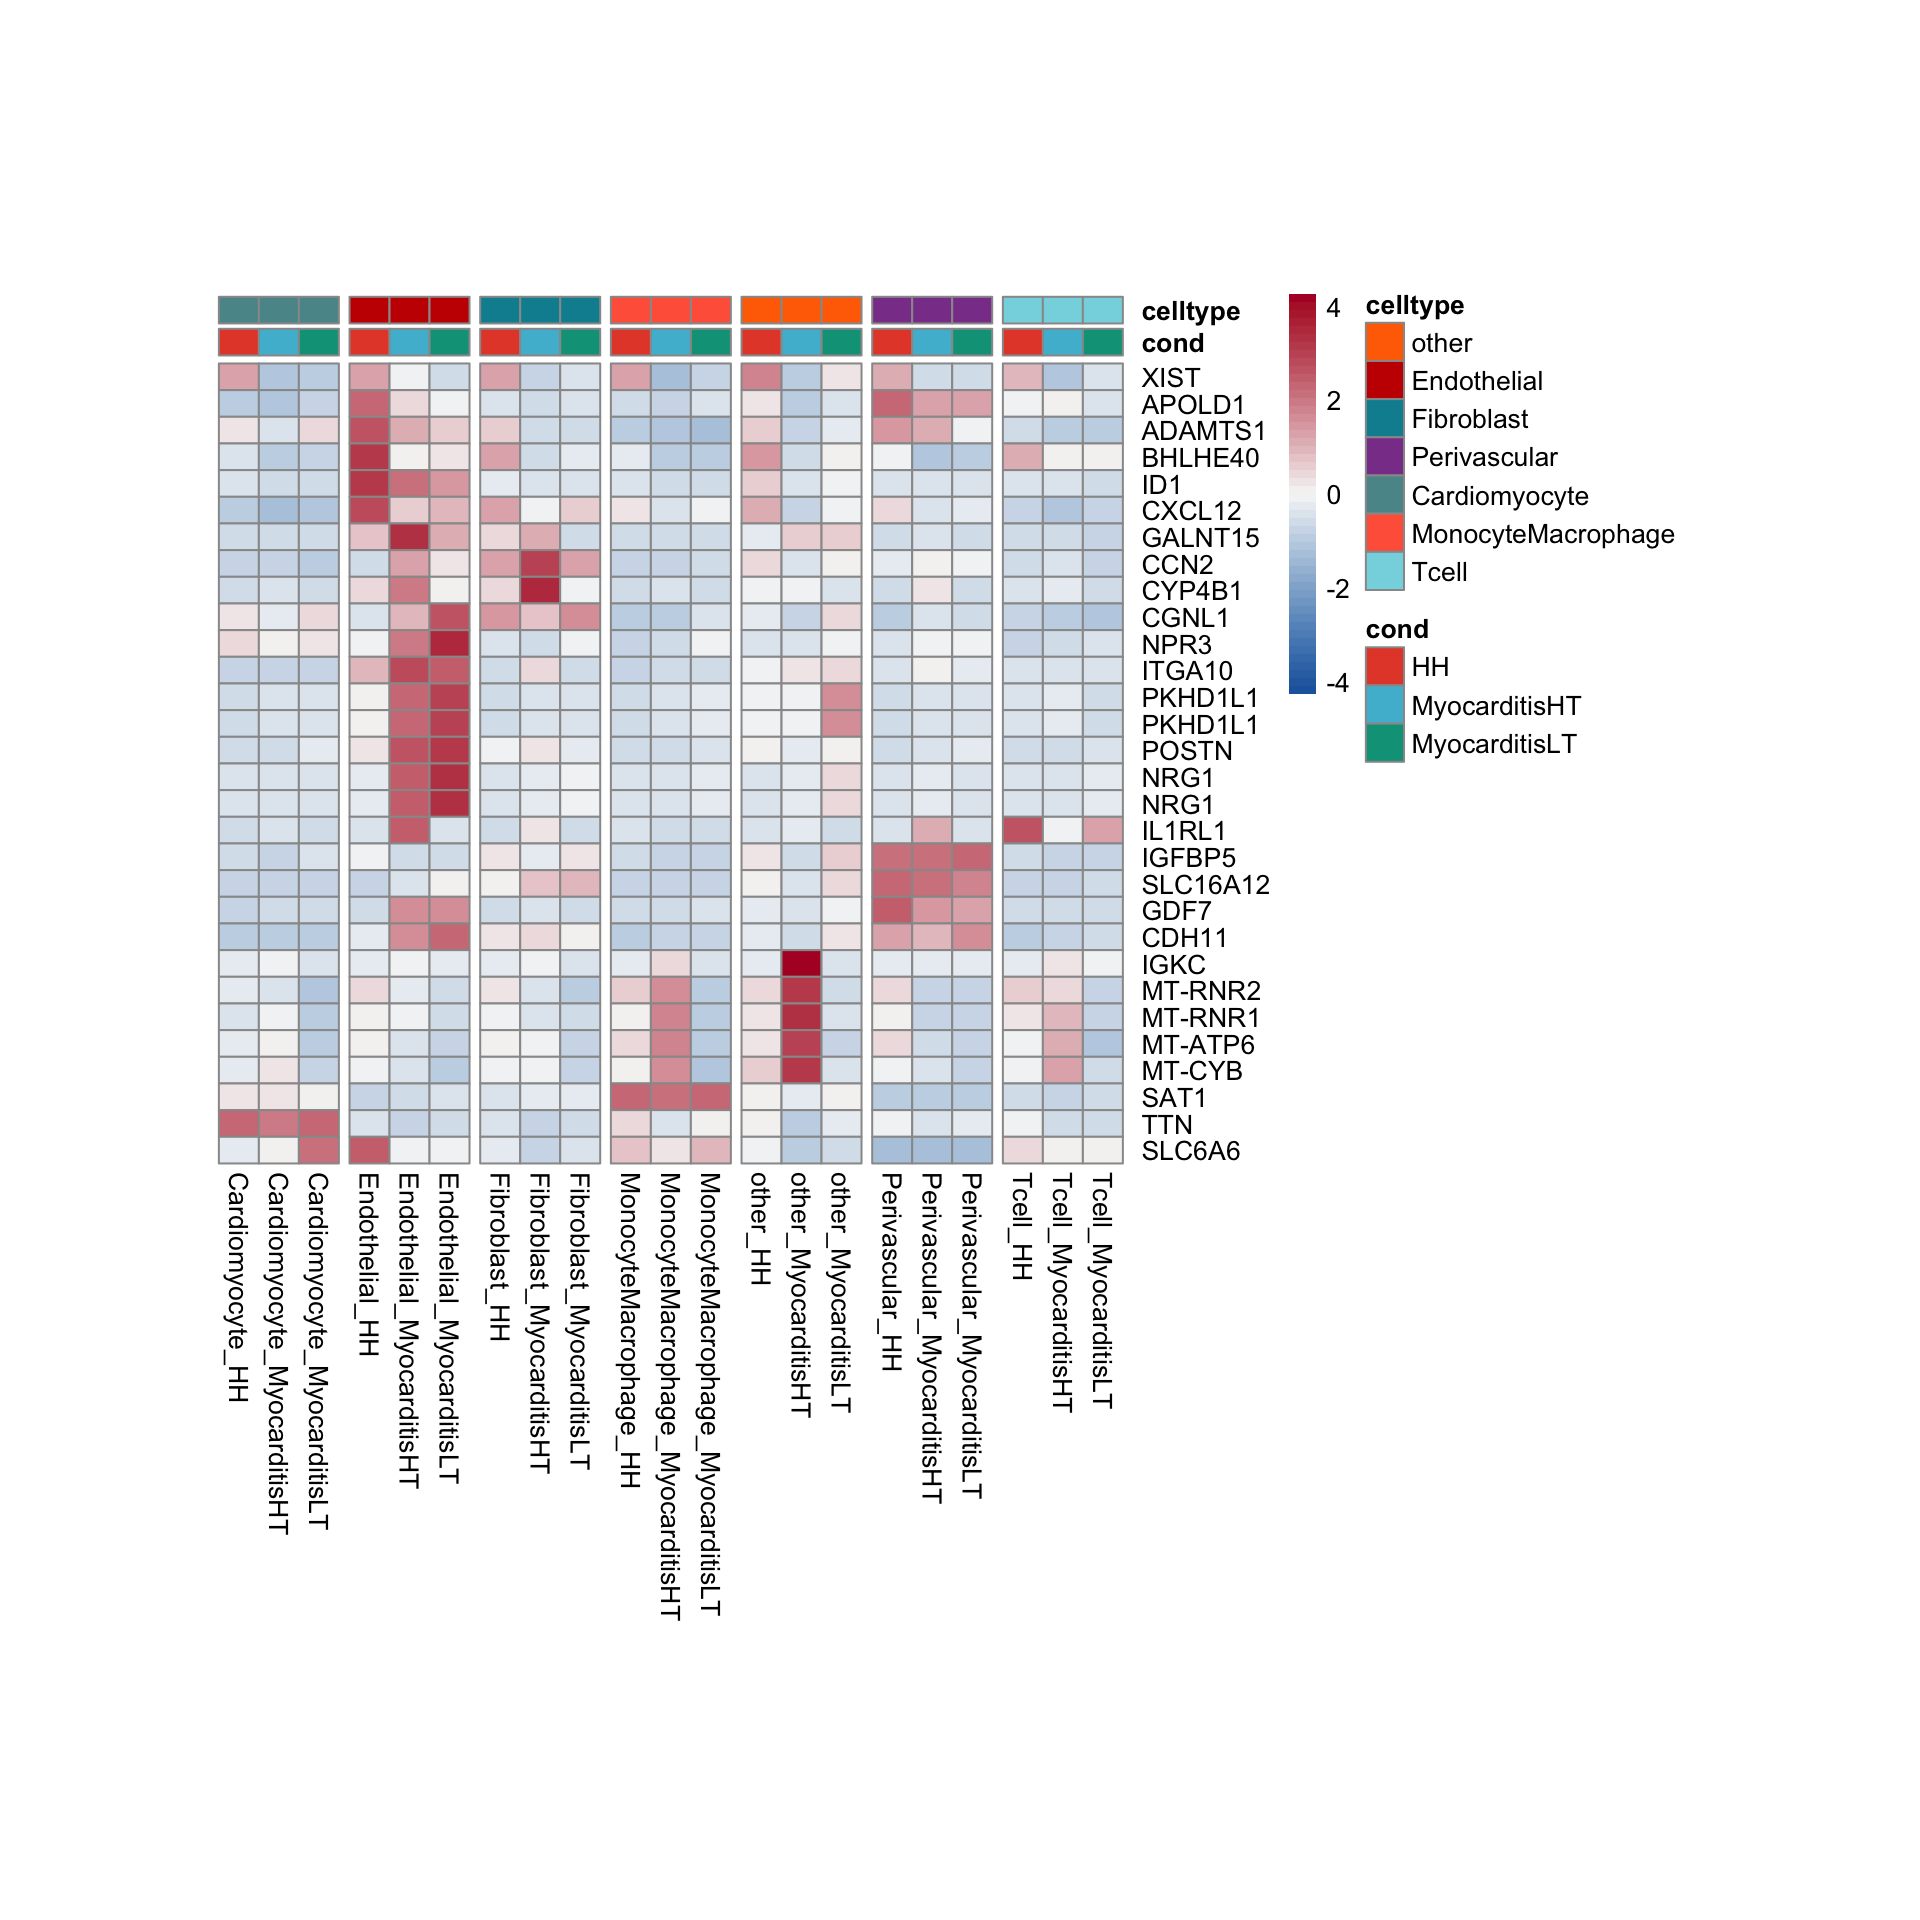
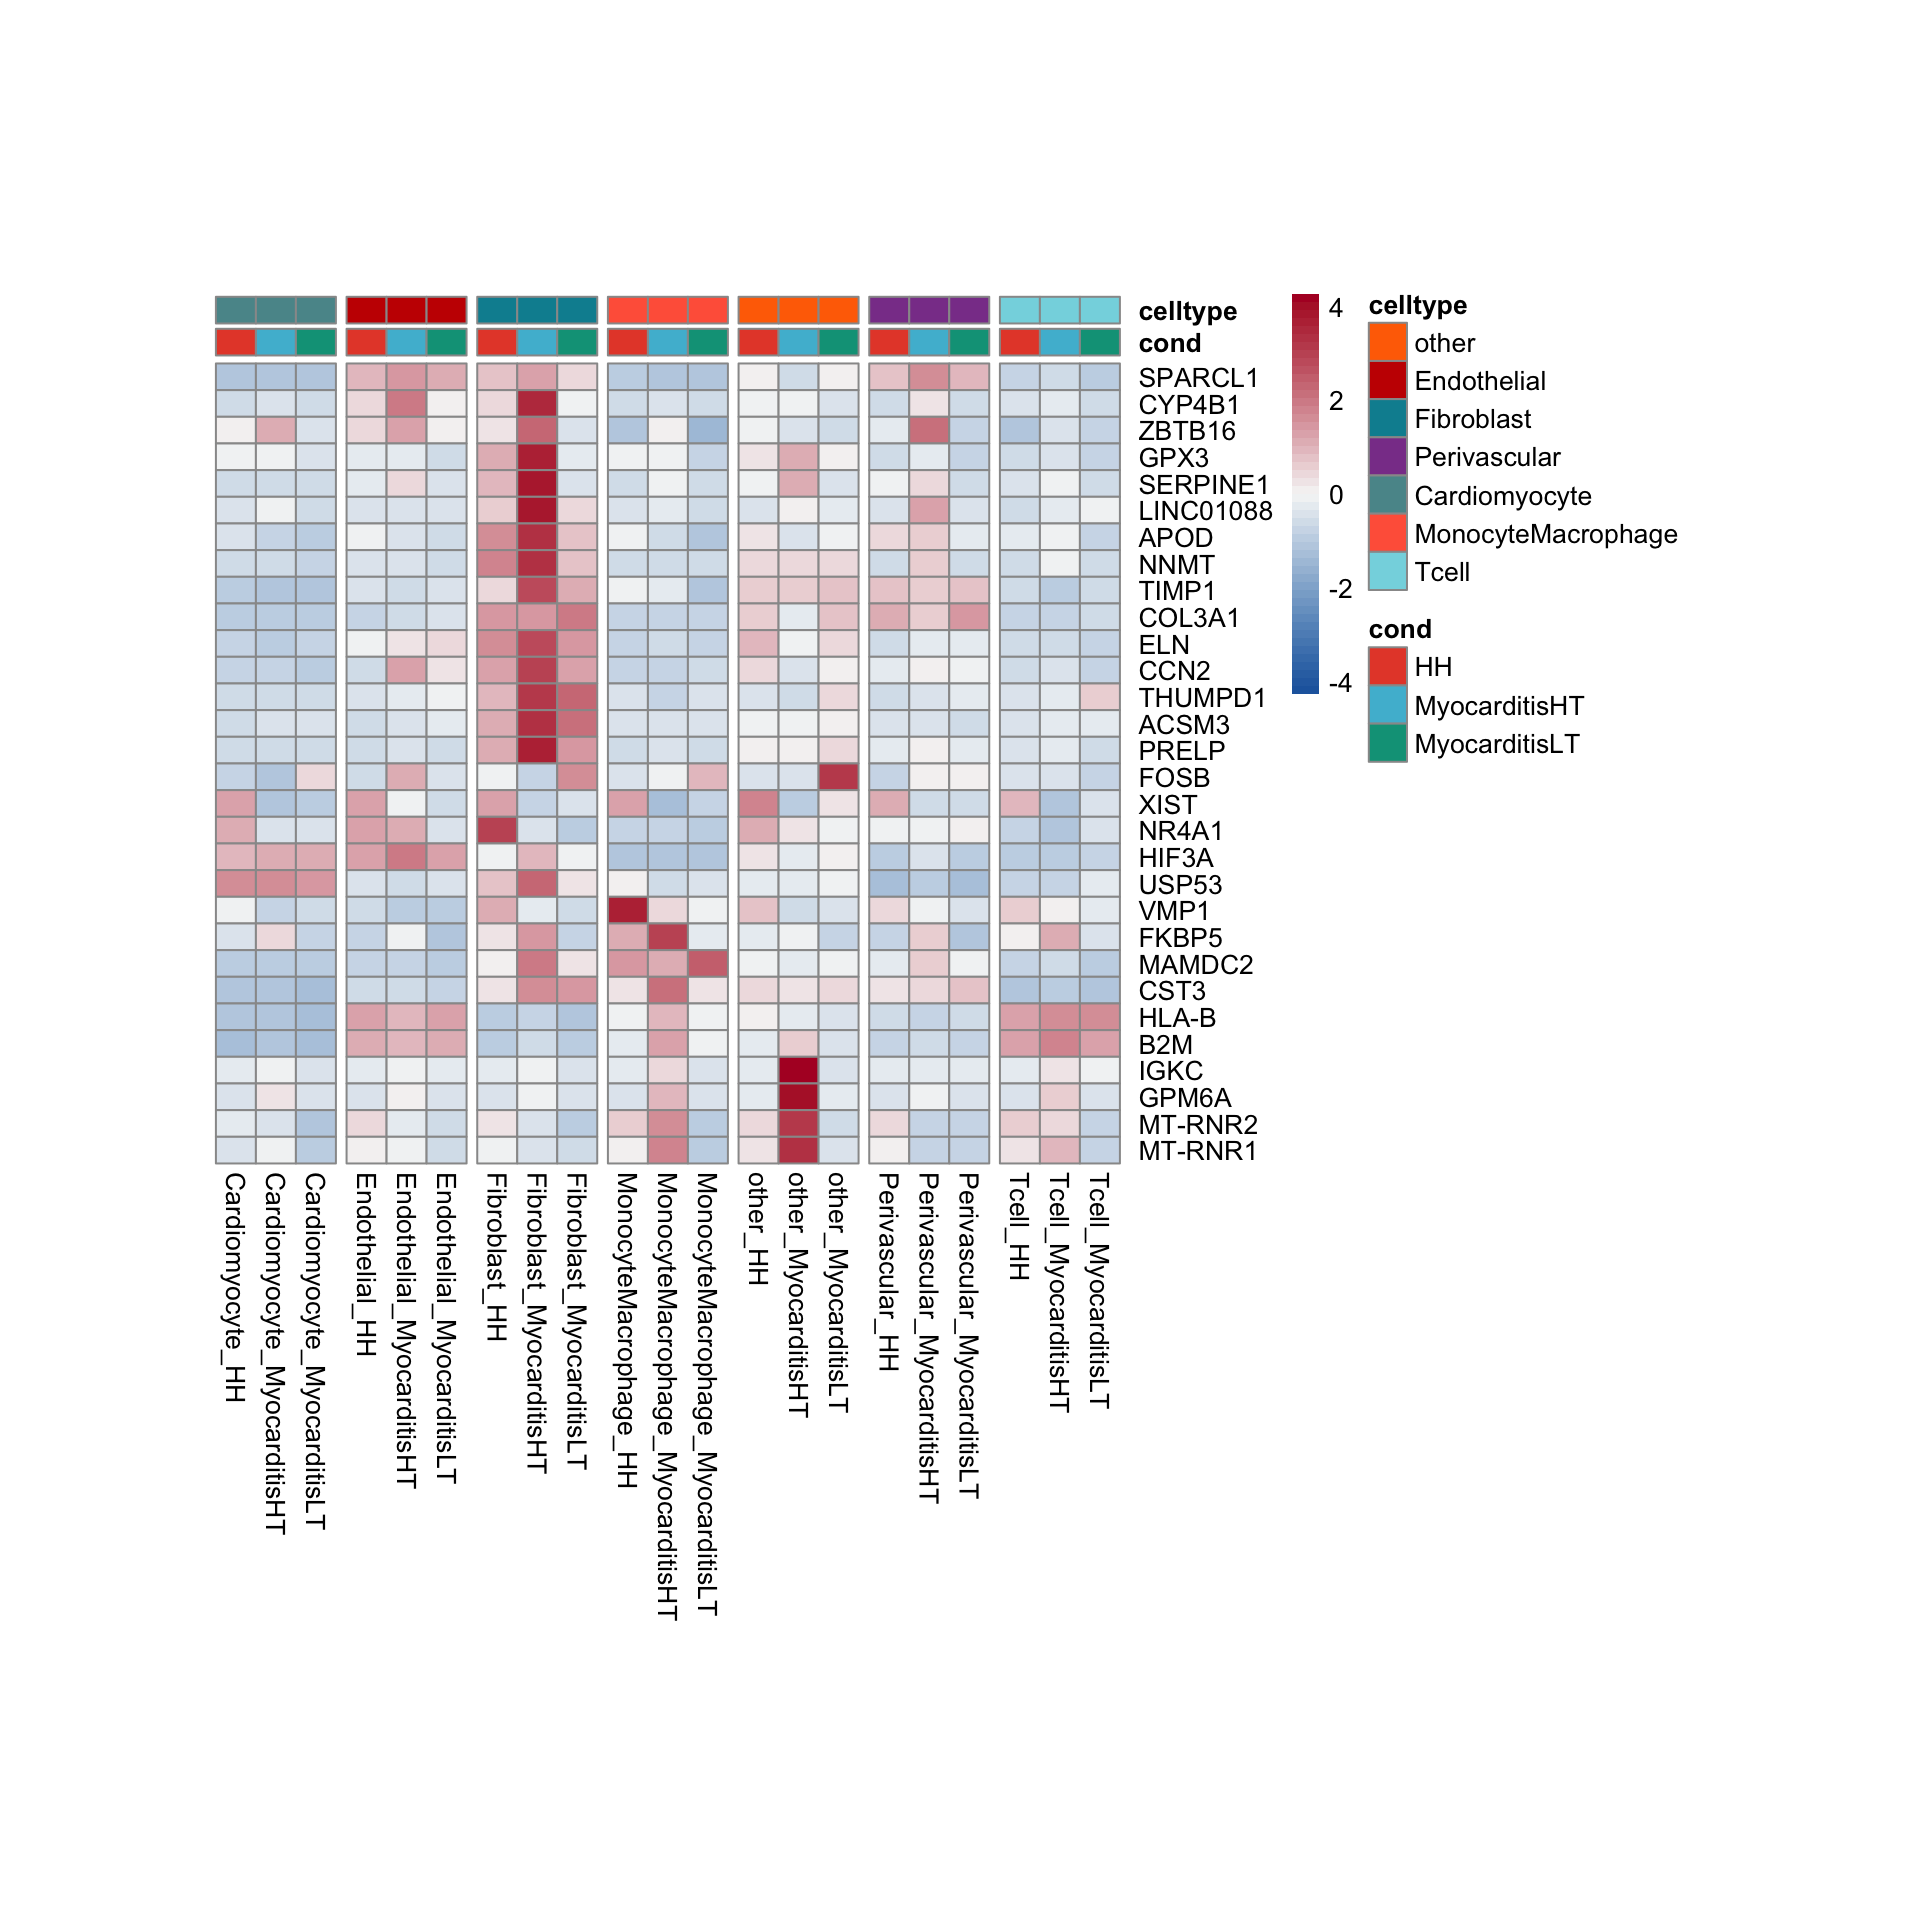
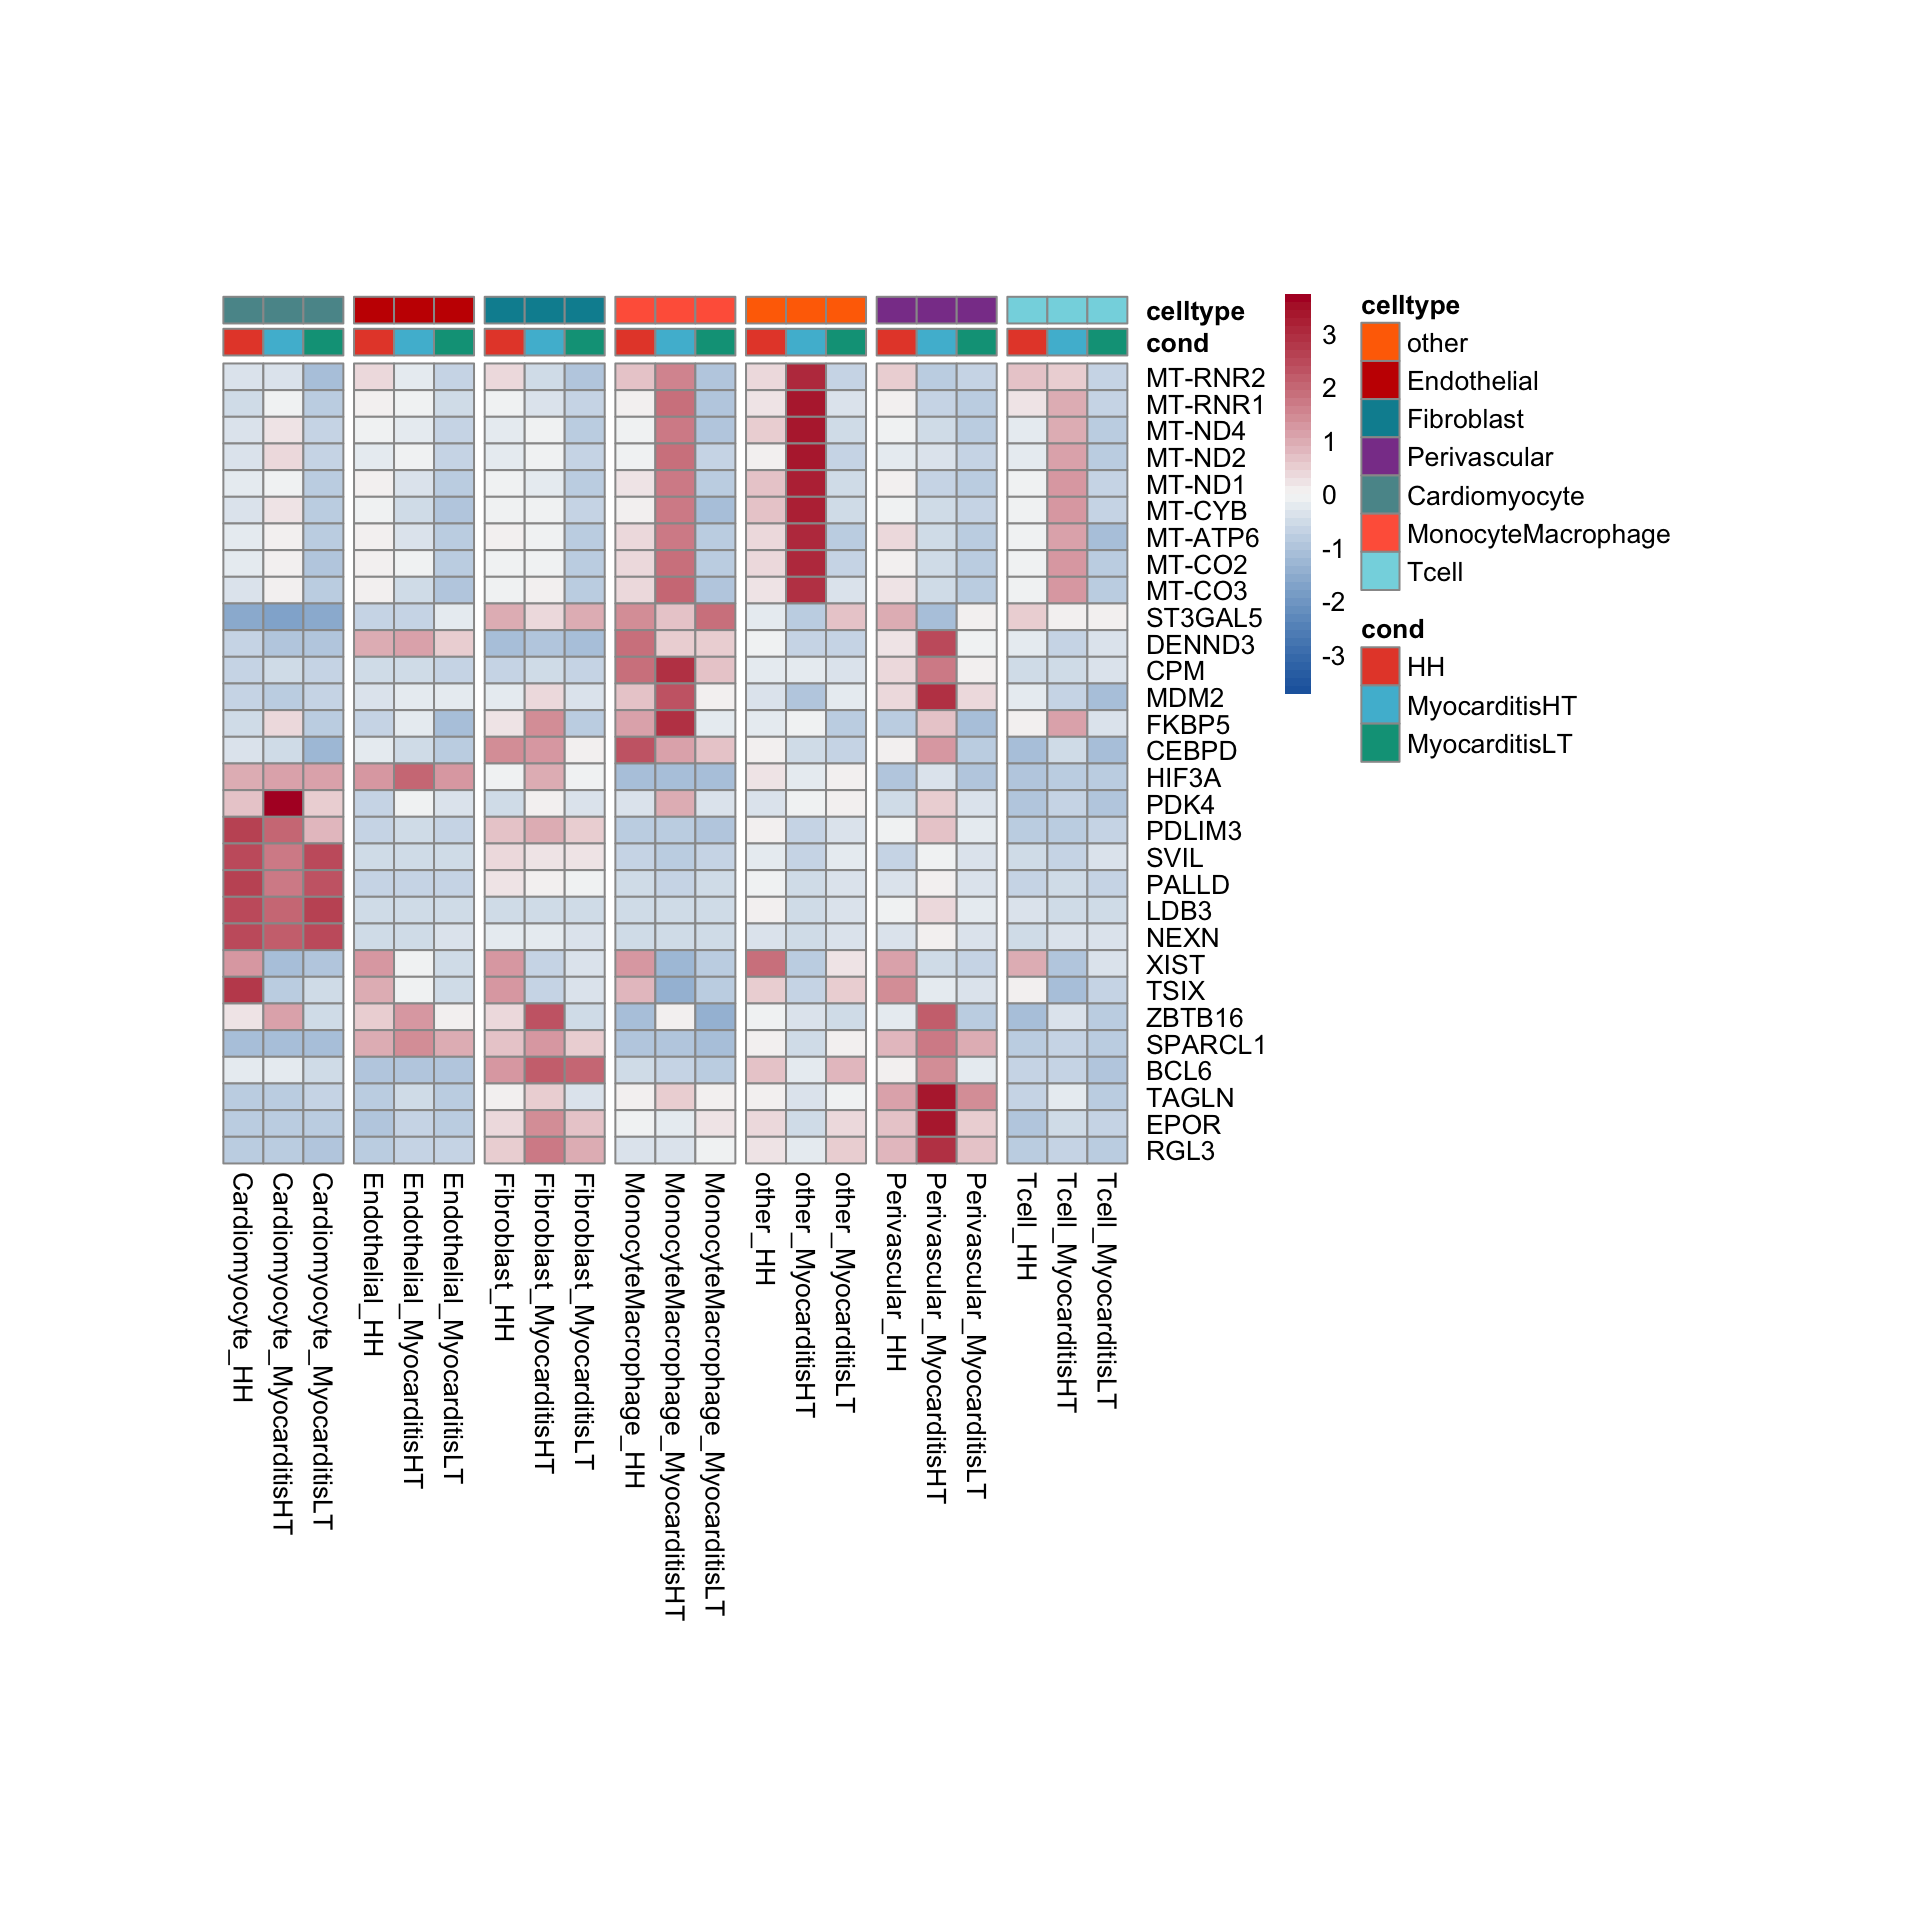
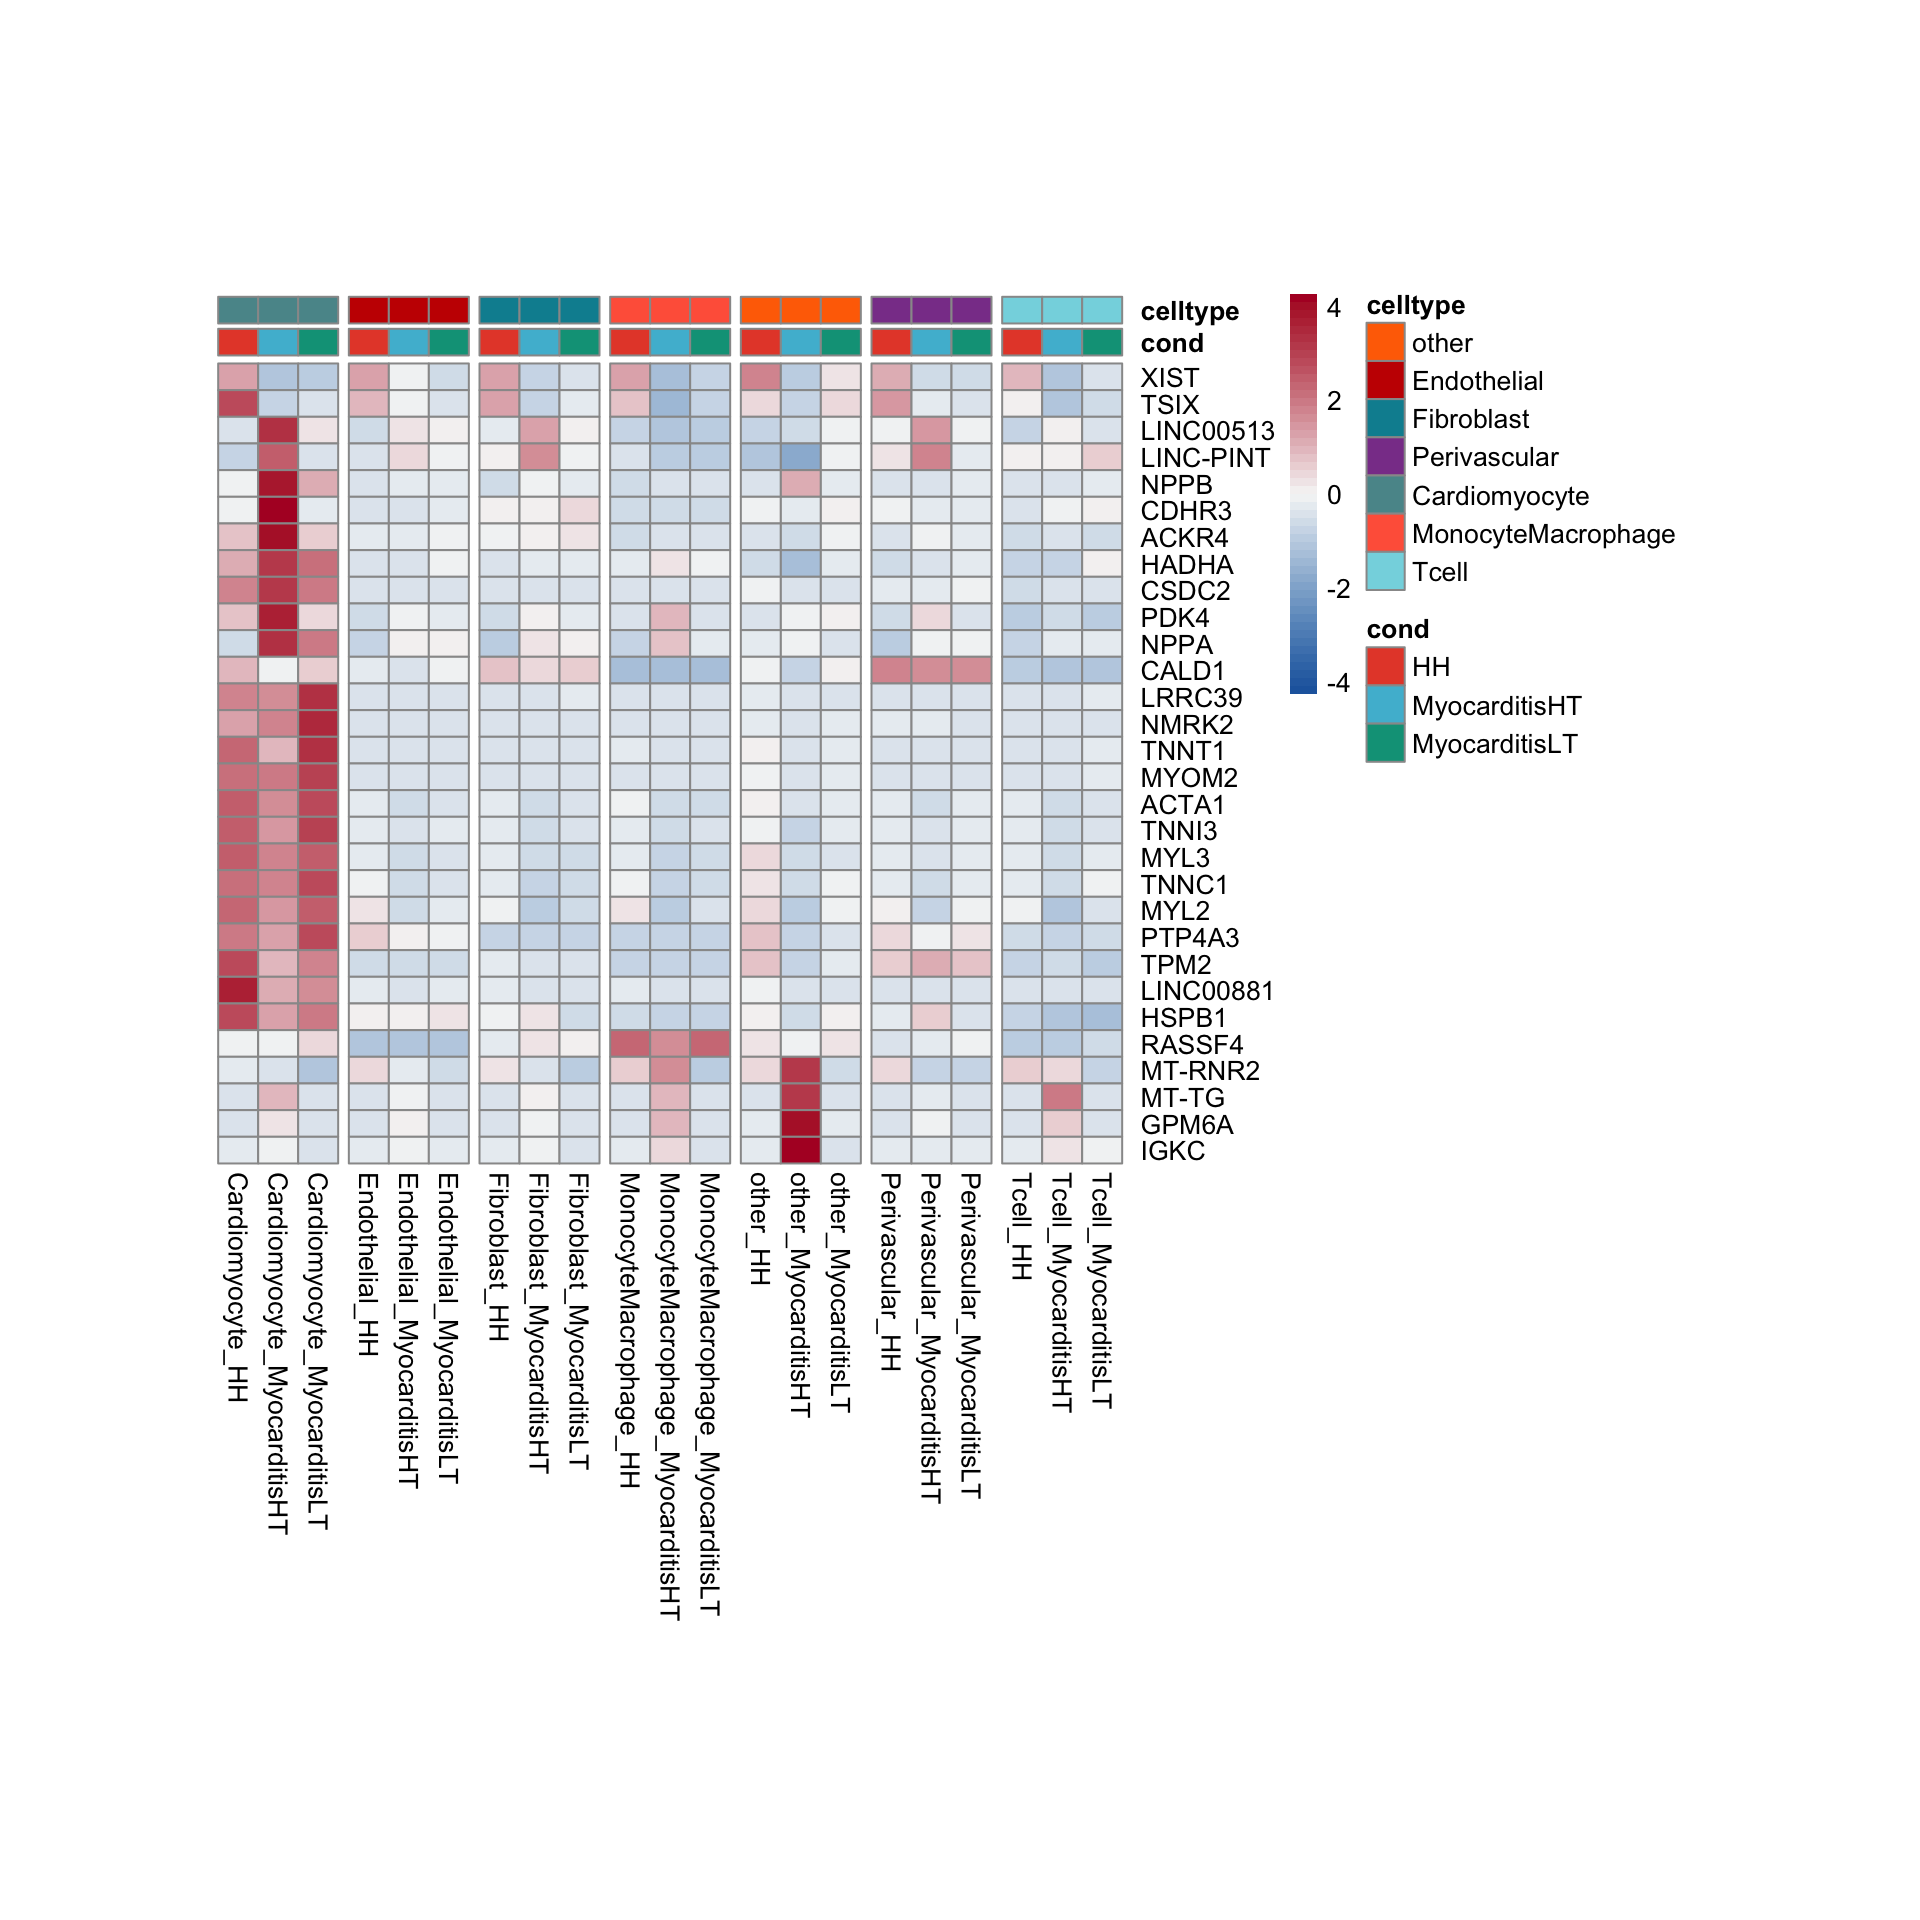
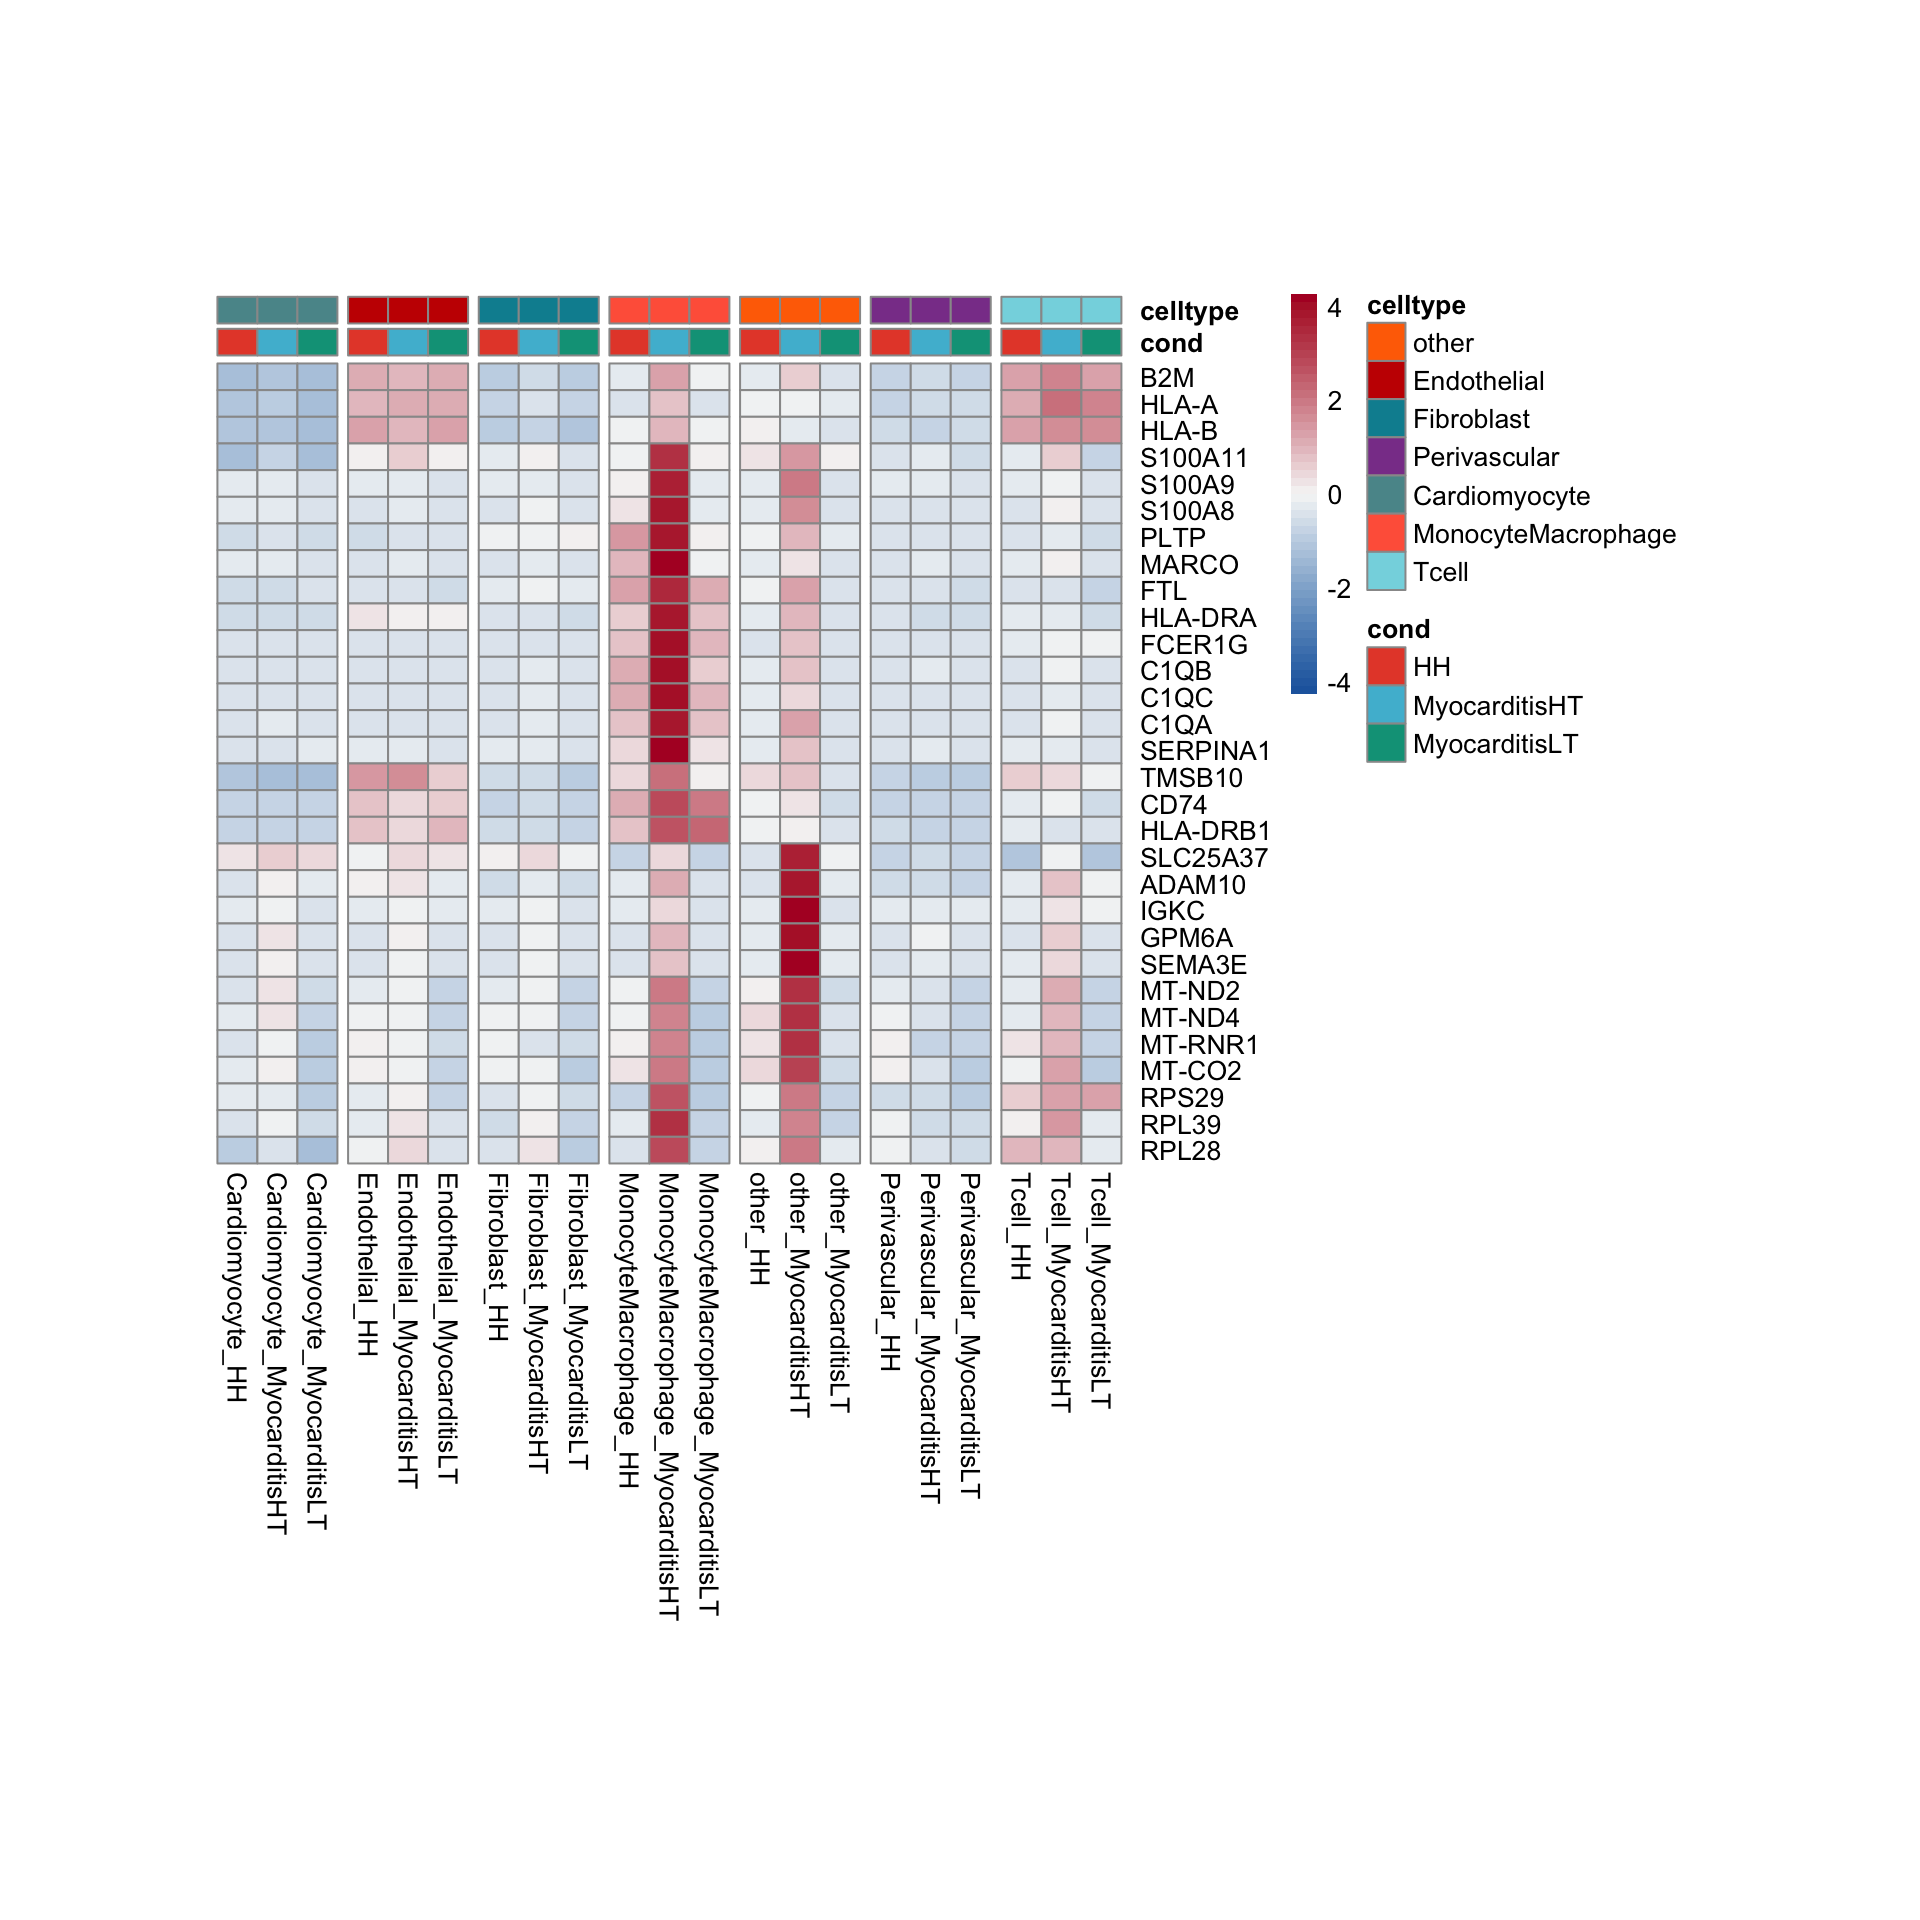
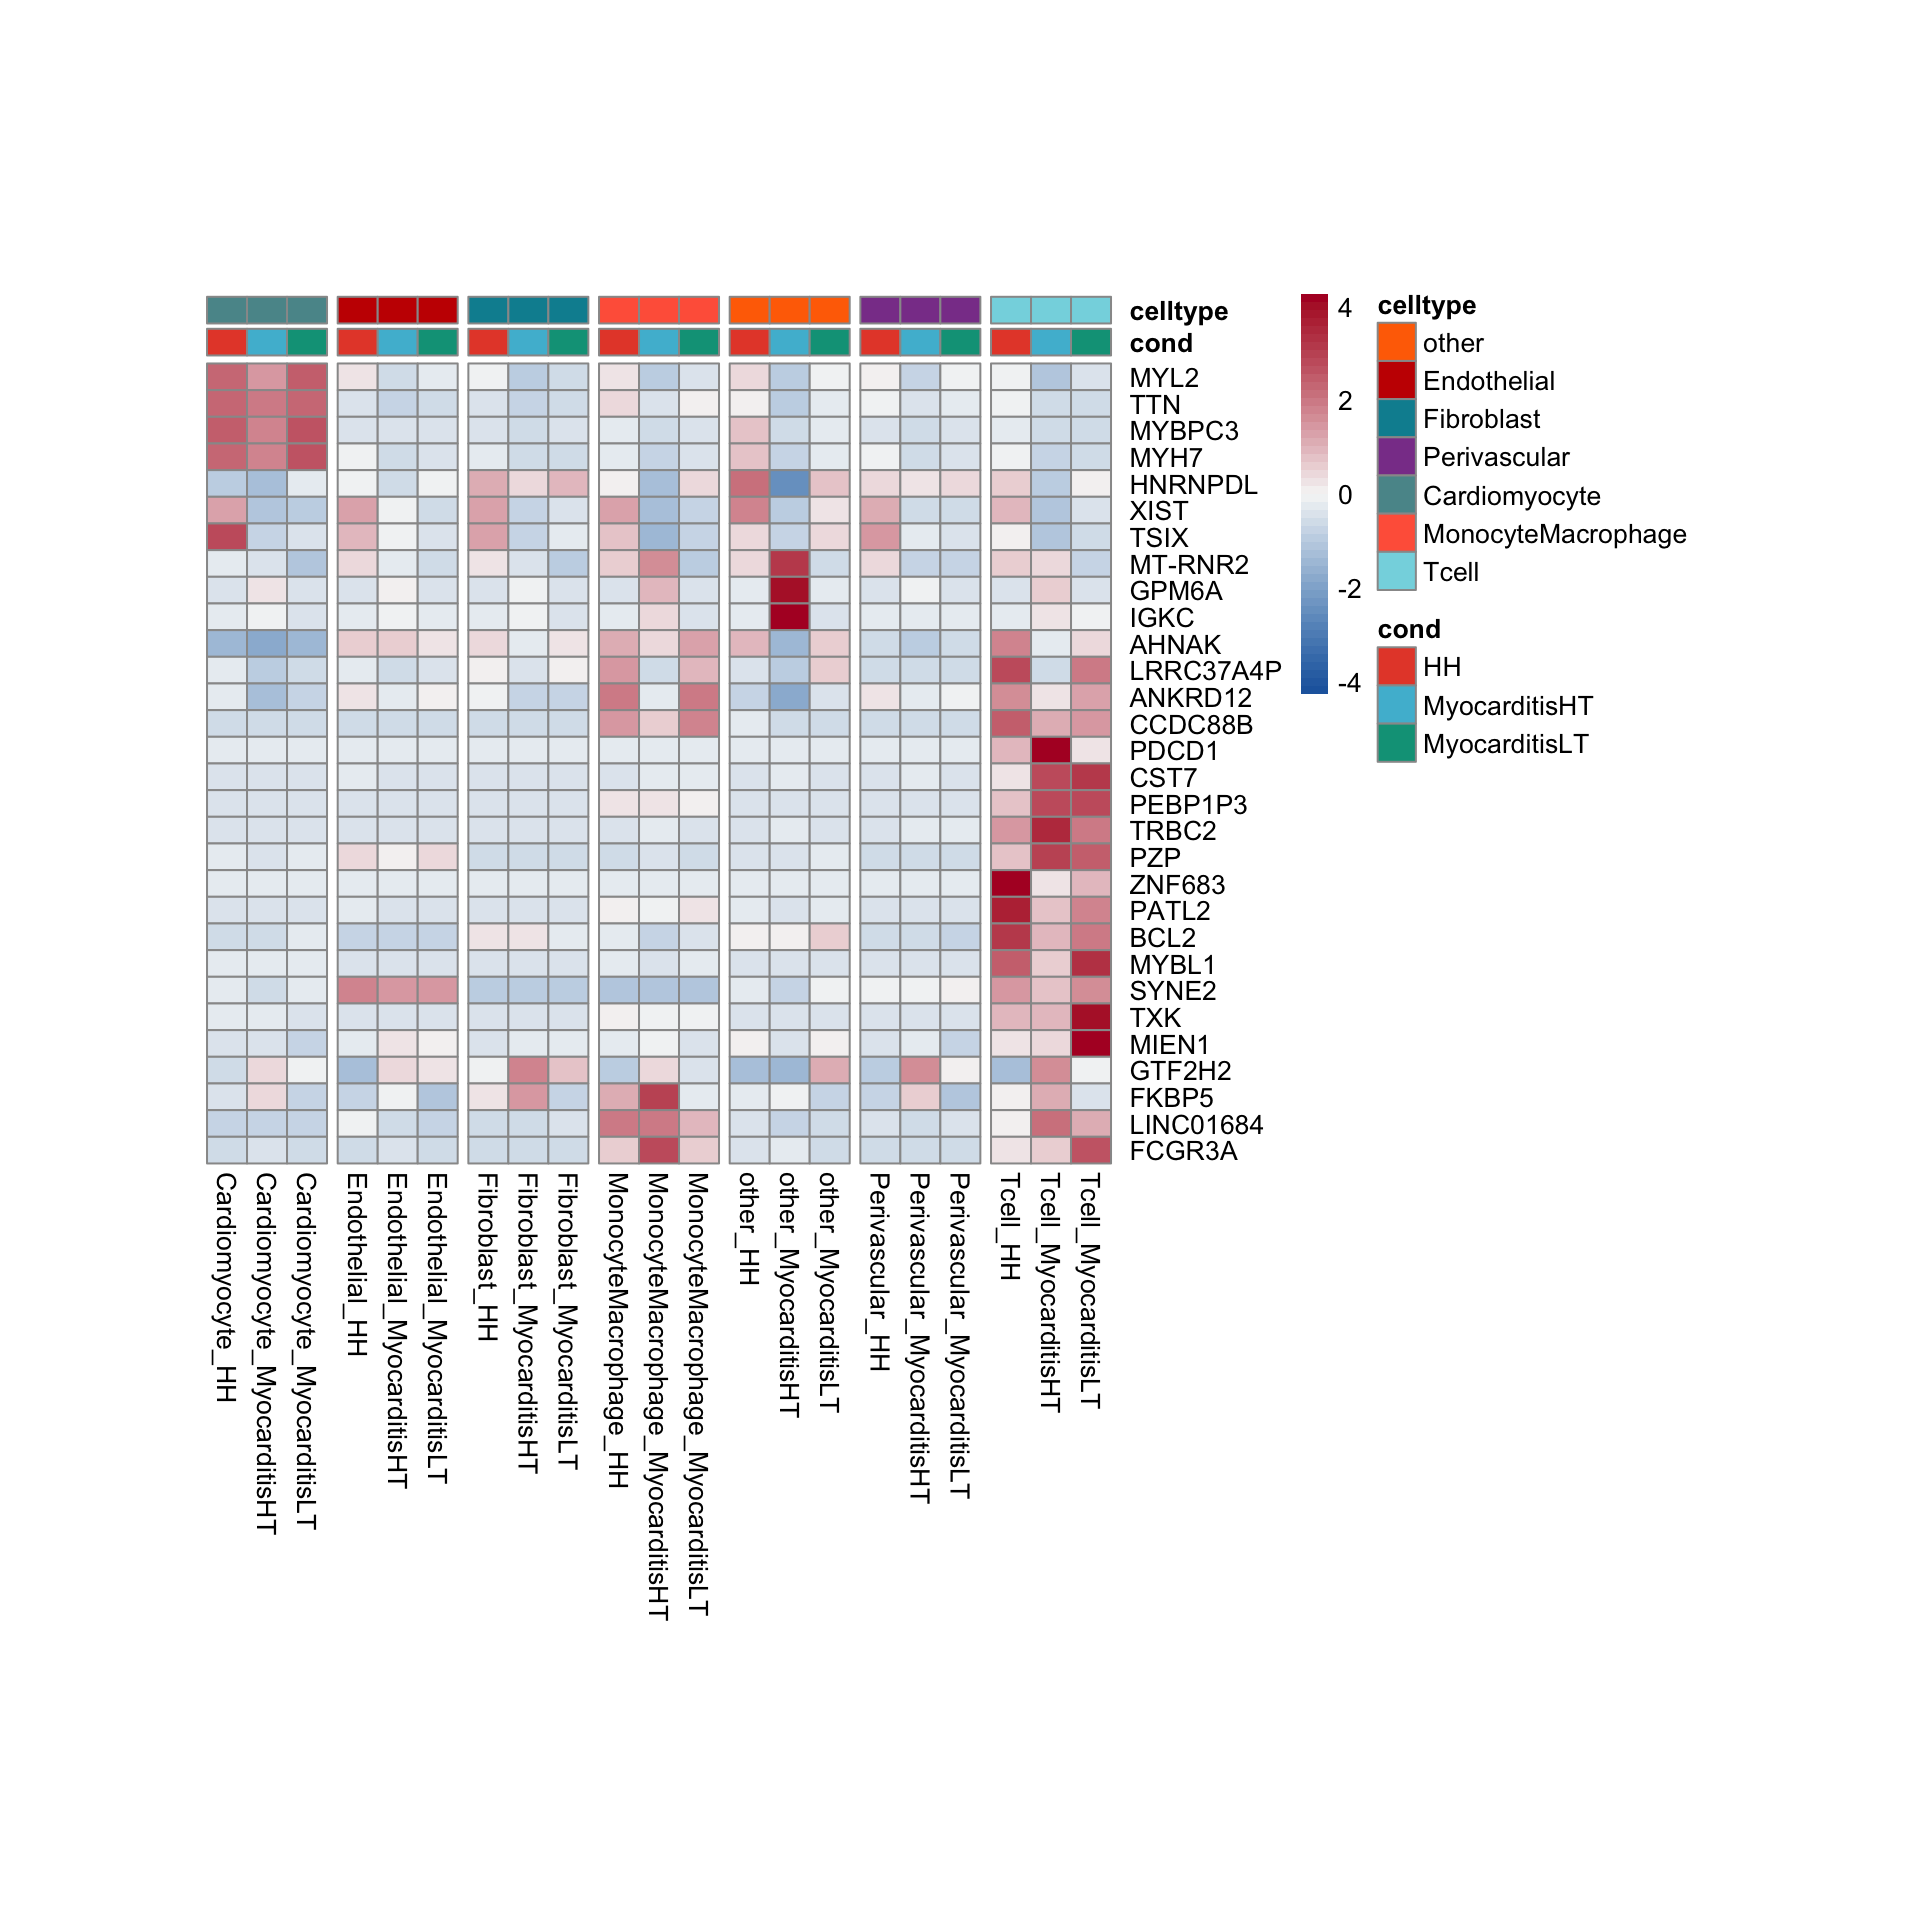
row.names = FALSE, col.names = TRUE, quote = FALSE, sep = "\t")avg Heatmap top cwDE genes
GSEA clusterProfiler cw DEgenes
clVec <- levels(seurat$label_plus_cond2)
GOcons <- lapply(clVec, function(cl){
  clustDE_DatSub <- clustDE_Dat[which(clustDE_Dat$group == cl),] %>%
    mutate(ENS=gsub("\\..*$", "", gene)) #%>%
    #slice_min(., max_pval, n=200)
  egoSS <- enrichGO(gene      = unique(clustDE_DatSub$ENS),
                OrgDb         = org.Hs.eg.db,
                keyType       = 'ENSEMBL',
                ont           = "BP",
                pAdjustMethod = "BH",
                pvalueCutoff  = 0.05,
                qvalueCutoff  = 0.05)
  egoSS <- setReadable(egoSS, OrgDb = org.Hs.eg.db)
  egoSSres <- egoSS@result %>% filter(p.adjust < 0.05) %>%
    mutate(subset=cl)
})

names(GOcons) <- clVec

## table to select pathways
GOconsDat <- do.call("rbind", GOcons)

write.table(GOconsDat, quote=F, row.names = T, col.names = T, sep= "\t",
            file = paste0(basedir,"/data/humanHeartsPlusGraz_intPatients_",
                              "merged_Groups_cwDEGO.txt"))
vis sel GO Fibroblasts
selGO <- read_tsv(paste0(basedir,"/data/GSEA/selGO_Fibroblasts.txt"))%>%
  mutate(GO_cond = paste0(GOterm, "_", cond2))
GOconsDatSel <- GOconsDat %>%
  mutate(cond2 = gsub(".*_", "", subset)) %>%
  mutate(label= gsub("_.*", "", subset)) %>%
  filter(label == "Fibroblast") %>%
  mutate(GO_cond = paste0(ID, "_", cond2)) %>%
  filter(GO_cond %in% selGO$GO_cond)

grpVec <- unique(selGO$cond2)
lapply(grpVec, function(grp){
  selGODat <- GOconsDatSel %>% filter(cond2 == grp)
  selGODat <- selGODat %>% mutate(qscore=-log(p.adjust, base=10))
  p <- ggbarplot(selGODat, x = "Description", y = "qscore",
          fill = "cond2",
          color = "cond2",
          palette = colCond,
          sort.val = "asc",
          sort.by.groups = TRUE
          #x.text.angle = 90
          ) +
  rotate()
p
})
[[1]]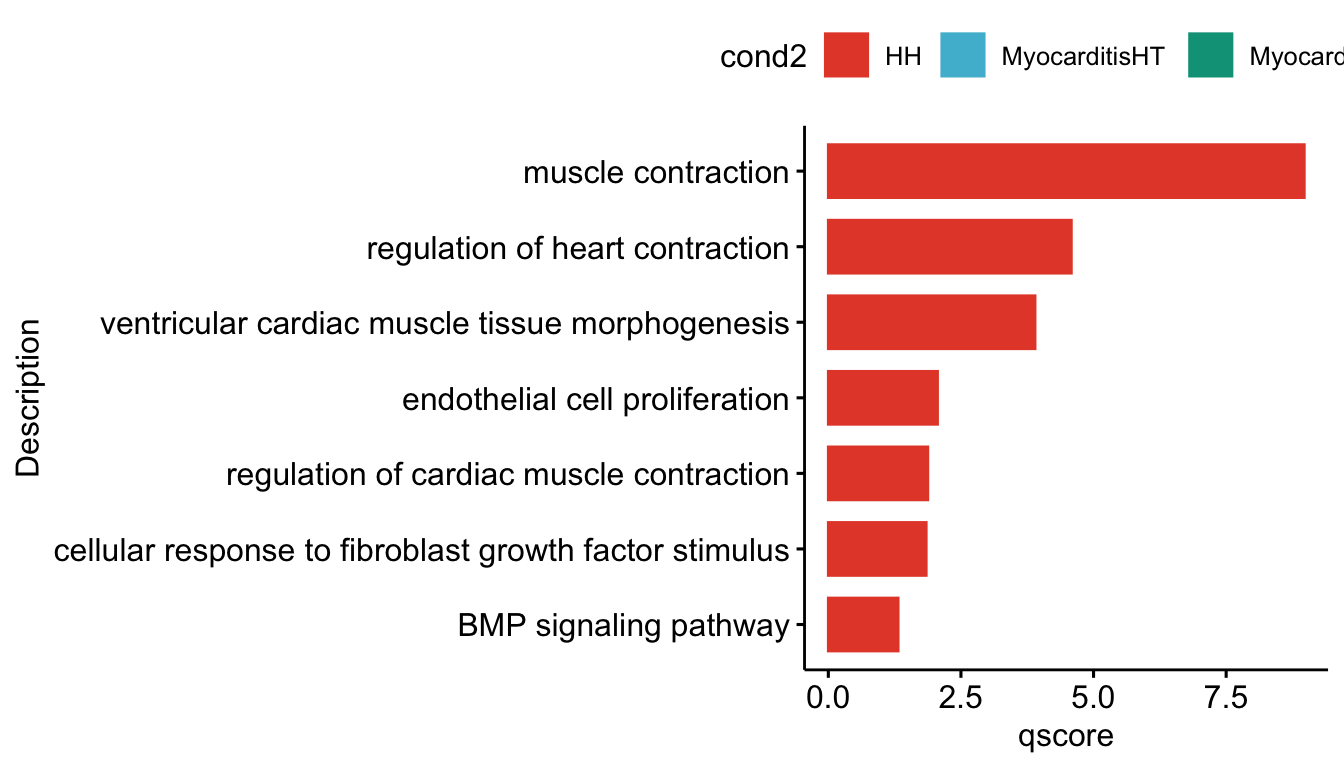
| Version | Author | Date |
|---|---|---|
| 02765dc | mluetge | 2022-07-19 |
[[2]]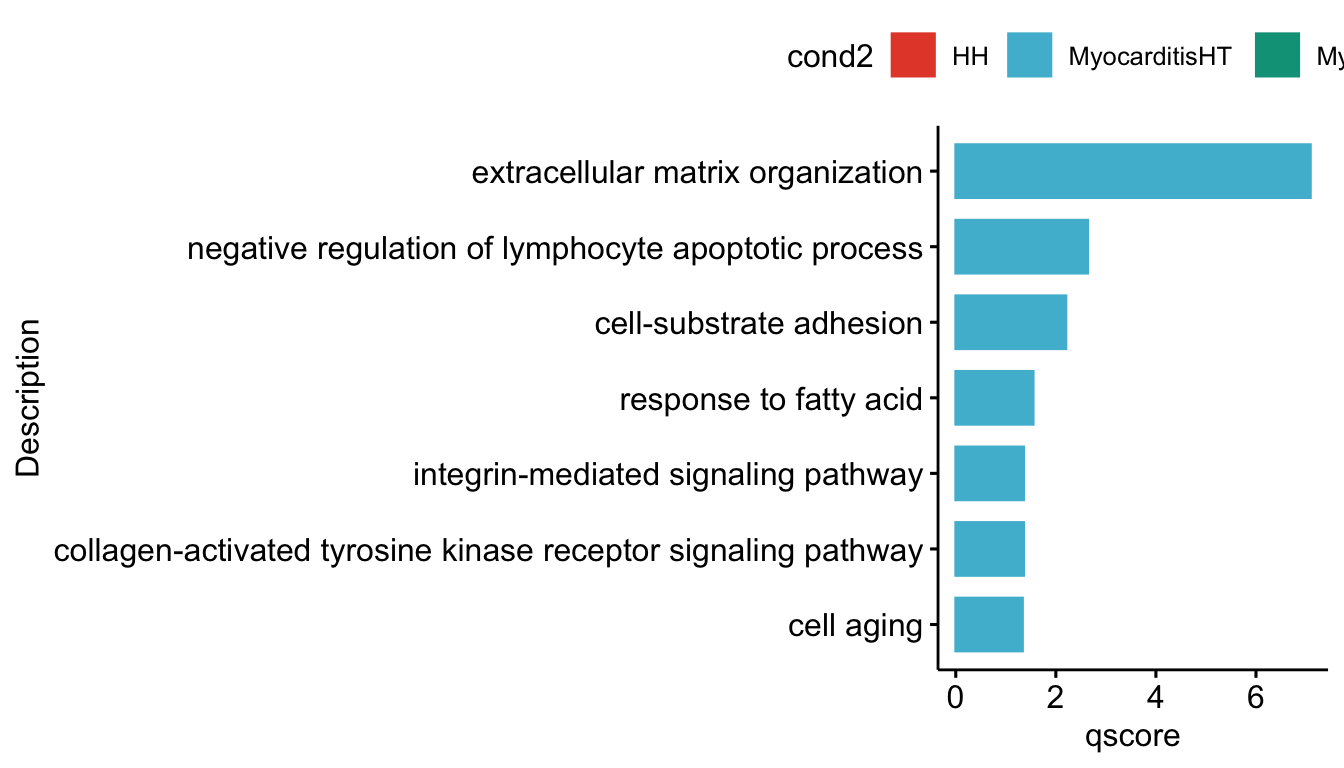
| Version | Author | Date |
|---|---|---|
| 02765dc | mluetge | 2022-07-19 |
[[3]]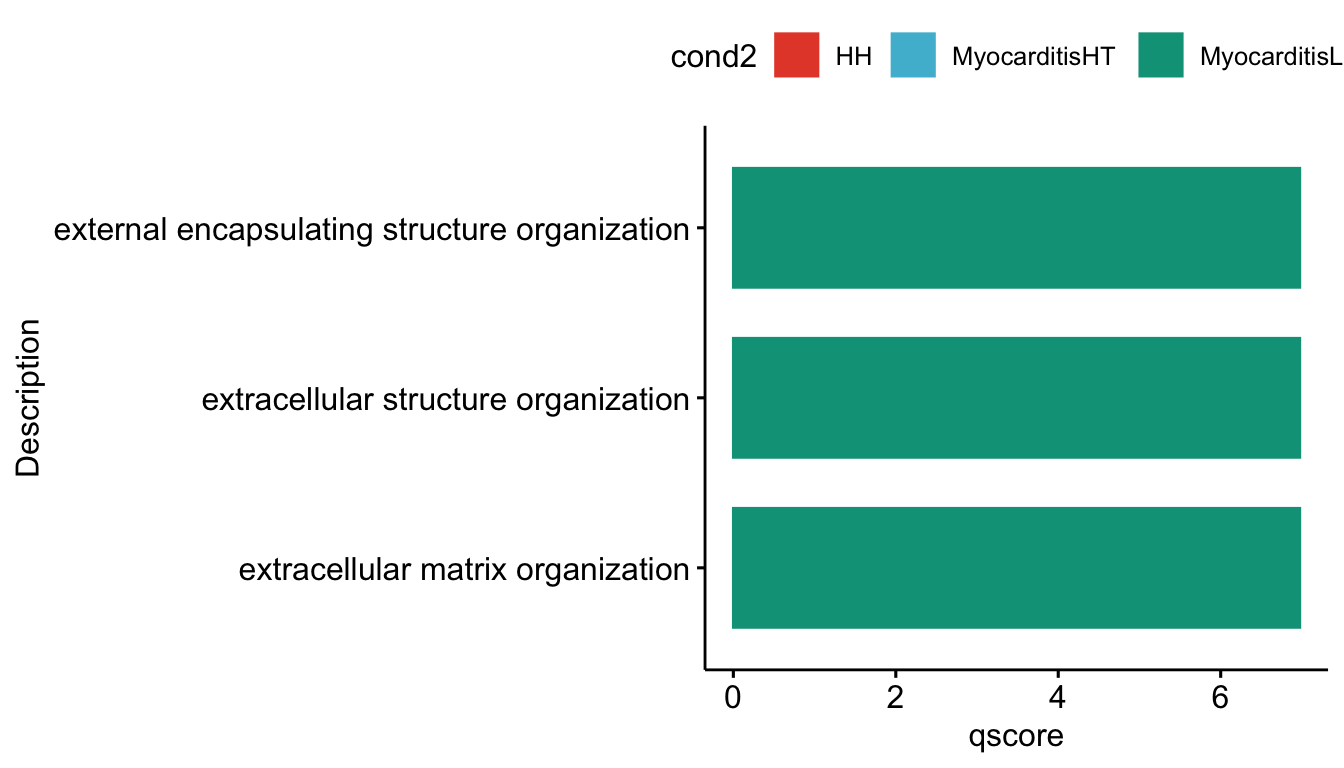
signatures viridis
split by grp
signDat <- read_delim(file = paste0(basedir,
                    "/data/SelSignaturesTreat2.txt"),
                    delim = "\t")
genes <- data.frame(geneID=rownames(seurat)) %>%
  mutate(gene=gsub("^.*\\.", "", geneID))
signDat <- signDat %>% left_join(.,genes, by="gene")
allSign <- unique(signDat$signature)

DefaultAssay(object = seurat) <- "integrated"
sce2 <- as.SingleCellExperiment(seurat)

DefaultAssay(object = seurat) <- "RNA"
sce <- as.SingleCellExperiment(seurat)
reducedDims(sce) <- list(PCA=reducedDim(sce2, "PCA"),
                         TSNE=reducedDim(sce2, "TSNE"),
                         UMAP=reducedDim(sce2, "UMAP"))

treatGrps <- unique(sce$cond2)

cutOff <- 3
pal = viridis(100)
sc <- scale_colour_gradientn(colours = pal, limits=c(0, cutOff))

lapply(unique(signDat$signature), function(sign){
  signGenes <- signDat %>% dplyr::filter(signature == sign)
  sceSub <- sce[which(rownames(sce) %in% signGenes$geneID),]
  cntMat <- rowSums(t(as.matrix(sceSub@assays@data$logcounts)))/nrow(signGenes)
  sceSub$sign <- cntMat
  sceSub$sign[which(sceSub$sign > cutOff)] <- cutOff
  sceSub$sign[which(sceSub$sign < 0)] <- 0
  lapply(treatGrps, function(treat){
    sceSubT <- sceSub[, which(sceSub$cond2 == treat)]
    p <- visGroup_adapt(sceSubT, 'sign', dim_red = 'UMAP') +
    sc +
    guides(colour = guide_colourbar(title = '')) +
    ggtitle(paste0(sign, ' signature - ', treat)) +
    theme_classic() +
    theme(axis.text = element_blank(),
          axis.ticks = element_blank()) +
    labs(x='Dimension 1', y='Dimension 2')
    p
  })
})
[[1]]
[[1]][[1]]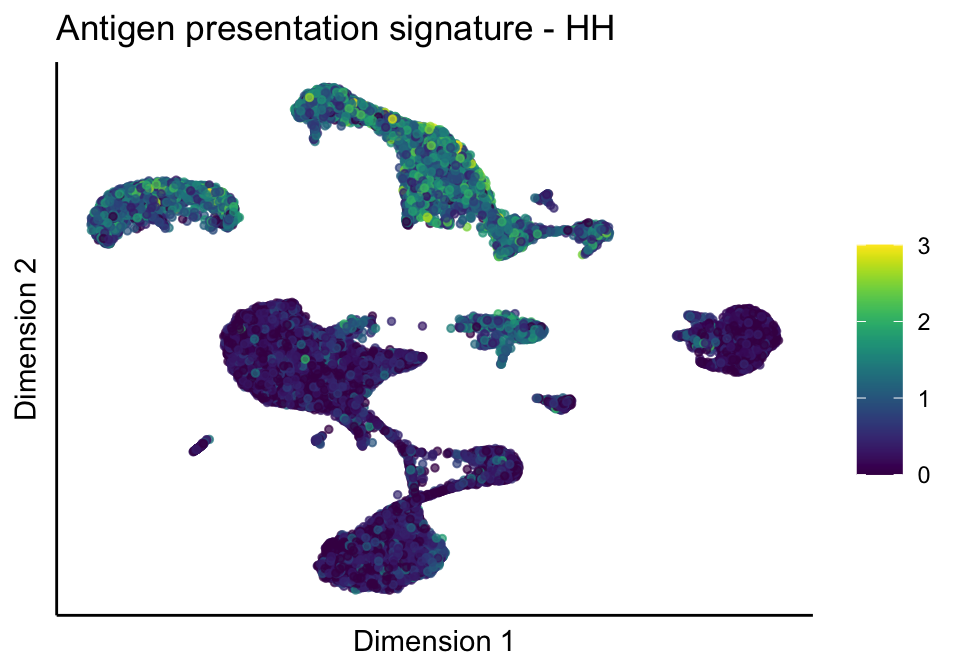
| Version | Author | Date |
|---|---|---|
| 02765dc | mluetge | 2022-07-19 |
[[1]][[2]]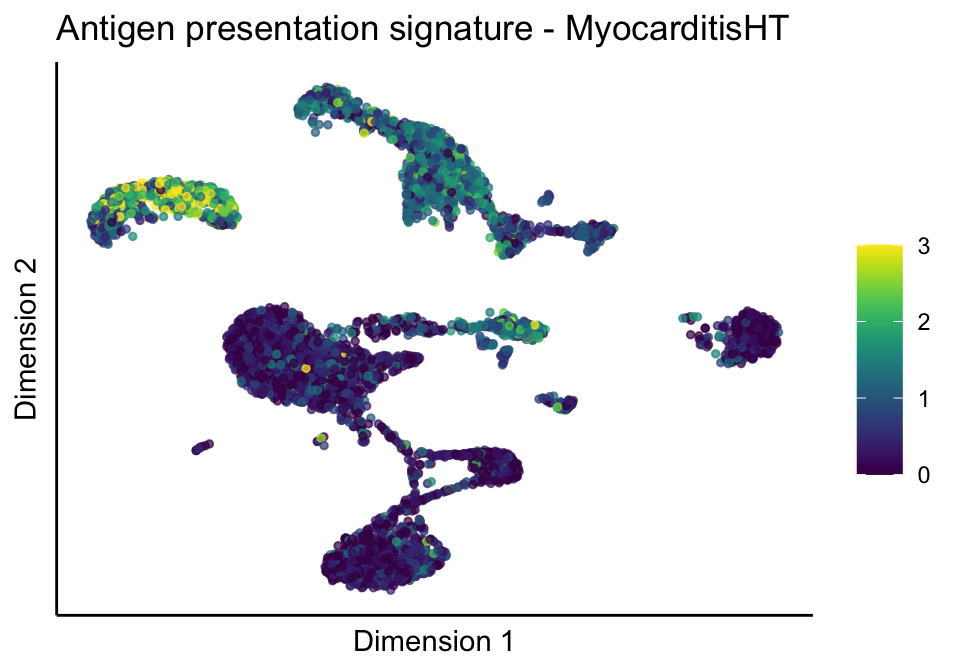
| Version | Author | Date |
|---|---|---|
| 02765dc | mluetge | 2022-07-19 |
[[1]][[3]]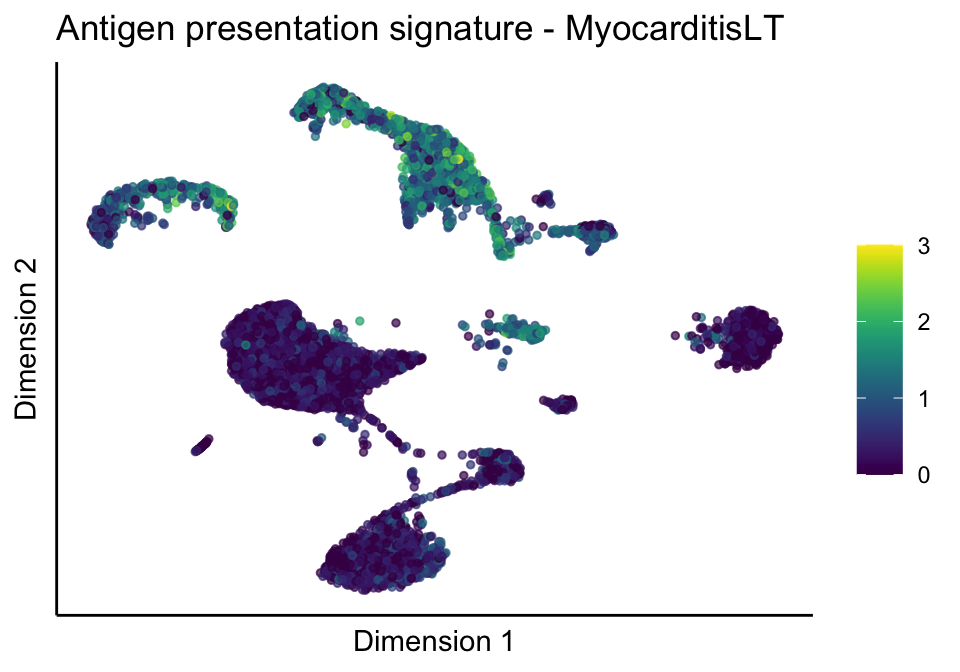
| Version | Author | Date |
|---|---|---|
| 02765dc | mluetge | 2022-07-19 |
[[2]]
[[2]][[1]]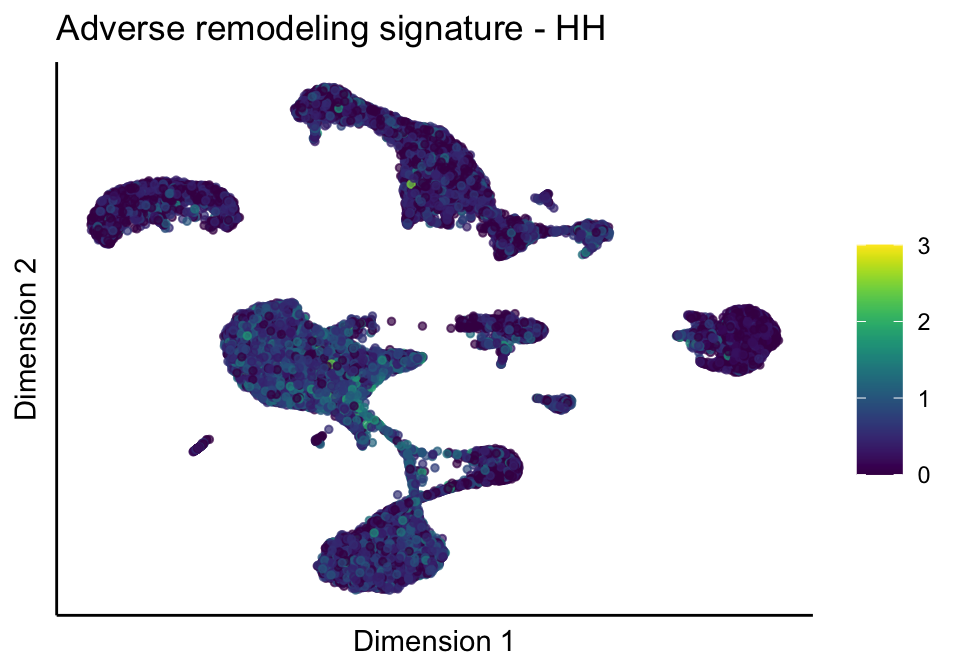
| Version | Author | Date |
|---|---|---|
| 02765dc | mluetge | 2022-07-19 |
[[2]][[2]]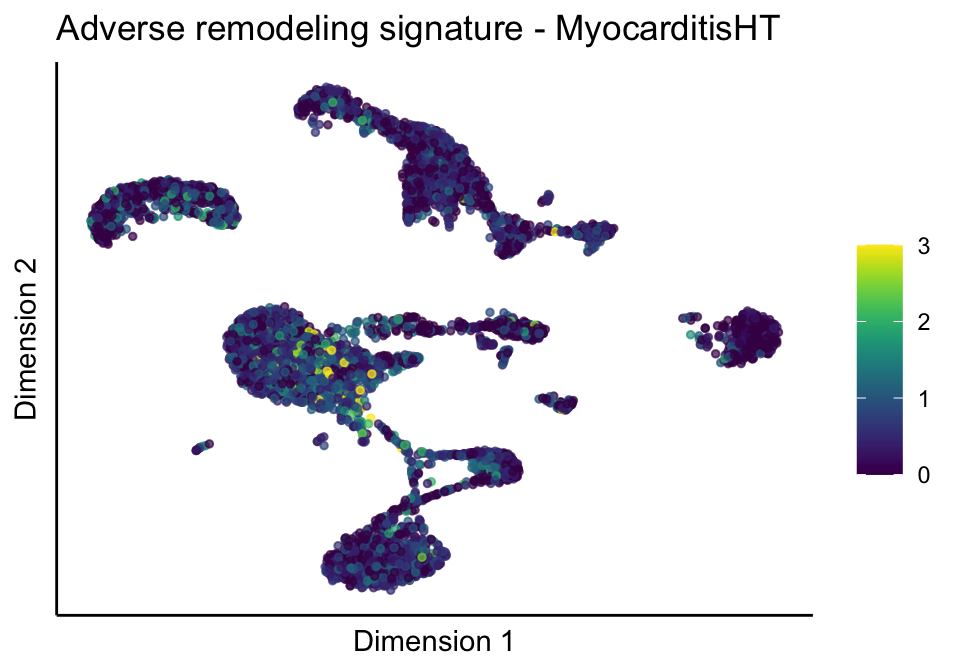
| Version | Author | Date |
|---|---|---|
| 02765dc | mluetge | 2022-07-19 |
[[2]][[3]]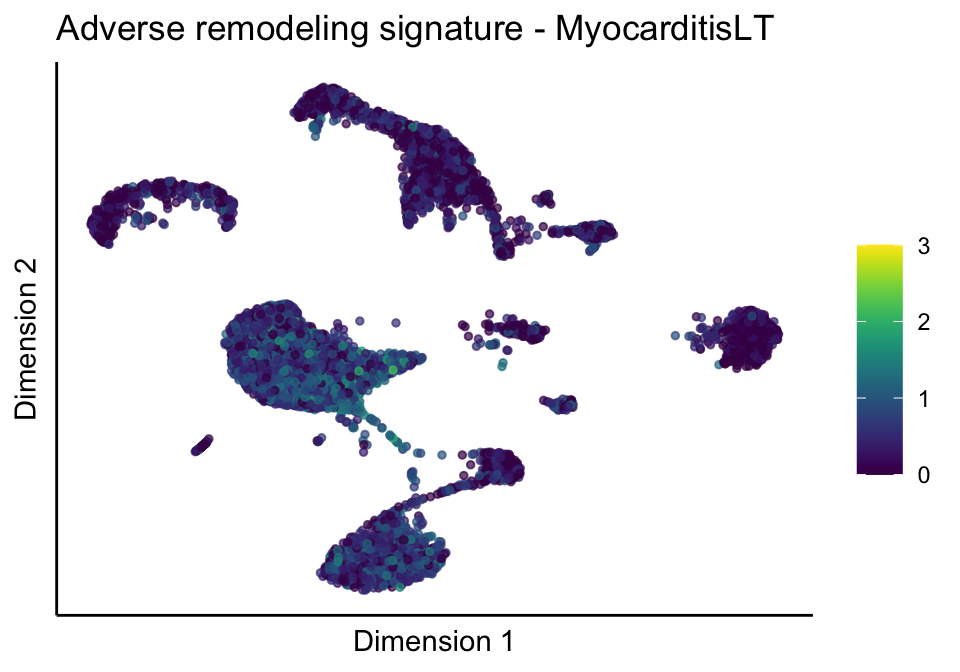
| Version | Author | Date |
|---|---|---|
| 02765dc | mluetge | 2022-07-19 |
[[3]]
[[3]][[1]]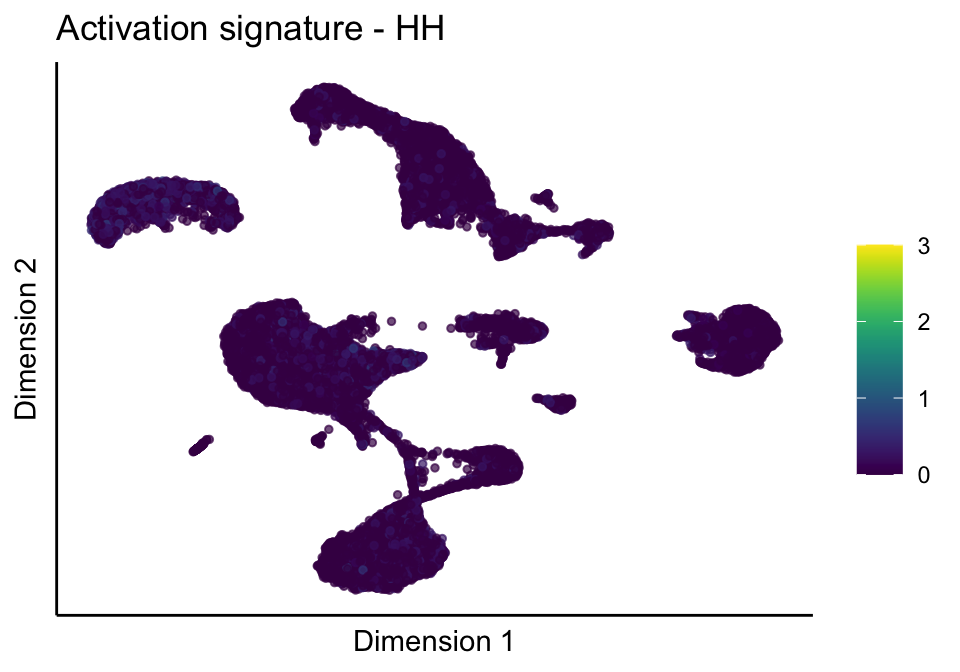
| Version | Author | Date |
|---|---|---|
| 02765dc | mluetge | 2022-07-19 |
[[3]][[2]]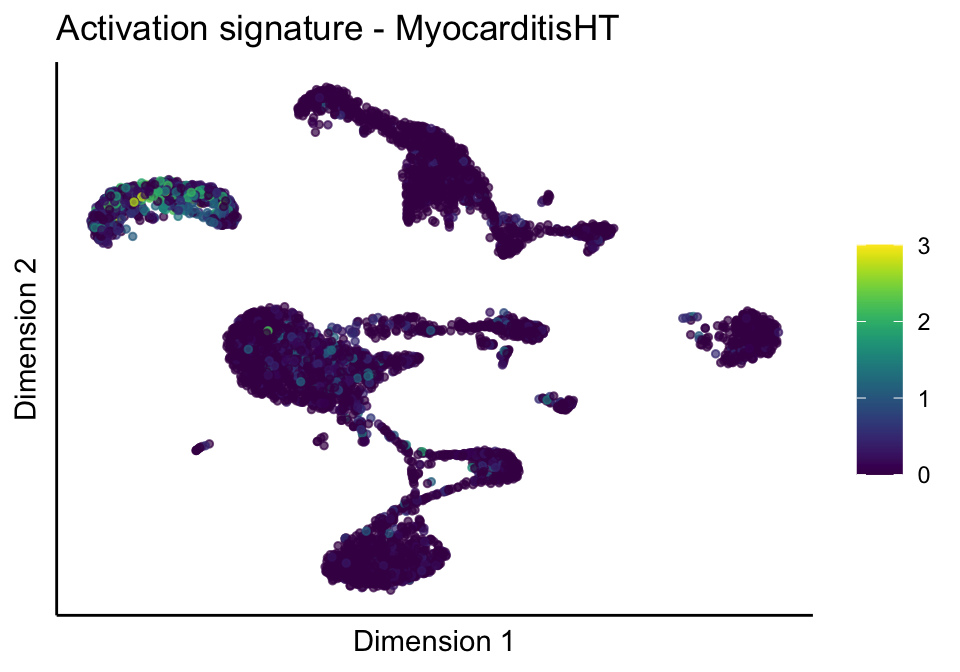
| Version | Author | Date |
|---|---|---|
| 02765dc | mluetge | 2022-07-19 |
[[3]][[3]]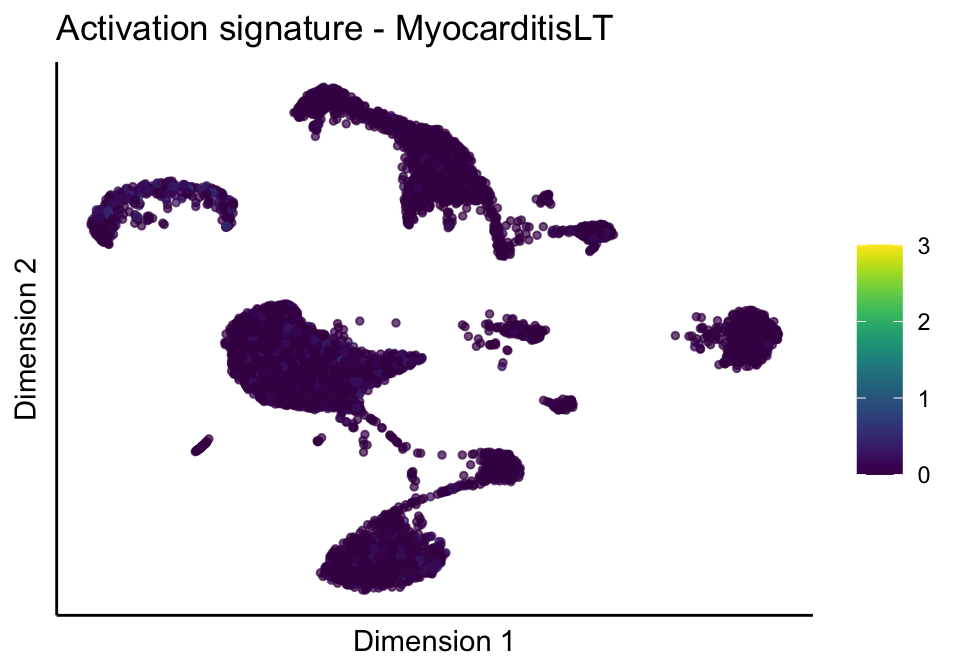
| Version | Author | Date |
|---|---|---|
| 02765dc | mluetge | 2022-07-19 |
[[4]]
[[4]][[1]]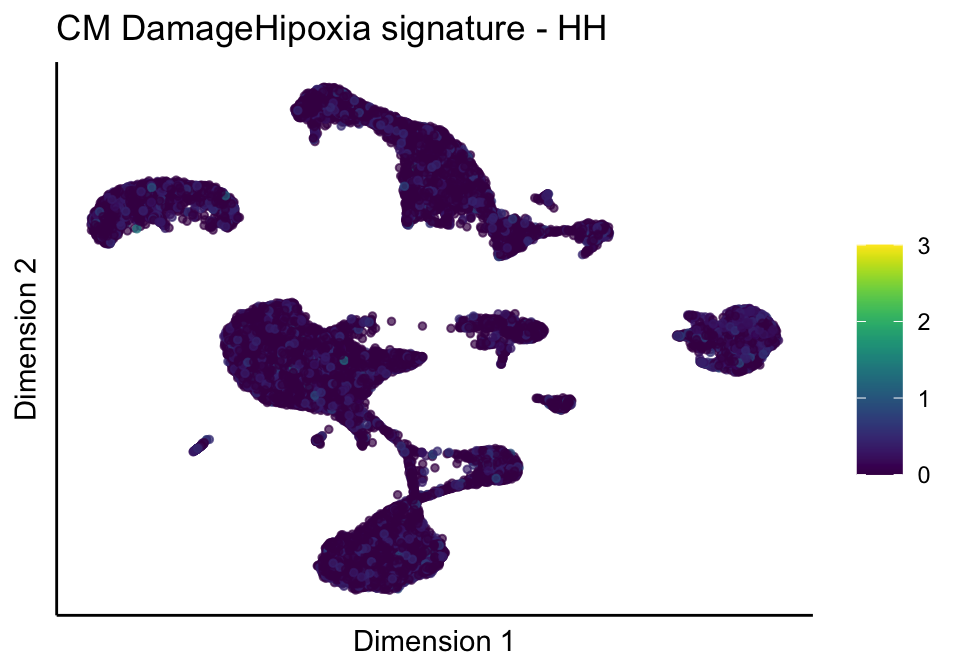
| Version | Author | Date |
|---|---|---|
| 02765dc | mluetge | 2022-07-19 |
[[4]][[2]]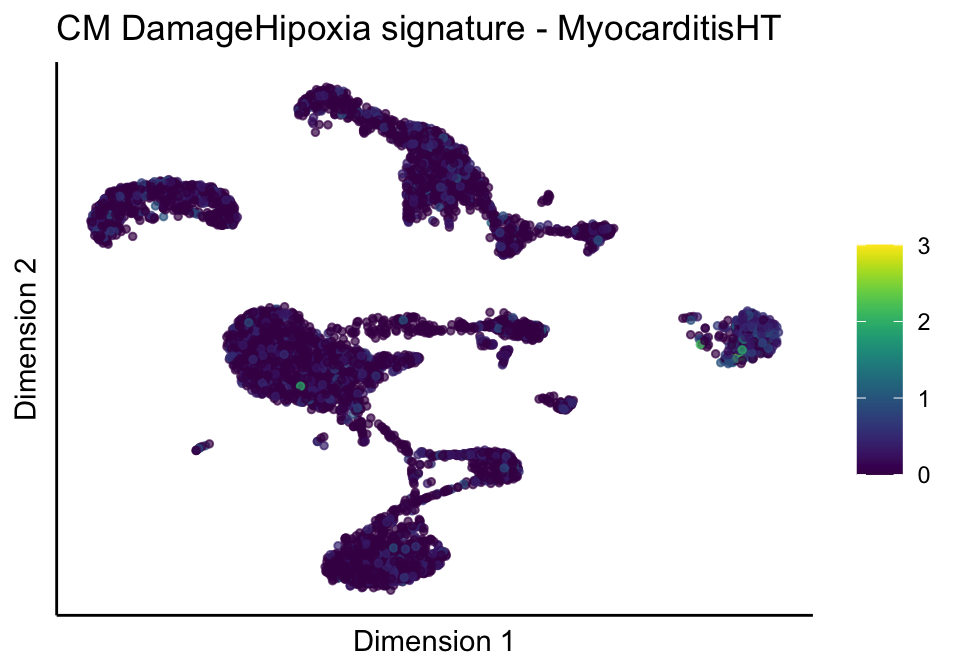
| Version | Author | Date |
|---|---|---|
| 02765dc | mluetge | 2022-07-19 |
[[4]][[3]]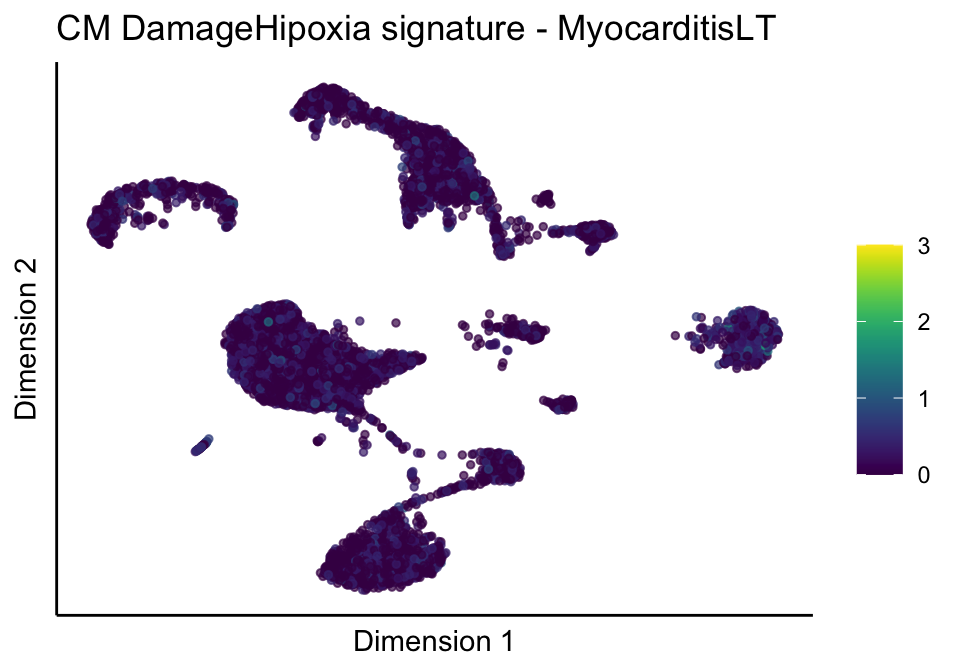
| Version | Author | Date |
|---|---|---|
| 02765dc | mluetge | 2022-07-19 |
[[5]]
[[5]][[1]]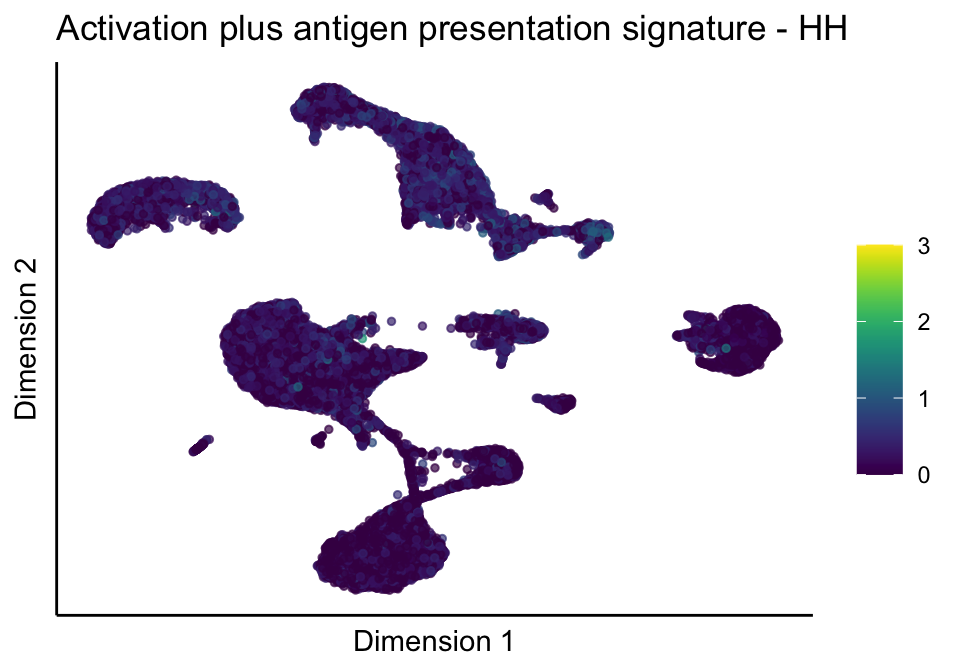
| Version | Author | Date |
|---|---|---|
| 02765dc | mluetge | 2022-07-19 |
[[5]][[2]]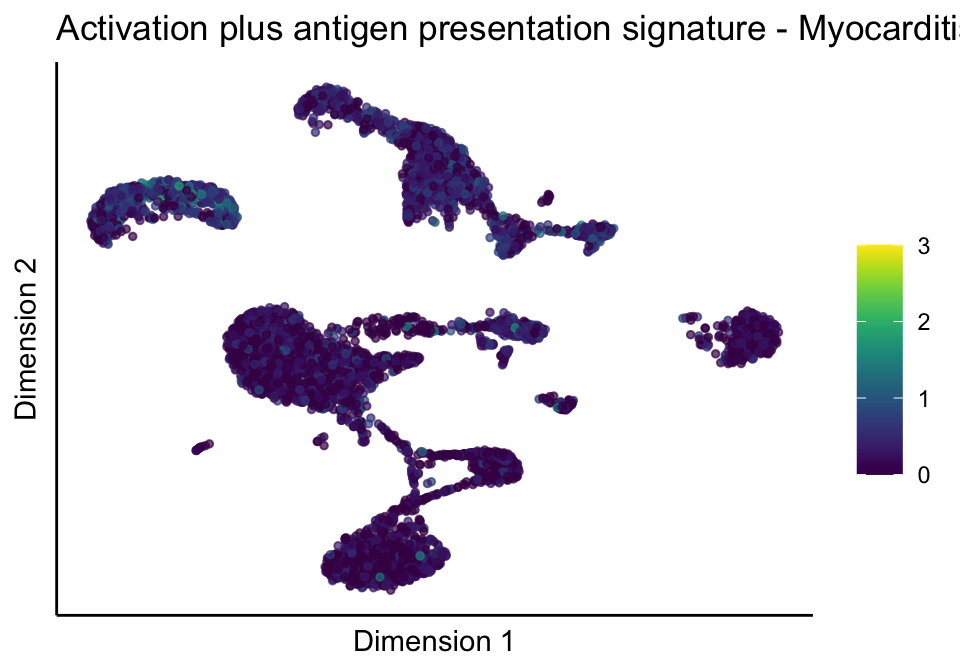
| Version | Author | Date |
|---|---|---|
| 02765dc | mluetge | 2022-07-19 |
[[5]][[3]]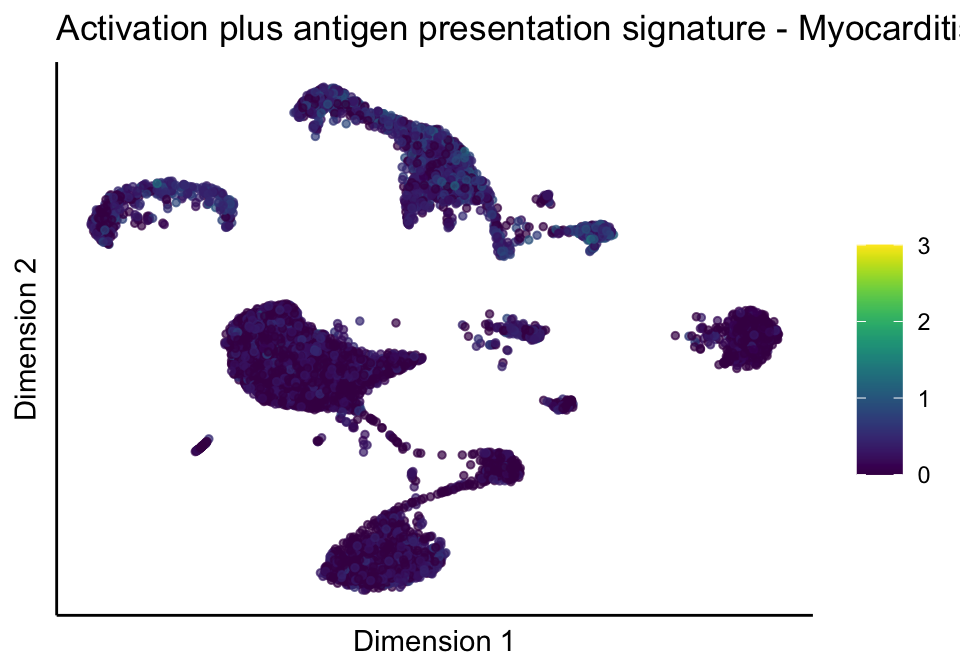
| Version | Author | Date |
|---|---|---|
| 02765dc | mluetge | 2022-07-19 |
cutOff <- 2
pal = viridis(100)
sc <- scale_colour_gradientn(colours = pal, limits=c(0, cutOff))

lapply(unique(signDat$signature), function(sign){
  signGenes <- signDat %>% dplyr::filter(signature == sign)
  sceSub <- sce[which(rownames(sce) %in% signGenes$geneID),]
  cntMat <- rowSums(t(as.matrix(sceSub@assays@data$logcounts)))/nrow(signGenes)
  sceSub$sign <- cntMat
  sceSub$sign[which(sceSub$sign > cutOff)] <- cutOff
  sceSub$sign[which(sceSub$sign < 0)] <- 0
  lapply(treatGrps, function(treat){
    sceSubT <- sceSub[, which(sceSub$cond2 == treat)]
    p <- visGroup_adapt(sceSubT, 'sign', dim_red = 'UMAP') +
    sc +
    guides(colour = guide_colourbar(title = '')) +
    ggtitle(paste0(sign, ' signature - ', treat)) +
    theme_classic() +
    theme(axis.text = element_blank(),
          axis.ticks = element_blank()) +
    labs(x='Dimension 1', y='Dimension 2')
    p
  })
})
[[1]]
[[1]][[1]]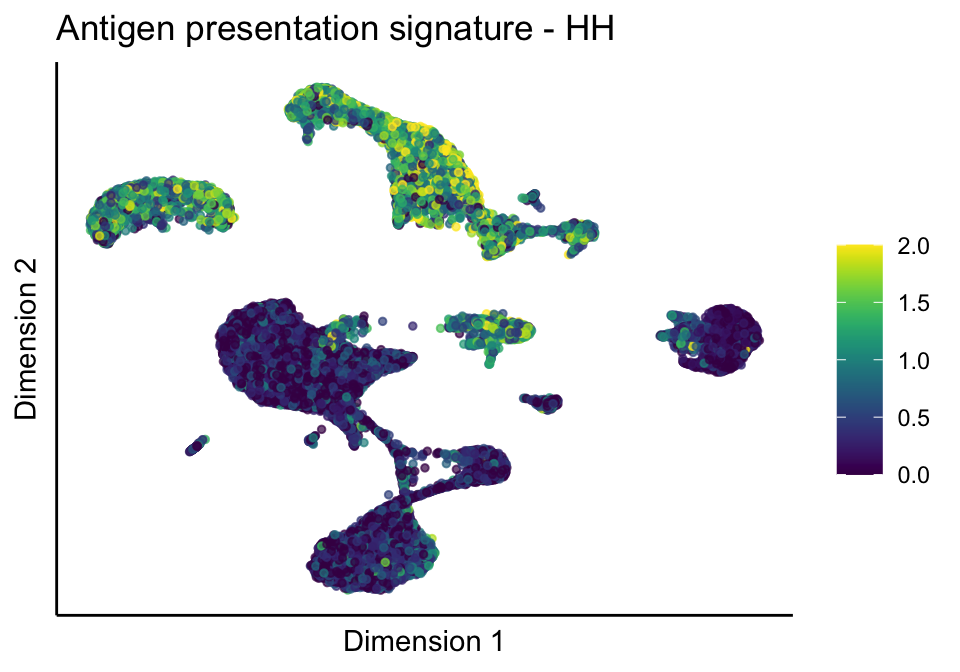
| Version | Author | Date |
|---|---|---|
| 02765dc | mluetge | 2022-07-19 |
[[1]][[2]]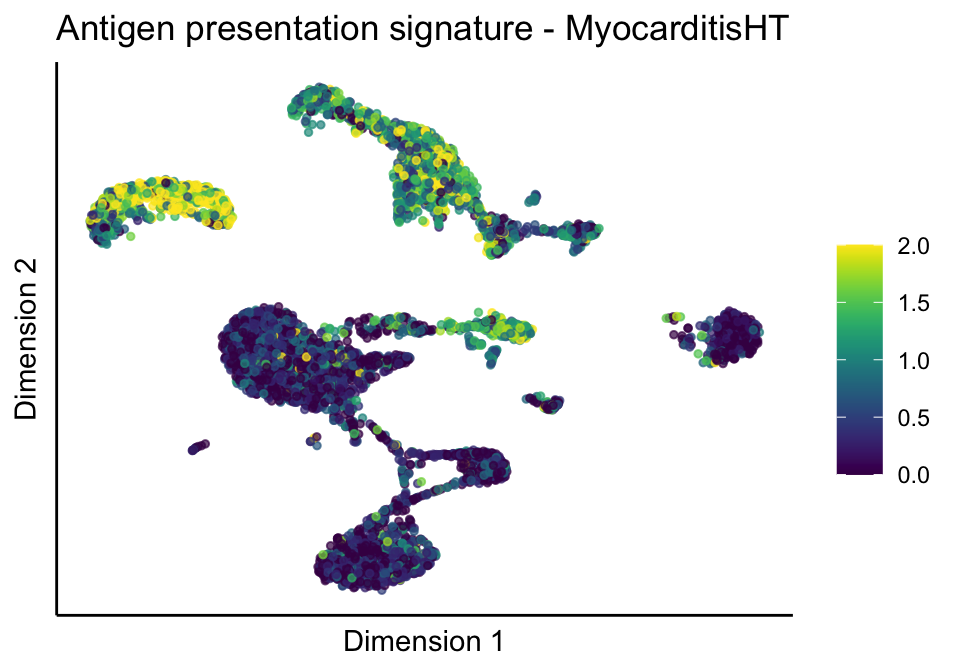
| Version | Author | Date |
|---|---|---|
| 02765dc | mluetge | 2022-07-19 |
[[1]][[3]]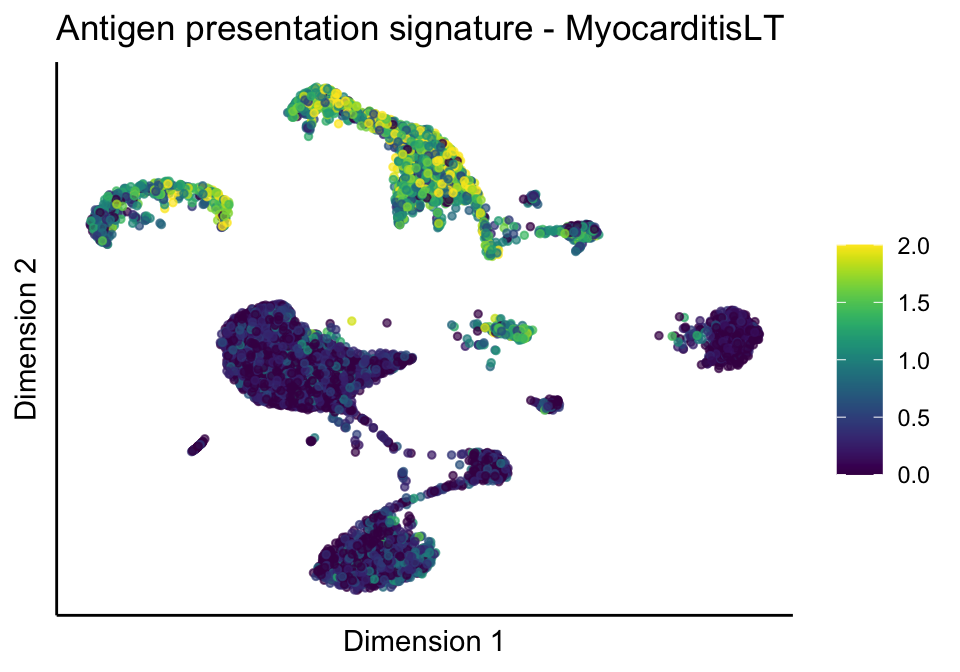
| Version | Author | Date |
|---|---|---|
| 02765dc | mluetge | 2022-07-19 |
[[2]]
[[2]][[1]]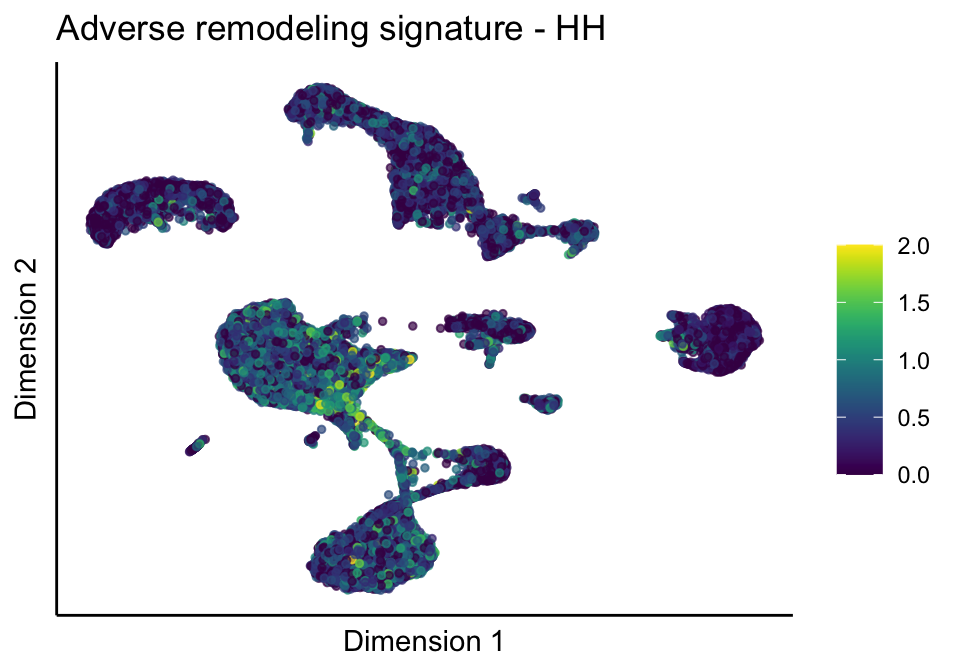
| Version | Author | Date |
|---|---|---|
| 02765dc | mluetge | 2022-07-19 |
[[2]][[2]]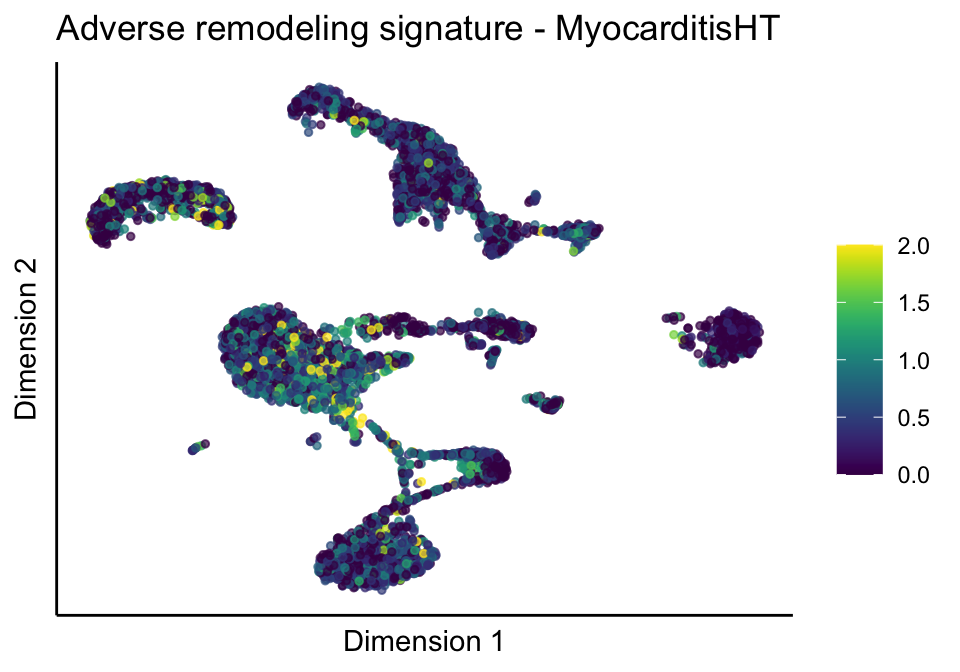
| Version | Author | Date |
|---|---|---|
| 02765dc | mluetge | 2022-07-19 |
[[2]][[3]]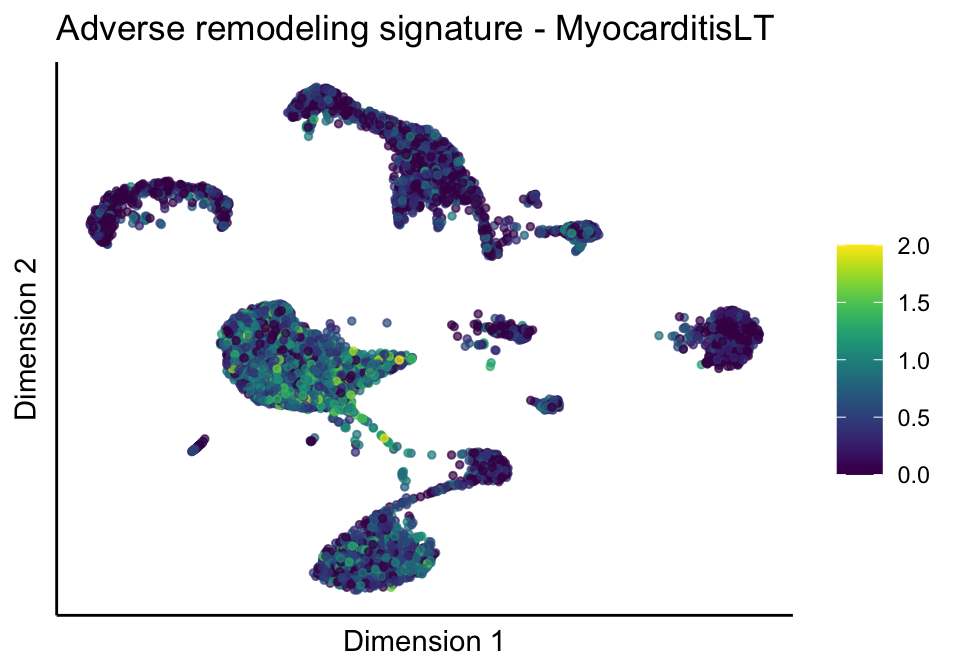
| Version | Author | Date |
|---|---|---|
| 02765dc | mluetge | 2022-07-19 |
[[3]]
[[3]][[1]]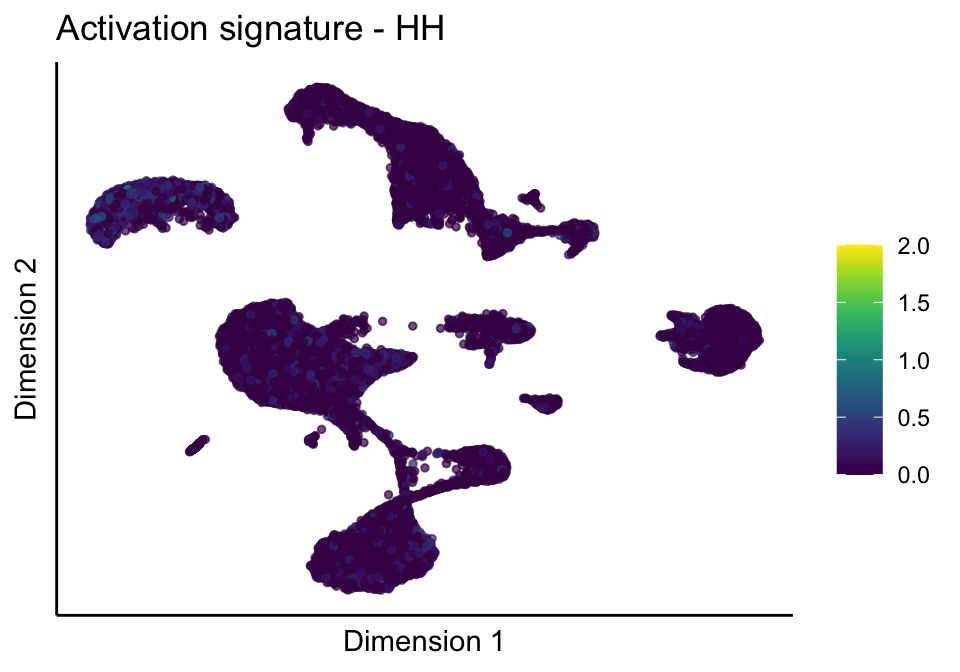
| Version | Author | Date |
|---|---|---|
| 02765dc | mluetge | 2022-07-19 |
[[3]][[2]]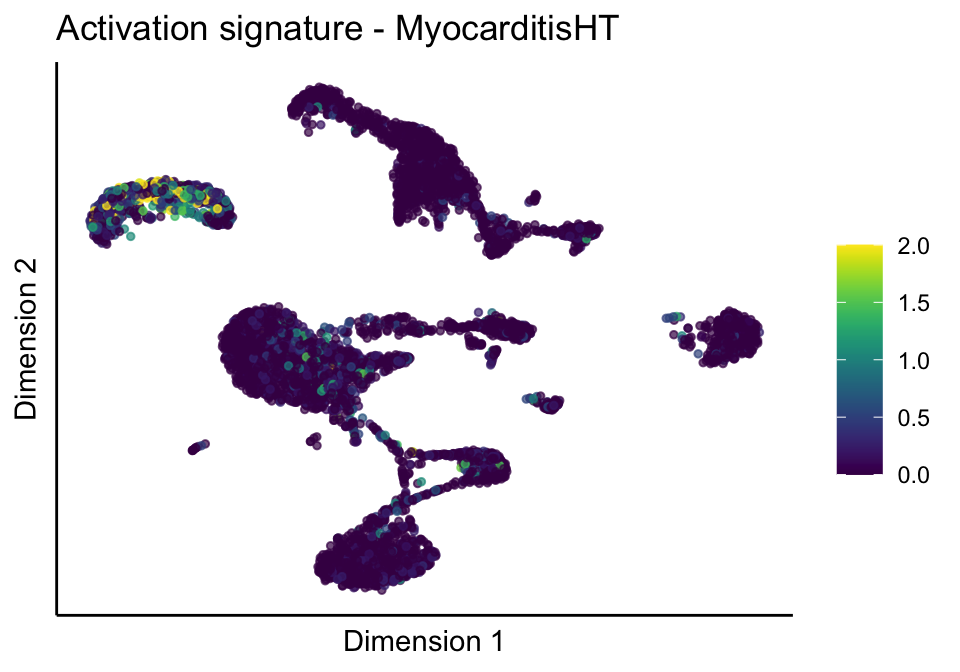
| Version | Author | Date |
|---|---|---|
| 02765dc | mluetge | 2022-07-19 |
[[3]][[3]]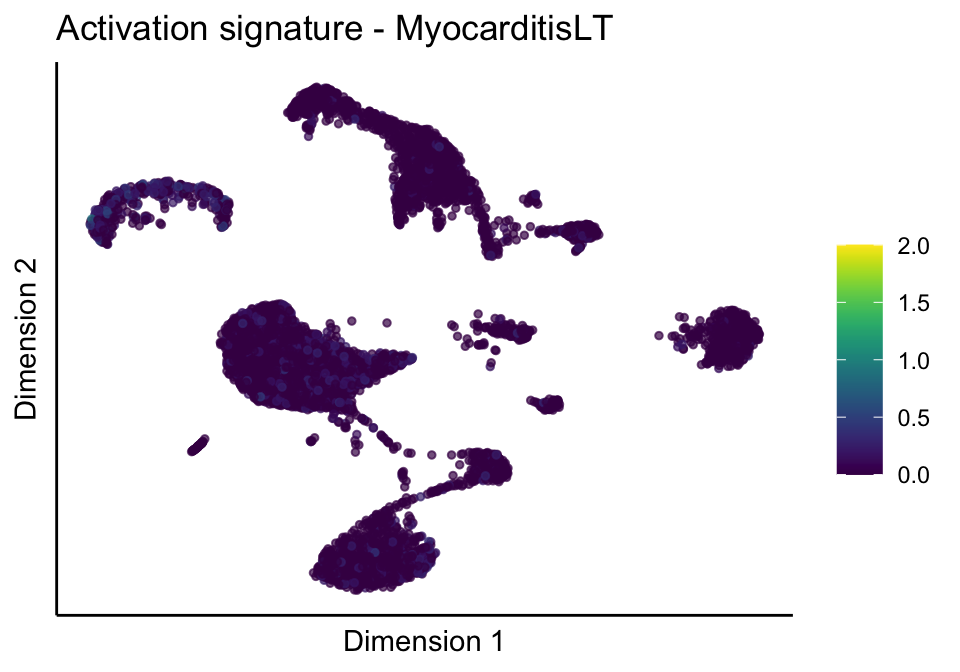
| Version | Author | Date |
|---|---|---|
| 02765dc | mluetge | 2022-07-19 |
[[4]]
[[4]][[1]]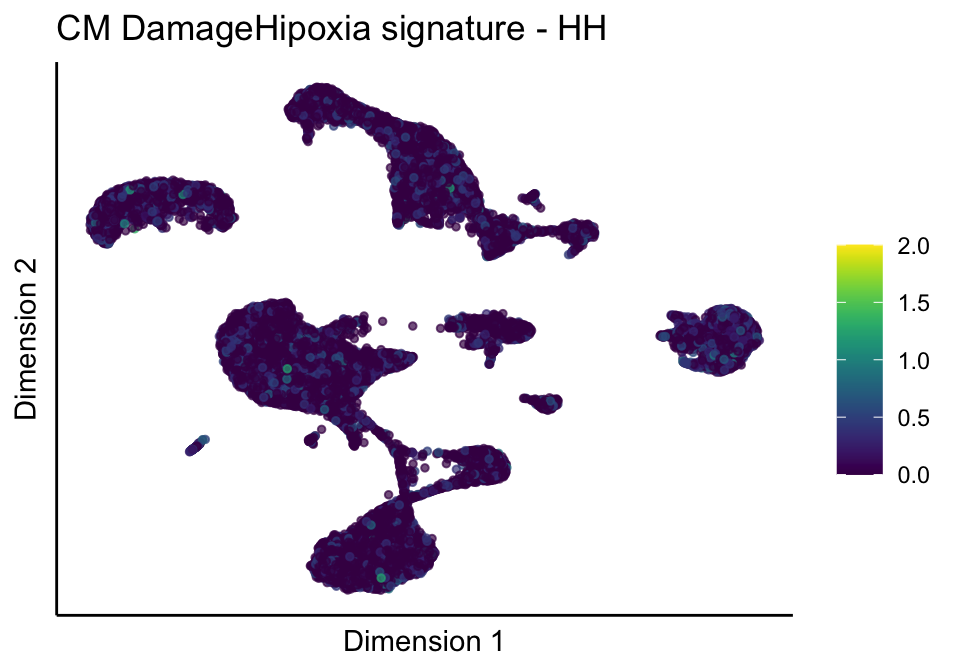
| Version | Author | Date |
|---|---|---|
| 02765dc | mluetge | 2022-07-19 |
[[4]][[2]]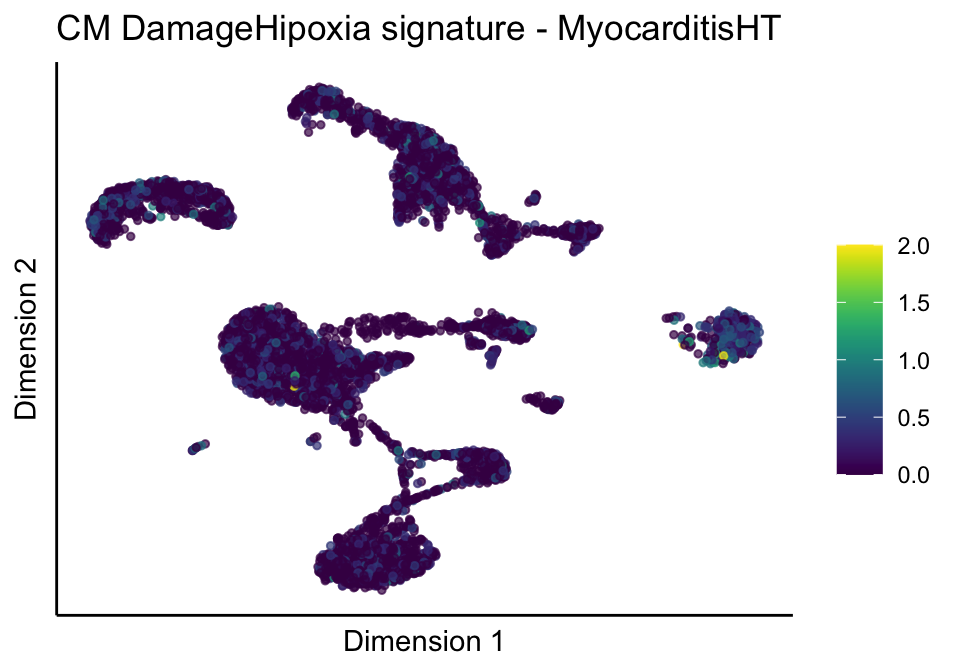
| Version | Author | Date |
|---|---|---|
| 02765dc | mluetge | 2022-07-19 |
[[4]][[3]]
| Version | Author | Date |
|---|---|---|
| 02765dc | mluetge | 2022-07-19 |
[[5]]
[[5]][[1]]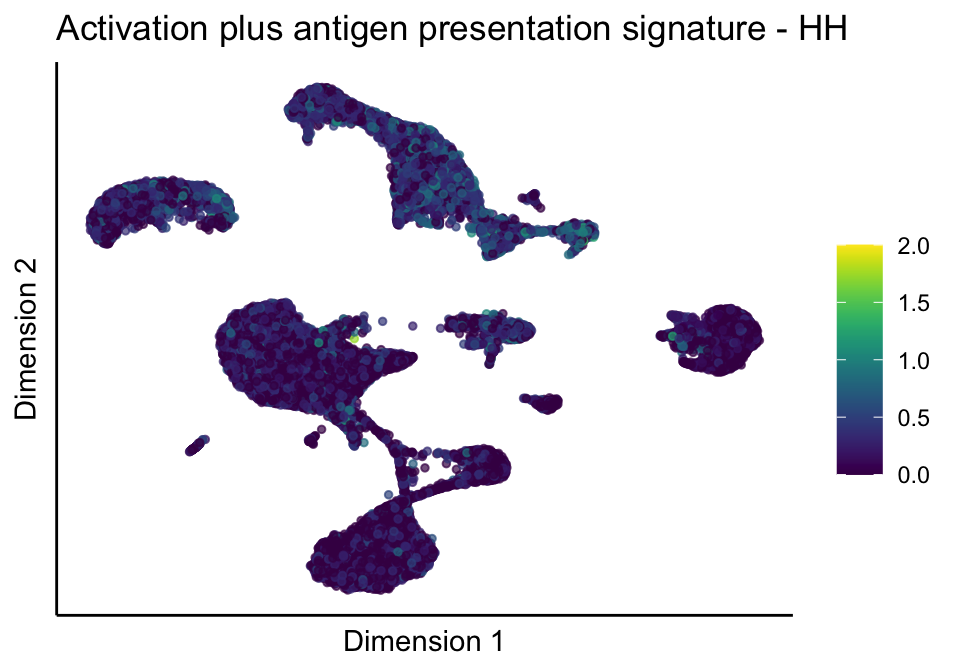
[[5]][[2]]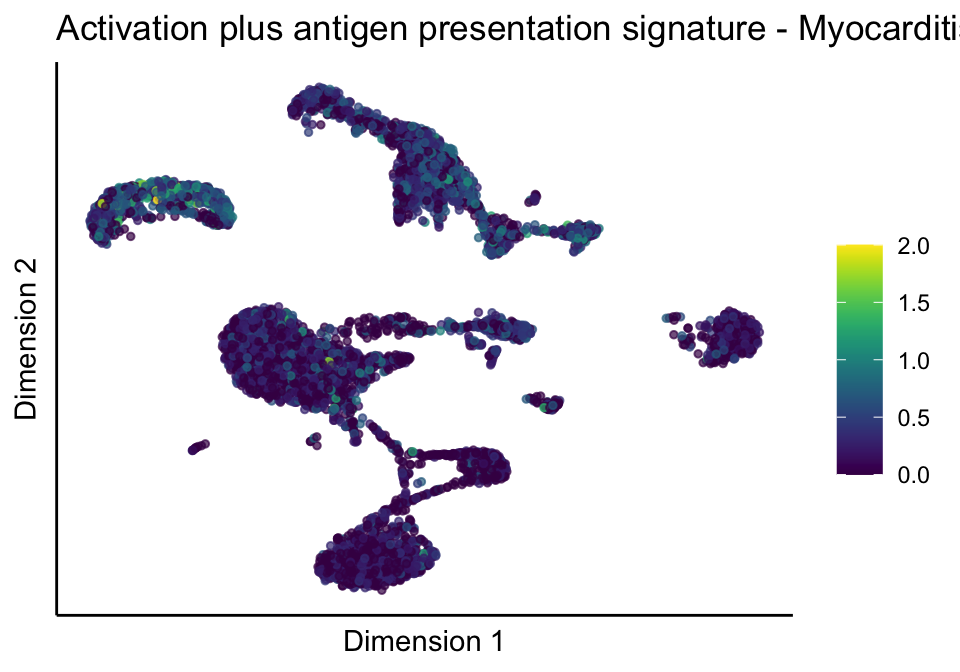
[[5]][[3]]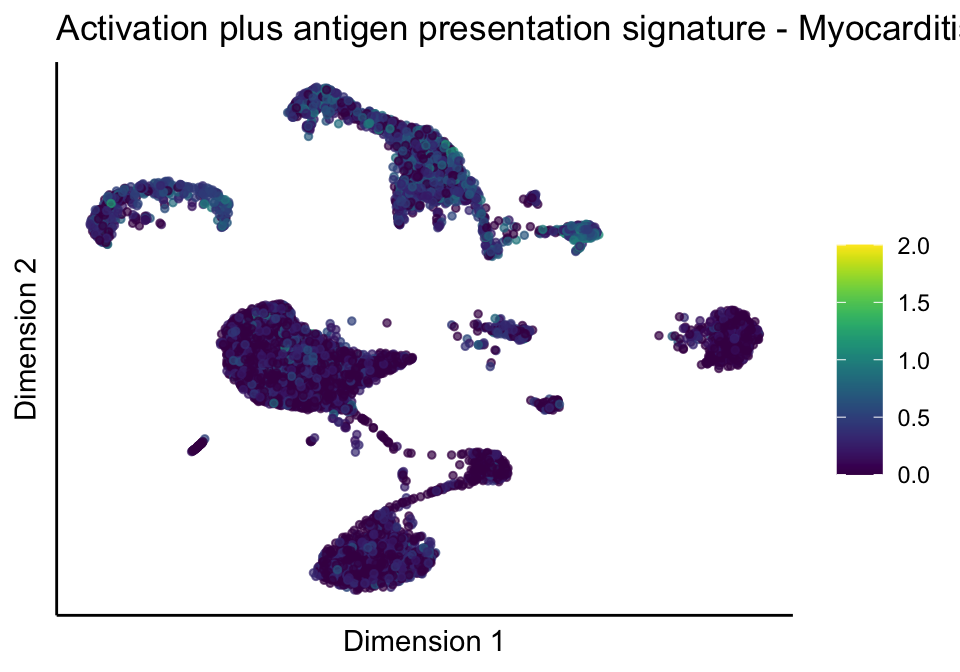
cutOff <- 1.5
pal = viridis(100)
sc <- scale_colour_gradientn(colours = pal, limits=c(0, cutOff))

lapply(unique(signDat$signature), function(sign){
  signGenes <- signDat %>% dplyr::filter(signature == sign)
  sceSub <- sce[which(rownames(sce) %in% signGenes$geneID),]
  cntMat <- rowSums(t(as.matrix(sceSub@assays@data$logcounts)))/nrow(signGenes)
  sceSub$sign <- cntMat
  sceSub$sign[which(sceSub$sign > cutOff)] <- cutOff
  sceSub$sign[which(sceSub$sign < 0)] <- 0
  lapply(treatGrps, function(treat){
    sceSubT <- sceSub[, which(sceSub$cond2 == treat)]
    p <- visGroup_adapt(sceSubT, 'sign', dim_red = 'UMAP') +
    sc +
    guides(colour = guide_colourbar(title = '')) +
    ggtitle(paste0(sign, ' signature - ', treat)) +
    theme_classic() +
    theme(axis.text = element_blank(),
          axis.ticks = element_blank()) +
    labs(x='Dimension 1', y='Dimension 2')
    p
  })
})
[[1]]
[[1]][[1]]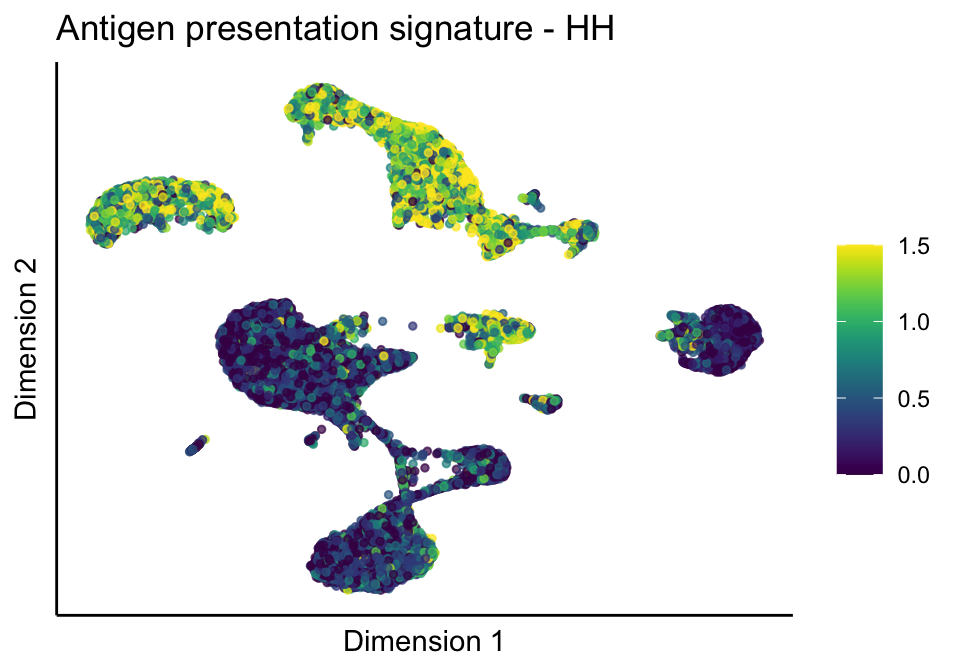
[[1]][[2]]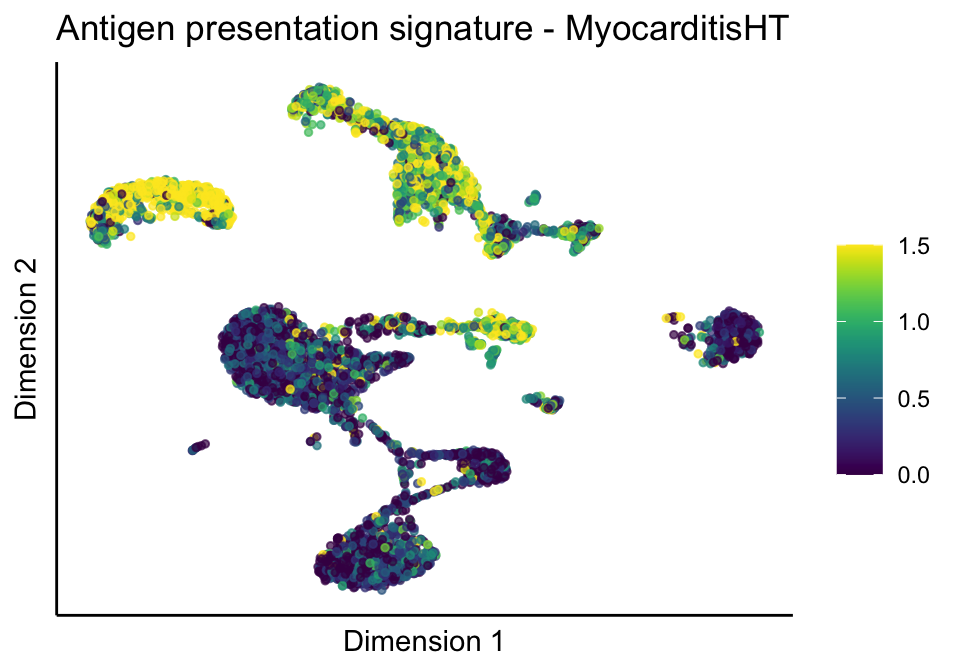
[[1]][[3]]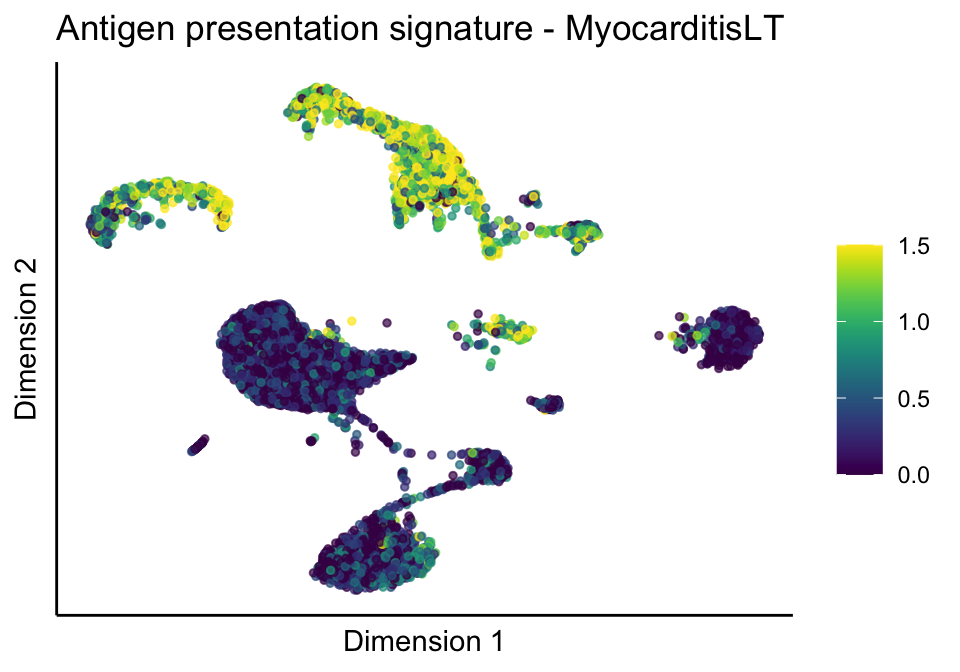
[[2]]
[[2]][[1]]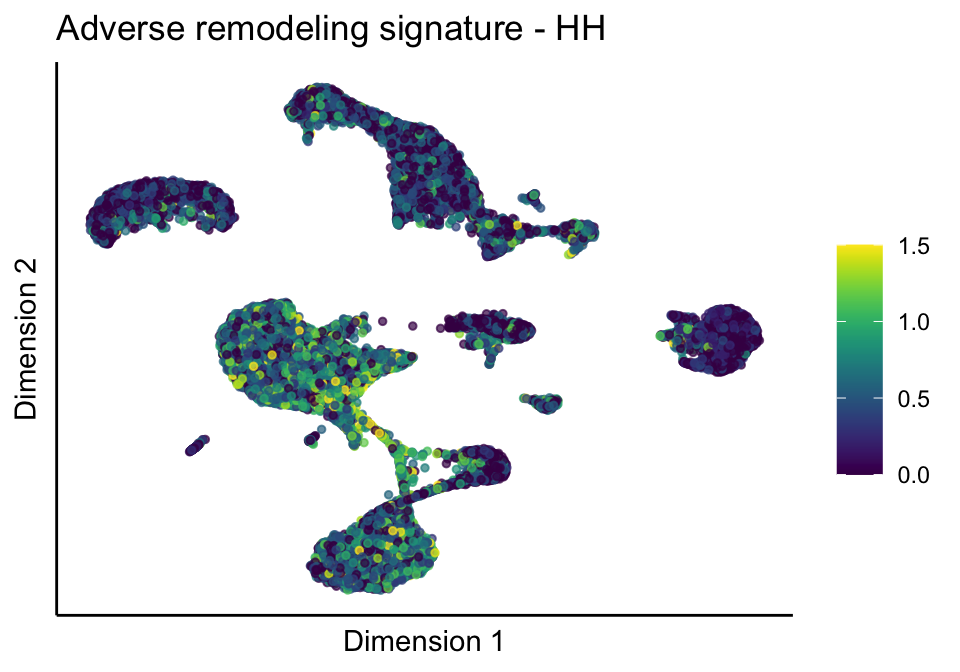
[[2]][[2]]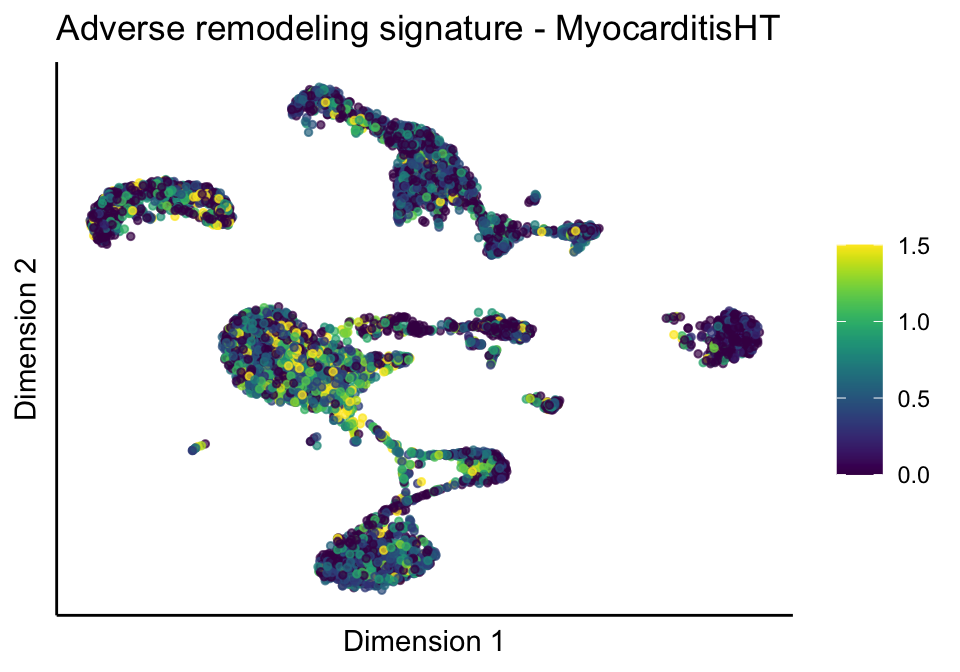
[[2]][[3]]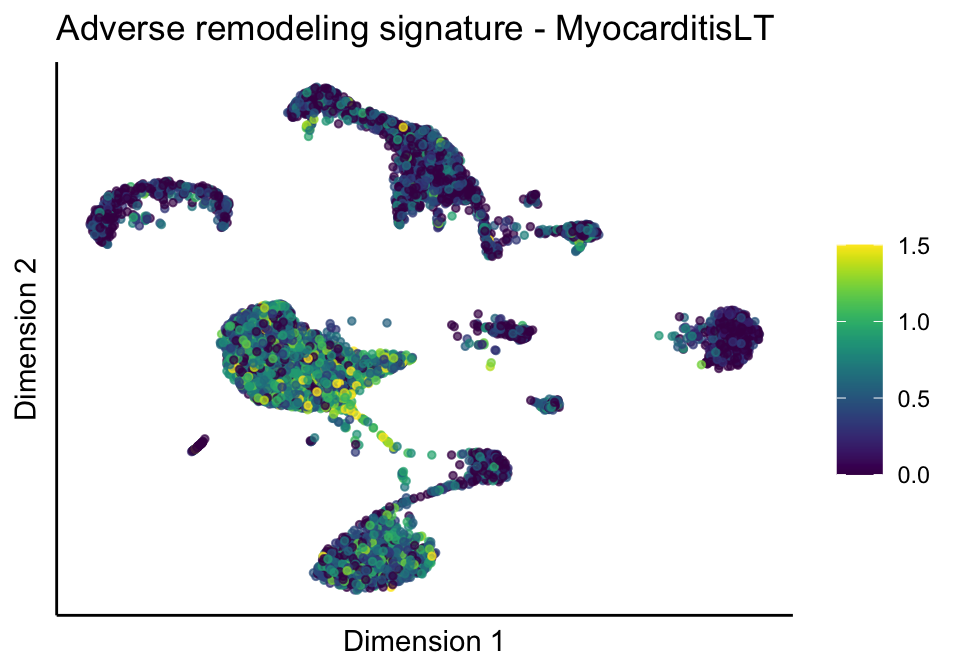
[[3]]
[[3]][[1]]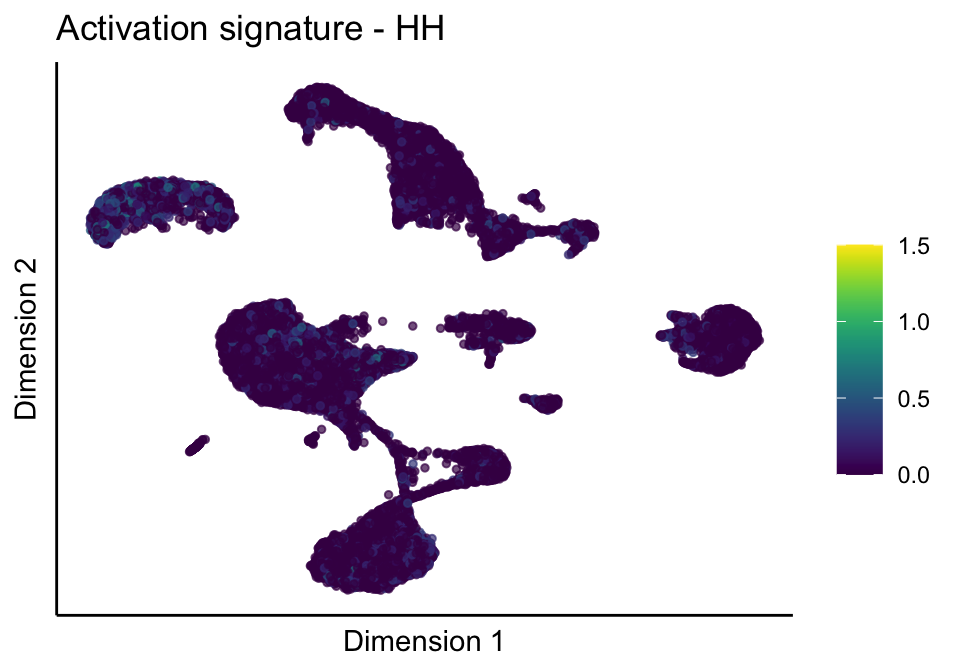
[[3]][[2]]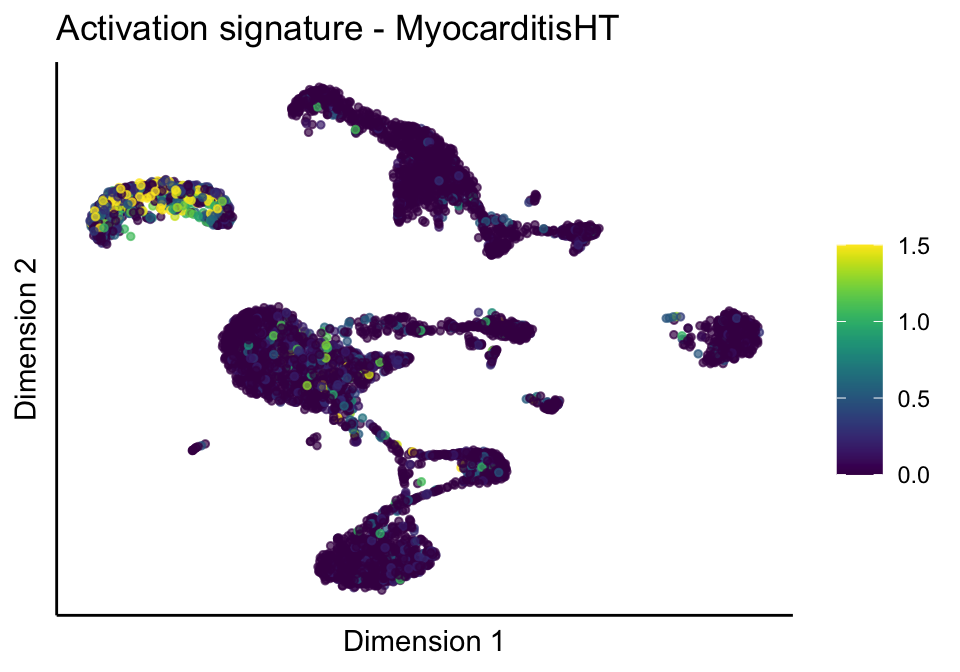
[[3]][[3]]
[[4]]
[[4]][[1]]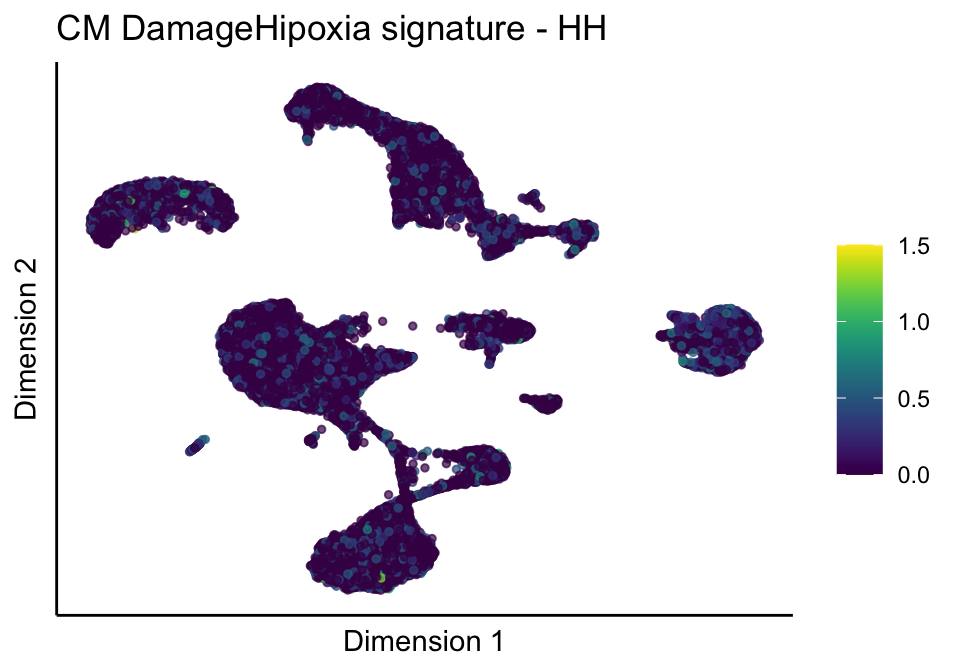
[[4]][[2]]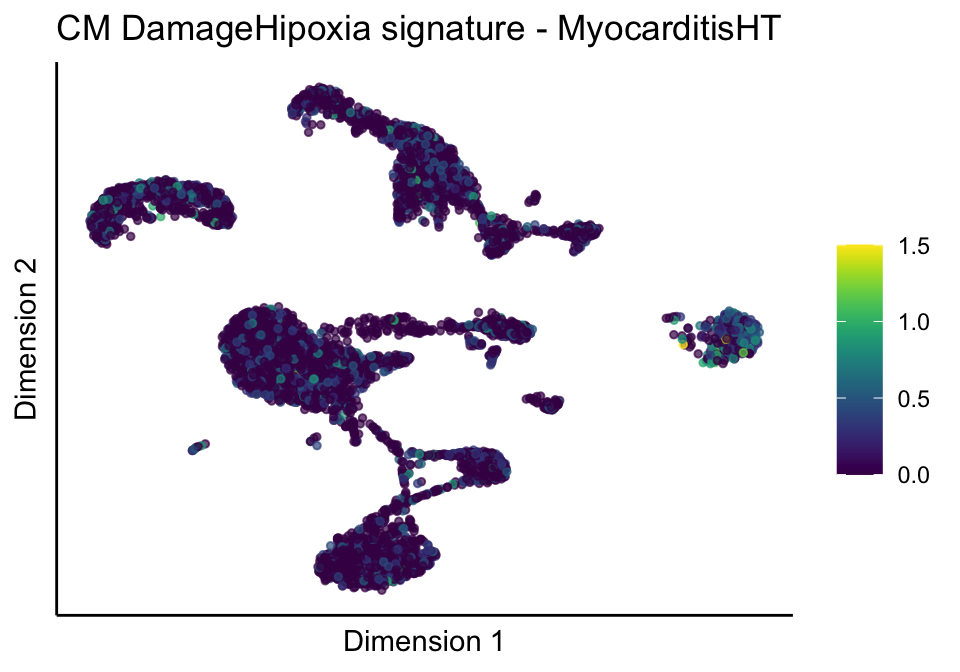
[[4]][[3]]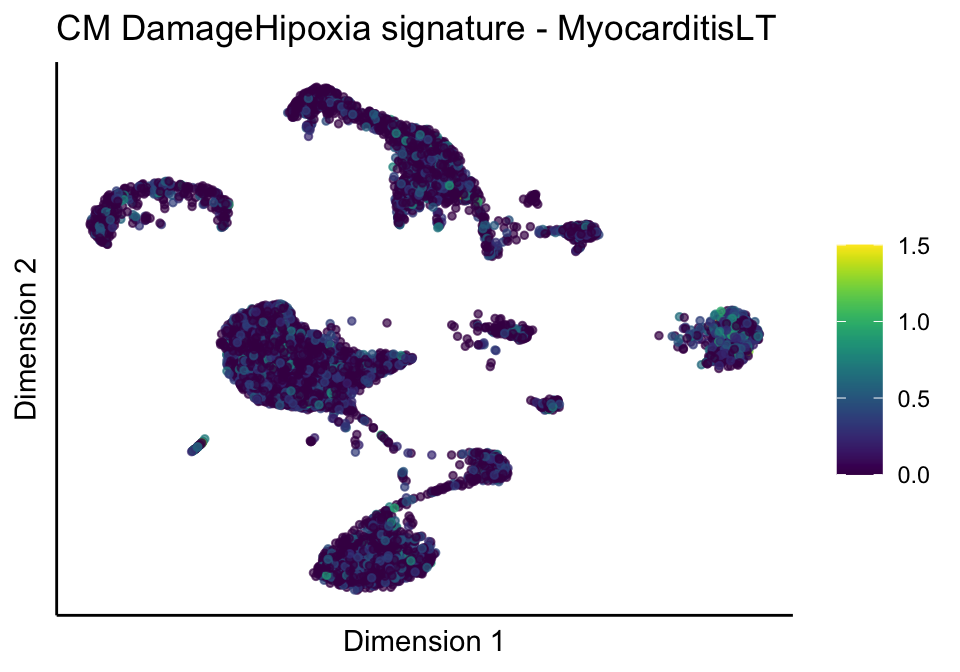
[[5]]
[[5]][[1]]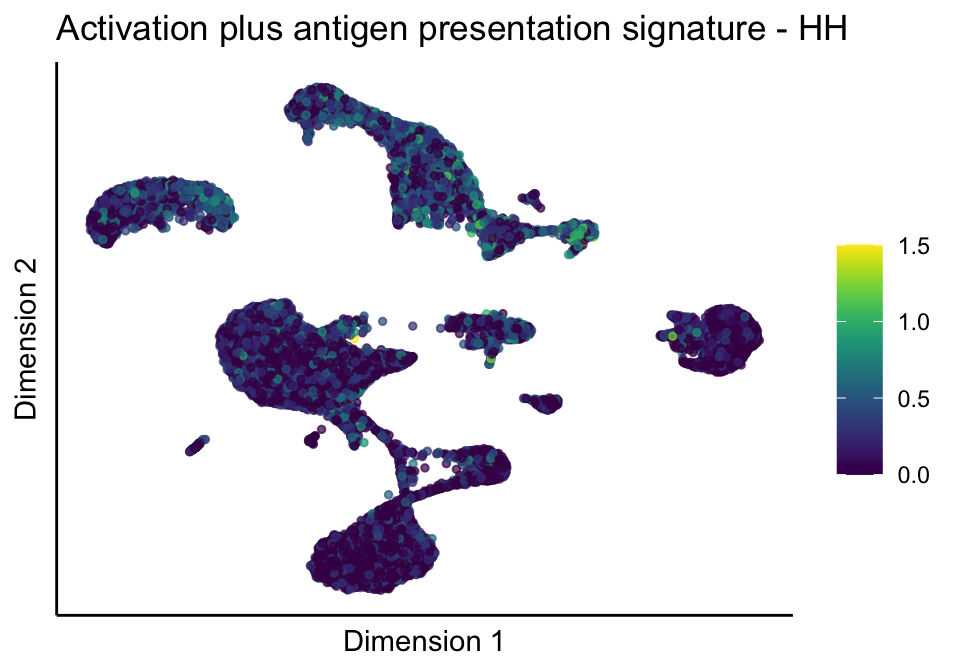
[[5]][[2]]
[[5]][[3]]
signatures red blue
split by grp
cutOff <- 3
pal = colorRampPalette(c("#053061", "#f7f7f7","#85122d"))(100)
sc <- scale_colour_gradientn(colours = pal, limits=c(0, cutOff))

lapply(unique(signDat$signature), function(sign){
  signGenes <- signDat %>% dplyr::filter(signature == sign)
  sceSub <- sce[which(rownames(sce) %in% signGenes$geneID),]
  cntMat <- rowSums(t(as.matrix(sceSub@assays@data$logcounts)))/nrow(signGenes)
  sceSub$sign <- cntMat
  sceSub$sign[which(sceSub$sign > cutOff)] <- cutOff
  sceSub$sign[which(sceSub$sign < 0)] <- 0
  lapply(treatGrps, function(treat){
    sceSubT <- sceSub[, which(sceSub$cond2 == treat)]
    p <- visGroup_adapt(sceSubT, 'sign', dim_red = 'UMAP') +
    sc +
    guides(colour = guide_colourbar(title = '')) +
    ggtitle(paste0(sign, ' signature - ', treat)) +
    theme_classic() +
    theme(axis.text = element_blank(),
          axis.ticks = element_blank()) +
    labs(x='Dimension 1', y='Dimension 2')
    p
  })
})
[[1]]
[[1]][[1]]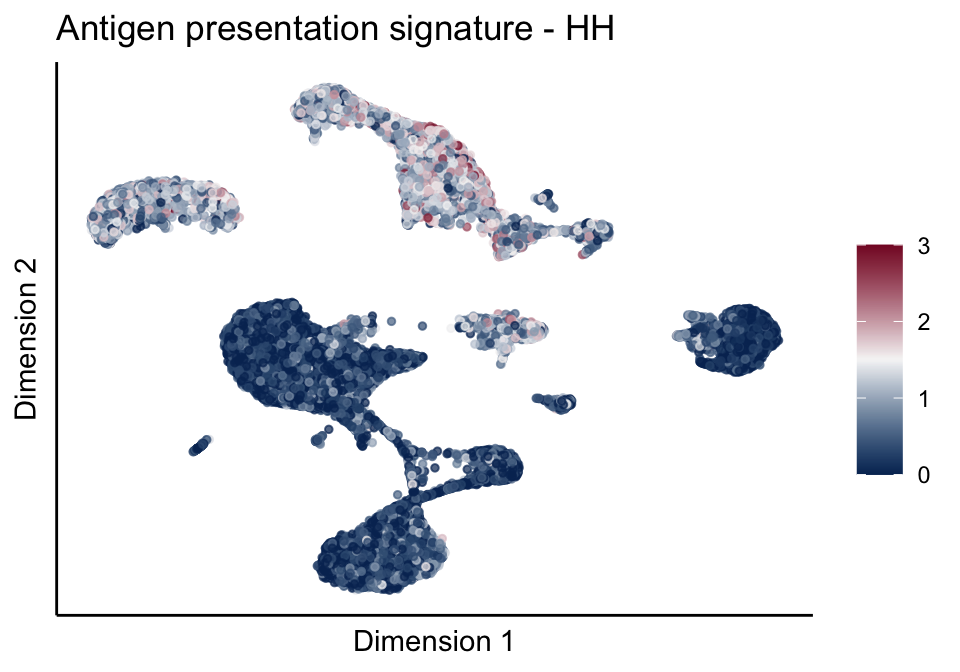
| Version | Author | Date |
|---|---|---|
| 02765dc | mluetge | 2022-07-19 |
[[1]][[2]]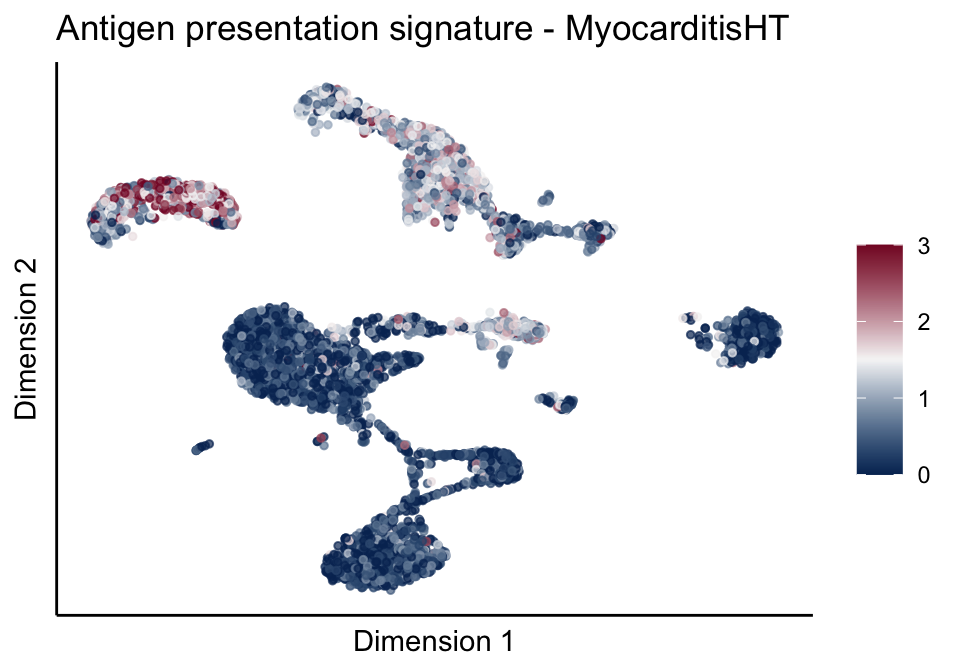
| Version | Author | Date |
|---|---|---|
| 02765dc | mluetge | 2022-07-19 |
[[1]][[3]]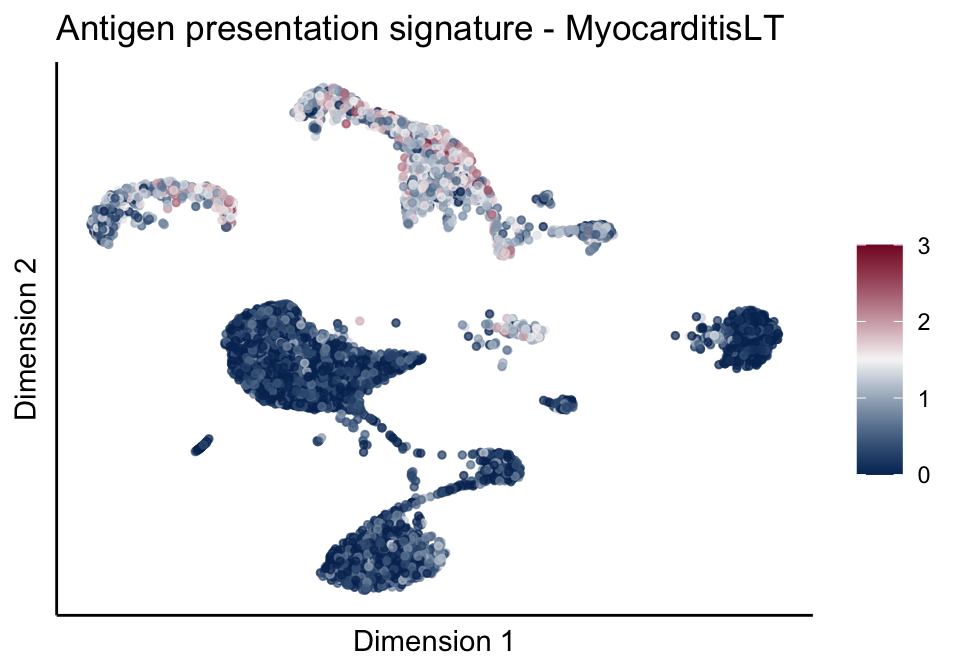
| Version | Author | Date |
|---|---|---|
| 02765dc | mluetge | 2022-07-19 |
[[2]]
[[2]][[1]]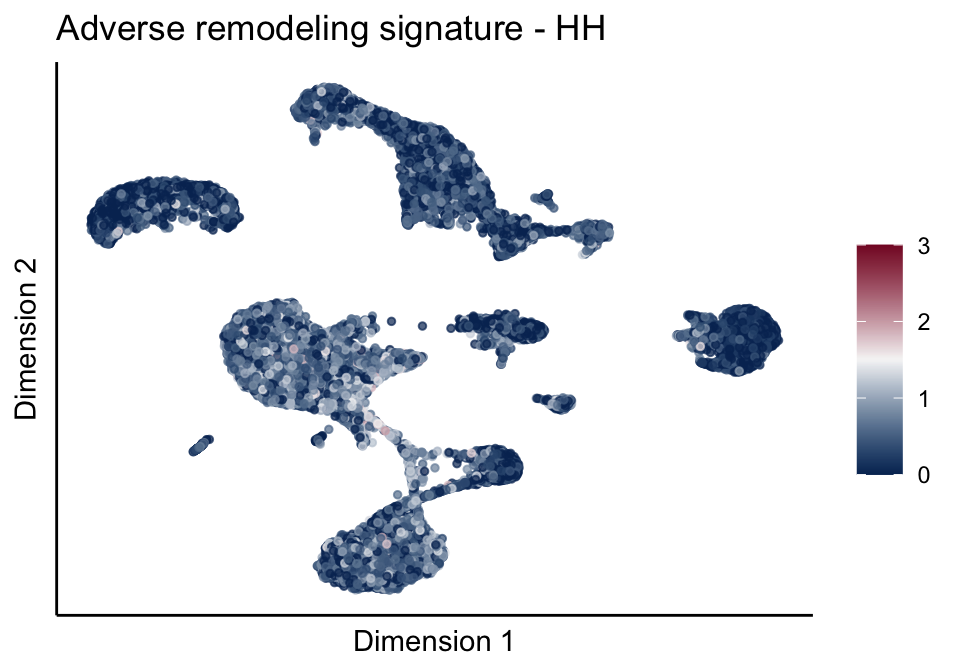
| Version | Author | Date |
|---|---|---|
| 02765dc | mluetge | 2022-07-19 |
[[2]][[2]]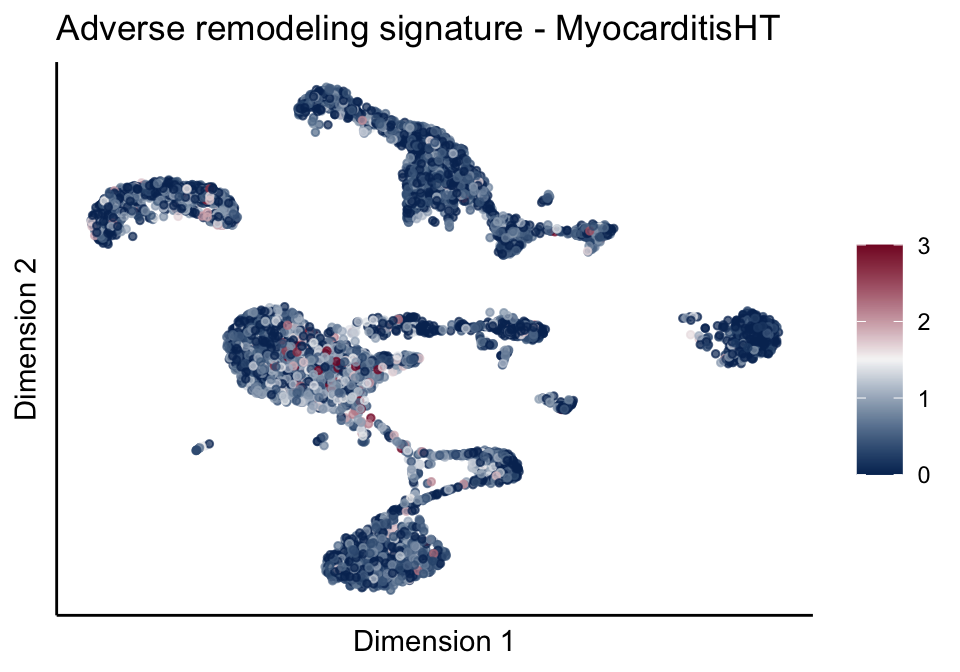
| Version | Author | Date |
|---|---|---|
| 02765dc | mluetge | 2022-07-19 |
[[2]][[3]]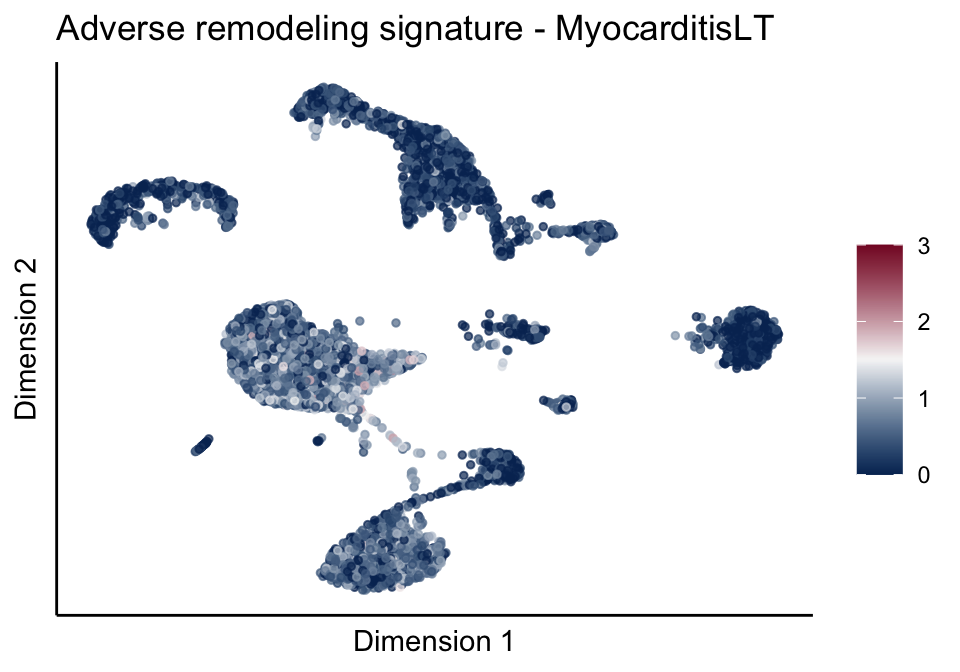
| Version | Author | Date |
|---|---|---|
| 02765dc | mluetge | 2022-07-19 |
[[3]]
[[3]][[1]]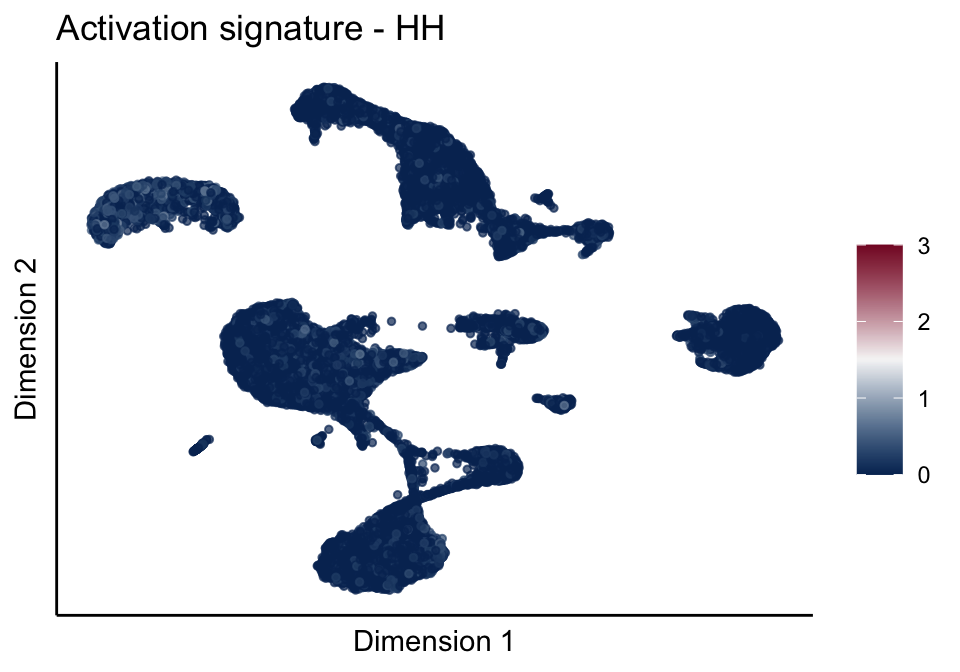
| Version | Author | Date |
|---|---|---|
| 02765dc | mluetge | 2022-07-19 |
[[3]][[2]]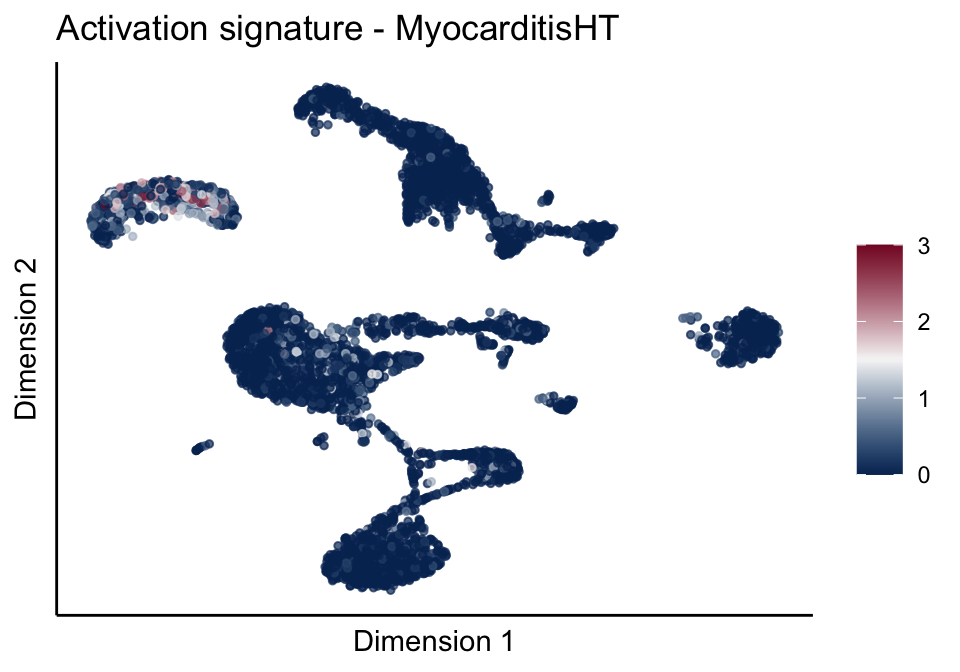
| Version | Author | Date |
|---|---|---|
| 02765dc | mluetge | 2022-07-19 |
[[3]][[3]]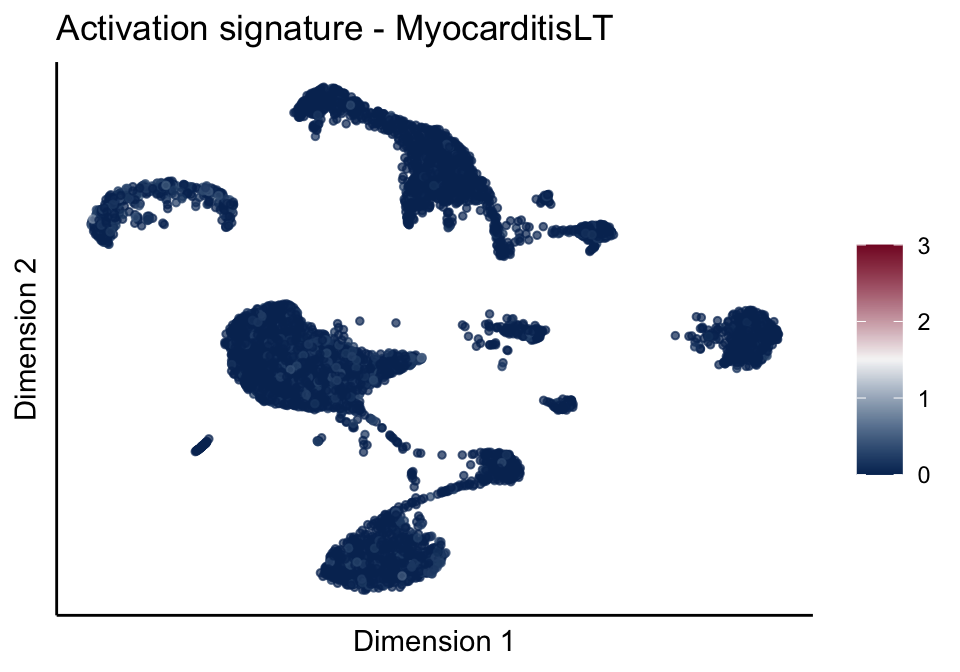
| Version | Author | Date |
|---|---|---|
| 02765dc | mluetge | 2022-07-19 |
[[4]]
[[4]][[1]]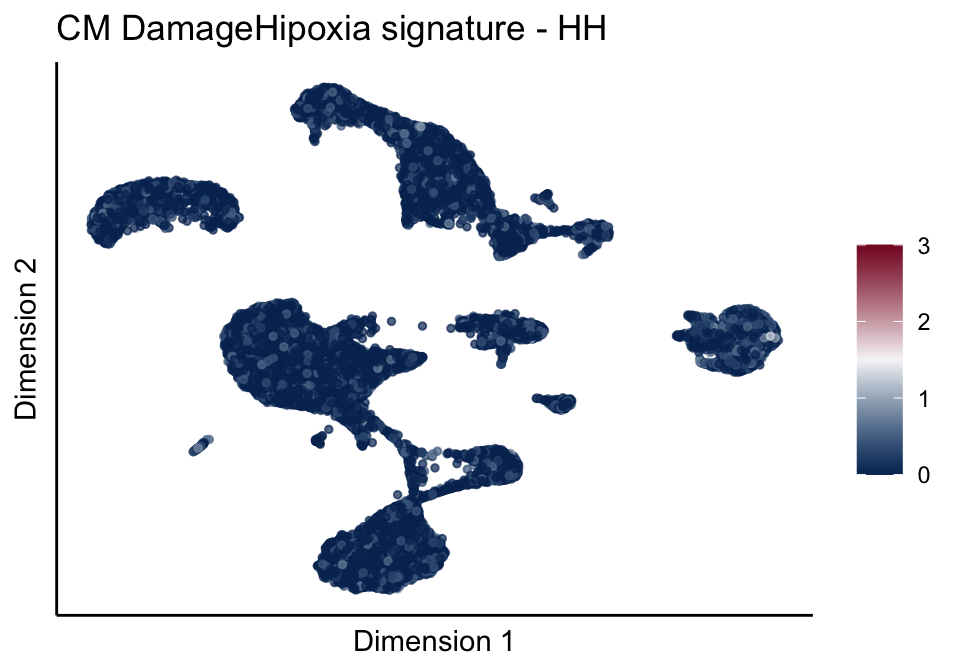
| Version | Author | Date |
|---|---|---|
| 02765dc | mluetge | 2022-07-19 |
[[4]][[2]]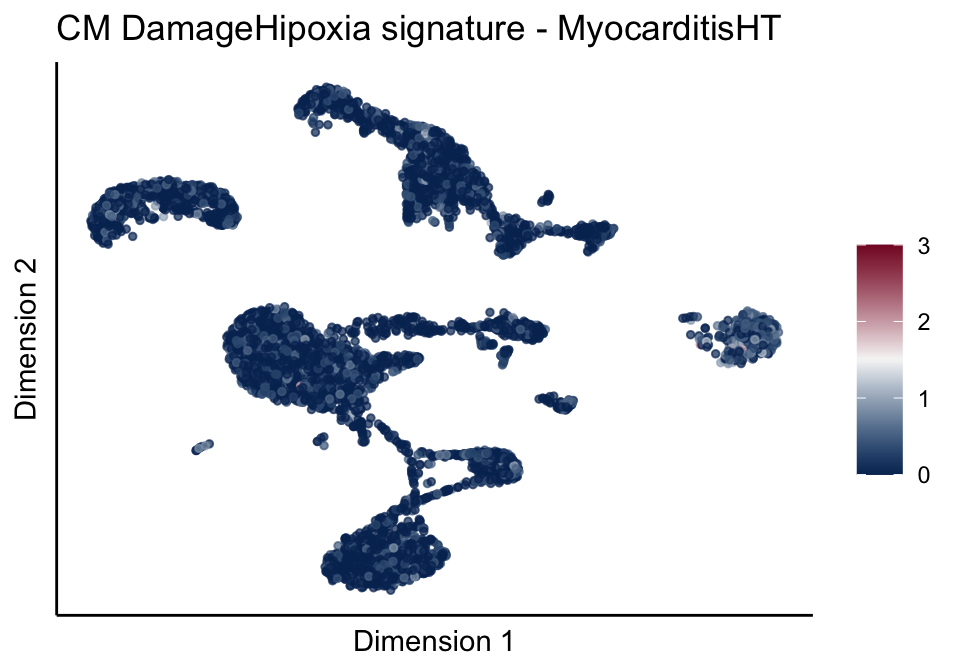
| Version | Author | Date |
|---|---|---|
| 02765dc | mluetge | 2022-07-19 |
[[4]][[3]]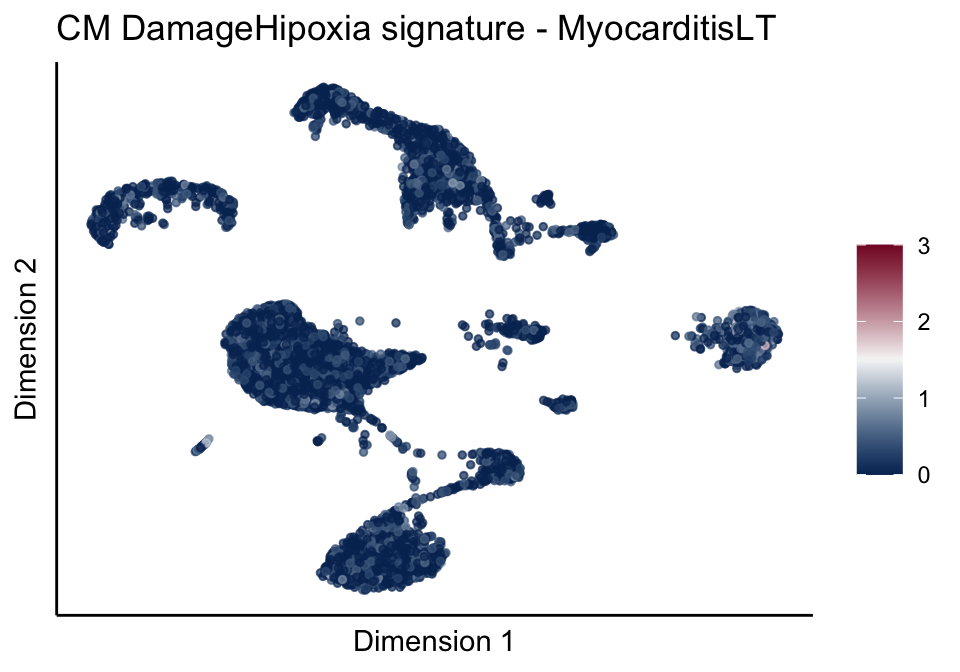
| Version | Author | Date |
|---|---|---|
| 02765dc | mluetge | 2022-07-19 |
[[5]]
[[5]][[1]]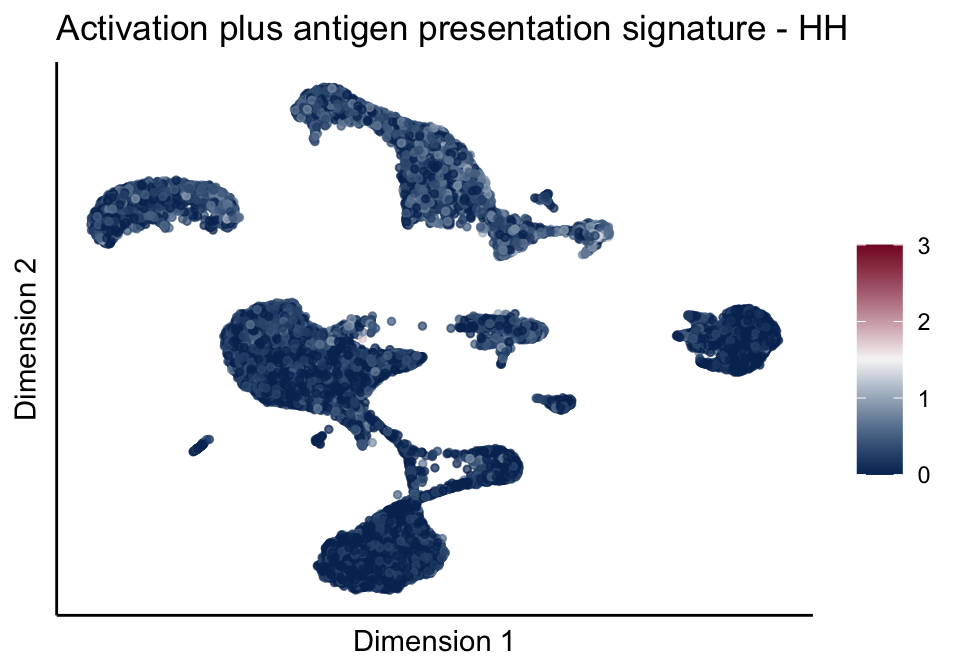
| Version | Author | Date |
|---|---|---|
| 02765dc | mluetge | 2022-07-19 |
[[5]][[2]]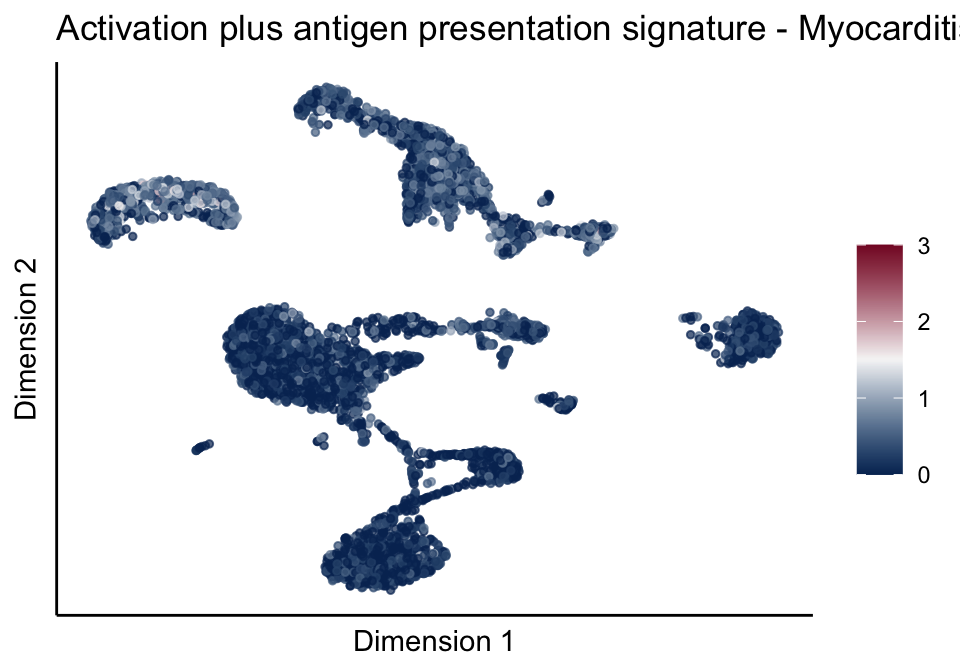
| Version | Author | Date |
|---|---|---|
| 02765dc | mluetge | 2022-07-19 |
[[5]][[3]]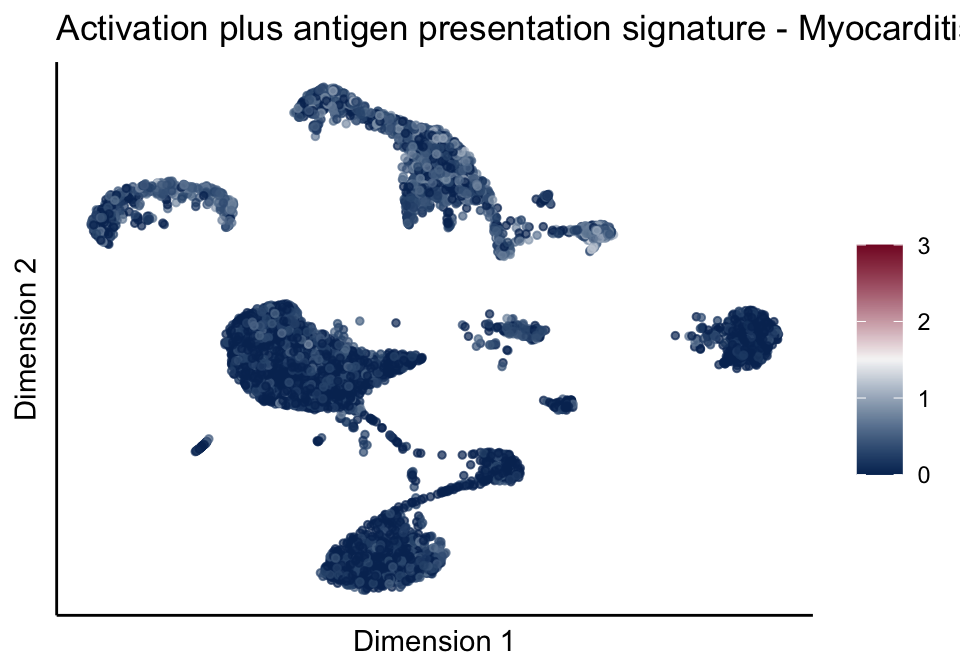
| Version | Author | Date |
|---|---|---|
| 02765dc | mluetge | 2022-07-19 |
cutOff <- 2
pal = colorRampPalette(c("#053061", "#f7f7f7","#85122d"))(100)
sc <- scale_colour_gradientn(colours = pal, limits=c(0, cutOff))

lapply(unique(signDat$signature), function(sign){
  signGenes <- signDat %>% dplyr::filter(signature == sign)
  sceSub <- sce[which(rownames(sce) %in% signGenes$geneID),]
  cntMat <- rowSums(t(as.matrix(sceSub@assays@data$logcounts)))/nrow(signGenes)
  sceSub$sign <- cntMat
  sceSub$sign[which(sceSub$sign > cutOff)] <- cutOff
  sceSub$sign[which(sceSub$sign < 0)] <- 0
  lapply(treatGrps, function(treat){
    sceSubT <- sceSub[, which(sceSub$cond2 == treat)]
    p <- visGroup_adapt(sceSubT, 'sign', dim_red = 'UMAP') +
    sc +
    guides(colour = guide_colourbar(title = '')) +
    ggtitle(paste0(sign, ' signature - ', treat)) +
    theme_classic() +
    theme(axis.text = element_blank(),
          axis.ticks = element_blank()) +
    labs(x='Dimension 1', y='Dimension 2')
    p
  })
})
[[1]]
[[1]][[1]]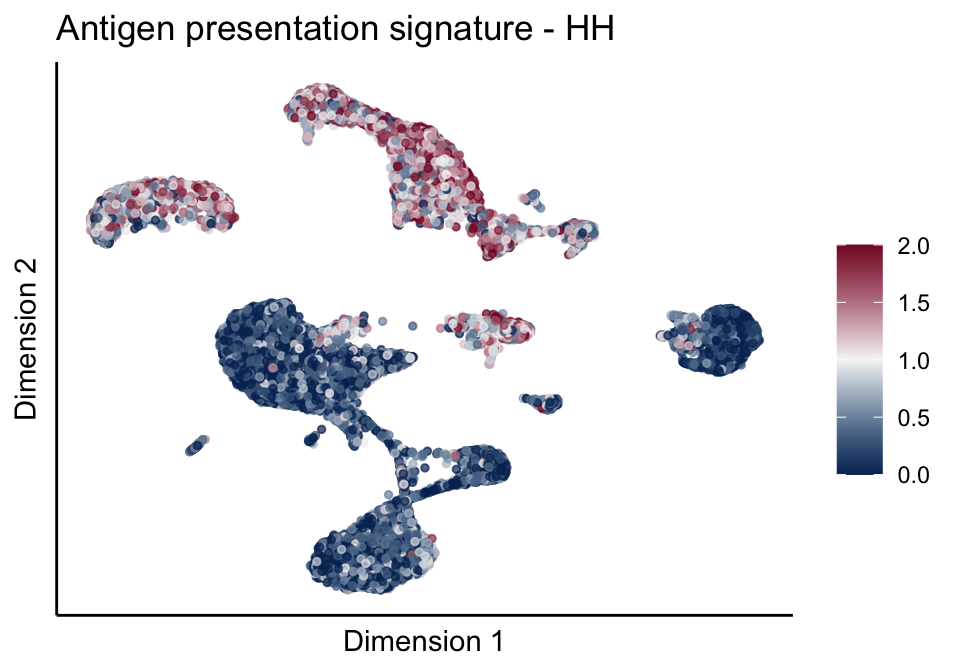
| Version | Author | Date |
|---|---|---|
| 02765dc | mluetge | 2022-07-19 |
[[1]][[2]]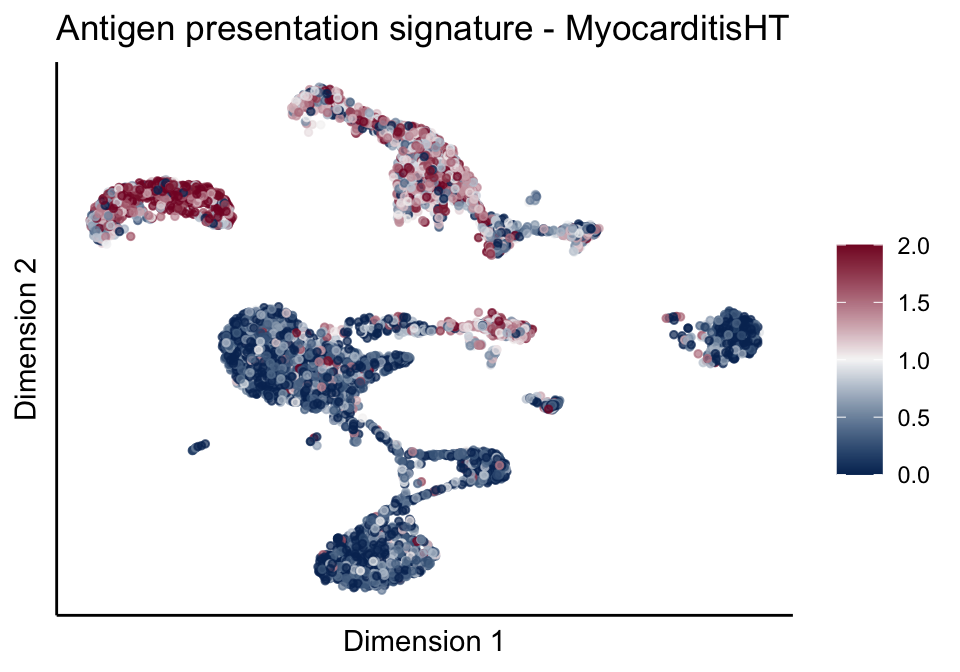
| Version | Author | Date |
|---|---|---|
| 02765dc | mluetge | 2022-07-19 |
[[1]][[3]]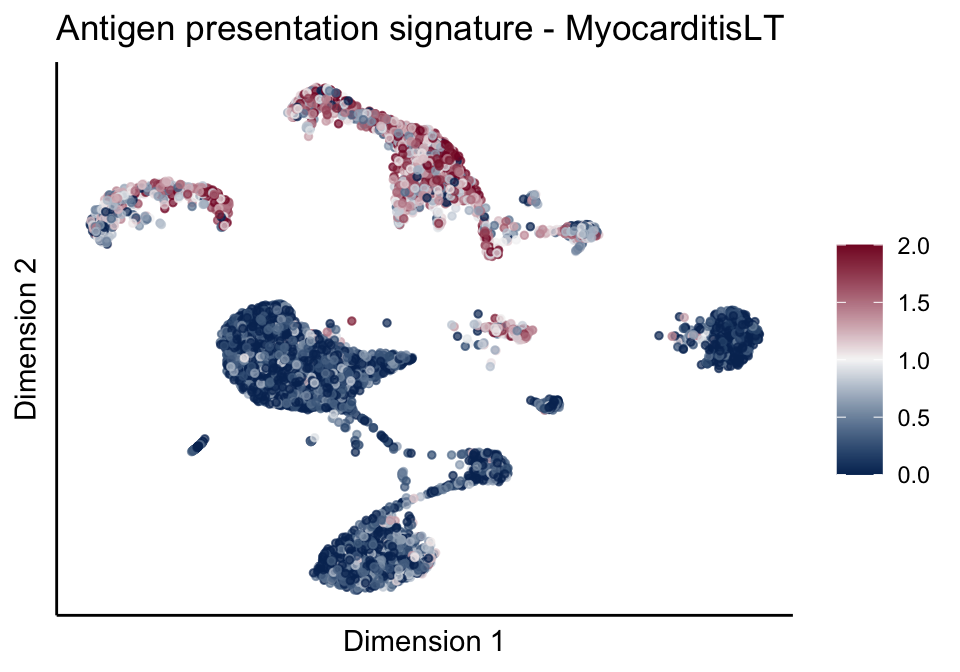
| Version | Author | Date |
|---|---|---|
| 02765dc | mluetge | 2022-07-19 |
[[2]]
[[2]][[1]]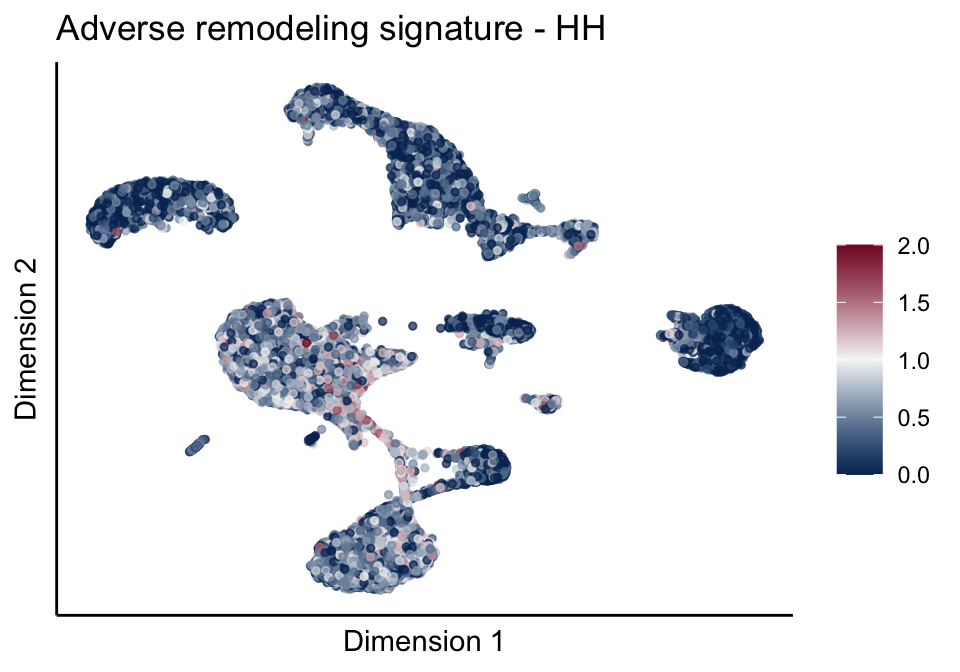
| Version | Author | Date |
|---|---|---|
| 02765dc | mluetge | 2022-07-19 |
[[2]][[2]]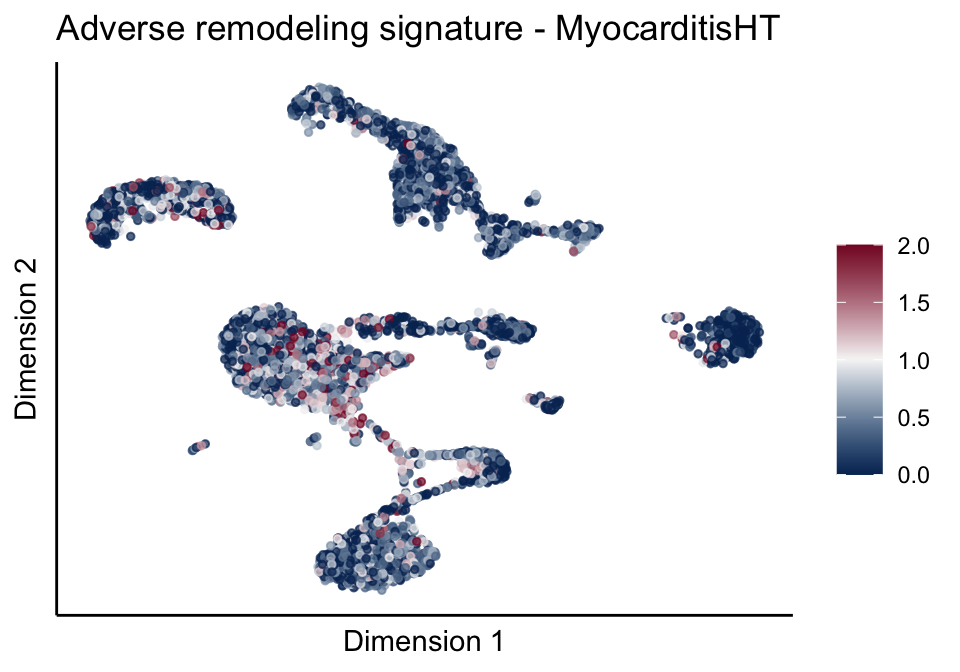
| Version | Author | Date |
|---|---|---|
| 02765dc | mluetge | 2022-07-19 |
[[2]][[3]]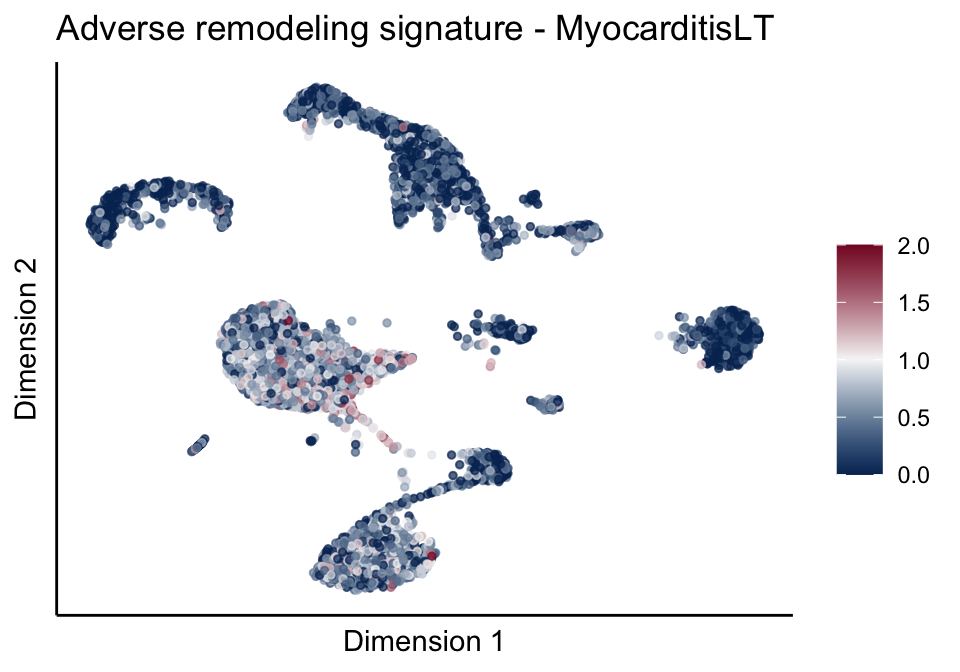
| Version | Author | Date |
|---|---|---|
| 02765dc | mluetge | 2022-07-19 |
[[3]]
[[3]][[1]]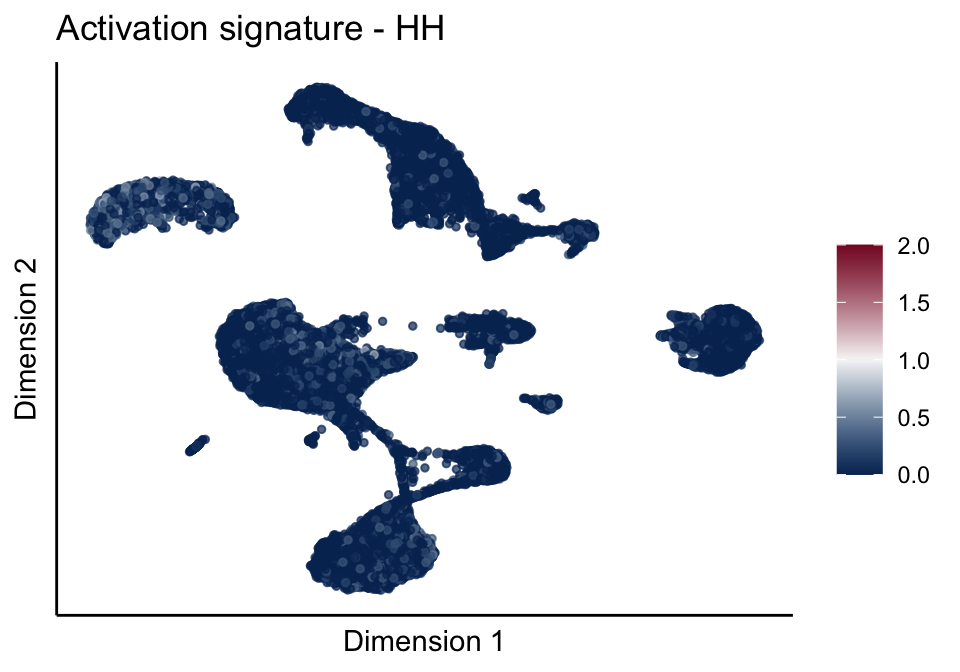
| Version | Author | Date |
|---|---|---|
| 02765dc | mluetge | 2022-07-19 |
[[3]][[2]]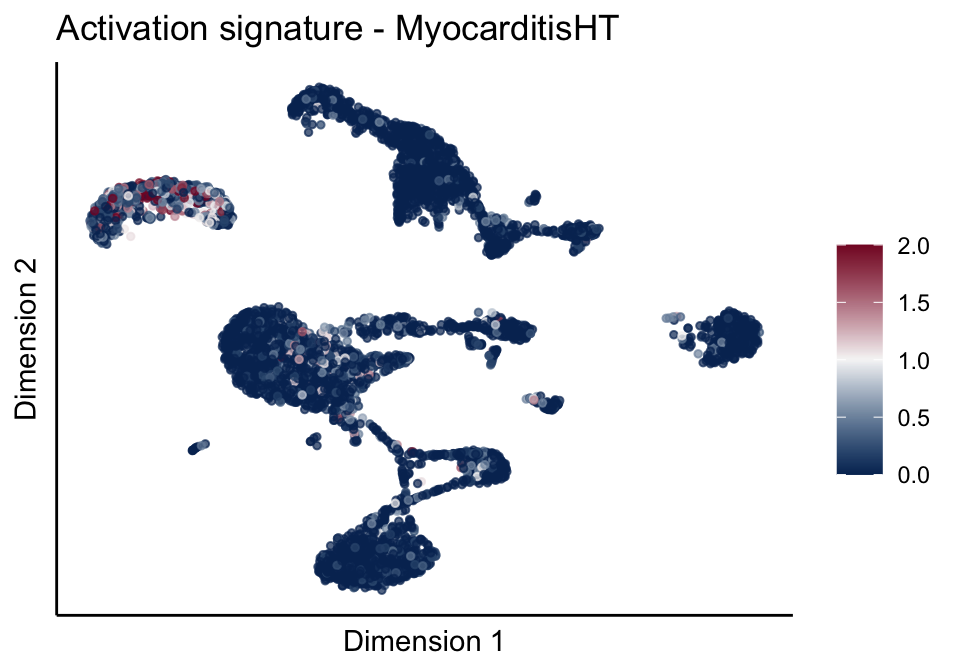
| Version | Author | Date |
|---|---|---|
| 02765dc | mluetge | 2022-07-19 |
[[3]][[3]]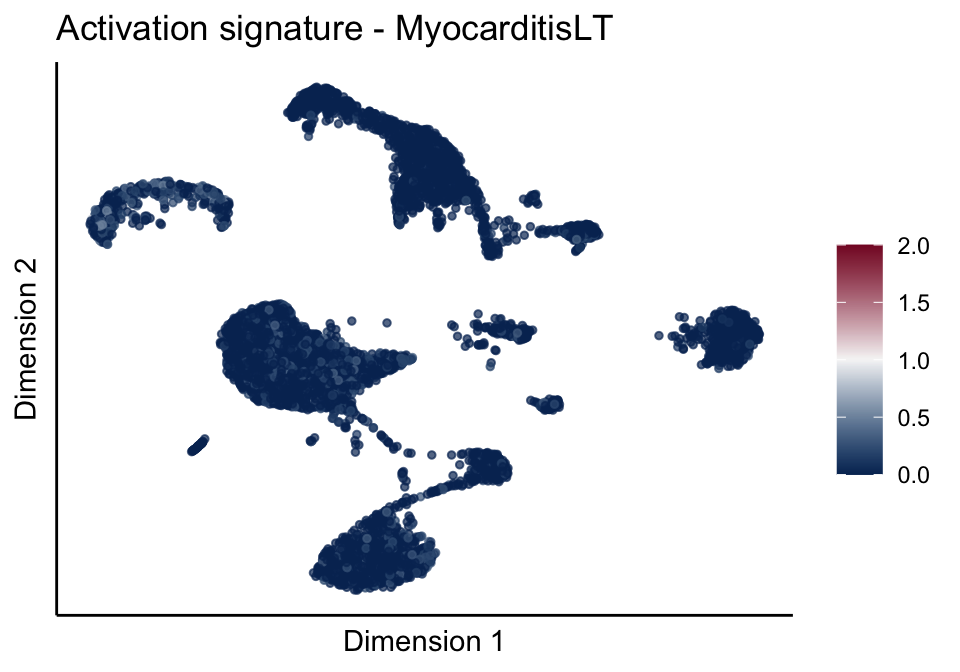
| Version | Author | Date |
|---|---|---|
| 02765dc | mluetge | 2022-07-19 |
[[4]]
[[4]][[1]]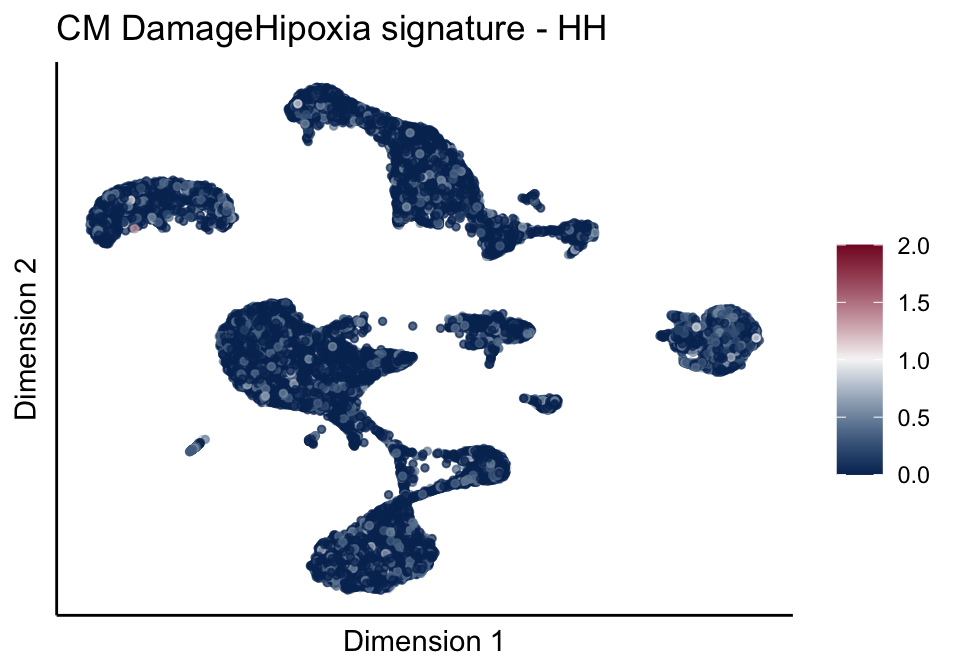
| Version | Author | Date |
|---|---|---|
| 02765dc | mluetge | 2022-07-19 |
[[4]][[2]]
| Version | Author | Date |
|---|---|---|
| 02765dc | mluetge | 2022-07-19 |
[[4]][[3]]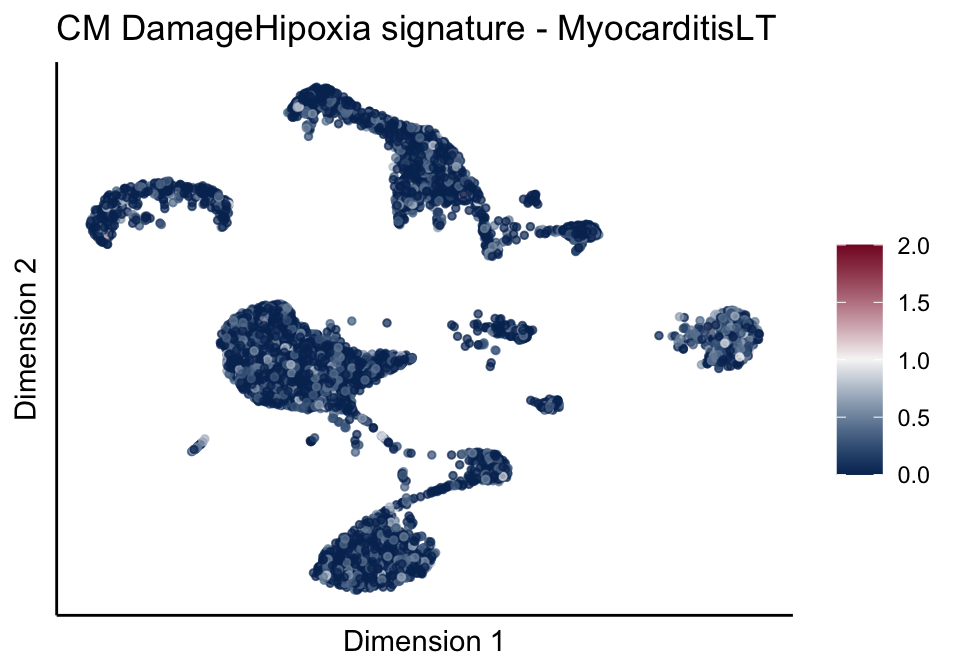
| Version | Author | Date |
|---|---|---|
| 02765dc | mluetge | 2022-07-19 |
[[5]]
[[5]][[1]]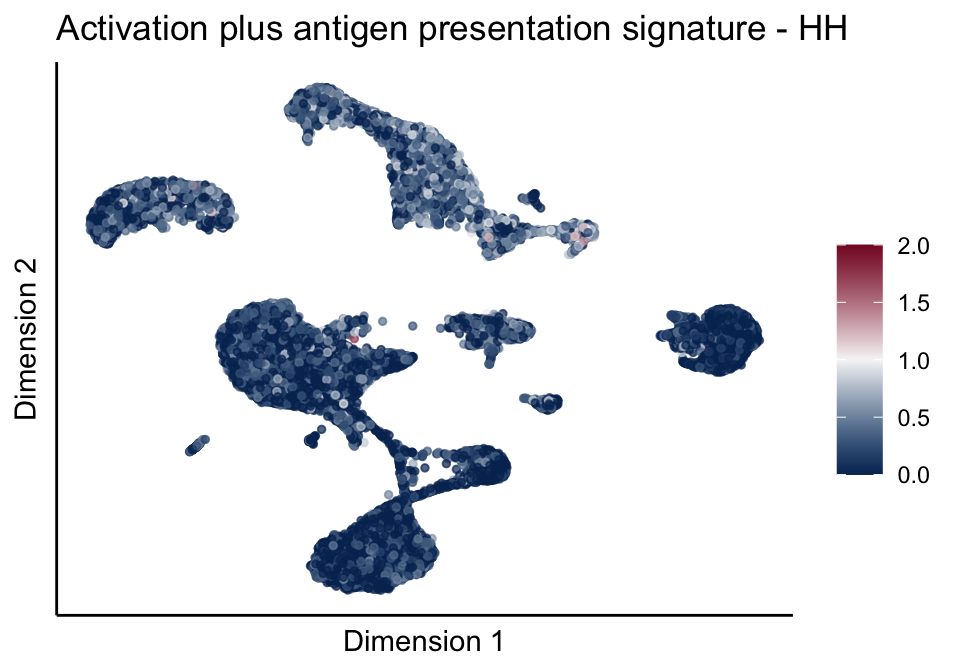
[[5]][[2]]
[[5]][[3]]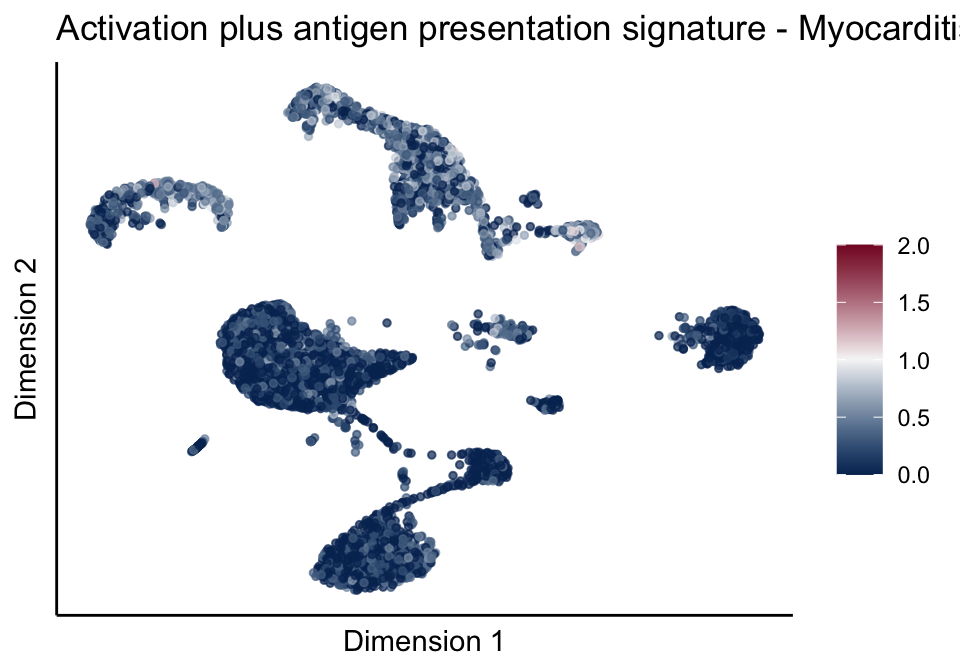
cutOff <- 1.5
pal = colorRampPalette(c("#053061", "#f7f7f7","#85122d"))(100)
sc <- scale_colour_gradientn(colours = pal, limits=c(0, cutOff))

lapply(unique(signDat$signature), function(sign){
  signGenes <- signDat %>% dplyr::filter(signature == sign)
  sceSub <- sce[which(rownames(sce) %in% signGenes$geneID),]
  cntMat <- rowSums(t(as.matrix(sceSub@assays@data$logcounts)))/nrow(signGenes)
  sceSub$sign <- cntMat
  sceSub$sign[which(sceSub$sign > cutOff)] <- cutOff
  sceSub$sign[which(sceSub$sign < 0)] <- 0
  lapply(treatGrps, function(treat){
    sceSubT <- sceSub[, which(sceSub$cond2 == treat)]
    p <- visGroup_adapt(sceSubT, 'sign', dim_red = 'UMAP') +
    sc +
    guides(colour = guide_colourbar(title = '')) +
    ggtitle(paste0(sign, ' signature - ', treat)) +
    theme_classic() +
    theme(axis.text = element_blank(),
          axis.ticks = element_blank()) +
    labs(x='Dimension 1', y='Dimension 2')
    p
  })
})
[[1]]
[[1]][[1]]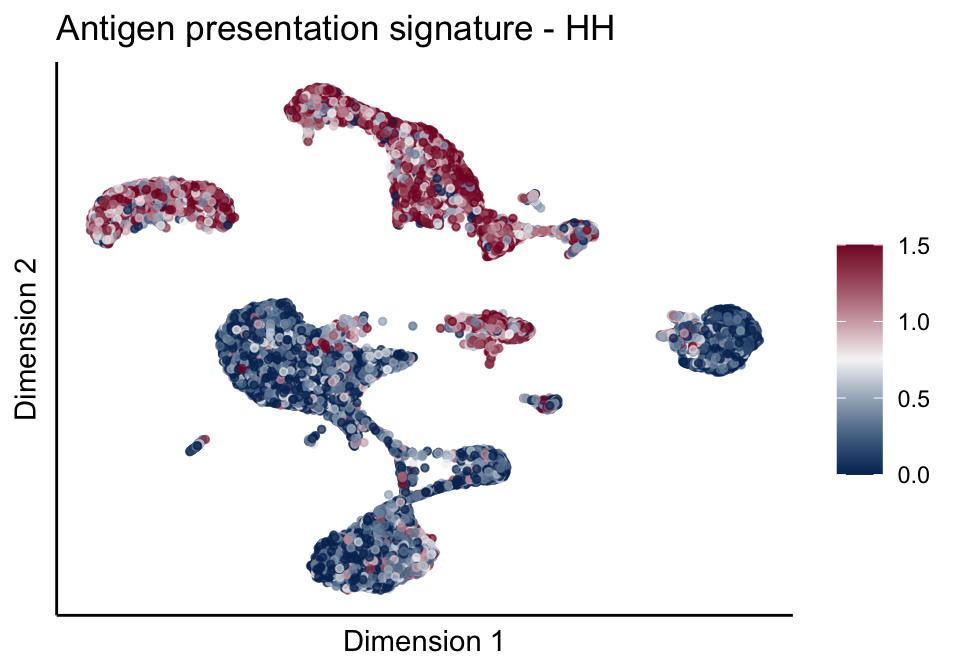
[[1]][[2]]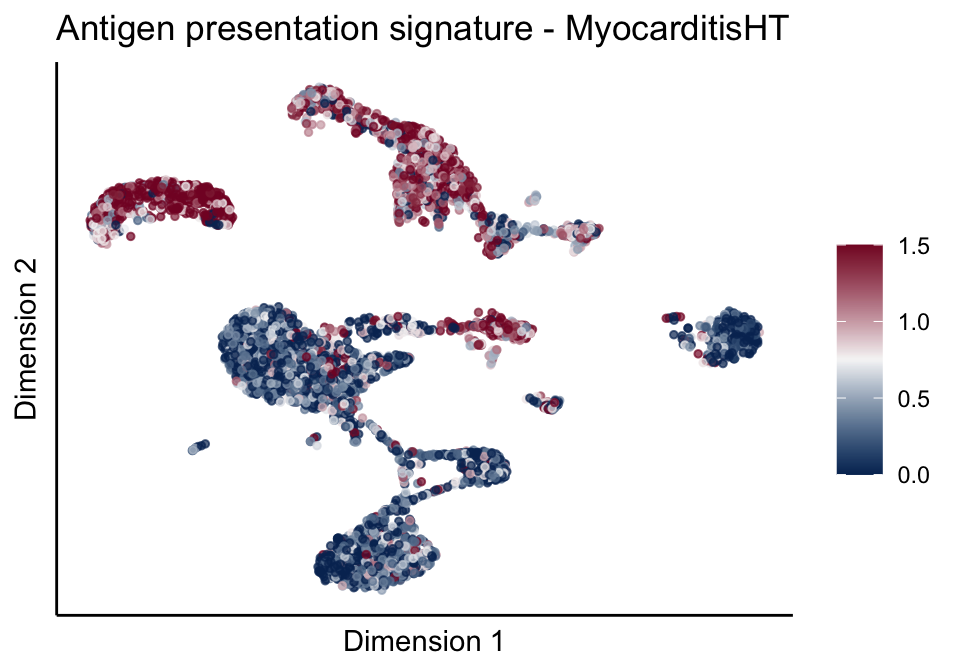
[[1]][[3]]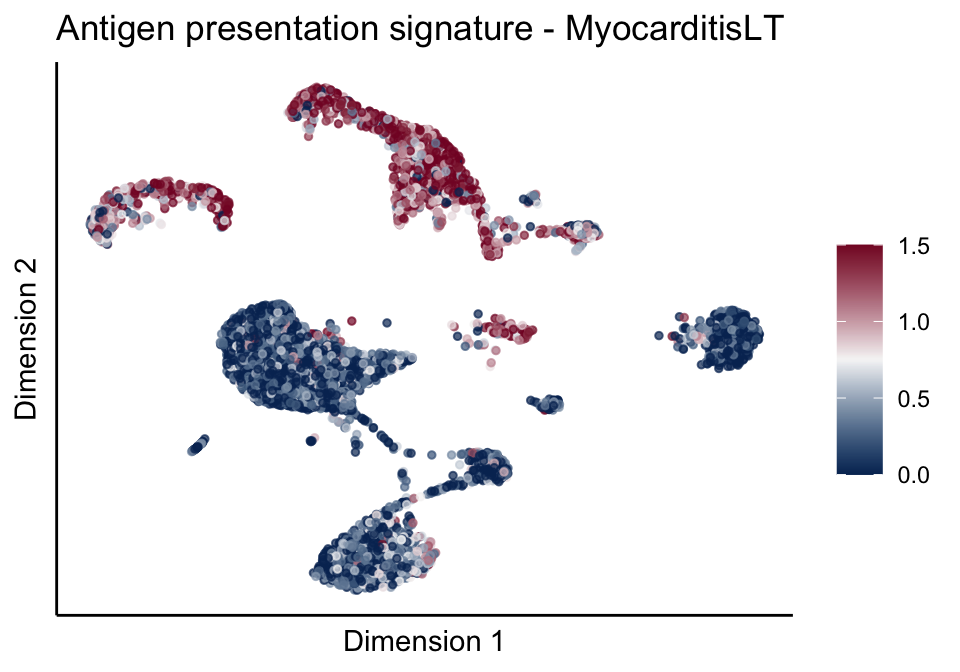
[[2]]
[[2]][[1]]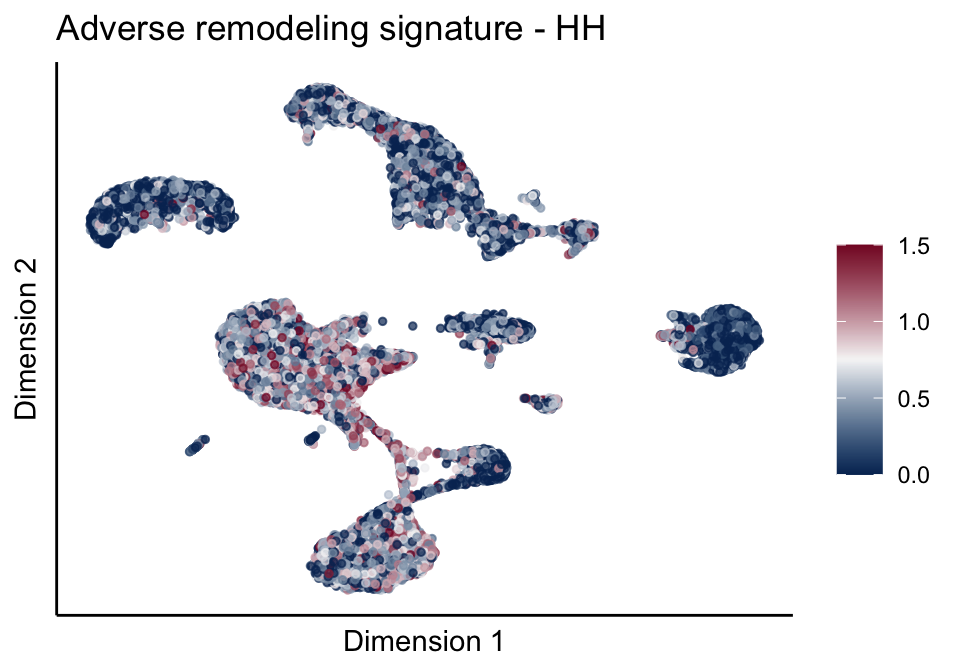
[[2]][[2]]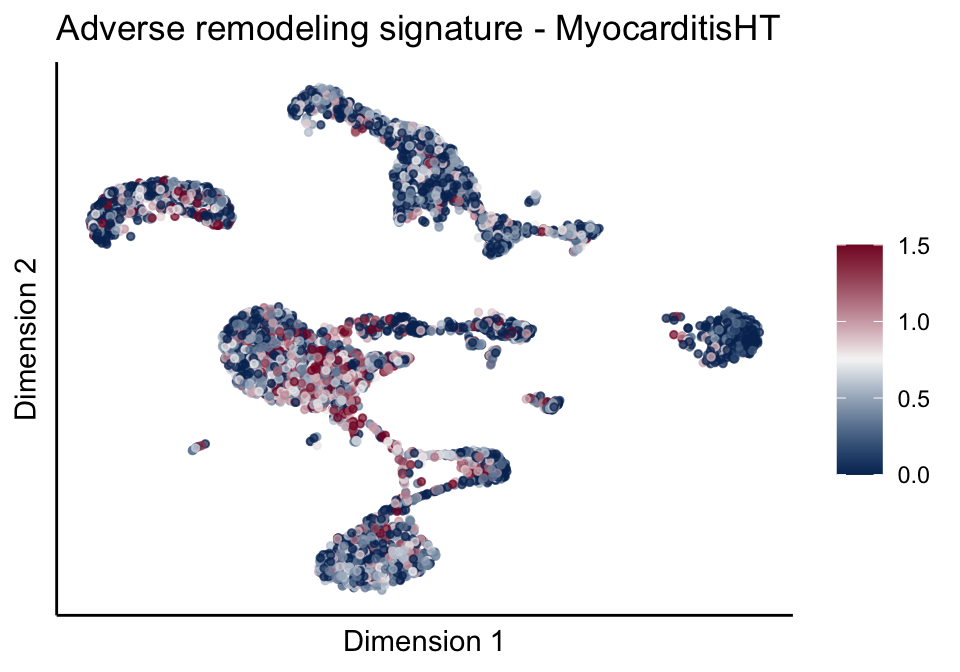
[[2]][[3]]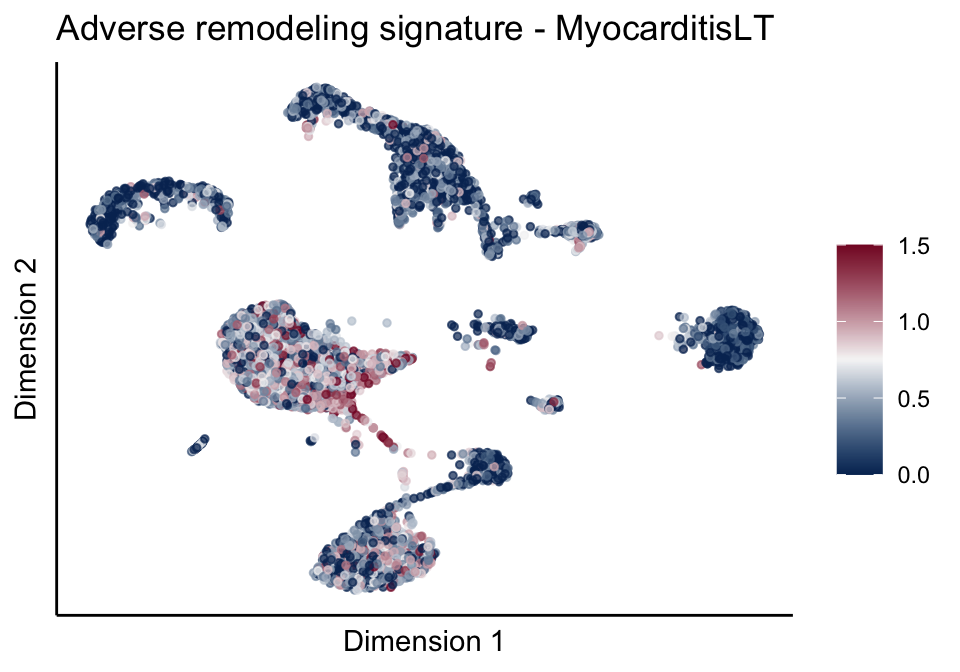
[[3]]
[[3]][[1]]
[[3]][[2]]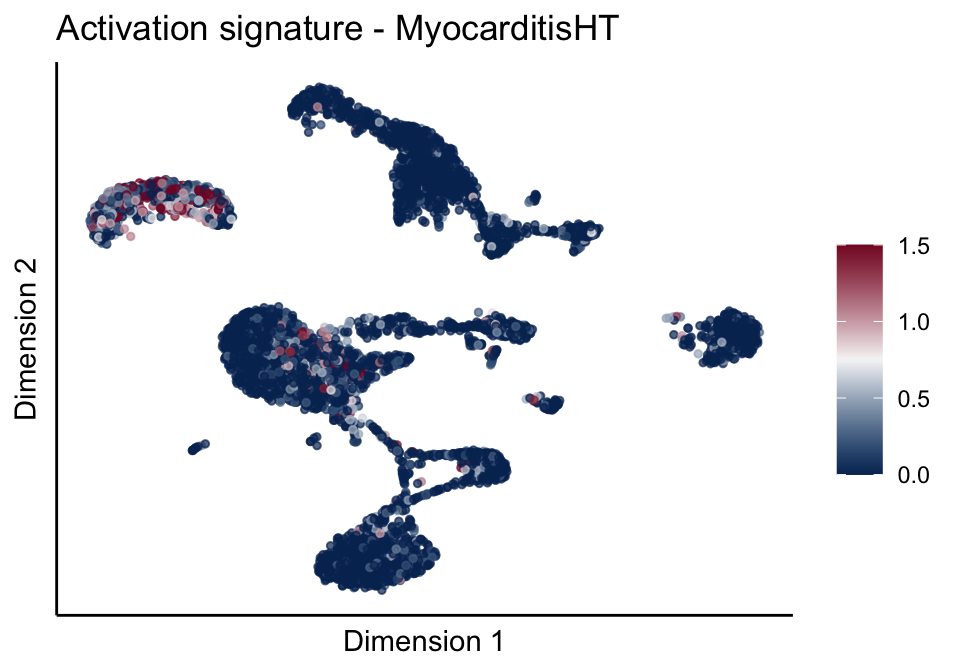
[[3]][[3]]
[[4]]
[[4]][[1]]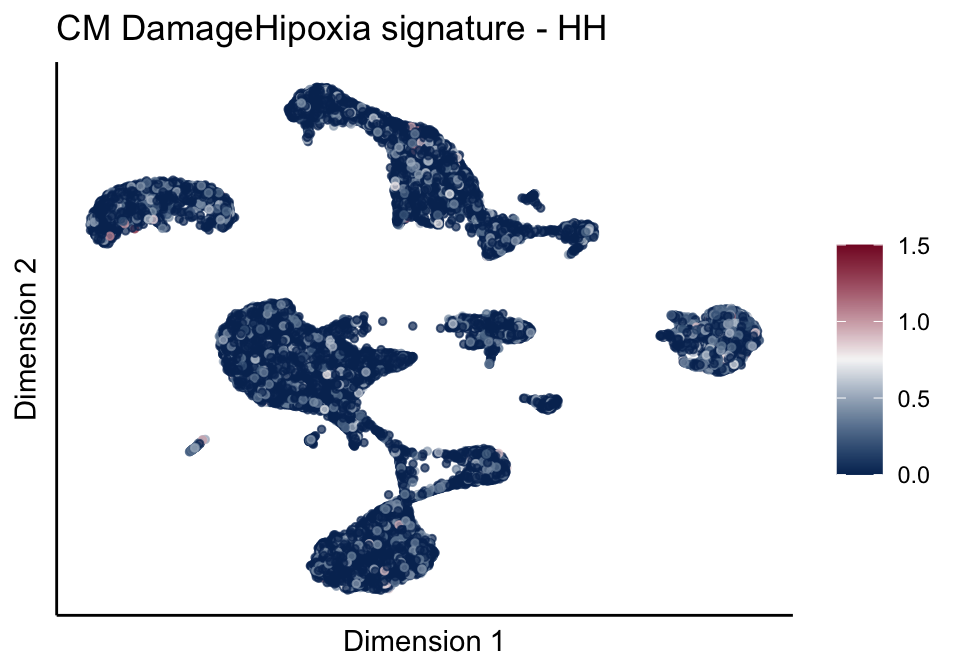
[[4]][[2]]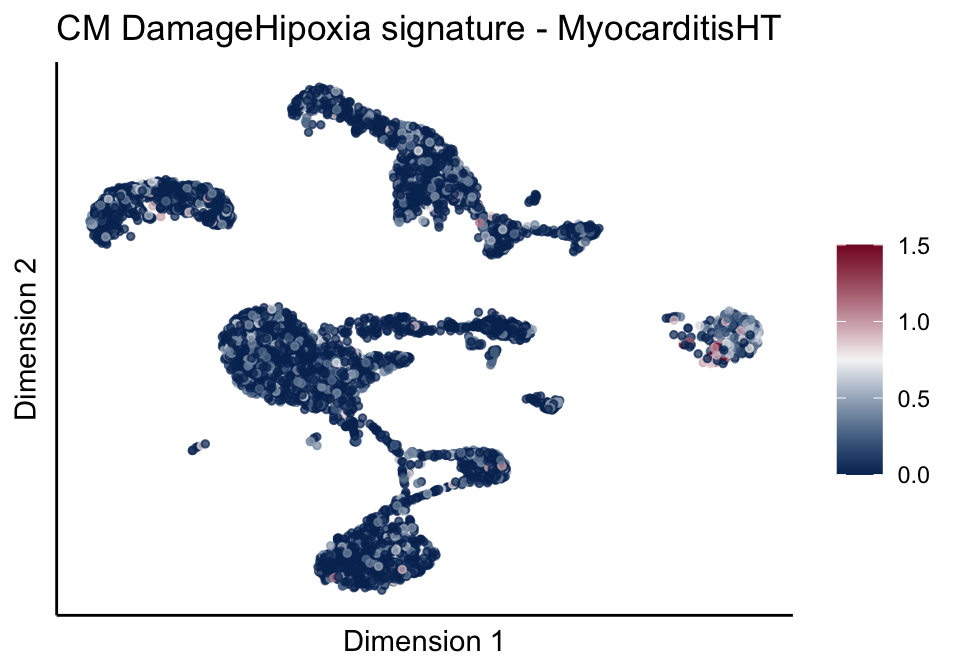
[[4]][[3]]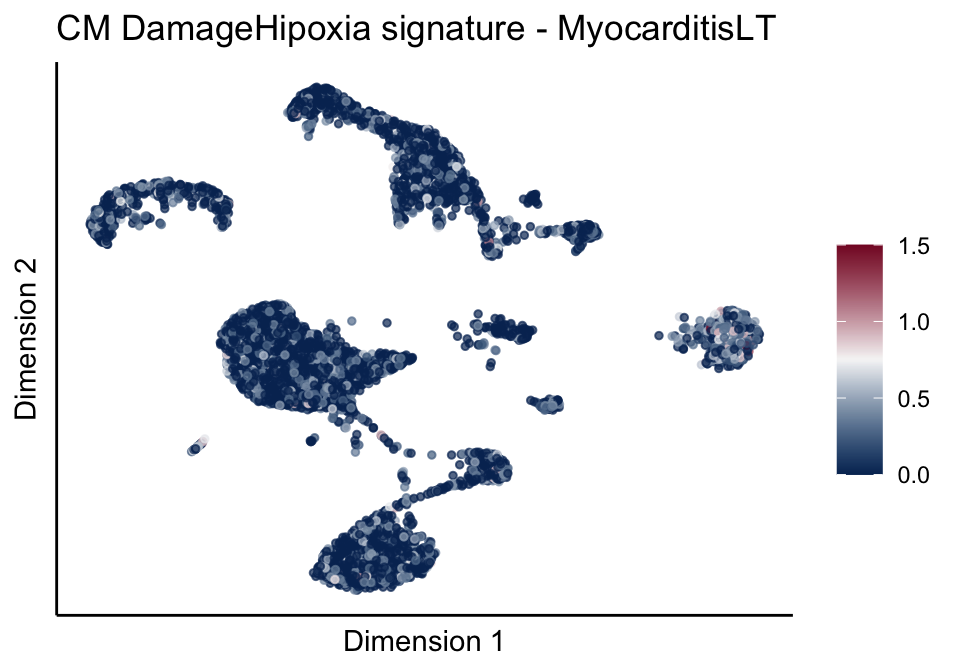
[[5]]
[[5]][[1]]
[[5]][[2]]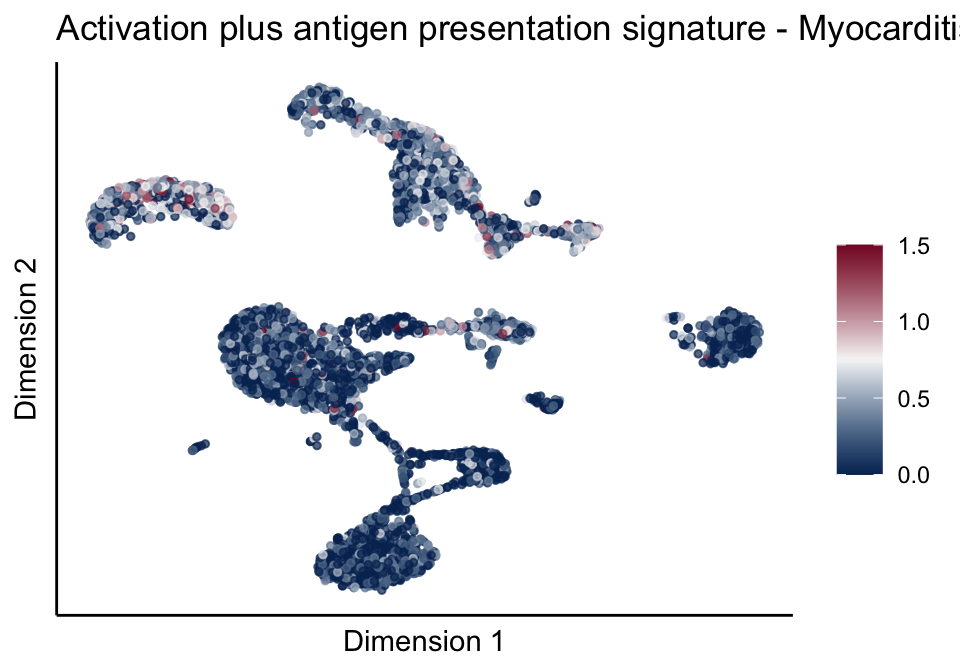
[[5]][[3]]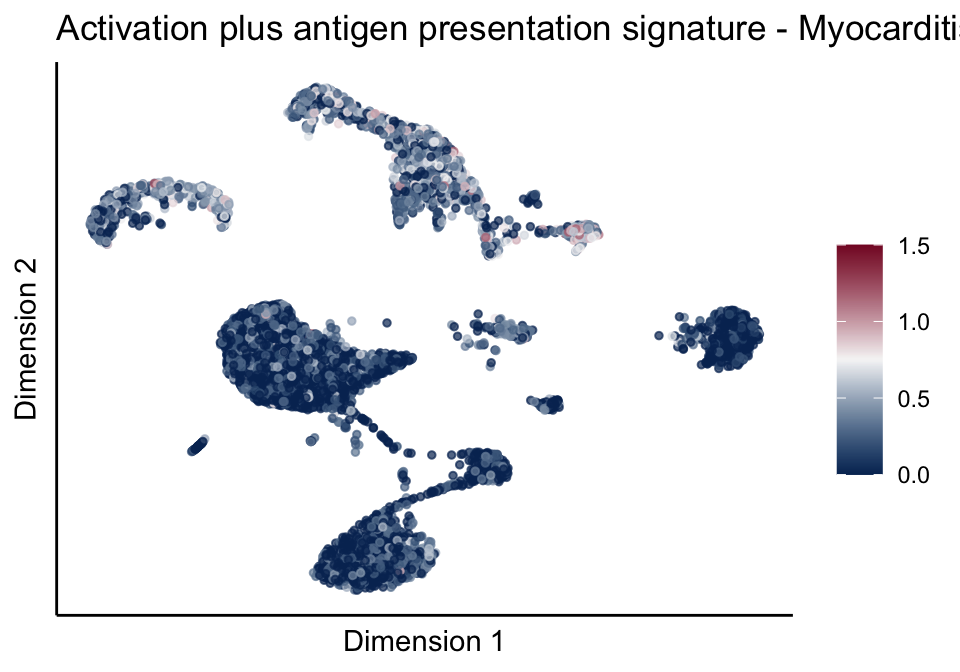
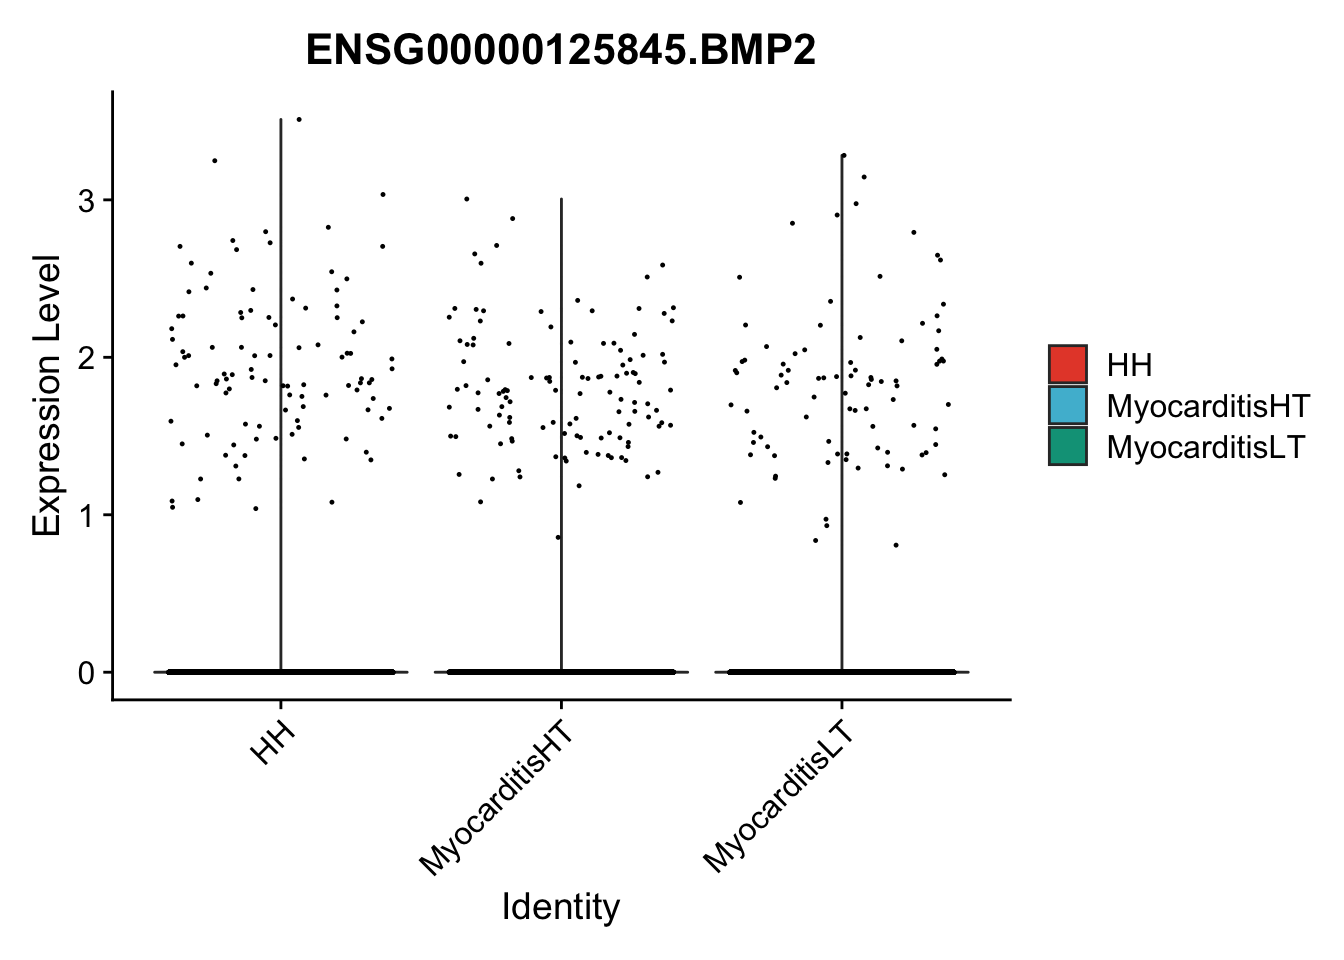
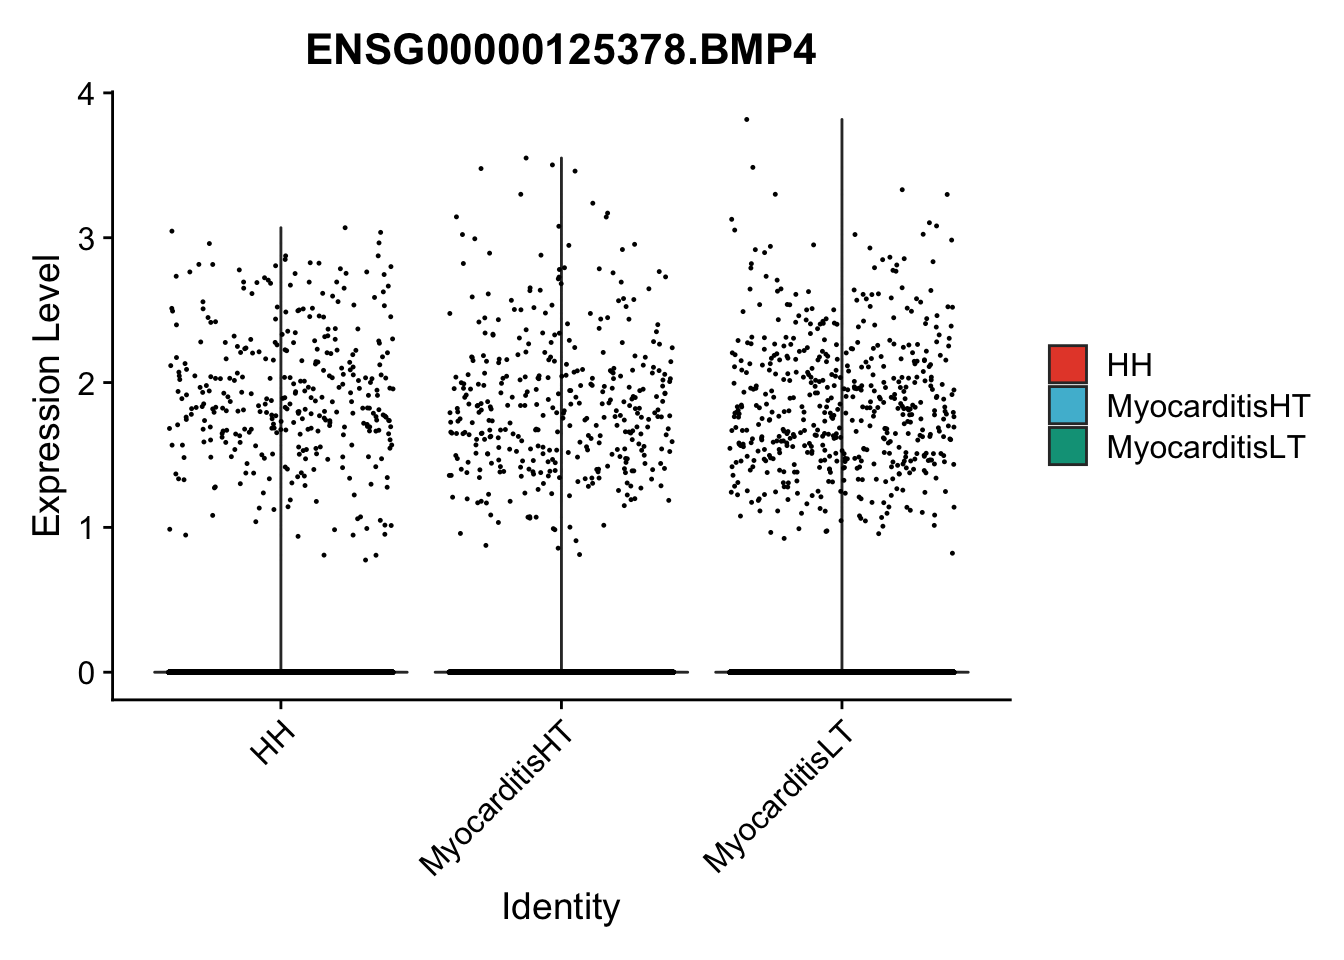
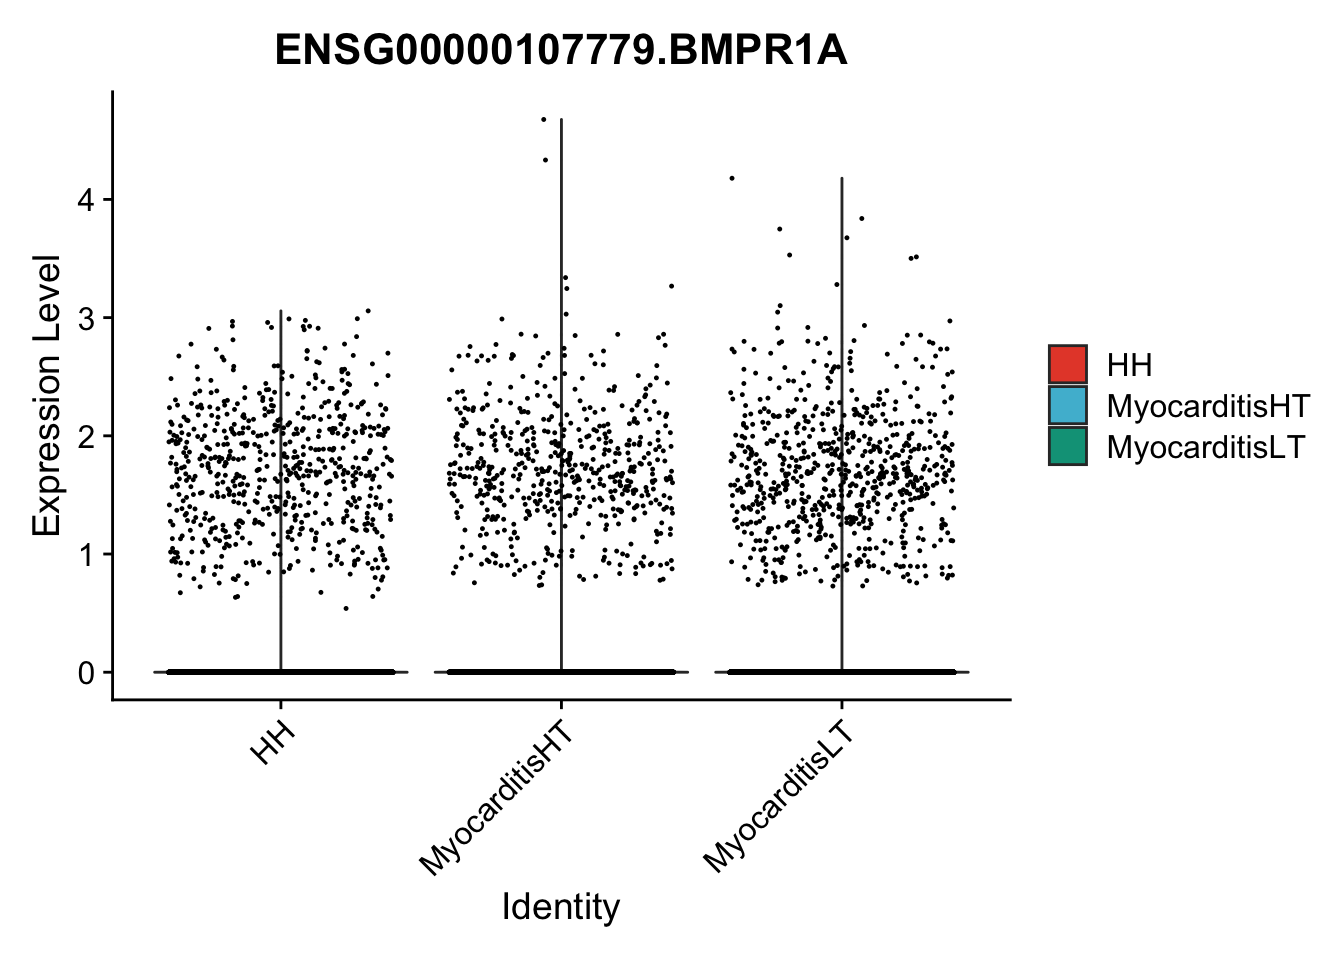
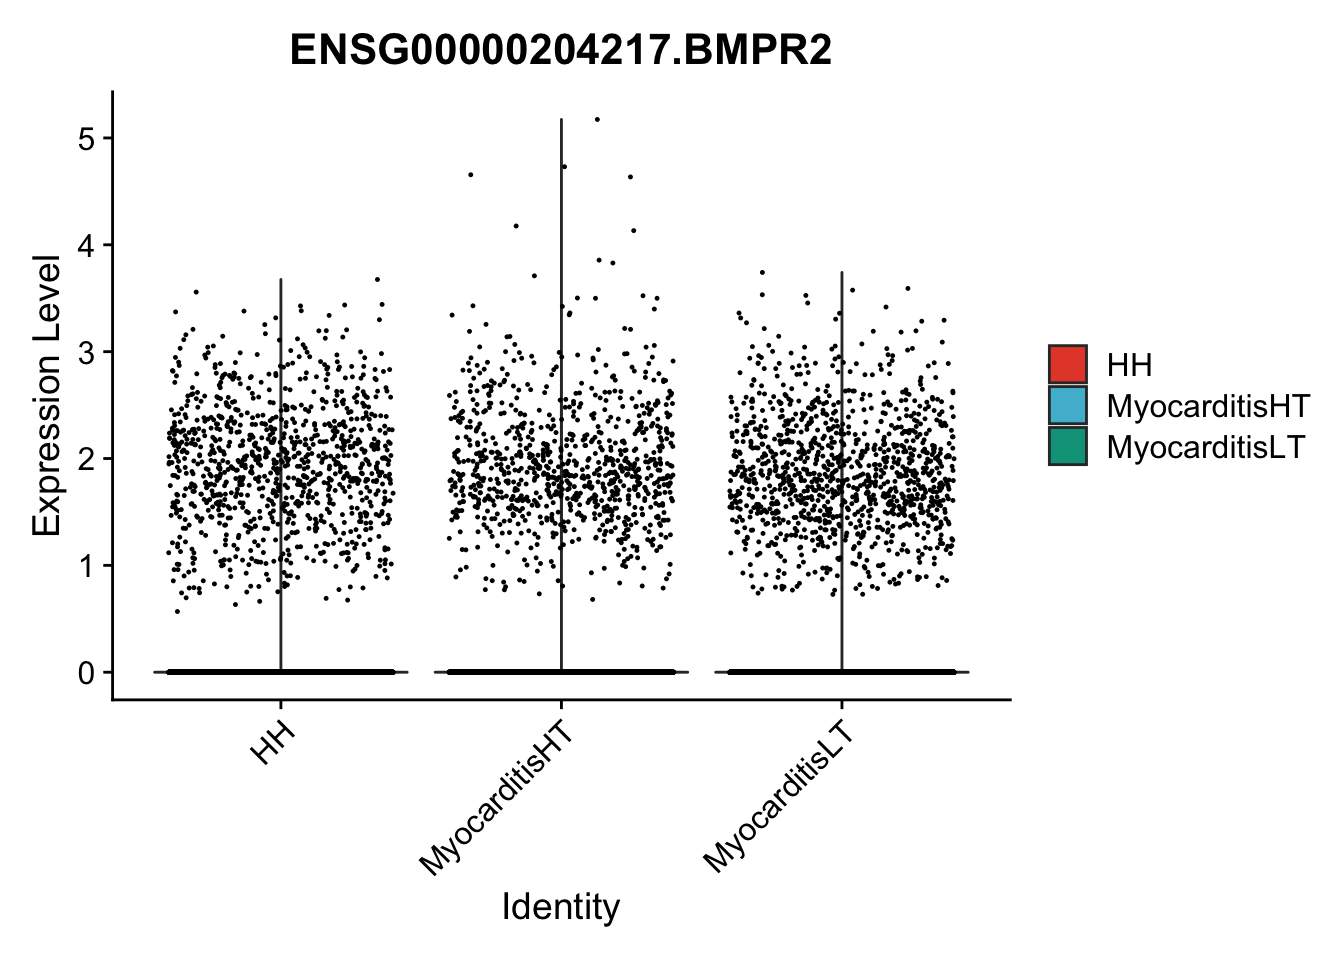
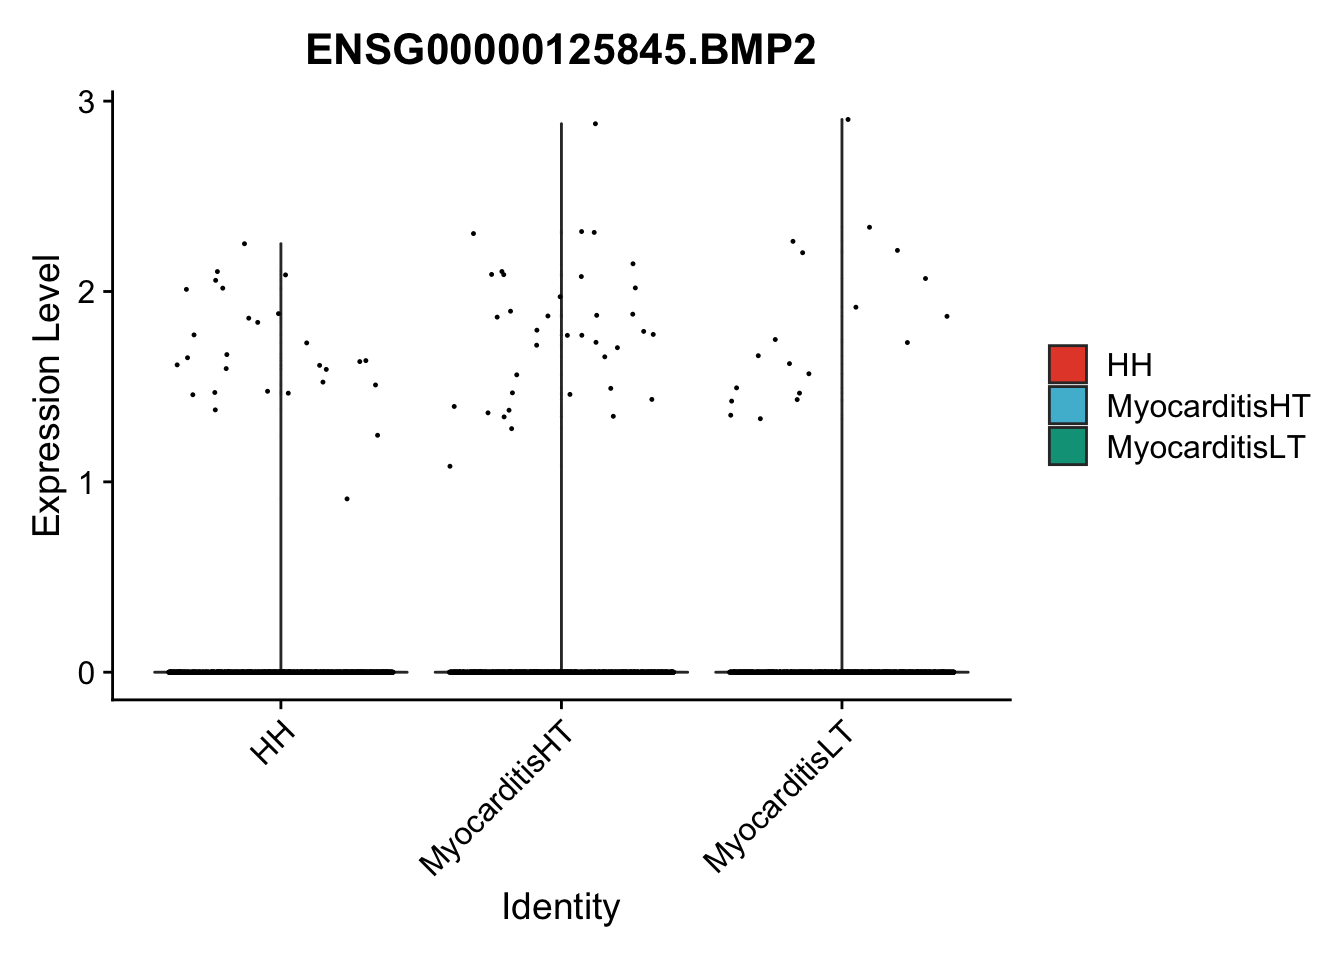
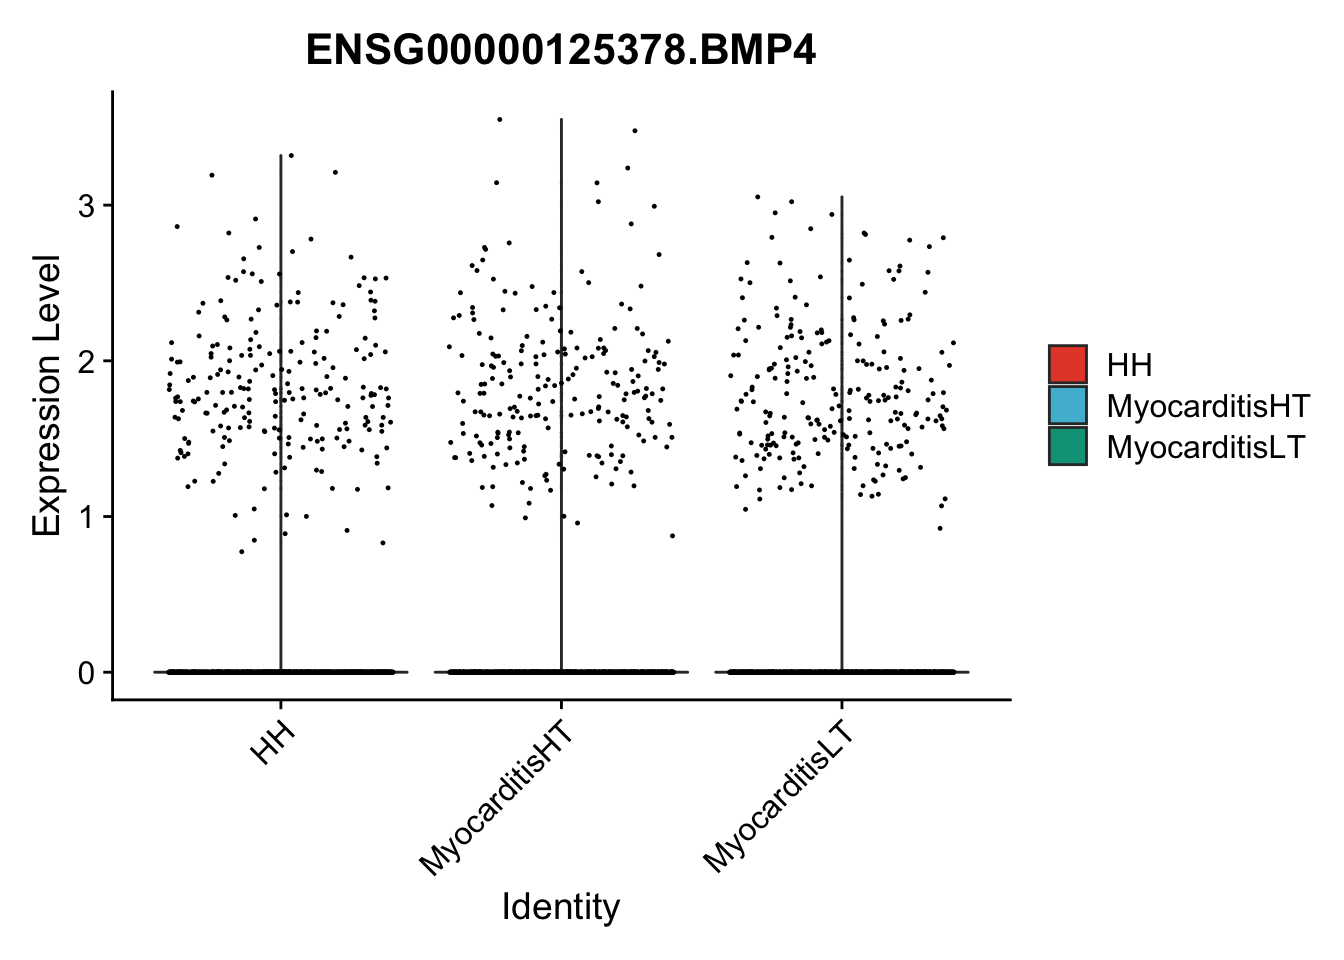
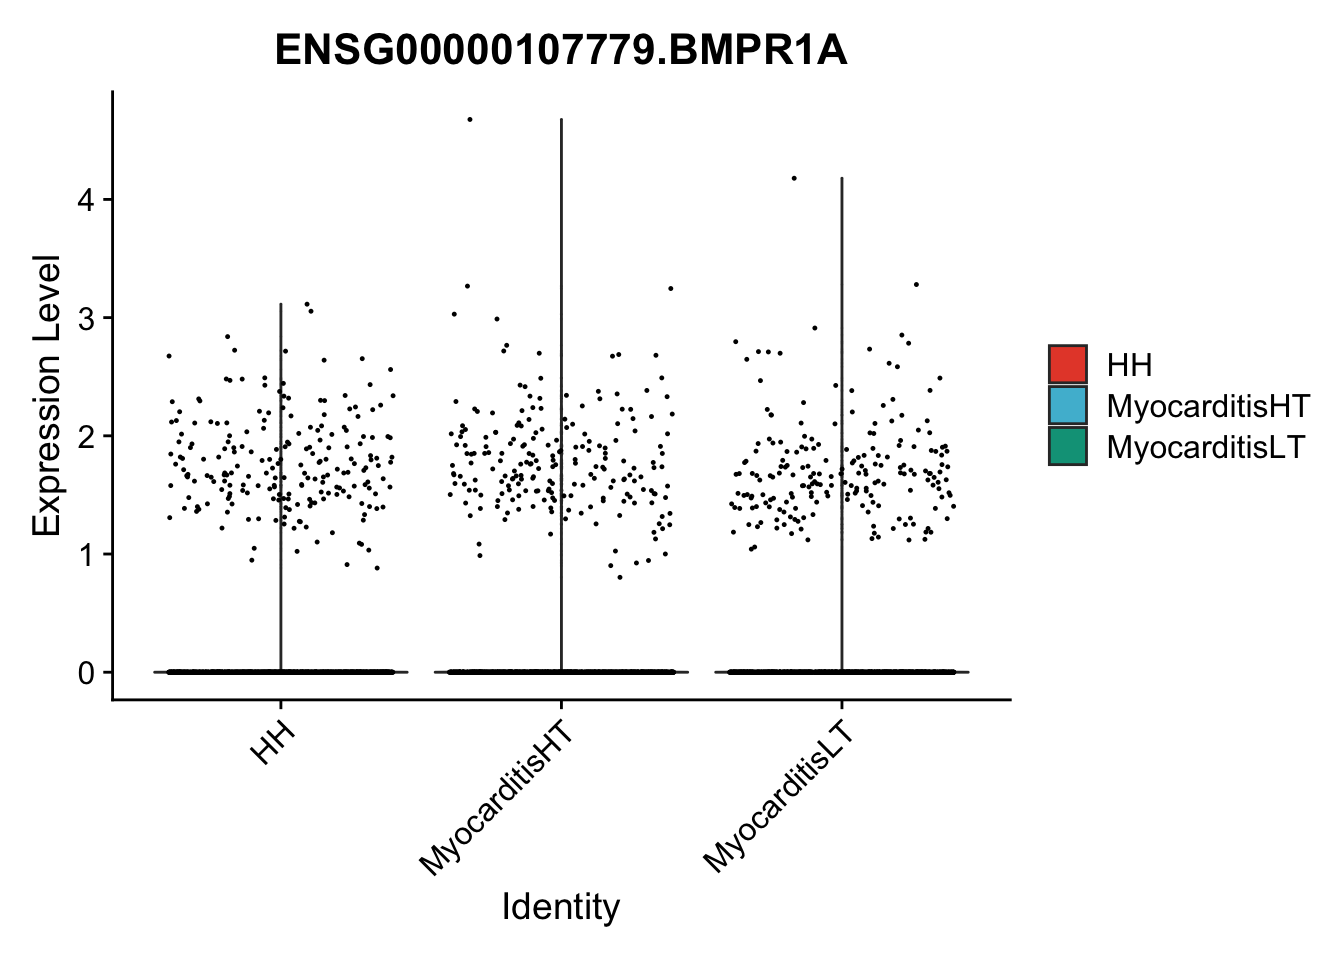
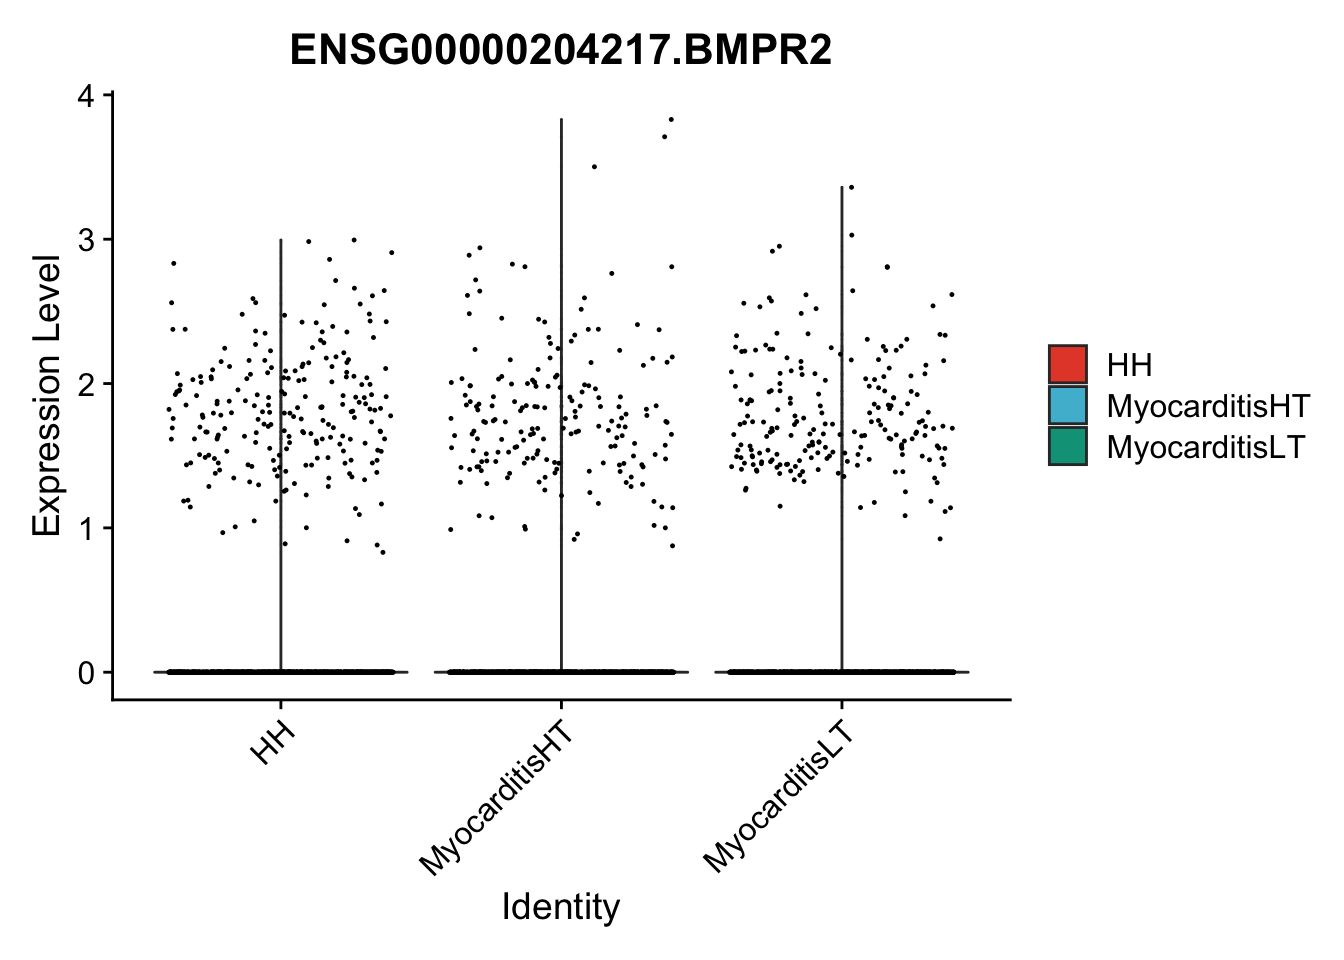
vis sel genes violin
genesDat <- data.frame(EnsID=rownames(seurat)) %>%
  mutate(gene=gsub(".*\\.", "", EnsID))
selGenes <- data.frame(gene=c("BMP2", "BMP4", "BMPR1A", "BMPR2")) %>%
  left_join(., genesDat, by="gene")

## subsample to equal number
Idents(seurat) <- seurat$cond2
seuratSub <- subset(seurat, downsample = min(table(seurat$cond2)))

pList <- sapply(selGenes$EnsID, function(x){
  p <- VlnPlot(object = seuratSub, features = x,
               group.by = "cond2",
               cols = colCond, pt.size = 0.2
               )
  plot(p)
})
| Version | Author | Date |
|---|---|---|
| 02765dc | mluetge | 2022-07-19 |
| Version | Author | Date |
|---|---|---|
| 02765dc | mluetge | 2022-07-19 |
| Version | Author | Date |
|---|---|---|
| 02765dc | mluetge | 2022-07-19 |
| Version | Author | Date |
|---|---|---|
| 02765dc | mluetge | 2022-07-19 |
vis sel genes violin Fibroblasts
seuratSub <- subset(seurat, label == "Fibroblast")

## subsample to equal number
seuratSub <- subset(seuratSub, downsample = min(table(seuratSub$cond2)))

pList <- sapply(selGenes$EnsID, function(x){
  p <- VlnPlot(object = seuratSub, features = x,
               group.by = "cond2",
               cols = colCond, pt.size = 0.2
               )
  plot(p)
})
| Version | Author | Date |
|---|---|---|
| 02765dc | mluetge | 2022-07-19 |
| Version | Author | Date |
|---|---|---|
| 02765dc | mluetge | 2022-07-19 |
| Version | Author | Date |
|---|---|---|
| 02765dc | mluetge | 2022-07-19 |
| Version | Author | Date |
|---|---|---|
| 02765dc | mluetge | 2022-07-19 |
session info
sessionInfo()R version 4.1.0 (2021-05-18)
Platform: x86_64-apple-darwin17.0 (64-bit)
Running under: macOS Big Sur 10.16
Matrix products: default
BLAS: /Library/Frameworks/R.framework/Versions/4.1/Resources/lib/libRblas.dylib
LAPACK: /Library/Frameworks/R.framework/Versions/4.1/Resources/lib/libRlapack.dylib
locale:
[1] en_US.UTF-8/en_US.UTF-8/en_US.UTF-8/C/en_US.UTF-8/en_US.UTF-8
attached base packages:
[1] grid parallel stats4 stats graphics grDevices utils
[8] datasets methods base
other attached packages:
[1] msigdbr_7.5.1 enrichplot_1.12.3
[3] DOSE_3.18.3 org.Hs.eg.db_3.13.0
[5] AnnotationDbi_1.54.1 clusterProfiler_4.0.5
[7] gridExtra_2.3 fgsea_1.18.0
[9] sctransform_0.3.3 viridis_0.6.2
[11] viridisLite_0.4.0 pheatmap_1.0.12
[13] ggpubr_0.4.0 ggsci_2.9
[15] runSeurat3_0.1.0 here_1.0.1
[17] magrittr_2.0.3 sp_1.4-7
[19] SeuratObject_4.1.0 Seurat_4.1.1
[21] forcats_0.5.1 stringr_1.4.0
[23] dplyr_1.0.9 purrr_0.3.4
[25] readr_2.1.2 tidyr_1.2.0
[27] tibble_3.1.7 ggplot2_3.3.6
[29] tidyverse_1.3.1 SingleCellExperiment_1.14.1
[31] SummarizedExperiment_1.22.0 Biobase_2.52.0
[33] GenomicRanges_1.44.0 GenomeInfoDb_1.28.4
[35] IRanges_2.26.0 S4Vectors_0.30.2
[37] BiocGenerics_0.38.0 MatrixGenerics_1.4.3
[39] matrixStats_0.62.0
loaded via a namespace (and not attached):
[1] scattermore_0.8 bit64_4.0.5 knitr_1.39
[4] irlba_2.3.5 DelayedArray_0.18.0 data.table_1.14.2
[7] rpart_4.1.16 KEGGREST_1.32.0 RCurl_1.98-1.6
[10] generics_0.1.2 cowplot_1.1.1 RSQLite_2.2.14
[13] shadowtext_0.1.2 RANN_2.6.1 future_1.25.0
[16] bit_4.0.4 tzdb_0.3.0 spatstat.data_2.2-0
[19] xml2_1.3.3 lubridate_1.8.0 httpuv_1.6.5
[22] assertthat_0.2.1 xfun_0.30 hms_1.1.1
[25] jquerylib_0.1.4 babelgene_22.3 evaluate_0.15
[28] promises_1.2.0.1 fansi_1.0.3 dbplyr_2.1.1
[31] readxl_1.4.0 igraph_1.3.1 DBI_1.1.2
[34] htmlwidgets_1.5.4 spatstat.geom_2.4-0 ellipsis_0.3.2
[37] backports_1.4.1 deldir_1.0-6 vctrs_0.4.1
[40] ROCR_1.0-11 abind_1.4-5 cachem_1.0.6
[43] withr_2.5.0 ggforce_0.3.3 progressr_0.10.0
[46] vroom_1.5.7 treeio_1.16.2 goftest_1.2-3
[49] cluster_2.1.3 ape_5.6-2 lazyeval_0.2.2
[52] crayon_1.5.1 labeling_0.4.2 pkgconfig_2.0.3
[55] tweenr_1.0.2 nlme_3.1-157 rlang_1.0.2
[58] globals_0.15.0 lifecycle_1.0.1 miniUI_0.1.1.1
[61] downloader_0.4 modelr_0.1.8 cellranger_1.1.0
[64] rprojroot_2.0.3 polyclip_1.10-0 lmtest_0.9-40
[67] Matrix_1.4-1 aplot_0.1.4 carData_3.0-5
[70] zoo_1.8-10 reprex_2.0.1 whisker_0.4
[73] ggridges_0.5.3 png_0.1-7 bitops_1.0-7
[76] KernSmooth_2.23-20 Biostrings_2.60.2 blob_1.2.3
[79] workflowr_1.7.0 qvalue_2.24.0 parallelly_1.31.1
[82] spatstat.random_2.2-0 rstatix_0.7.0 gridGraphics_0.5-1
[85] ggsignif_0.6.3 scales_1.2.0 memoise_2.0.1
[88] plyr_1.8.7 ica_1.0-2 zlibbioc_1.38.0
[91] compiler_4.1.0 scatterpie_0.1.7 RColorBrewer_1.1-3
[94] fitdistrplus_1.1-8 cli_3.3.0 XVector_0.32.0
[97] listenv_0.8.0 patchwork_1.1.1 pbapply_1.5-0
[100] MASS_7.3-57 mgcv_1.8-40 tidyselect_1.1.2
[103] stringi_1.7.6 highr_0.9 yaml_2.3.5
[106] GOSemSim_2.18.1 ggrepel_0.9.1 sass_0.4.1
[109] fastmatch_1.1-3 tools_4.1.0 future.apply_1.9.0
[112] rstudioapi_0.13 git2r_0.30.1 farver_2.1.0
[115] Rtsne_0.16 ggraph_2.0.5 digest_0.6.29
[118] rgeos_0.5-9 shiny_1.7.1 Rcpp_1.0.8.3
[121] car_3.0-13 broom_0.8.0 later_1.3.0
[124] RcppAnnoy_0.0.19 httr_1.4.3 colorspace_2.0-3
[127] rvest_1.0.2 fs_1.5.2 tensor_1.5
[130] reticulate_1.24 splines_4.1.0 uwot_0.1.11
[133] yulab.utils_0.0.4 tidytree_0.3.9 spatstat.utils_2.3-1
[136] graphlayouts_0.8.0 ggplotify_0.1.0 plotly_4.10.0
[139] xtable_1.8-4 jsonlite_1.8.0 ggtree_3.0.4
[142] tidygraph_1.2.1 ggfun_0.0.6 R6_2.5.1
[145] pillar_1.7.0 htmltools_0.5.2 mime_0.12
[148] glue_1.6.2 fastmap_1.1.0 BiocParallel_1.26.2
[151] codetools_0.2-18 utf8_1.2.2 lattice_0.20-45
[154] bslib_0.3.1 spatstat.sparse_2.1-1 leiden_0.3.10
[157] GO.db_3.13.0 limma_3.48.3 survival_3.3-1
[160] rmarkdown_2.14 munsell_0.5.0 DO.db_2.9
[163] GenomeInfoDbData_1.2.6 haven_2.5.0 reshape2_1.4.4
[166] gtable_0.3.0 spatstat.core_2.4-2 date()[1] "Tue Jul 26 16:05:08 2022"
sessionInfo()R version 4.1.0 (2021-05-18)
Platform: x86_64-apple-darwin17.0 (64-bit)
Running under: macOS Big Sur 10.16
Matrix products: default
BLAS: /Library/Frameworks/R.framework/Versions/4.1/Resources/lib/libRblas.dylib
LAPACK: /Library/Frameworks/R.framework/Versions/4.1/Resources/lib/libRlapack.dylib
locale:
[1] en_US.UTF-8/en_US.UTF-8/en_US.UTF-8/C/en_US.UTF-8/en_US.UTF-8
attached base packages:
[1] grid parallel stats4 stats graphics grDevices utils
[8] datasets methods base
other attached packages:
[1] msigdbr_7.5.1 enrichplot_1.12.3
[3] DOSE_3.18.3 org.Hs.eg.db_3.13.0
[5] AnnotationDbi_1.54.1 clusterProfiler_4.0.5
[7] gridExtra_2.3 fgsea_1.18.0
[9] sctransform_0.3.3 viridis_0.6.2
[11] viridisLite_0.4.0 pheatmap_1.0.12
[13] ggpubr_0.4.0 ggsci_2.9
[15] runSeurat3_0.1.0 here_1.0.1
[17] magrittr_2.0.3 sp_1.4-7
[19] SeuratObject_4.1.0 Seurat_4.1.1
[21] forcats_0.5.1 stringr_1.4.0
[23] dplyr_1.0.9 purrr_0.3.4
[25] readr_2.1.2 tidyr_1.2.0
[27] tibble_3.1.7 ggplot2_3.3.6
[29] tidyverse_1.3.1 SingleCellExperiment_1.14.1
[31] SummarizedExperiment_1.22.0 Biobase_2.52.0
[33] GenomicRanges_1.44.0 GenomeInfoDb_1.28.4
[35] IRanges_2.26.0 S4Vectors_0.30.2
[37] BiocGenerics_0.38.0 MatrixGenerics_1.4.3
[39] matrixStats_0.62.0
loaded via a namespace (and not attached):
[1] scattermore_0.8 bit64_4.0.5 knitr_1.39
[4] irlba_2.3.5 DelayedArray_0.18.0 data.table_1.14.2
[7] rpart_4.1.16 KEGGREST_1.32.0 RCurl_1.98-1.6
[10] generics_0.1.2 cowplot_1.1.1 RSQLite_2.2.14
[13] shadowtext_0.1.2 RANN_2.6.1 future_1.25.0
[16] bit_4.0.4 tzdb_0.3.0 spatstat.data_2.2-0
[19] xml2_1.3.3 lubridate_1.8.0 httpuv_1.6.5
[22] assertthat_0.2.1 xfun_0.30 hms_1.1.1
[25] jquerylib_0.1.4 babelgene_22.3 evaluate_0.15
[28] promises_1.2.0.1 fansi_1.0.3 dbplyr_2.1.1
[31] readxl_1.4.0 igraph_1.3.1 DBI_1.1.2
[34] htmlwidgets_1.5.4 spatstat.geom_2.4-0 ellipsis_0.3.2
[37] backports_1.4.1 deldir_1.0-6 vctrs_0.4.1
[40] ROCR_1.0-11 abind_1.4-5 cachem_1.0.6
[43] withr_2.5.0 ggforce_0.3.3 progressr_0.10.0
[46] vroom_1.5.7 treeio_1.16.2 goftest_1.2-3
[49] cluster_2.1.3 ape_5.6-2 lazyeval_0.2.2
[52] crayon_1.5.1 labeling_0.4.2 pkgconfig_2.0.3
[55] tweenr_1.0.2 nlme_3.1-157 rlang_1.0.2
[58] globals_0.15.0 lifecycle_1.0.1 miniUI_0.1.1.1
[61] downloader_0.4 modelr_0.1.8 cellranger_1.1.0
[64] rprojroot_2.0.3 polyclip_1.10-0 lmtest_0.9-40
[67] Matrix_1.4-1 aplot_0.1.4 carData_3.0-5
[70] zoo_1.8-10 reprex_2.0.1 whisker_0.4
[73] ggridges_0.5.3 png_0.1-7 bitops_1.0-7
[76] KernSmooth_2.23-20 Biostrings_2.60.2 blob_1.2.3
[79] workflowr_1.7.0 qvalue_2.24.0 parallelly_1.31.1
[82] spatstat.random_2.2-0 rstatix_0.7.0 gridGraphics_0.5-1
[85] ggsignif_0.6.3 scales_1.2.0 memoise_2.0.1
[88] plyr_1.8.7 ica_1.0-2 zlibbioc_1.38.0
[91] compiler_4.1.0 scatterpie_0.1.7 RColorBrewer_1.1-3
[94] fitdistrplus_1.1-8 cli_3.3.0 XVector_0.32.0
[97] listenv_0.8.0 patchwork_1.1.1 pbapply_1.5-0
[100] MASS_7.3-57 mgcv_1.8-40 tidyselect_1.1.2
[103] stringi_1.7.6 highr_0.9 yaml_2.3.5
[106] GOSemSim_2.18.1 ggrepel_0.9.1 sass_0.4.1
[109] fastmatch_1.1-3 tools_4.1.0 future.apply_1.9.0
[112] rstudioapi_0.13 git2r_0.30.1 farver_2.1.0
[115] Rtsne_0.16 ggraph_2.0.5 digest_0.6.29
[118] rgeos_0.5-9 shiny_1.7.1 Rcpp_1.0.8.3
[121] car_3.0-13 broom_0.8.0 later_1.3.0
[124] RcppAnnoy_0.0.19 httr_1.4.3 colorspace_2.0-3
[127] rvest_1.0.2 fs_1.5.2 tensor_1.5
[130] reticulate_1.24 splines_4.1.0 uwot_0.1.11
[133] yulab.utils_0.0.4 tidytree_0.3.9 spatstat.utils_2.3-1
[136] graphlayouts_0.8.0 ggplotify_0.1.0 plotly_4.10.0
[139] xtable_1.8-4 jsonlite_1.8.0 ggtree_3.0.4
[142] tidygraph_1.2.1 ggfun_0.0.6 R6_2.5.1
[145] pillar_1.7.0 htmltools_0.5.2 mime_0.12
[148] glue_1.6.2 fastmap_1.1.0 BiocParallel_1.26.2
[151] codetools_0.2-18 utf8_1.2.2 lattice_0.20-45
[154] bslib_0.3.1 spatstat.sparse_2.1-1 leiden_0.3.10
[157] GO.db_3.13.0 limma_3.48.3 survival_3.3-1
[160] rmarkdown_2.14 munsell_0.5.0 DO.db_2.9
[163] GenomeInfoDbData_1.2.6 haven_2.5.0 reshape2_1.4.4
[166] gtable_0.3.0 spatstat.core_2.4-2