AF_HF_SNPs
Renee Matthews
2025-05-09
Last updated: 2025-07-29
Checks: 7 0
Knit directory: ATAC_learning/
This reproducible R Markdown analysis was created with workflowr (version 1.7.1). The Checks tab describes the reproducibility checks that were applied when the results were created. The Past versions tab lists the development history.
Great! Since the R Markdown file has been committed to the Git repository, you know the exact version of the code that produced these results.
Great job! The global environment was empty. Objects defined in the global environment can affect the analysis in your R Markdown file in unknown ways. For reproduciblity it’s best to always run the code in an empty environment.
The command set.seed(20231016) was run prior to running
the code in the R Markdown file. Setting a seed ensures that any results
that rely on randomness, e.g. subsampling or permutations, are
reproducible.
Great job! Recording the operating system, R version, and package versions is critical for reproducibility.
Nice! There were no cached chunks for this analysis, so you can be confident that you successfully produced the results during this run.
Great job! Using relative paths to the files within your workflowr project makes it easier to run your code on other machines.
Great! You are using Git for version control. Tracking code development and connecting the code version to the results is critical for reproducibility.
The results in this page were generated with repository version 9f23163. See the Past versions tab to see a history of the changes made to the R Markdown and HTML files.
Note that you need to be careful to ensure that all relevant files for
the analysis have been committed to Git prior to generating the results
(you can use wflow_publish or
wflow_git_commit). workflowr only checks the R Markdown
file, but you know if there are other scripts or data files that it
depends on. Below is the status of the Git repository when the results
were generated:
Ignored files:
    Ignored:    .RData
    Ignored:    .Rhistory
    Ignored:    .Rproj.user/
    Ignored:    analysis/H3K27ac_integration_noM.Rmd
    Ignored:    data/ACresp_SNP_table.csv
    Ignored:    data/ARR_SNP_table.csv
    Ignored:    data/All_merged_peaks.tsv
    Ignored:    data/CAD_gwas_dataframe.RDS
    Ignored:    data/CTX_SNP_table.csv
    Ignored:    data/Collapsed_expressed_NG_peak_table.csv
    Ignored:    data/DEG_toplist_sep_n45.RDS
    Ignored:    data/FRiP_first_run.txt
    Ignored:    data/Final_four_data/
    Ignored:    data/Frip_1_reads.csv
    Ignored:    data/Frip_2_reads.csv
    Ignored:    data/Frip_3_reads.csv
    Ignored:    data/Frip_4_reads.csv
    Ignored:    data/Frip_5_reads.csv
    Ignored:    data/Frip_6_reads.csv
    Ignored:    data/GO_KEGG_analysis/
    Ignored:    data/HF_SNP_table.csv
    Ignored:    data/Ind1_75DA24h_dedup_peaks.csv
    Ignored:    data/Ind1_TSS_peaks.RDS
    Ignored:    data/Ind1_firstfragment_files.txt
    Ignored:    data/Ind1_fragment_files.txt
    Ignored:    data/Ind1_peaks_list.RDS
    Ignored:    data/Ind1_summary.txt
    Ignored:    data/Ind2_TSS_peaks.RDS
    Ignored:    data/Ind2_fragment_files.txt
    Ignored:    data/Ind2_peaks_list.RDS
    Ignored:    data/Ind2_summary.txt
    Ignored:    data/Ind3_TSS_peaks.RDS
    Ignored:    data/Ind3_fragment_files.txt
    Ignored:    data/Ind3_peaks_list.RDS
    Ignored:    data/Ind3_summary.txt
    Ignored:    data/Ind4_79B24h_dedup_peaks.csv
    Ignored:    data/Ind4_TSS_peaks.RDS
    Ignored:    data/Ind4_V24h_fraglength.txt
    Ignored:    data/Ind4_fragment_files.txt
    Ignored:    data/Ind4_fragment_filesN.txt
    Ignored:    data/Ind4_peaks_list.RDS
    Ignored:    data/Ind4_summary.txt
    Ignored:    data/Ind5_TSS_peaks.RDS
    Ignored:    data/Ind5_fragment_files.txt
    Ignored:    data/Ind5_fragment_filesN.txt
    Ignored:    data/Ind5_peaks_list.RDS
    Ignored:    data/Ind5_summary.txt
    Ignored:    data/Ind6_TSS_peaks.RDS
    Ignored:    data/Ind6_fragment_files.txt
    Ignored:    data/Ind6_peaks_list.RDS
    Ignored:    data/Ind6_summary.txt
    Ignored:    data/Knowles_4.RDS
    Ignored:    data/Knowles_5.RDS
    Ignored:    data/Knowles_6.RDS
    Ignored:    data/LiSiLTDNRe_TE_df.RDS
    Ignored:    data/MI_gwas.RDS
    Ignored:    data/SNP_GWAS_PEAK_MRC_id
    Ignored:    data/SNP_GWAS_PEAK_MRC_id.csv
    Ignored:    data/SNP_gene_cat_list.tsv
    Ignored:    data/SNP_supp_schneider.RDS
    Ignored:    data/TE_info/
    Ignored:    data/TFmapnames.RDS
    Ignored:    data/all_TSSE_scores.RDS
    Ignored:    data/all_four_filtered_counts.txt
    Ignored:    data/aln_run1_results.txt
    Ignored:    data/anno_ind1_DA24h.RDS
    Ignored:    data/anno_ind4_V24h.RDS
    Ignored:    data/annotated_gwas_SNPS.csv
    Ignored:    data/background_n45_he_peaks.RDS
    Ignored:    data/cardiac_muscle_FRIP.csv
    Ignored:    data/cardiomyocyte_FRIP.csv
    Ignored:    data/col_ng_peak.csv
    Ignored:    data/cormotif_full_4_run.RDS
    Ignored:    data/cormotif_full_4_run_he.RDS
    Ignored:    data/cormotif_full_6_run.RDS
    Ignored:    data/cormotif_full_6_run_he.RDS
    Ignored:    data/cormotif_probability_45_list.csv
    Ignored:    data/cormotif_probability_45_list_he.csv
    Ignored:    data/cormotif_probability_all_6_list.csv
    Ignored:    data/cormotif_probability_all_6_list_he.csv
    Ignored:    data/datasave.RDS
    Ignored:    data/embryo_heart_FRIP.csv
    Ignored:    data/enhancer_list_ENCFF126UHK.bed
    Ignored:    data/enhancerdata/
    Ignored:    data/filt_Peaks_efit2.RDS
    Ignored:    data/filt_Peaks_efit2_bl.RDS
    Ignored:    data/filt_Peaks_efit2_n45.RDS
    Ignored:    data/first_Peaksummarycounts.csv
    Ignored:    data/first_run_frag_counts.txt
    Ignored:    data/full_bedfiles/
    Ignored:    data/gene_ref.csv
    Ignored:    data/gwas_1_dataframe.RDS
    Ignored:    data/gwas_2_dataframe.RDS
    Ignored:    data/gwas_3_dataframe.RDS
    Ignored:    data/gwas_4_dataframe.RDS
    Ignored:    data/gwas_5_dataframe.RDS
    Ignored:    data/high_conf_peak_counts.csv
    Ignored:    data/high_conf_peak_counts.txt
    Ignored:    data/high_conf_peaks_bl_counts.txt
    Ignored:    data/high_conf_peaks_counts.txt
    Ignored:    data/hits_files/
    Ignored:    data/hyper_files/
    Ignored:    data/hypo_files/
    Ignored:    data/ind1_DA24hpeaks.RDS
    Ignored:    data/ind1_TSSE.RDS
    Ignored:    data/ind2_TSSE.RDS
    Ignored:    data/ind3_TSSE.RDS
    Ignored:    data/ind4_TSSE.RDS
    Ignored:    data/ind4_V24hpeaks.RDS
    Ignored:    data/ind5_TSSE.RDS
    Ignored:    data/ind6_TSSE.RDS
    Ignored:    data/initial_complete_stats_run1.txt
    Ignored:    data/left_ventricle_FRIP.csv
    Ignored:    data/median_24_lfc.RDS
    Ignored:    data/median_3_lfc.RDS
    Ignored:    data/mergedPeads.gff
    Ignored:    data/mergedPeaks.gff
    Ignored:    data/motif_list_full
    Ignored:    data/motif_list_n45
    Ignored:    data/motif_list_n45.RDS
    Ignored:    data/multiqc_fastqc_run1.txt
    Ignored:    data/multiqc_fastqc_run2.txt
    Ignored:    data/multiqc_genestat_run1.txt
    Ignored:    data/multiqc_genestat_run2.txt
    Ignored:    data/my_hc_filt_counts.RDS
    Ignored:    data/my_hc_filt_counts_n45.RDS
    Ignored:    data/n45_bedfiles/
    Ignored:    data/n45_files
    Ignored:    data/other_papers/
    Ignored:    data/peakAnnoList_1.RDS
    Ignored:    data/peakAnnoList_2.RDS
    Ignored:    data/peakAnnoList_24_full.RDS
    Ignored:    data/peakAnnoList_24_n45.RDS
    Ignored:    data/peakAnnoList_3.RDS
    Ignored:    data/peakAnnoList_3_full.RDS
    Ignored:    data/peakAnnoList_3_n45.RDS
    Ignored:    data/peakAnnoList_4.RDS
    Ignored:    data/peakAnnoList_5.RDS
    Ignored:    data/peakAnnoList_6.RDS
    Ignored:    data/peakAnnoList_Eight.RDS
    Ignored:    data/peakAnnoList_full_motif.RDS
    Ignored:    data/peakAnnoList_n45_motif.RDS
    Ignored:    data/siglist_full.RDS
    Ignored:    data/siglist_n45.RDS
    Ignored:    data/summarized_peaks_dataframe.txt
    Ignored:    data/summary_peakIDandReHeat.csv
    Ignored:    data/test.list.RDS
    Ignored:    data/testnames.txt
    Ignored:    data/toplist_6.RDS
    Ignored:    data/toplist_full.RDS
    Ignored:    data/toplist_full_DAR_6.RDS
    Ignored:    data/toplist_n45.RDS
    Ignored:    data/trimmed_seq_length.csv
    Ignored:    data/unclassified_full_set_peaks.RDS
    Ignored:    data/unclassified_n45_set_peaks.RDS
    Ignored:    data/xstreme/

Untracked files:
    Untracked:  RNA_seq_integration.Rmd
    Untracked:  Rplot.pdf
    Untracked:  Sig_meta
    Untracked:  analysis/.gitignore
    Untracked:  analysis/Cormotif_analysis_testing diff.Rmd
    Untracked:  analysis/Diagnosis-tmm.Rmd
    Untracked:  analysis/Expressed_RNA_associations.Rmd
    Untracked:  analysis/LFC_corr.Rmd
    Untracked:  analysis/SVA.Rmd
    Untracked:  analysis/Tan2020.Rmd
    Untracked:  analysis/making_master_peaks_list.Rmd
    Untracked:  analysis/my_hc_filt_counts.csv
    Untracked:  code/Concatenations_for_export.R
    Untracked:  code/IGV_snapshot_code.R
    Untracked:  code/LongDARlist.R
    Untracked:  code/just_for_Fun.R
    Untracked:  my_plot.pdf
    Untracked:  my_plot.png
    Untracked:  output/cormotif_probability_45_list.csv
    Untracked:  output/cormotif_probability_all_6_list.csv
    Untracked:  setup.RData

Unstaged changes:
    Modified:   ATAC_learning.Rproj
    Modified:   analysis/AC_shared_analysis.Rmd
    Modified:   analysis/AF_HF_SNPs.Rmd
    Modified:   analysis/Cardiotox_SNPs.Rmd
    Modified:   analysis/Cormotif_analysis.Rmd
    Modified:   analysis/DEG_analysis.Rmd
    Modified:   analysis/H3K27ac_initial_QC.Rmd
    Modified:   analysis/H3K27ac_integration.Rmd
    Modified:   analysis/Jaspar_motif.Rmd
    Modified:   analysis/Jaspar_motif_ff.Rmd
    Modified:   analysis/TE_analysis_norm.Rmd
    Modified:   analysis/Top2B_analysis.Rmd
    Modified:   analysis/final_four_analysis.Rmd
Note that any generated files, e.g. HTML, png, CSS, etc., are not included in this status report because it is ok for generated content to have uncommitted changes.
These are the previous versions of the repository in which changes were
made to the R Markdown (analysis/AF_HF_SNP_DAR.Rmd) and
HTML (docs/AF_HF_SNP_DAR.html) files. If you’ve configured
a remote Git repository (see ?wflow_git_remote), click on
the hyperlinks in the table below to view the files as they were in that
past version.
| File | Version | Author | Date | Message |
|---|---|---|---|---|
| Rmd | 9f23163 | reneeisnowhere | 2025-07-29 | updates to heatmaps |
| html | 2baaf88 | reneeisnowhere | 2025-07-28 | Build site. |
| Rmd | f5bad16 | reneeisnowhere | 2025-07-28 | adding odds ration plot |
| html | 88047ef | reneeisnowhere | 2025-07-28 | Build site. |
| Rmd | 3e7c4ce | reneeisnowhere | 2025-07-28 | BH_correction |
library(tidyverse)
library(kableExtra)
library(broom)
library(RColorBrewer)
library("TxDb.Hsapiens.UCSC.hg38.knownGene")
library("org.Hs.eg.db")
library(rtracklayer)
library(ggfortify)
library(readr)
library(BiocGenerics)
library(gridExtra)
library(VennDiagram)
library(scales)
library(ggVennDiagram)
library(BiocParallel)
library(ggpubr)
library(edgeR)
library(genomation)
library(ggsignif)
library(plyranges)
library(ggrepel)
library(ComplexHeatmap)
library(cowplot)
library(smplot2)
library(readxl)
library(devtools)
library(vargen)
library(liftOver)
Loading Atrial Fibrillation and Heart Failure SNPs and I
gwas_HF <- readRDS("data/other_papers/HF_gwas_association_downloaded_2025_01_23_EFO_0003144_withChildTraits.RDS")

gwas_ARR <- readRDS("data/other_papers/AF_gwas_association_downloaded_2025_01_23_EFO_0000275.RDS")

gwas_IHD   <- readRDS("data/other_papers/IHD_IHD_gwas_association_downloaded_2025_06_26_EFO_1001375_withChildTraits")
gwas_CAD <- readRDS( "data/CAD_gwas_dataframe.RDS")
gwas_ACresp <- readRDS("data/gwas_3_dataframe.RDS")
Short_gwas_gr <-
  gwas_ARR %>%
          distinct(SNPS,.keep_all = TRUE) %>%
          dplyr::select(CHR_ID, CHR_POS,SNPS) %>%
          mutate(gwas="AF") %>%
   rbind(gwas_HF %>%
          distinct(SNPS,.keep_all = TRUE) %>%
          dplyr::select(CHR_ID, CHR_POS,SNPS) %>%
          mutate(gwas="HF")) %>%
  rbind(gwas_IHD %>%
          distinct(SNPS,.keep_all = TRUE) %>%
          dplyr::select(CHR_ID, CHR_POS,SNPS) %>%
          mutate(gwas="IHD")) %>%
  rbind(gwas_CAD %>%
          distinct(SNPS,.keep_all = TRUE) %>%
          dplyr::select(CHR_ID, CHR_POS,SNPS) %>%
          mutate(gwas="CAD")) %>%

  na.omit() %>%
 mutate(seqnames=paste0("chr",CHR_ID), CHR_POS=as.numeric(CHR_POS)) %>%
  na.omit() %>%
   mutate(start=CHR_POS, end=CHR_POS, width=1) %>%
  GRanges()
Loading ATAC-seq regions
toptable_results <- readRDS("data/Final_four_data/re_analysis/Toptable_results.RDS")

all_results  <- toptable_results %>%
  imap(~ .x %>% tibble::rownames_to_column(var = "rowname") %>%
         mutate(source = .y)) %>%
  bind_rows()

DOX_3_sig <-all_results %>%
  dplyr::select(source,genes, logFC,adj.P.Val) %>%
  mutate("Peakid"=genes) %>%
  dplyr::filter(source=="DOX_3") %>%
   dplyr::filter(adj.P.Val<0.05)

DOX_24_sig <-all_results %>%
  dplyr::select(source,genes, logFC,adj.P.Val) %>%
  mutate("Peakid"=genes) %>%
  dplyr::filter(source=="DOX_24") %>%
   dplyr::filter(adj.P.Val<0.05)

EPI_3_sig <-all_results %>%
  dplyr::select(source,genes, logFC,adj.P.Val) %>%
  mutate("Peakid"=genes) %>%
  dplyr::filter(source=="EPI_3") %>%
   dplyr::filter(adj.P.Val<0.05)

EPI_24_sig <-all_results %>%
  dplyr::select(source,genes, logFC,adj.P.Val) %>%
  mutate("Peakid"=genes) %>%
  dplyr::filter(source=="EPI_24") %>%
   dplyr::filter(adj.P.Val<0.05)

DNR_3_sig <-all_results %>%
  dplyr::select(source,genes, logFC,adj.P.Val) %>%
  mutate("Peakid"=genes) %>%
  dplyr::filter(source=="DNR_3") %>%
   dplyr::filter(adj.P.Val<0.05)

DNR_24_sig <-all_results %>%
  dplyr::select(source,genes, logFC,adj.P.Val) %>%
  mutate("Peakid"=genes) %>%
  dplyr::filter(source=="DNR_24") %>%
   dplyr::filter(adj.P.Val<0.05)

MTX_3_sig <-all_results %>%
  dplyr::select(source,genes, logFC,adj.P.Val) %>%
  mutate("Peakid"=genes) %>%
  dplyr::filter(source=="MTX_3") %>%
   dplyr::filter(adj.P.Val<0.05)

MTX_24_sig <-all_results %>%
  dplyr::select(source,genes, logFC,adj.P.Val) %>%
  mutate("Peakid"=genes) %>%
  dplyr::filter(source=="MTX_24") %>%
   dplyr::filter(adj.P.Val<0.05)

all_regions_gr <- all_results %>%
  dplyr::select(source,genes, logFC,adj.P.Val) %>%
  mutate("Peakid"=genes) %>%
  dplyr::filter(source=="DOX_3") %>%
  distinct(Peakid) %>%
  separate_wider_delim(., cols="Peakid",names = c("seqnames","start","end"), delim= ".", cols_remove = FALSE) %>%
  makeGRangesFromDataFrame(.,keep.extra.columns=TRUE)

all_regions_peak <- all_results %>%
  dplyr::select(source,genes, logFC,adj.P.Val) %>%
  mutate("Peakid"=genes) %>%
  dplyr::filter(source=="DOX_3") %>%
  distinct(Peakid)
MCF7_DARs_hyper <- read_excel("C:/Users/renee/Downloads/MCF7-doxATAC/Table 4.XLSX",
sheet = "hyper") %>% GRanges()
MCF7_DARs_hypo <- read_excel("C:/Users/renee/Downloads/MCF7-doxATAC/Table 4.XLSX",
sheet = "hypo") %>% GRanges()
MCF7_DARs_hyper$names <- paste0("hyper_", seq_along(seqnames(MCF7_DARs_hyper)))
MCF7_DARs_hypo$names <- paste0("hypo_", seq_along(seqnames(MCF7_DARs_hypo)))
MCF7_ARsmcf7_1 <- read_excel("C:/Users/renee/Downloads/MCF7-doxATAC/Table 3.XLSX") %>%
GRanges()ch = import.chain("C:/Users/renee/ATAC_folder/liftOver_genome/hg19ToHg38.over.chain")
MCF7_DARs_hyper_LO <- as.data.frame(liftOver(MCF7_DARs_hyper,ch)) %>%
GRanges()
MCF7_DARs_hypo_LO <- as.data.frame(liftOver(MCF7_DARs_hypo,ch)) %>%
GRanges()
MCF7_DAR_all <- c(MCF7_DARs_hyper_LO,MCF7_DARs_hypo_LO)
MCF7_ARsmcf7_1_LO <- as.data.frame(liftOver(MCF7_ARsmcf7_1,ch)) %>%
GRanges()Overlapping ATAC regions and SNPs
AF_ol_peaks <-   join_overlap_inner(all_regions_gr, Short_gwas_gr) %>%
  as.data.frame() %>%
  dplyr::filter(gwas =="AF") %>%
  distinct(Peakid)

HF_ol_peaks <-   join_overlap_inner(all_regions_gr, Short_gwas_gr) %>%
  as.data.frame() %>%
  dplyr::filter(gwas =="HF") %>%
  distinct(Peakid)

IHD_ol_peaks <-   join_overlap_inner(all_regions_gr, Short_gwas_gr) %>%
  as.data.frame() %>%
  dplyr::filter(gwas =="IHD") %>%
  distinct(Peakid)

CAD_ol_peaks <-   join_overlap_inner(all_regions_gr, Short_gwas_gr) %>%
  as.data.frame() %>%
  dplyr::filter(gwas =="CAD") %>%
  distinct(Peakid)
HF_AF_ol <- join_overlap_inner(all_regions_gr, Short_gwas_gr) %>%
  as.data.frame() %>%
  dplyr::filter(gwas =="AF"|gwas=="HF")

SNP_overlaps <- join_overlap_inner(all_regions_gr, Short_gwas_gr) %>%
  as.data.frame() #%>% saveRDS(.,
                  # "data/Final_four_data/re_analysis/GWAS_overlaps_dataframe.RDS")
gwas_annote_df <-all_regions_peak %>%
mutate(AF_status=case_when(Peakid %in% AF_ol_peaks$Peakid ~"AF_peak",
TRUE~ "not_AF_peak"),
HF_status=case_when(Peakid %in% HF_ol_peaks$Peakid ~"HF_peak",
TRUE~ "not_HF_peak"),
CAD_status=case_when(Peakid %in% CAD_ol_peaks$Peakid ~"CAD_peak",
TRUE~ "not_CAD_peak"),
IHD_status=case_when(Peakid %in% IHD_ol_peaks$Peakid ~"IHD_peak",
TRUE~ "not_IHD_peak")) %>%
mutate(DOX_3=case_when(Peakid %in% DOX_3_sig$Peakid ~"sig_peak",
TRUE~ "not_sig_peak")) %>%
mutate(DOX_24=case_when(Peakid %in% DOX_24_sig$Peakid ~"sig_peak",
TRUE~ "not_sig_peak")) %>%
mutate(EPI_3=case_when(Peakid %in% EPI_3_sig$Peakid ~"sig_peak",
TRUE~ "not_sig_peak")) %>%
mutate(EPI_24=case_when(Peakid %in% EPI_24_sig$Peakid ~"sig_peak",
TRUE~ "not_sig_peak")) %>%
mutate(DNR_3=case_when(Peakid %in% DNR_3_sig$Peakid ~"sig_peak",
TRUE~ "not_sig_peak")) %>%
mutate(DNR_24=case_when(Peakid %in% DNR_24_sig$Peakid ~"sig_peak",
TRUE~ "not_sig_peak")) %>%
mutate(MTX_3=case_when(Peakid %in% MTX_3_sig$Peakid ~"sig_peak",
TRUE~ "not_sig_peak")) %>%
mutate(MTX_24=case_when(Peakid %in% MTX_24_sig$Peakid ~"sig_peak",
TRUE~ "not_sig_peak"))
# saveRDS(gwas_annote_df,"data/Final_four_data/re_analysis/GWAS_SNP_annotations.RDS")Testing for enrichment: ### DOX enrichment tests
 gwas_annote_df %>%
  group_by(DOX_3,AF_status) %>%
  tally() %>%
  pivot_wider(., DOX_3, names_from = AF_status, values_from = n) %>%
  arrange(desc(DOX_3)) %>%
  print() %>%
  column_to_rownames("DOX_3") %>%
  fisher.test(.)
# A tibble: 2 × 3
# Groups: DOX_3 [2]
DOX_3 AF_peak not_AF_peak
<chr> <int> <int>
1 sig_peak 5 3468
2 not_sig_peak 71 152013
    Fisher's Exact Test for Count Data

data:  .
p-value = 0.02774
alternative hypothesis: true odds ratio is not equal to 1
95 percent confidence interval:
 0.9718879 7.5547025
sample estimates:
odds ratio
  3.086745
DOX_darsnp_3_AF <- gwas_annote_df %>%
group_by(DOX_3,AF_status) %>%
tally() %>%
pivot_wider(., DOX_3, names_from = AF_status, values_from = n) %>%
arrange(desc(DOX_3)) %>%
column_to_rownames("DOX_3") %>%
fisher.test(.)gwas_annote_df %>%
group_by(DOX_24,AF_status) %>%
tally() %>%
pivot_wider(., DOX_24, names_from = AF_status, values_from = n) %>%
arrange(desc(DOX_24)) %>%
print() %>%
column_to_rownames("DOX_24") %>%
fisher.test(.)# A tibble: 2 × 3
# Groups: DOX_24 [2]
DOX_24 AF_peak not_AF_peak
<chr> <int> <int>
1 sig_peak 34 64786
2 not_sig_peak 42 90695
    Fisher's Exact Test for Count Data

data:  .
p-value = 0.6419
alternative hypothesis: true odds ratio is not equal to 1
95 percent confidence interval:
 0.6991766 1.8248197
sample estimates:
odds ratio
  1.133263
DOX_darsnp_24_AF <- gwas_annote_df %>%
group_by(DOX_24,AF_status) %>%
tally() %>%
pivot_wider(., DOX_24, names_from = AF_status, values_from = n) %>%
arrange(desc(DOX_24)) %>%
column_to_rownames("DOX_24") %>%
fisher.test(.)gwas_annote_df %>%
group_by(DOX_3,HF_status) %>%
tally() %>%
pivot_wider(., DOX_3, names_from = HF_status, values_from = n) %>%
arrange(desc(DOX_3)) %>%
print() %>%
column_to_rownames("DOX_3") %>%
fisher.test(.)# A tibble: 2 × 3
# Groups: DOX_3 [2]
DOX_3 HF_peak not_HF_peak
<chr> <int> <int>
1 sig_peak 1 3472
2 not_sig_peak 28 152056
    Fisher's Exact Test for Count Data

data:  .
p-value = 0.4805
alternative hypothesis: true odds ratio is not equal to 1
95 percent confidence interval:
 0.038240 9.465039
sample estimates:
odds ratio
  1.564073
DOX_darsnp_3_HF <- gwas_annote_df %>%
group_by(DOX_3,HF_status) %>%
tally() %>%
pivot_wider(., DOX_3, names_from = HF_status, values_from = n) %>%
arrange(desc(DOX_3)) %>%
column_to_rownames("DOX_3") %>%
fisher.test(.)gwas_annote_df %>%
group_by(DOX_24,HF_status) %>%
tally() %>%
pivot_wider(., DOX_24, names_from = HF_status, values_from = n) %>%
arrange(desc(DOX_24)) %>%
print() %>%
column_to_rownames("DOX_24") %>%
fisher.test(.)# A tibble: 2 × 3
# Groups: DOX_24 [2]
DOX_24 HF_peak not_HF_peak
<chr> <int> <int>
1 sig_peak 14 64806
2 not_sig_peak 15 90722
    Fisher's Exact Test for Count Data

data:  .
p-value = 0.5727
alternative hypothesis: true odds ratio is not equal to 1
95 percent confidence interval:
 0.5842783 2.9036690
sample estimates:
odds ratio
  1.306558
DOX_darsnp_24_HF <- gwas_annote_df %>%
group_by(DOX_24,HF_status) %>%
tally() %>%
pivot_wider(., DOX_24, names_from = HF_status, values_from = n) %>%
arrange(desc(DOX_24)) %>%
column_to_rownames("DOX_24") %>%
fisher.test(.)gwas_annote_df %>%
group_by(DOX_3,IHD_status) %>%
tally() %>%
pivot_wider(., DOX_3, names_from = IHD_status, values_from = n, values_fill = 0) %>%
arrange(desc(DOX_3))%>%
print() %>%
column_to_rownames("DOX_3") %>%
fisher.test(.)# A tibble: 2 × 3
# Groups: DOX_3 [2]
DOX_3 IHD_peak not_IHD_peak
<chr> <int> <int>
1 sig_peak 0 3473
2 not_sig_peak 7 152077
    Fisher's Exact Test for Count Data

data:  .
p-value = 1
alternative hypothesis: true odds ratio is not equal to 1
95 percent confidence interval:
  0.00000 30.37975
sample estimates:
odds ratio
         0
DOX_darsnp_3_IHD <- gwas_annote_df %>%
group_by(DOX_3,IHD_status) %>%
tally() %>%
pivot_wider(., DOX_3, names_from = IHD_status, values_from = n, values_fill = 0) %>%
arrange(desc(DOX_3))%>%
column_to_rownames("DOX_3") %>%
fisher.test(.)gwas_annote_df %>%
group_by(DOX_24,IHD_status) %>%
tally() %>%
pivot_wider(., DOX_24, names_from = IHD_status, values_from = n, values_fill = 0) %>%
arrange(desc(DOX_24)) %>%
print() %>%
column_to_rownames("DOX_24") %>%
fisher.test(.)# A tibble: 2 × 3
# Groups: DOX_24 [2]
DOX_24 IHD_peak not_IHD_peak
<chr> <int> <int>
1 sig_peak 3 64817
2 not_sig_peak 4 90733
    Fisher's Exact Test for Count Data

data:  .
p-value = 1
alternative hypothesis: true odds ratio is not equal to 1
95 percent confidence interval:
 0.1537767 6.2053650
sample estimates:
odds ratio
  1.049845
DOX_darsnp_24_IHD <- gwas_annote_df %>%
group_by(DOX_24,IHD_status) %>%
tally() %>%
pivot_wider(., DOX_24, names_from = IHD_status, values_from = n, values_fill = 0) %>%
arrange(desc(DOX_24)) %>%
column_to_rownames("DOX_24") %>%
fisher.test(.)gwas_annote_df %>%
group_by(DOX_3,CAD_status) %>%
tally() %>%
pivot_wider(., DOX_3, names_from = CAD_status, values_from = n) %>%
arrange(desc(DOX_3)) %>%
print() %>%
column_to_rownames("DOX_3") %>%
fisher.test(.)# A tibble: 2 × 3
# Groups: DOX_3 [2]
DOX_3 CAD_peak not_CAD_peak
<chr> <int> <int>
1 sig_peak 2 3471
2 not_sig_peak 136 151948
    Fisher's Exact Test for Count Data

data:  .
p-value = 0.7736
alternative hypothesis: true odds ratio is not equal to 1
95 percent confidence interval:
 0.07714899 2.37238460
sample estimates:
odds ratio
 0.6437719
DOX_darsnp_3_CAD <- gwas_annote_df %>%
group_by(DOX_3,CAD_status) %>%
tally() %>%
pivot_wider(., DOX_3, names_from = CAD_status, values_from = n) %>%
arrange(desc(DOX_3)) %>%
column_to_rownames("DOX_3") %>%
fisher.test(.)gwas_annote_df %>%
group_by(DOX_24,CAD_status) %>%
tally() %>%
pivot_wider(., DOX_24, names_from = CAD_status, values_from = n) %>%
arrange(desc(DOX_24)) %>%
print() %>%
column_to_rownames("DOX_24") %>%
fisher.test(.)# A tibble: 2 × 3
# Groups: DOX_24 [2]
DOX_24 CAD_peak not_CAD_peak
<chr> <int> <int>
1 sig_peak 59 64761
2 not_sig_peak 79 90658
    Fisher's Exact Test for Count Data

data:  .
p-value = 0.7962
alternative hypothesis: true odds ratio is not equal to 1
95 percent confidence interval:
 0.7331472 1.4837782
sample estimates:
odds ratio
  1.045516
DOX_darsnp_24_CAD <- gwas_annote_df %>%
group_by(DOX_24,CAD_status) %>%
tally() %>%
pivot_wider(., DOX_24, names_from = CAD_status, values_from = n) %>%
arrange(desc(DOX_24)) %>%
column_to_rownames("DOX_24") %>%
fisher.test(.)EPI enrichment tests
 gwas_annote_df %>%
  group_by(EPI_3,AF_status) %>%
  tally() %>%
  pivot_wider(., EPI_3, names_from = AF_status, values_from = n) %>%
  arrange(desc(EPI_3)) %>%
  print() %>%
  column_to_rownames("EPI_3") %>%
  fisher.test(.)
# A tibble: 2 × 3
# Groups: EPI_3 [2]
EPI_3 AF_peak not_AF_peak
<chr> <int> <int>
1 sig_peak 14 14220
2 not_sig_peak 62 141261
    Fisher's Exact Test for Count Data

data:  .
p-value = 0.00924
alternative hypothesis: true odds ratio is not equal to 1
95 percent confidence interval:
 1.159315 4.053255
sample estimates:
odds ratio
  2.243075
EPI_darsnp_3_AF <- gwas_annote_df %>%
group_by(EPI_3,AF_status) %>%
tally() %>%
pivot_wider(., EPI_3, names_from = AF_status, values_from = n) %>%
arrange(desc(EPI_3)) %>%
column_to_rownames("EPI_3") %>%
fisher.test(.)gwas_annote_df %>%
group_by(EPI_24,AF_status) %>%
tally() %>%
pivot_wider(., EPI_24, names_from = AF_status, values_from = n) %>%
arrange(desc(EPI_24)) %>%
print() %>%
column_to_rownames("EPI_24") %>%
fisher.test(.)# A tibble: 2 × 3
# Groups: EPI_24 [2]
EPI_24 AF_peak not_AF_peak
<chr> <int> <int>
1 sig_peak 39 66462
2 not_sig_peak 37 89019
    Fisher's Exact Test for Count Data

data:  .
p-value = 0.1334
alternative hypothesis: true odds ratio is not equal to 1
95 percent confidence interval:
 0.8768983 2.2766348
sample estimates:
odds ratio
  1.411774
EPI_darsnp_24_AF <- gwas_annote_df %>%
group_by(EPI_24,AF_status) %>%
tally() %>%
pivot_wider(., EPI_24, names_from = AF_status, values_from = n) %>%
arrange(desc(EPI_24)) %>%
column_to_rownames("EPI_24") %>%
fisher.test(.)gwas_annote_df %>%
group_by(EPI_3,HF_status) %>%
tally() %>%
pivot_wider(., EPI_3, names_from = HF_status, values_from = n) %>%
arrange(desc(EPI_3)) %>%
print() %>%
column_to_rownames("EPI_3") %>%
fisher.test(.)# A tibble: 2 × 3
# Groups: EPI_3 [2]
EPI_3 HF_peak not_HF_peak
<chr> <int> <int>
1 sig_peak 3 14231
2 not_sig_peak 26 141297
    Fisher's Exact Test for Count Data

data:  .
p-value = 0.7452
alternative hypothesis: true odds ratio is not equal to 1
95 percent confidence interval:
 0.2219052 3.7390450
sample estimates:
odds ratio
   1.14563
EPI_darsnp_3_HF <- gwas_annote_df %>%
group_by(EPI_3,HF_status) %>%
tally() %>%
pivot_wider(., EPI_3, names_from = HF_status, values_from = n) %>%
arrange(desc(EPI_3)) %>%
column_to_rownames("EPI_3") %>%
fisher.test(.)gwas_annote_df %>%
group_by(EPI_24,HF_status) %>%
tally() %>%
pivot_wider(., EPI_24, names_from = HF_status, values_from = n) %>%
arrange(desc(EPI_24)) %>%
print() %>%
column_to_rownames("EPI_24") %>%
fisher.test(.)# A tibble: 2 × 3
# Groups: EPI_24 [2]
EPI_24 HF_peak not_HF_peak
<chr> <int> <int>
1 sig_peak 15 66486
2 not_sig_peak 14 89042
    Fisher's Exact Test for Count Data

data:  .
p-value = 0.3521
alternative hypothesis: true odds ratio is not equal to 1
95 percent confidence interval:
 0.6457011 3.2086406
sample estimates:
odds ratio
  1.434896
EPI_darsnp_24_HF <- gwas_annote_df %>%
group_by(EPI_24,HF_status) %>%
tally() %>%
pivot_wider(., EPI_24, names_from = HF_status, values_from = n) %>%
arrange(desc(EPI_24)) %>%
column_to_rownames("EPI_24") %>%
fisher.test(.)gwas_annote_df %>%
group_by(EPI_3,IHD_status) %>%
tally() %>%
pivot_wider(., EPI_3, names_from = IHD_status, values_from = n, values_fill = 0) %>%
arrange(desc(EPI_3))%>%
print() %>%
column_to_rownames("EPI_3") %>%
fisher.test(.)# A tibble: 2 × 3
# Groups: EPI_3 [2]
EPI_3 IHD_peak not_IHD_peak
<chr> <int> <int>
1 sig_peak 0 14234
2 not_sig_peak 7 141316
    Fisher's Exact Test for Count Data

data:  .
p-value = 1
alternative hypothesis: true odds ratio is not equal to 1
95 percent confidence interval:
 0.000000 6.889309
sample estimates:
odds ratio
         0
EPI_darsnp_3_IHD <- gwas_annote_df %>%
group_by(EPI_3,IHD_status) %>%
tally() %>%
pivot_wider(., EPI_3, names_from = IHD_status, values_from = n, values_fill = 0) %>%
arrange(desc(EPI_3))%>%
column_to_rownames("EPI_3") %>%
fisher.test(.)gwas_annote_df %>%
group_by(EPI_24,IHD_status) %>%
tally() %>%
pivot_wider(., EPI_24, names_from = IHD_status, values_from = n, values_fill = 0) %>%
arrange(desc(EPI_24)) %>%
print() %>%
column_to_rownames("EPI_24") %>%
fisher.test(.)# A tibble: 2 × 3
# Groups: EPI_24 [2]
EPI_24 IHD_peak not_IHD_peak
<chr> <int> <int>
1 sig_peak 3 66498
2 not_sig_peak 4 89052
    Fisher's Exact Test for Count Data

data:  .
p-value = 1
alternative hypothesis: true odds ratio is not equal to 1
95 percent confidence interval:
 0.1471093 5.9381589
sample estimates:
odds ratio
  1.004376
EPI_darsnp_24_IHD <- gwas_annote_df %>%
group_by(EPI_24,IHD_status) %>%
tally() %>%
pivot_wider(., EPI_24, names_from = IHD_status, values_from = n, values_fill = 0) %>%
arrange(desc(EPI_24)) %>%
column_to_rownames("EPI_24") %>%
fisher.test(.)gwas_annote_df %>%
group_by(EPI_3,CAD_status) %>%
tally() %>%
pivot_wider(., EPI_3, names_from = CAD_status, values_from = n) %>%
arrange(desc(EPI_3)) %>%
print() %>%
column_to_rownames("EPI_3") %>%
fisher.test(.)# A tibble: 2 × 3
# Groups: EPI_3 [2]
EPI_3 CAD_peak not_CAD_peak
<chr> <int> <int>
1 sig_peak 18 14216
2 not_sig_peak 120 141203
    Fisher's Exact Test for Count Data

data:  .
p-value = 0.1367
alternative hypothesis: true odds ratio is not equal to 1
95 percent confidence interval:
 0.8537334 2.4575896
sample estimates:
odds ratio
  1.489886
EPI_darsnp_3_CAD <- gwas_annote_df %>%
group_by(EPI_3,CAD_status) %>%
tally() %>%
pivot_wider(., EPI_3, names_from = CAD_status, values_from = n) %>%
arrange(desc(EPI_3)) %>%
column_to_rownames("EPI_3") %>%
fisher.test(.)gwas_annote_df %>%
group_by(EPI_24,CAD_status) %>%
tally() %>%
pivot_wider(., EPI_24, names_from = CAD_status, values_from = n) %>%
arrange(desc(EPI_24)) %>%
print() %>%
column_to_rownames("EPI_24") %>%
fisher.test(.)# A tibble: 2 × 3
# Groups: EPI_24 [2]
EPI_24 CAD_peak not_CAD_peak
<chr> <int> <int>
1 sig_peak 58 66443
2 not_sig_peak 80 88976
    Fisher's Exact Test for Count Data

data:  .
p-value = 0.9315
alternative hypothesis: true odds ratio is not equal to 1
95 percent confidence interval:
 0.680080 1.378666
sample estimates:
odds ratio
 0.9708687
EPI_darsnp_24_CAD <- gwas_annote_df %>%
group_by(EPI_24,CAD_status) %>%
tally() %>%
pivot_wider(., EPI_24, names_from = CAD_status, values_from = n) %>%
arrange(desc(EPI_24)) %>%
column_to_rownames("EPI_24") %>%
fisher.test(.)DNR enrichment tests
 gwas_annote_df %>%
  group_by(DNR_3,AF_status) %>%
  tally() %>%
  pivot_wider(., DNR_3, names_from = AF_status, values_from = n) %>%
  arrange(desc(DNR_3)) %>%
  print() %>%
  column_to_rownames("DNR_3") %>%
  fisher.test(.)
# A tibble: 2 × 3
# Groups: DNR_3 [2]
DNR_3 AF_peak not_AF_peak
<chr> <int> <int>
1 sig_peak 21 22717
2 not_sig_peak 55 132764
    Fisher's Exact Test for Count Data

data:  .
p-value = 0.002992
alternative hypothesis: true odds ratio is not equal to 1
95 percent confidence interval:
 1.281504 3.750823
sample estimates:
odds ratio
  2.231432
DNR_darsnp_3_AF <- gwas_annote_df %>%
group_by(DNR_3,AF_status) %>%
tally() %>%
pivot_wider(., DNR_3, names_from = AF_status, values_from = n) %>%
arrange(desc(DNR_3)) %>%
column_to_rownames("DNR_3") %>%
fisher.test(.)gwas_annote_df %>%
group_by(DNR_24,AF_status) %>%
tally() %>%
pivot_wider(., DNR_24, names_from = AF_status, values_from = n) %>%
arrange(desc(DNR_24)) %>%
print() %>%
column_to_rownames("DNR_24") %>%
fisher.test(.)# A tibble: 2 × 3
# Groups: DNR_24 [2]
DNR_24 AF_peak not_AF_peak
<chr> <int> <int>
1 sig_peak 41 79954
2 not_sig_peak 35 75527
    Fisher's Exact Test for Count Data

data:  .
p-value = 0.7309
alternative hypothesis: true odds ratio is not equal to 1
95 percent confidence interval:
 0.6875137 1.7898588
sample estimates:
odds ratio
  1.106551
DNR_darsnp_24_AF <- gwas_annote_df %>%
group_by(DNR_24,AF_status) %>%
tally() %>%
pivot_wider(., DNR_24, names_from = AF_status, values_from = n) %>%
arrange(desc(DNR_24)) %>%
column_to_rownames("DNR_24") %>%
fisher.test(.)gwas_annote_df %>%
group_by(DNR_3,HF_status) %>%
tally() %>%
pivot_wider(., DNR_3, names_from = HF_status, values_from = n) %>%
arrange(desc(DNR_3)) %>%
print() %>%
column_to_rownames("DNR_3") %>%
fisher.test(.)# A tibble: 2 × 3
# Groups: DNR_3 [2]
DNR_3 HF_peak not_HF_peak
<chr> <int> <int>
1 sig_peak 6 22732
2 not_sig_peak 23 132796
    Fisher's Exact Test for Count Data

data:  .
p-value = 0.4252
alternative hypothesis: true odds ratio is not equal to 1
95 percent confidence interval:
 0.5075285 3.8506709
sample estimates:
odds ratio
   1.52394
DNR_darsnp_3_HF <- gwas_annote_df %>%
group_by(DNR_3,HF_status) %>%
tally() %>%
pivot_wider(., DNR_3, names_from = HF_status, values_from = n) %>%
arrange(desc(DNR_3)) %>%
column_to_rownames("DNR_3") %>%
fisher.test(.)gwas_annote_df %>%
group_by(DNR_24,HF_status) %>%
tally() %>%
pivot_wider(., DNR_24, names_from = HF_status, values_from = n) %>%
arrange(desc(DNR_24)) %>%
print() %>%
column_to_rownames("DNR_24") %>%
fisher.test(.)# A tibble: 2 × 3
# Groups: DNR_24 [2]
DNR_24 HF_peak not_HF_peak
<chr> <int> <int>
1 sig_peak 19 79976
2 not_sig_peak 10 75552
    Fisher's Exact Test for Count Data

data:  .
p-value = 0.1406
alternative hypothesis: true odds ratio is not equal to 1
95 percent confidence interval:
 0.7940266 4.3218505
sample estimates:
odds ratio
  1.794883
DNR_darsnp_24_HF <- gwas_annote_df %>%
group_by(DNR_24,HF_status) %>%
tally() %>%
pivot_wider(., DNR_24, names_from = HF_status, values_from = n) %>%
arrange(desc(DNR_24)) %>%
column_to_rownames("DNR_24") %>%
fisher.test(.)gwas_annote_df %>%
group_by(DNR_3,IHD_status) %>%
tally() %>%
pivot_wider(., DNR_3, names_from = IHD_status, values_from = n, values_fill = 0) %>%
arrange(desc(DNR_3))%>%
print() %>%
column_to_rownames("DNR_3") %>%
fisher.test(.)# A tibble: 2 × 3
# Groups: DNR_3 [2]
DNR_3 IHD_peak not_IHD_peak
<chr> <int> <int>
1 sig_peak 2 22736
2 not_sig_peak 5 132814
    Fisher's Exact Test for Count Data

data:  .
p-value = 0.2727
alternative hypothesis: true odds ratio is not equal to 1
95 percent confidence interval:
  0.2224883 14.2718586
sample estimates:
odds ratio
  2.336612
DNR_darsnp_3_IHD <- gwas_annote_df %>%
group_by(DNR_3,IHD_status) %>%
tally() %>%
pivot_wider(., DNR_3, names_from = IHD_status, values_from = n, values_fill = 0) %>%
arrange(desc(DNR_3))%>%
column_to_rownames("DNR_3") %>%
fisher.test(.)gwas_annote_df %>%
group_by(DNR_24,IHD_status) %>%
tally() %>%
pivot_wider(., DNR_24, names_from = IHD_status, values_from = n, values_fill = 0) %>%
arrange(desc(DNR_24)) %>%
print() %>%
column_to_rownames("DNR_24") %>%
fisher.test(.)# A tibble: 2 × 3
# Groups: DNR_24 [2]
DNR_24 IHD_peak not_IHD_peak
<chr> <int> <int>
1 sig_peak 3 79992
2 not_sig_peak 4 75558
    Fisher's Exact Test for Count Data

data:  .
p-value = 0.7194
alternative hypothesis: true odds ratio is not equal to 1
95 percent confidence interval:
 0.1037956 4.1876739
sample estimates:
odds ratio
 0.7084326
DNR_darsnp_24_IHD <- gwas_annote_df %>%
group_by(DNR_24,IHD_status) %>%
tally() %>%
pivot_wider(., DNR_24, names_from = IHD_status, values_from = n, values_fill = 0) %>%
arrange(desc(DNR_24)) %>%
column_to_rownames("DNR_24") %>%
fisher.test(.)gwas_annote_df %>%
group_by(DNR_3,CAD_status) %>%
tally() %>%
pivot_wider(., DNR_3, names_from = CAD_status, values_from = n) %>%
arrange(desc(DNR_3)) %>%
print() %>%
column_to_rownames("DNR_3") %>%
fisher.test(.)# A tibble: 2 × 3
# Groups: DNR_3 [2]
DNR_3 CAD_peak not_CAD_peak
<chr> <int> <int>
1 sig_peak 28 22710
2 not_sig_peak 110 132709
    Fisher's Exact Test for Count Data

data:  .
p-value = 0.06949
alternative hypothesis: true odds ratio is not equal to 1
95 percent confidence interval:
 0.9452147 2.2698345
sample estimates:
odds ratio
  1.487462
DNR_darsnp_3_CAD <- gwas_annote_df %>%
group_by(DNR_3,CAD_status) %>%
tally() %>%
pivot_wider(., DNR_3, names_from = CAD_status, values_from = n) %>%
arrange(desc(DNR_3)) %>%
column_to_rownames("DNR_3") %>%
fisher.test(.)gwas_annote_df %>%
group_by(DNR_24,CAD_status) %>%
tally() %>%
pivot_wider(., DNR_24, names_from = CAD_status, values_from = n) %>%
arrange(desc(DNR_24)) %>%
print() %>%
column_to_rownames("DNR_24") %>%
fisher.test(.)# A tibble: 2 × 3
# Groups: DNR_24 [2]
DNR_24 CAD_peak not_CAD_peak
<chr> <int> <int>
1 sig_peak 68 79927
2 not_sig_peak 70 75492
    Fisher's Exact Test for Count Data

data:  .
p-value = 0.6703
alternative hypothesis: true odds ratio is not equal to 1
95 percent confidence interval:
 0.6473026 1.2999857
sample estimates:
odds ratio
 0.9175381
DNR_darsnp_24_CAD <- gwas_annote_df %>%
group_by(DNR_24,CAD_status) %>%
tally() %>%
pivot_wider(., DNR_24, names_from = CAD_status, values_from = n) %>%
arrange(desc(DNR_24)) %>%
column_to_rownames("DNR_24") %>%
fisher.test(.)MTX enrichment tests
 gwas_annote_df %>%
  group_by(MTX_3,AF_status) %>%
  tally() %>%
  pivot_wider(., MTX_3, names_from = AF_status, values_from = n,values_fill = 0) %>%
  arrange(desc(MTX_3)) %>%
  print() %>%
  column_to_rownames("MTX_3") %>%
  fisher.test(.)
# A tibble: 2 × 3
# Groups: MTX_3 [2]
MTX_3 AF_peak not_AF_peak
<chr> <int> <int>
1 sig_peak 0 804
2 not_sig_peak 76 154677
    Fisher's Exact Test for Count Data

data:  .
p-value = 1
alternative hypothesis: true odds ratio is not equal to 1
95 percent confidence interval:
 0.000000 9.590161
sample estimates:
odds ratio
         0
MTX_darsnp_3_AF <- gwas_annote_df %>%
group_by(MTX_3,AF_status) %>%
tally() %>%
pivot_wider(., MTX_3, names_from = AF_status, values_from = n,values_fill = 0) %>%
arrange(desc(MTX_3)) %>%
column_to_rownames("MTX_3") %>%
fisher.test(.)gwas_annote_df %>%
group_by(MTX_24,AF_status) %>%
tally() %>%
pivot_wider(., MTX_24, names_from = AF_status, values_from = n) %>%
arrange(desc(MTX_24)) %>%
print() %>%
column_to_rownames("MTX_24") %>%
fisher.test(.)# A tibble: 2 × 3
# Groups: MTX_24 [2]
MTX_24 AF_peak not_AF_peak
<chr> <int> <int>
1 sig_peak 20 24230
2 not_sig_peak 56 131251
    Fisher's Exact Test for Count Data

data:  .
p-value = 0.01633
alternative hypothesis: true odds ratio is not equal to 1
95 percent confidence interval:
 1.099398 3.275113
sample estimates:
odds ratio
  1.934478
MTX_darsnp_24_AF <- gwas_annote_df %>%
group_by(MTX_24,AF_status) %>%
tally() %>%
pivot_wider(., MTX_24, names_from = AF_status, values_from = n) %>%
arrange(desc(MTX_24)) %>%
column_to_rownames("MTX_24") %>%
fisher.test(.)gwas_annote_df %>%
group_by(MTX_3,HF_status) %>%
tally() %>%
pivot_wider(., MTX_3, names_from = HF_status, values_from = n) %>%
arrange(desc(MTX_3)) %>%
print() %>%
column_to_rownames("MTX_3") %>%
fisher.test(.)# A tibble: 2 × 3
# Groups: MTX_3 [2]
MTX_3 HF_peak not_HF_peak
<chr> <int> <int>
1 sig_peak 1 803
2 not_sig_peak 28 154725
    Fisher's Exact Test for Count Data

data:  .
p-value = 0.1395
alternative hypothesis: true odds ratio is not equal to 1
95 percent confidence interval:
  0.1680849 41.7539207
sample estimates:
odds ratio
  6.880335
MTX_darsnp_3_HF <- gwas_annote_df %>%
group_by(MTX_3,HF_status) %>%
tally() %>%
pivot_wider(., MTX_3, names_from = HF_status, values_from = n) %>%
arrange(desc(MTX_3)) %>%
column_to_rownames("MTX_3") %>%
fisher.test(.)gwas_annote_df %>%
group_by(MTX_24,HF_status) %>%
tally() %>%
pivot_wider(., MTX_24, names_from = HF_status, values_from = n) %>%
arrange(desc(MTX_24)) %>%
print() %>%
column_to_rownames("MTX_24") %>%
fisher.test(.)# A tibble: 2 × 3
# Groups: MTX_24 [2]
MTX_24 HF_peak not_HF_peak
<chr> <int> <int>
1 sig_peak 10 24240
2 not_sig_peak 19 131288
    Fisher's Exact Test for Count Data

data:  .
p-value = 0.009723
alternative hypothesis: true odds ratio is not equal to 1
95 percent confidence interval:
 1.183787 6.443806
sample estimates:
odds ratio
  2.850689
MTX_darsnp_24_HF <- gwas_annote_df %>%
group_by(MTX_24,HF_status) %>%
tally() %>%
pivot_wider(., MTX_24, names_from = HF_status, values_from = n) %>%
arrange(desc(MTX_24)) %>%
column_to_rownames("MTX_24") %>%
fisher.test(.)gwas_annote_df %>%
group_by(MTX_3,IHD_status) %>%
tally() %>%
pivot_wider(., MTX_3, names_from = IHD_status, values_from = n, values_fill = 0) %>%
arrange(desc(MTX_3))%>%
print() %>%
column_to_rownames("MTX_3") %>%
fisher.test(.)# A tibble: 2 × 3
# Groups: MTX_3 [2]
MTX_3 IHD_peak not_IHD_peak
<chr> <int> <int>
1 sig_peak 0 804
2 not_sig_peak 7 154746
    Fisher's Exact Test for Count Data

data:  .
p-value = 1
alternative hypothesis: true odds ratio is not equal to 1
95 percent confidence interval:
   0.0000 133.7927
sample estimates:
odds ratio
         0
MTX_darsnp_3_IHD <- gwas_annote_df %>%
group_by(MTX_3,IHD_status) %>%
tally() %>%
pivot_wider(., MTX_3, names_from = IHD_status, values_from = n, values_fill = 0) %>%
arrange(desc(MTX_3))%>%
column_to_rownames("MTX_3") %>%
fisher.test(.)gwas_annote_df %>%
group_by(MTX_24,IHD_status) %>%
tally() %>%
pivot_wider(., MTX_24, names_from = IHD_status, values_from = n, values_fill = 0) %>%
arrange(desc(MTX_24)) %>%
print() %>%
column_to_rownames("MTX_24") %>%
fisher.test(.)# A tibble: 2 × 3
# Groups: MTX_24 [2]
MTX_24 IHD_peak not_IHD_peak
<chr> <int> <int>
1 sig_peak 2 24248
2 not_sig_peak 5 131302
    Fisher's Exact Test for Count Data

data:  .
p-value = 0.2999
alternative hypothesis: true odds ratio is not equal to 1
95 percent confidence interval:
  0.2062384 13.2298655
sample estimates:
odds ratio
  2.165985
MTX_darsnp_24_IHD <- gwas_annote_df %>%
group_by(MTX_24,IHD_status) %>%
tally() %>%
pivot_wider(., MTX_24, names_from = IHD_status, values_from = n, values_fill = 0) %>%
arrange(desc(MTX_24)) %>%
column_to_rownames("MTX_24") %>%
fisher.test(.)gwas_annote_df %>%
group_by(MTX_3,CAD_status) %>%
tally() %>%
pivot_wider(., MTX_3, names_from = CAD_status, values_from = n, values_fill = 0) %>%
arrange(desc(MTX_3)) %>%
print() %>%
column_to_rownames("MTX_3") %>%
fisher.test(.)# A tibble: 2 × 3
# Groups: MTX_3 [2]
MTX_3 CAD_peak not_CAD_peak
<chr> <int> <int>
1 sig_peak 0 804
2 not_sig_peak 138 154615
    Fisher's Exact Test for Count Data

data:  .
p-value = 1
alternative hypothesis: true odds ratio is not equal to 1
95 percent confidence interval:
 0.000000 5.222361
sample estimates:
odds ratio
         0
MTX_darsnp_3_CAD <- gwas_annote_df %>%
group_by(MTX_3,CAD_status) %>%
tally() %>%
pivot_wider(., MTX_3, names_from = CAD_status, values_from = n, values_fill = 0) %>%
arrange(desc(MTX_3)) %>%
column_to_rownames("MTX_3") %>%
fisher.test(.)gwas_annote_df %>%
group_by(MTX_24,CAD_status) %>%
tally() %>%
pivot_wider(., MTX_24, names_from = CAD_status, values_from = n) %>%
arrange(desc(MTX_24)) %>%
print() %>%
column_to_rownames("MTX_24") %>%
fisher.test(.)# A tibble: 2 × 3
# Groups: MTX_24 [2]
MTX_24 CAD_peak not_CAD_peak
<chr> <int> <int>
1 sig_peak 28 24222
2 not_sig_peak 110 131197
    Fisher's Exact Test for Count Data

data:  .
p-value = 0.1275
alternative hypothesis: true odds ratio is not equal to 1
95 percent confidence interval:
 0.8761135 2.1038816
sample estimates:
odds ratio
  1.378725
MTX_darsnp_24_CAD <- gwas_annote_df %>%
group_by(MTX_24,CAD_status) %>%
tally() %>%
pivot_wider(., MTX_24, names_from = CAD_status, values_from = n) %>%
arrange(desc(MTX_24)) %>%
column_to_rownames("MTX_24") %>%
fisher.test(.)Collecting all data to display:
All_24_results <- mget(ls(pattern = "*_darsnp_24*"))
All_3_results <- mget(ls(pattern = "*_darsnp_3*"))
# All_dar_results <- mget(ls(pattern = "*_darsnp_*"))


# convert to data frames with metadata
combined_df_24 <- bind_rows(
  lapply(names(All_24_results), function(name) {
    res <- All_24_results[[name]]
    parts <- strsplit(name, "_")[[1]]

    # convert htest to data.frame
    data.frame(

      p.value = res$p.value,
      estimate = if (!is.null(res$estimate)) unname(res$estimate) else NA,
      conf.low = if (!is.null(res$conf.int)) res$conf.int[1] else NA,
      conf.high = if (!is.null(res$conf.int)) res$conf.int[2] else NA,
      drug = parts[1],
      time = parts[3],
      population = parts[4],
      stringsAsFactors = FALSE
    )
  })
)

combined_df_3 <- bind_rows(
  lapply(names(All_3_results), function(name) {
    res <- All_3_results[[name]]
    parts <- strsplit(name, "_")[[1]]

    # convert htest to data.frame
    data.frame(
      p.value = res$p.value,
      estimate = if (!is.null(res$estimate)) unname(res$estimate) else NA,
      conf.low = if (!is.null(res$conf.int)) res$conf.int[1] else NA,
      conf.high = if (!is.null(res$conf.int)) res$conf.int[2] else NA,
      drug = parts[1],
      time = parts[3],
      population = parts[4],
      stringsAsFactors = FALSE
    )
  })
)
drug_pal <- c("#8B006D","#DF707E","#F1B72B", "#3386DD","#707031","#41B333")
combined_df_3 %>%
mutate(drug=factor(drug, levels = c("DOX","EPI","DNR","MTX")),
time=factor(time, levels = c("3","24")),
population=factor(population,levels = c("AF","HF","IHD","CAD"))) %>%
mutate(log10_pvalue=-log10(p.value)) %>%
ggplot(., aes(x=drug, y=log10_pvalue))+
geom_col(aes(fill=drug))+
geom_hline(yintercept= -log10(0.05), linetype = "dashed",color="black")+
theme_classic()+
facet_wrap(~time+population,nrow=2)+
xlab("treatment")+
ylab("log10 pvalue of fisher exact test")+
scale_fill_manual(values = drug_pal)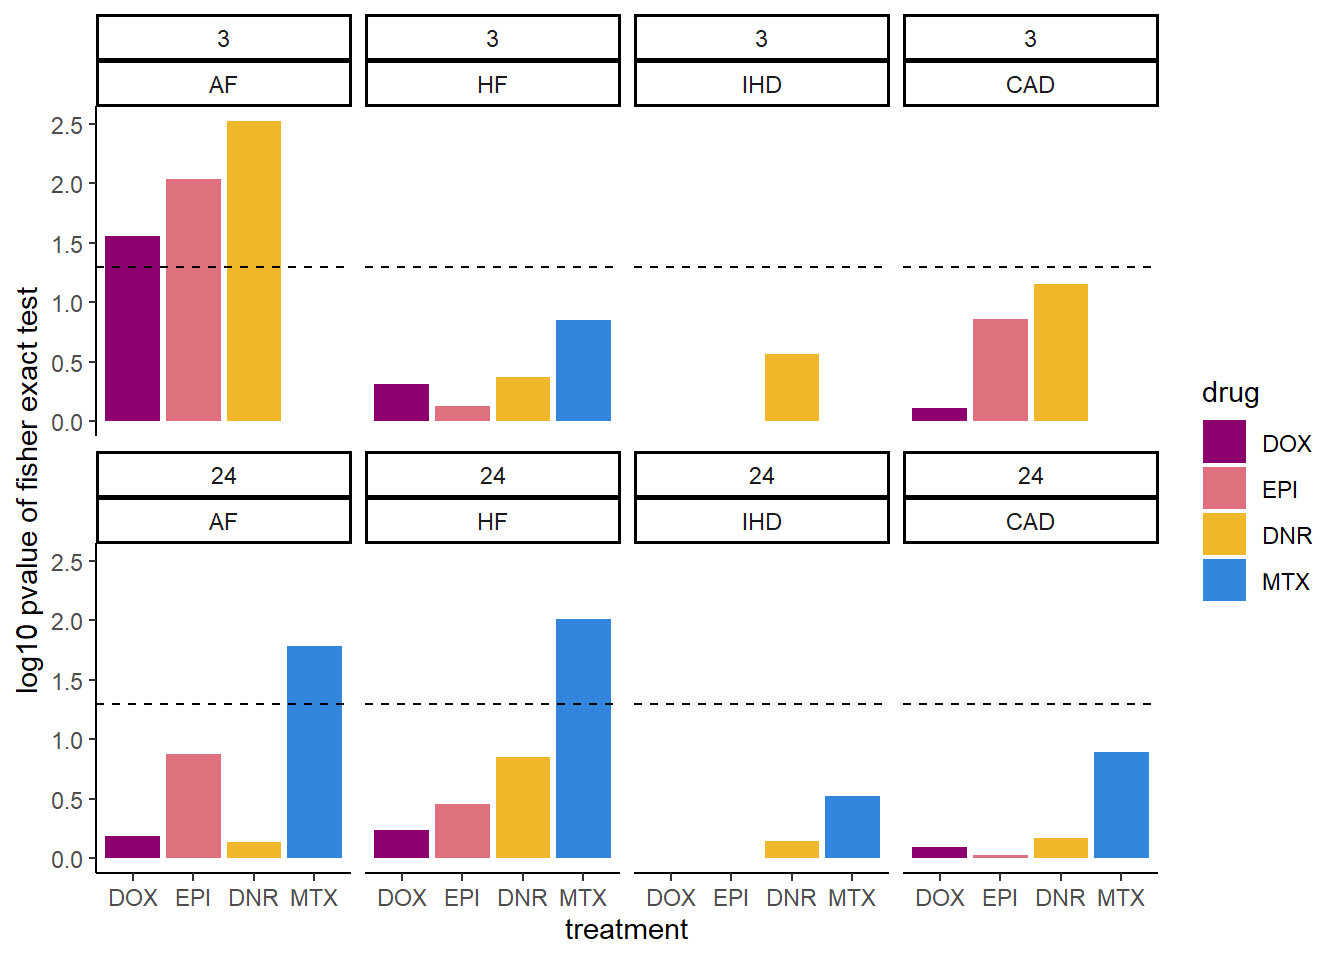
| Version | Author | Date |
|---|---|---|
| 88047ef | reneeisnowhere | 2025-07-28 |
combined_df_3 %>%
  dplyr::filter(population!= "IHD" & population != "CAD") %>%
  mutate(drug=factor(drug, levels = c("DOX","EPI","DNR","MTX")),
         time=factor(time, levels = c("3","24")),
         population=factor(population,levels = c("AF","HF","IHD", "CAD"))) %>%
    group_by(time,drug) %>%
  mutate(rank_val=rank(p.value, ties.method = "first")) %>%
  mutate(BH_correction= p.adjust(p.value,method= "BH")) %>%
  mutate(log10_pvalue=-log10(BH_correction)) %>%
  ggplot(., aes(x=drug, y=log10_pvalue))+
  geom_col(aes(fill=drug))+
  geom_hline(yintercept= -log10(0.05), linetype = "dashed",color="black")+
  theme_classic()+
  facet_wrap(~time+population,nrow=2)+
  xlab("treatment")+
  ylab("log10 pvalue of fisher exact test")+
  scale_fill_manual(values = drug_pal)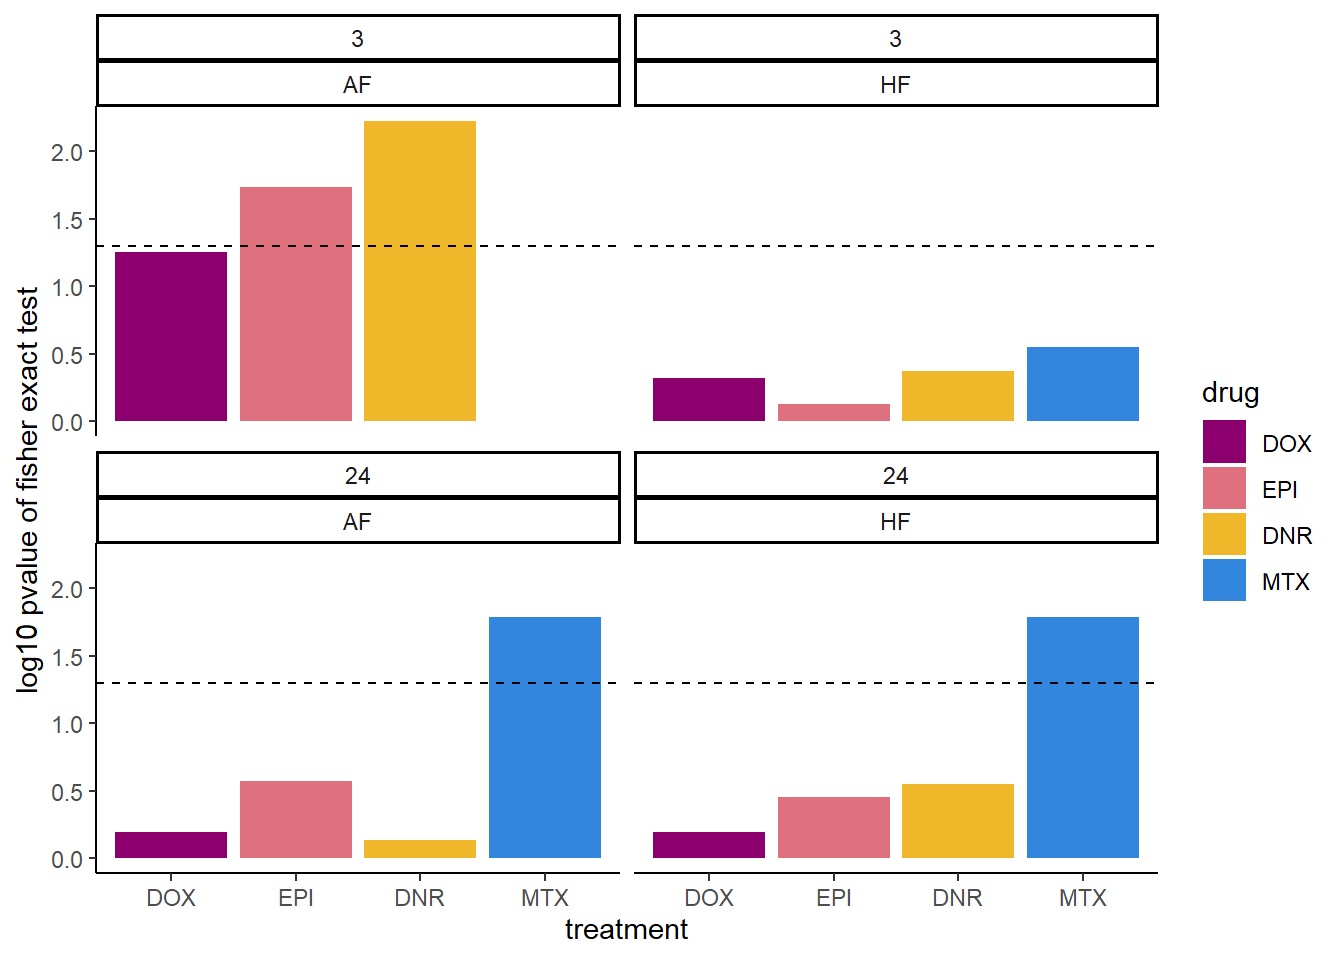
| Version | Author | Date |
|---|---|---|
| 88047ef | reneeisnowhere | 2025-07-28 |
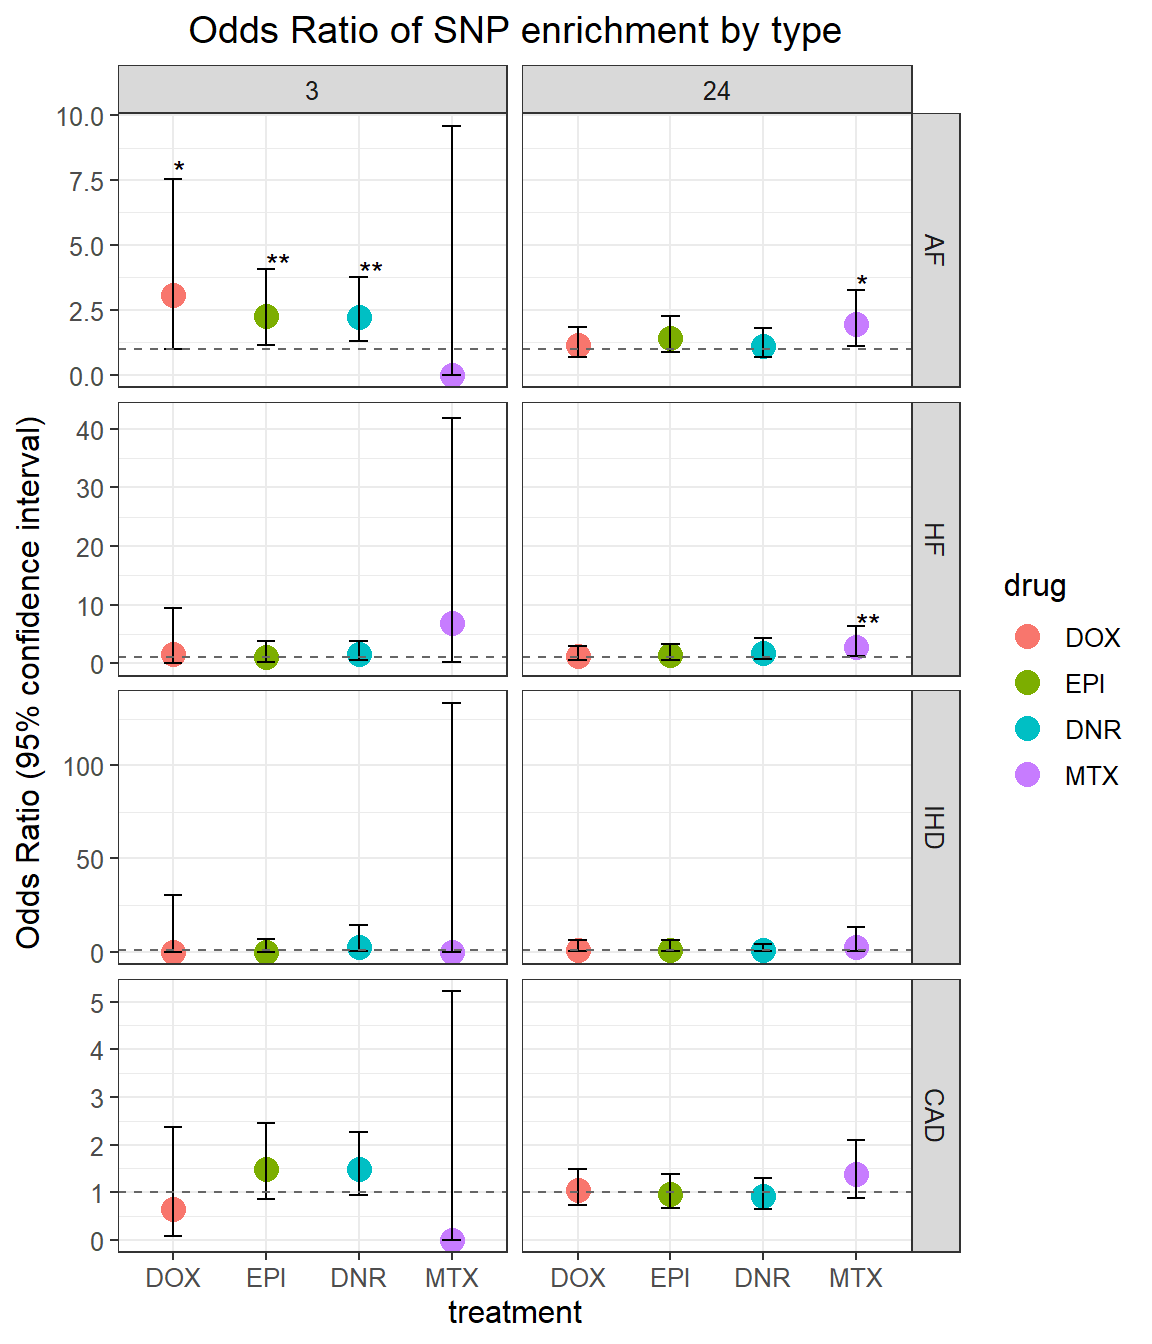
OR of results
combined_df_3 %>%
  mutate(group=paste0(drug,"_",time)) %>%
  # separate_wider_delim(.,cols="group", names = c("trt","time"), delim = "_",cols_remove = FALSE) %>%
    mutate(time= factor(time, levels =c("3","24")),
         drug=factor(drug, levels= c("DOX", "EPI", "DNR", "MTX"))) %>%
  mutate(population=factor(population, levels= c("AF","HF","IHD","CAD"))) %>%
  mutate(
    significant = case_when(
      p.value < 0.001 ~ "***",
      p.value < 0.01 ~ "**",
      p.value < 0.05 ~ "*",
      TRUE ~ ""
    )
  ) %>%
ggplot(., aes(x = drug, y = estimate)) +
   geom_point(aes(color = drug), size=4)+
   geom_errorbar(aes(ymin = conf.low, ymax = conf.high), width = 0.2) +
  geom_hline(yintercept = 1, linetype = "dashed", color = "gray40") +
  geom_text(
  aes(y = conf.high + 0.1 * estimate, label = significant),
  hjust = 0,  # aligns text to the left of the y point
  size = 4,
  color = "black"
)+
  labs(
    title = "Odds Ratio of SNP enrichment by type",
    y = "Odds Ratio (95% confidence interval)",
    x = "treatment"
  ) +
  # coord_flip()+
  theme_bw() +
  facet_grid(rows = vars(population), cols = vars(time), scales = "free_y")+
  theme(
    text = element_text(size = 12),
    plot.title = element_text(hjust = 0.5)
  )
MCF7 enrichment tests
library(regioneR)
AF_gr <- Short_gwas_gr %>%
  dplyr::filter(gwas == "AF")
HF_gr <- Short_gwas_gr %>%
  dplyr::filter(gwas == "HF")
IHD_gr <- Short_gwas_gr %>%
  dplyr::filter(gwas == "IHD")
CAD_gr <- Short_gwas_gr %>%
  dplyr::filter(gwas == "CAD")


# AF_MCF7_ol_peaks <-   join_overlap_inner(MCF7_DAR_all, Short_gwas_gr) %>%
#   dplyr::filter(mcols(gwas =="AF")) %>%
#   as.data.frame() %>%
#   dplyr::filter(gwas =="AF") %>%
#   distinct(names)
#
# HF_MCF7_ol_peaks <-   join_overlap_inner(MCF7_DAR_all, Short_gwas_gr) %>%
#   as.data.frame() %>%
#   dplyr::filter(gwas =="HF") %>%
#   distinct(names)
#
# IHD_MCF7_ol_peaks <-   join_overlap_inner(MCF7_DAR_all, Short_gwas_gr) %>%
#   as.data.frame() %>%
#   dplyr::filter(gwas =="IHD") %>%
#   distinct(names)

# saveRDS(AF,"data/Final_four_data/re_analysis/MCF7_DAR_AF_permtest.RDS")

IHD <-readRDS("data/Final_four_data/re_analysis/MCF7_DAR_IHD_permtest.RDS")

HF <- readRDS("data/Final_four_data/re_analysis/MCF7_DAR_HF_permtest.RDS")
AF <- readRDS("data/Final_four_data/re_analysis/MCF7_DAR_AF_permtest.RDS")
CAD <- readRDS("data/Final_four_data/re_analysis/MCF7_DAR_CAD_permtest.RDS")
# param <- SnowParam(workers = 8)
# AF<- permTest(A= MCF7_DAR_all,
#                           B= AF_gr,
#                           ntimes=1000,
#                           randomize.function=randomizeRegions,
#                           evaluate.function = numOverlaps,
#                           genome="hg38",
#                           count.once= TRUE,
#                           universe=universe,
#                         # universe = union_accessible_regions,
#                           verbose = TRUE,
#                           BPPARAM = param)
AF
$numOverlaps
P-value: 0.64035964035964
Z-score: -0.0163
Number of iterations: 1000
Alternative: less
Evaluation of the original region set: 4
Evaluation function: numOverlaps
Randomization function: randomizeRegions
attr(,"class")
[1] "permTestResultsList"plot(AF)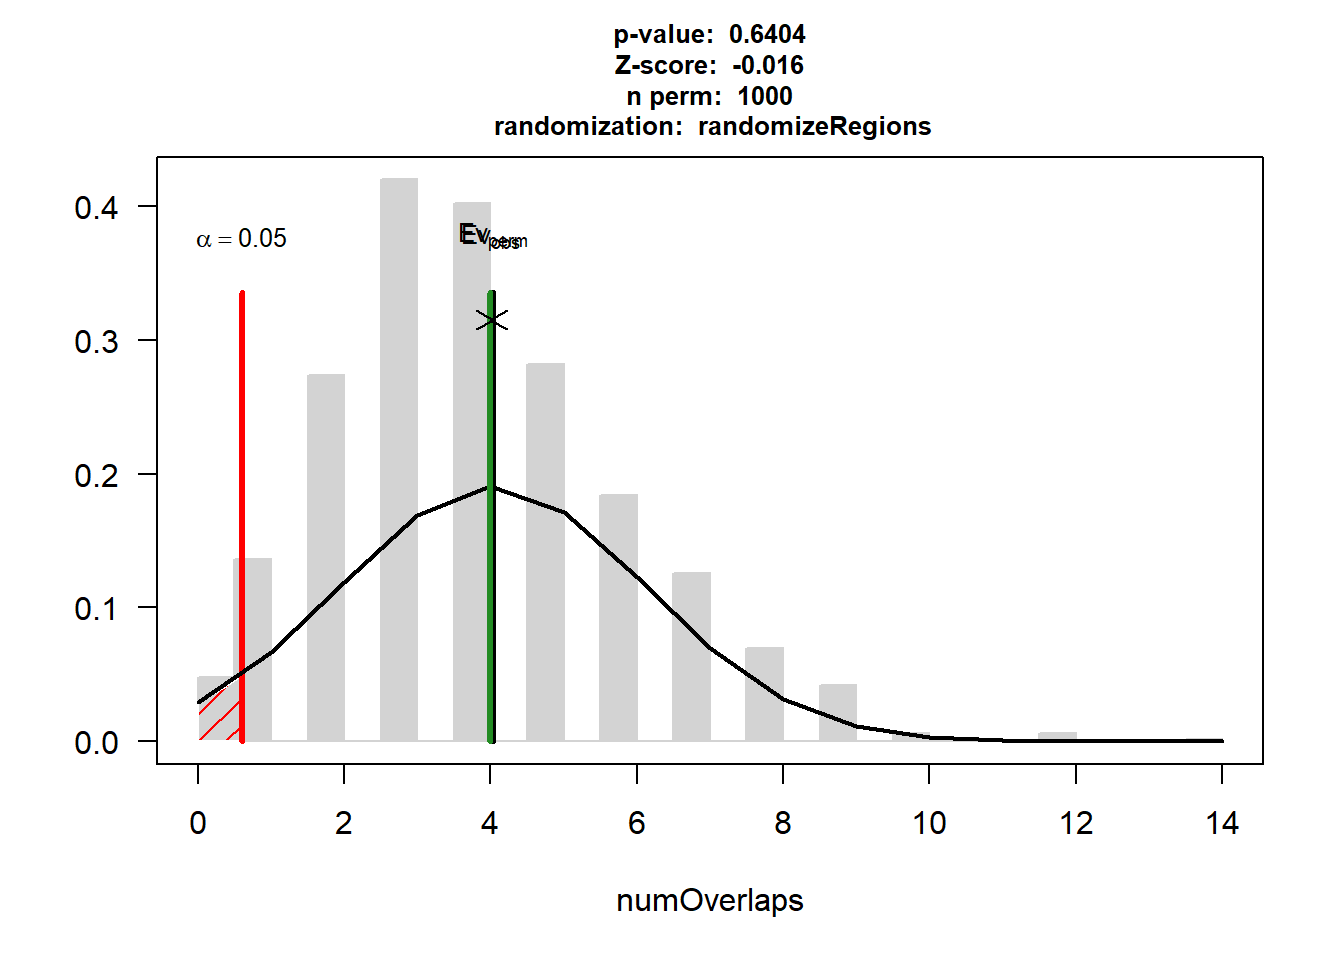
HF$numOverlaps
P-value: 0.434565434565435
Z-score: 0.3761
Number of iterations: 1000
Alternative: greater
Evaluation of the original region set: 3
Evaluation function: numOverlaps
Randomization function: randomizeRegions
attr(,"class")
[1] "permTestResultsList"plot(HF)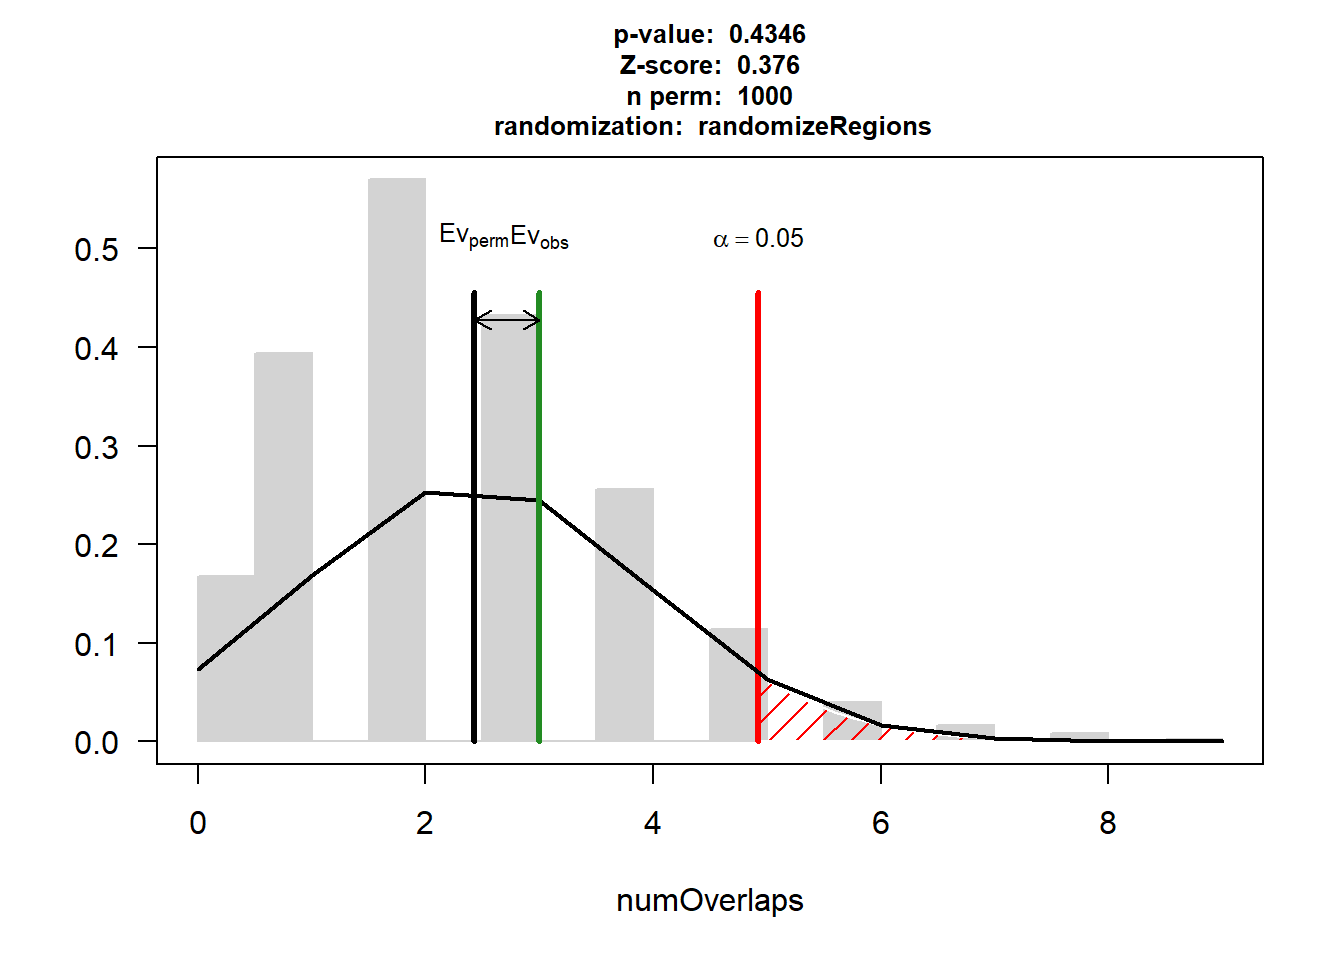
IHD$numOverlaps
P-value: 0.614385614385614
Z-score: -0.7021
Number of iterations: 1000
Alternative: less
Evaluation of the original region set: 0
Evaluation function: numOverlaps
Randomization function: randomizeRegions
attr(,"class")
[1] "permTestResultsList"plot(IHD)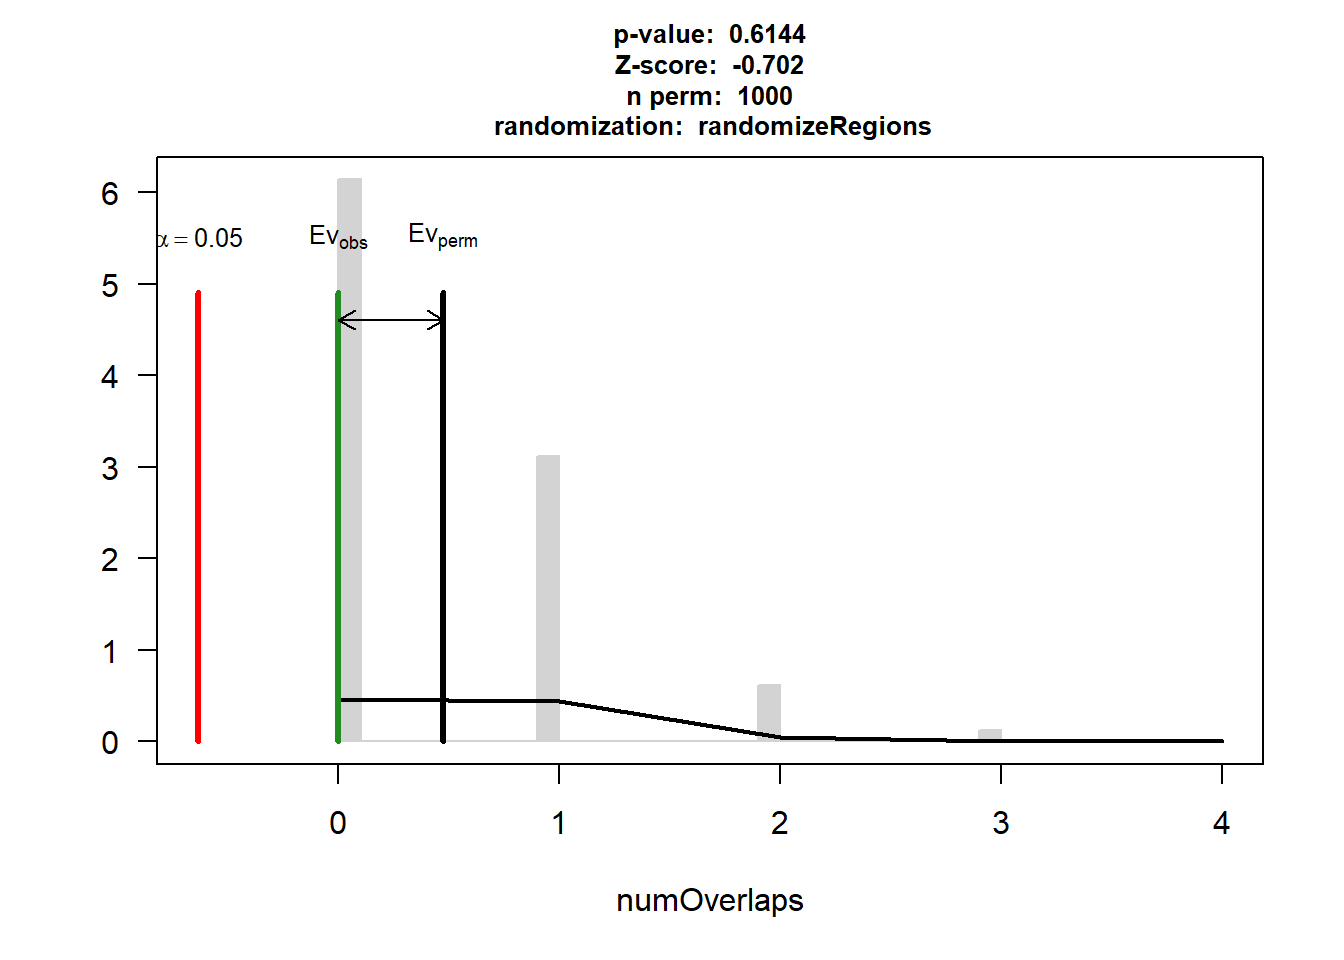
CAD$numOverlaps
P-value: 0.045954045954046
Z-score: 1.8555
Number of iterations: 1000
Alternative: greater
Evaluation of the original region set: 19
Evaluation function: numOverlaps
Randomization function: randomizeRegions
attr(,"class")
[1] "permTestResultsList"plot(CAD)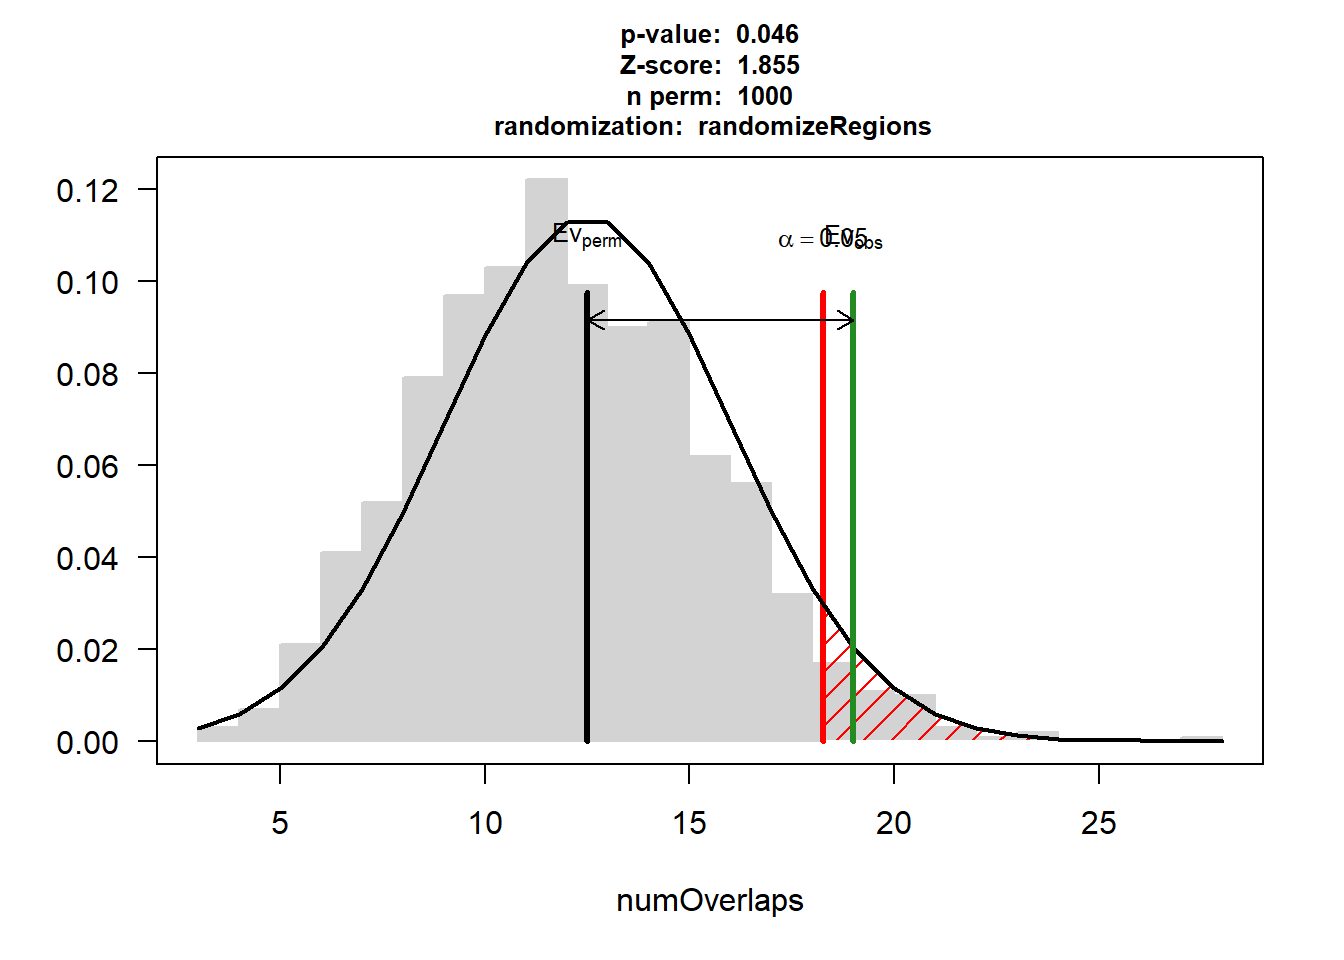
PT DOX 24hr check
# DOX_24_gr <- DOX_24_sig %>% separate_wider_delim(., cols="genes",names = c("seqnames","start","end"), delim= ".") %>%
#   GRanges()
#
# DOX_3_gr <- DOX_3_sig %>% separate_wider_delim(., cols="genes",names = c("seqnames","start","end"), delim= ".") %>%
#   GRanges()
# param <- SnowParam(workers = 1)

DOX_AF <- readRDS("data/Final_four_data/re_analysis/perm_test_1000/DOX_AF_24h.RDS")
DOX_HF <- readRDS("data/Final_four_data/re_analysis/perm_test_1000/DOX_HF_24h.RDS")
DOX_IHD <- readRDS("data/Final_four_data/re_analysis/perm_test_1000/DOX_IHD_24h.RDS")
DOX_CAD <- readRDS("data/Final_four_data/re_analysis/perm_test_1000/DOX_CAD_24h.RDS")

DOX_AF_3 <- readRDS("data/Final_four_data/re_analysis/perm_test_1000/DOX_AF_3h.RDS")
DOX_HF_3 <- readRDS("data/Final_four_data/re_analysis/perm_test_1000/DOX_HF_3h.RDS")
DOX_IHD_3 <- readRDS("data/Final_four_data/re_analysis/perm_test_1000/DOX_IHD_3h.RDS")
DOX_CAD_3 <-  readRDS("data/Final_four_data/re_analysis/perm_test_1000/DOX_CAD_3h.RDS")
# DOX_CAD<- permTest(A= DOX_24_gr,
#                           B= CAD_gr,
#                           ntimes=1000,
#                           randomize.function=randomizeRegions,
#                           evaluate.function = numOverlaps,
#                           genome="hg38",
#                           count.once= TRUE,
#                           universe=universe,
#                         # universe = union_accessible_regions,
#                           verbose = TRUE,
#                           BPPARAM = param)

# DOX_AF<- permTest(A= DOX_24_gr,
#                           B= AF_gr,
#                           ntimes=1000,
#                           randomize.function=randomizeRegions,
#                           evaluate.function = numOverlaps,
#                           genome="hg38",
#                           count.once= TRUE,
#                           universe=universe,
#                         # universe = union_accessible_regions,
#                           verbose = TRUE,
#                           BPPARAM = param)
#
# DOX_HF<- permTest(A= DOX_24_gr,
#                           B= HF_gr,
#                           ntimes=1000,
#                           randomize.function=randomizeRegions,
#                           evaluate.function = numOverlaps,
#                           genome="hg38",
#                           count.once= TRUE,
#                           universe=universe,
#                         # universe = union_accessible_regions,
#                           verbose = TRUE,
#                           BPPARAM = param)

# DOX_IHD<- permTest(A= DOX_24_gr,
#                           B= IHD_gr,
#                           ntimes=1000,
#                           randomize.function=randomizeRegions,
#                           evaluate.function = numOverlaps,
#                           genome="hg38",
#                           count.once= TRUE,
#                           universe=universe,
#                         # universe = union_accessible_regions,
#                           verbose = TRUE,
#                           BPPARAM = param)
DOX_AF
$numOverlaps
P-value: 0.000999000999000999
Z-score: 9.1355
Number of iterations: 1000
Alternative: greater
Evaluation of the original region set: 34
Evaluation function: numOverlaps
Randomization function: randomizeRegions
attr(,"class")
[1] "permTestResultsList"plot(DOX_AF)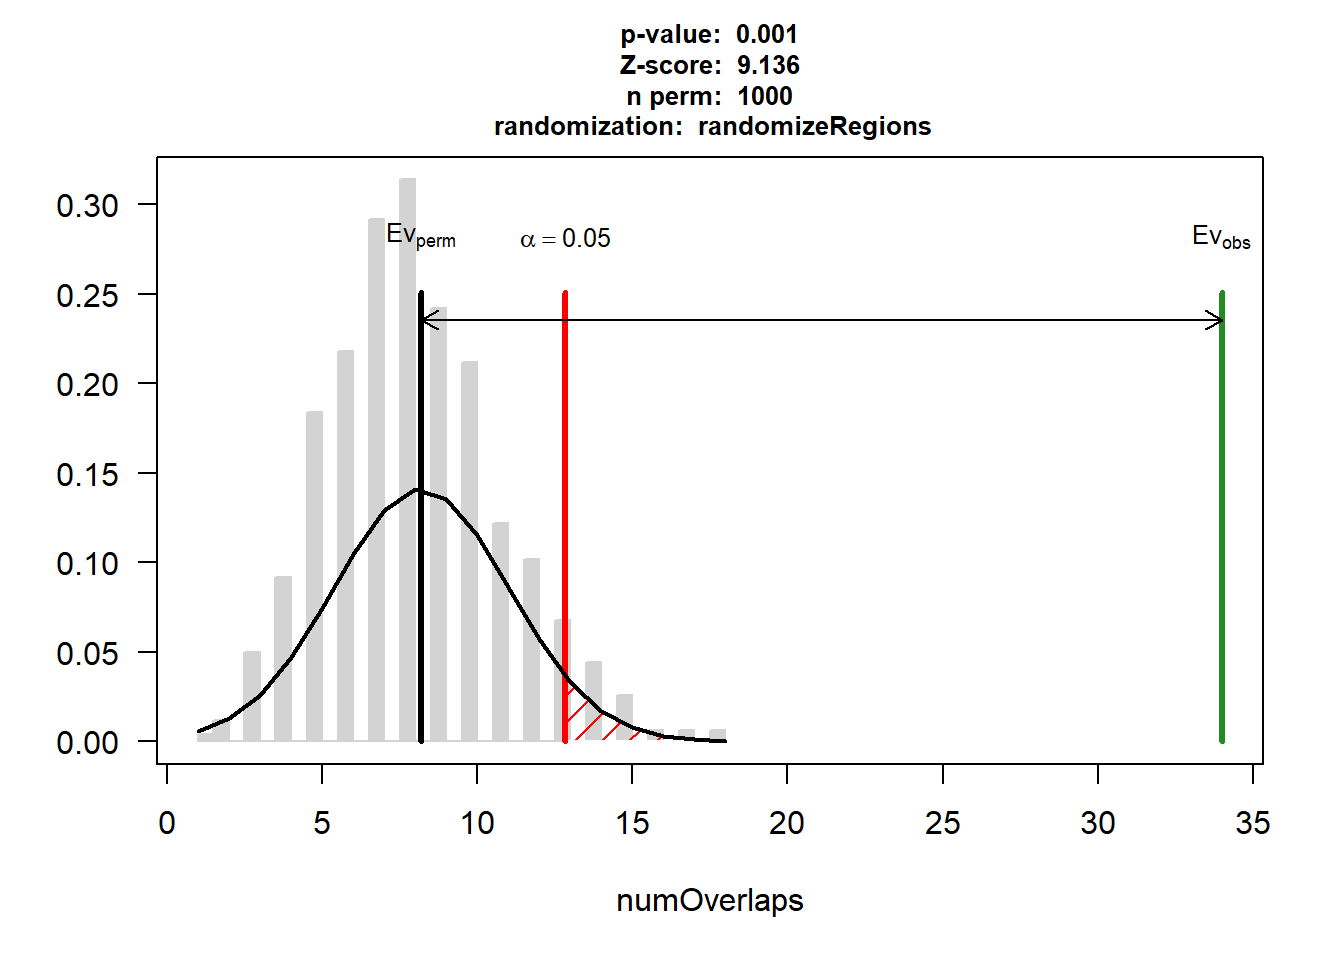
| Version | Author | Date |
|---|---|---|
| 88047ef | reneeisnowhere | 2025-07-28 |
DOX_HF$numOverlaps
P-value: 0.002997002997003
Z-score: 4.1771
Number of iterations: 1000
Alternative: greater
Evaluation of the original region set: 14
Evaluation function: numOverlaps
Randomization function: randomizeRegions
attr(,"class")
[1] "permTestResultsList"plot(DOX_HF)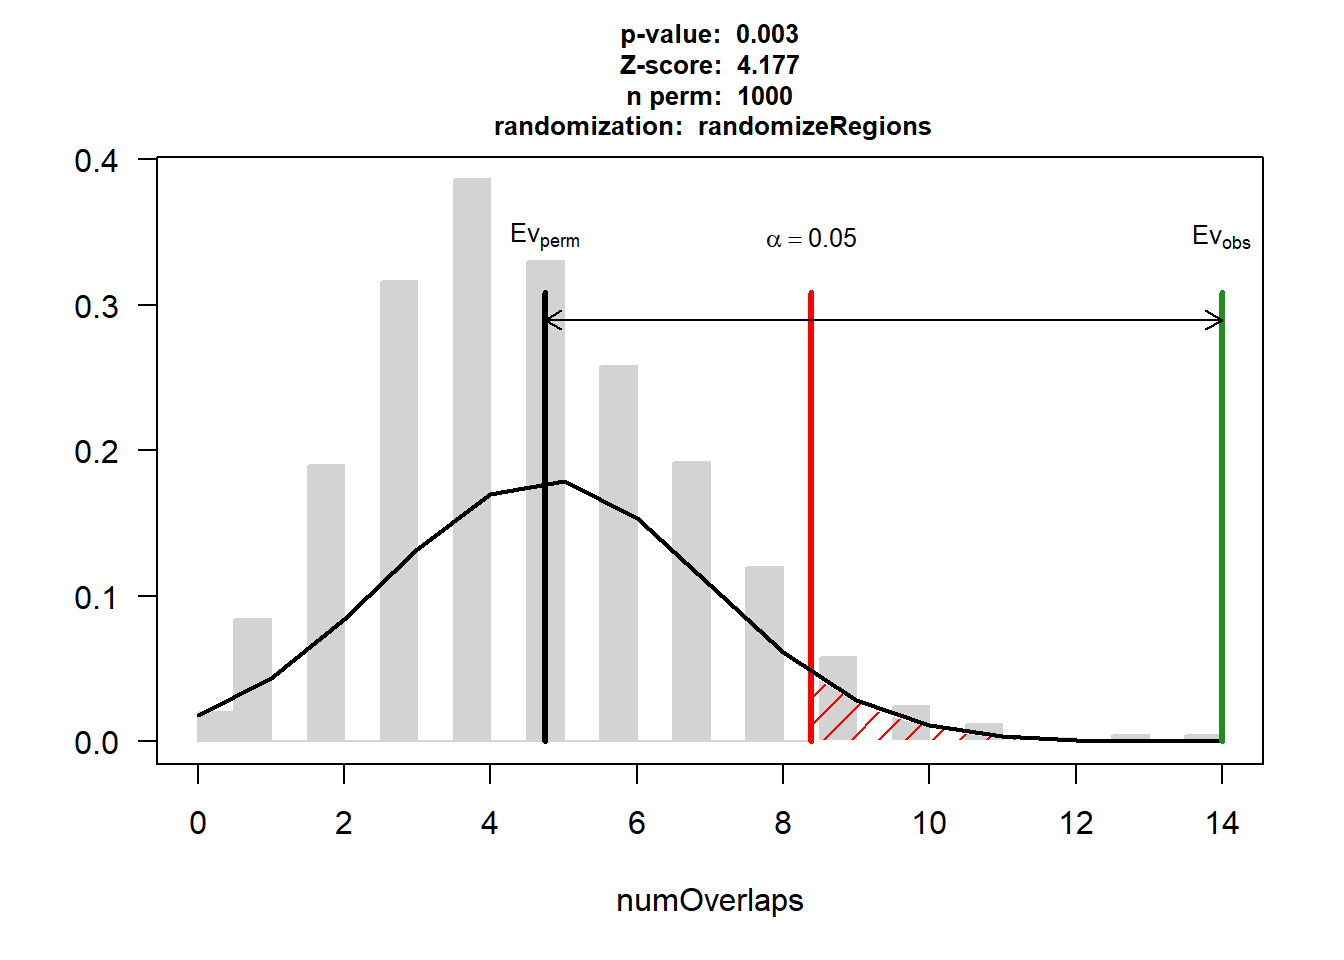
| Version | Author | Date |
|---|---|---|
| 88047ef | reneeisnowhere | 2025-07-28 |
DOX_IHD$numOverlaps
P-value: 0.0899100899100899
Z-score: 1.9409
Number of iterations: 1000
Alternative: greater
Evaluation of the original region set: 3
Evaluation function: numOverlaps
Randomization function: randomizeRegions
attr(,"class")
[1] "permTestResultsList"plot(DOX_IHD)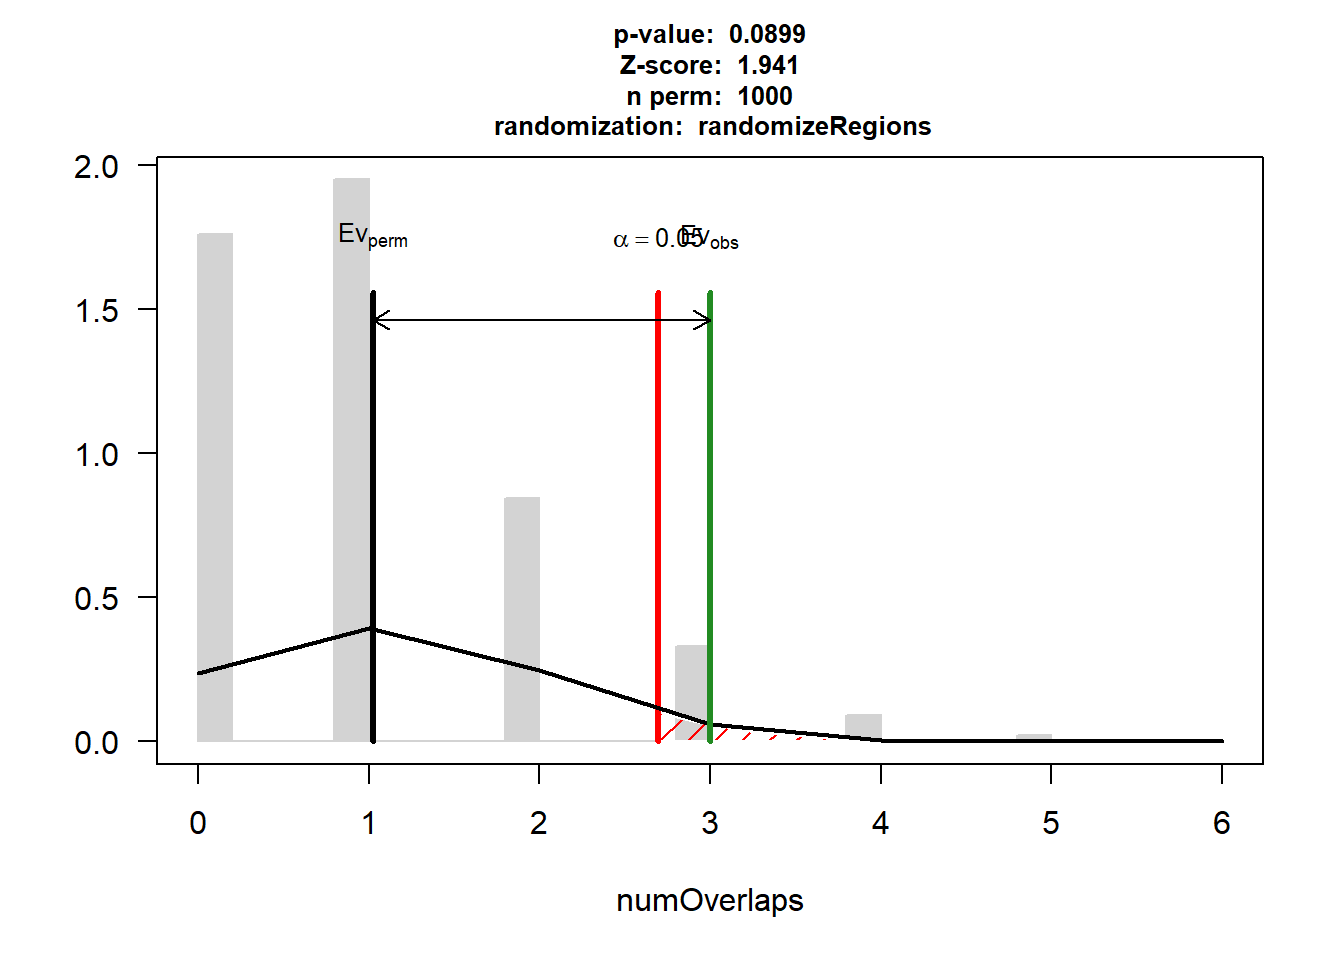
| Version | Author | Date |
|---|---|---|
| 88047ef | reneeisnowhere | 2025-07-28 |
DOX_CAD$numOverlaps
P-value: 0.000999000999000999
Z-score: 6.9373
Number of iterations: 1000
Alternative: greater
Evaluation of the original region set: 59
Evaluation function: numOverlaps
Randomization function: randomizeRegions
attr(,"class")
[1] "permTestResultsList"plot(DOX_CAD)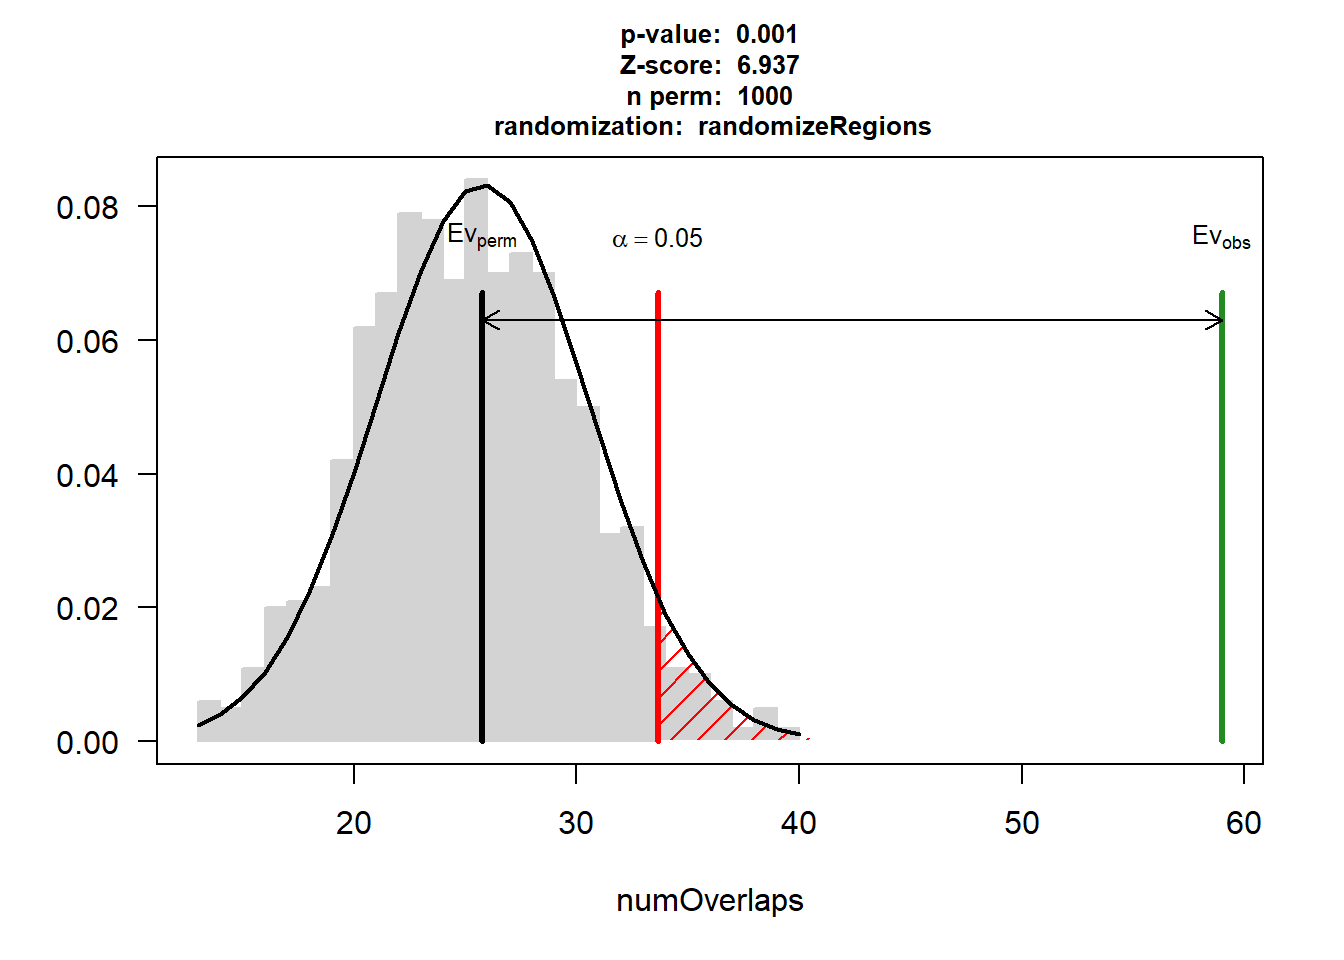
| Version | Author | Date |
|---|---|---|
| 88047ef | reneeisnowhere | 2025-07-28 |
# DOX_CAD_3<- permTest(A= DOX_3_gr,
#                           B= CAD_gr,
#                           ntimes=1000,
#                           randomize.function=randomizeRegions,
#                           evaluate.function = numOverlaps,
#                           genome="hg38",
#                           count.once= TRUE,
#                           universe=universe,
#                         # universe = union_accessible_regions,
#                           verbose = TRUE,
#                           BPPARAM = param)

# DOX_AF_3<- permTest(A= DOX_3_gr,
#                           B= AF_gr,
#                           ntimes=1000,
#                           randomize.function=randomizeRegions,
#                           evaluate.function = numOverlaps,
#                           genome="hg38",
#                           count.once= TRUE,
#                           universe=universe,
#                         # universe = union_accessible_regions,
#                           verbose = TRUE,
#                           BPPARAM = param)

# DOX_HF_3<- permTest(A= DOX_3_gr,
#                           B= HF_gr,
#                           ntimes=1000,
#                           randomize.function=randomizeRegions,
#                           evaluate.function = numOverlaps,
#                           genome="hg38",
#                           count.once= TRUE,
#                           universe=universe,
#                         # universe = union_accessible_regions,
#                           verbose = TRUE,
#                           BPPARAM = param)

# DOX_IHD_3<- permTest(A= DOX_3_gr,
#                           B= IHD_gr,
#                           ntimes=1000,
#                           randomize.function=randomizeRegions,
#                           evaluate.function = numOverlaps,
#                           genome="hg38",
#                           count.once= TRUE,
#                           universe=universe,
#                         # universe = union_accessible_regions,
#                           verbose = TRUE,
#                           BPPARAM = param)
DOX_AF_3
$numOverlaps
P-value: 0.000999000999000999
Z-score: 6.3369
Number of iterations: 1000
Alternative: greater
Evaluation of the original region set: 5
Evaluation function: numOverlaps
Randomization function: randomizeRegions
attr(,"class")
[1] "permTestResultsList"plot(DOX_AF_3)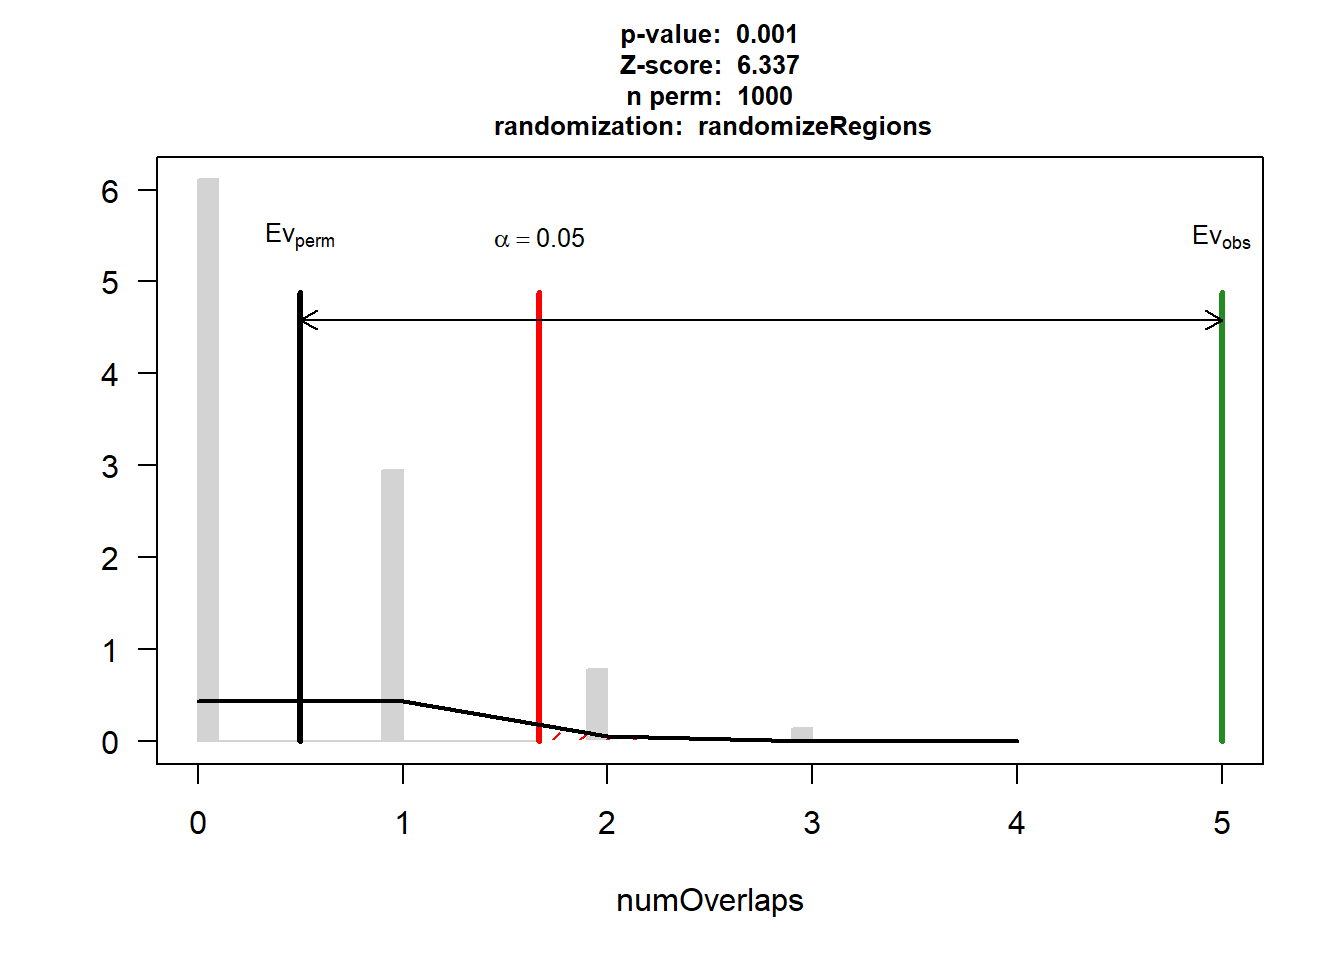
| Version | Author | Date |
|---|---|---|
| 88047ef | reneeisnowhere | 2025-07-28 |
DOX_HF_3$numOverlaps
P-value: 0.236763236763237
Z-score: 1.38
Number of iterations: 1000
Alternative: greater
Evaluation of the original region set: 1
Evaluation function: numOverlaps
Randomization function: randomizeRegions
attr(,"class")
[1] "permTestResultsList"plot(DOX_HF_3)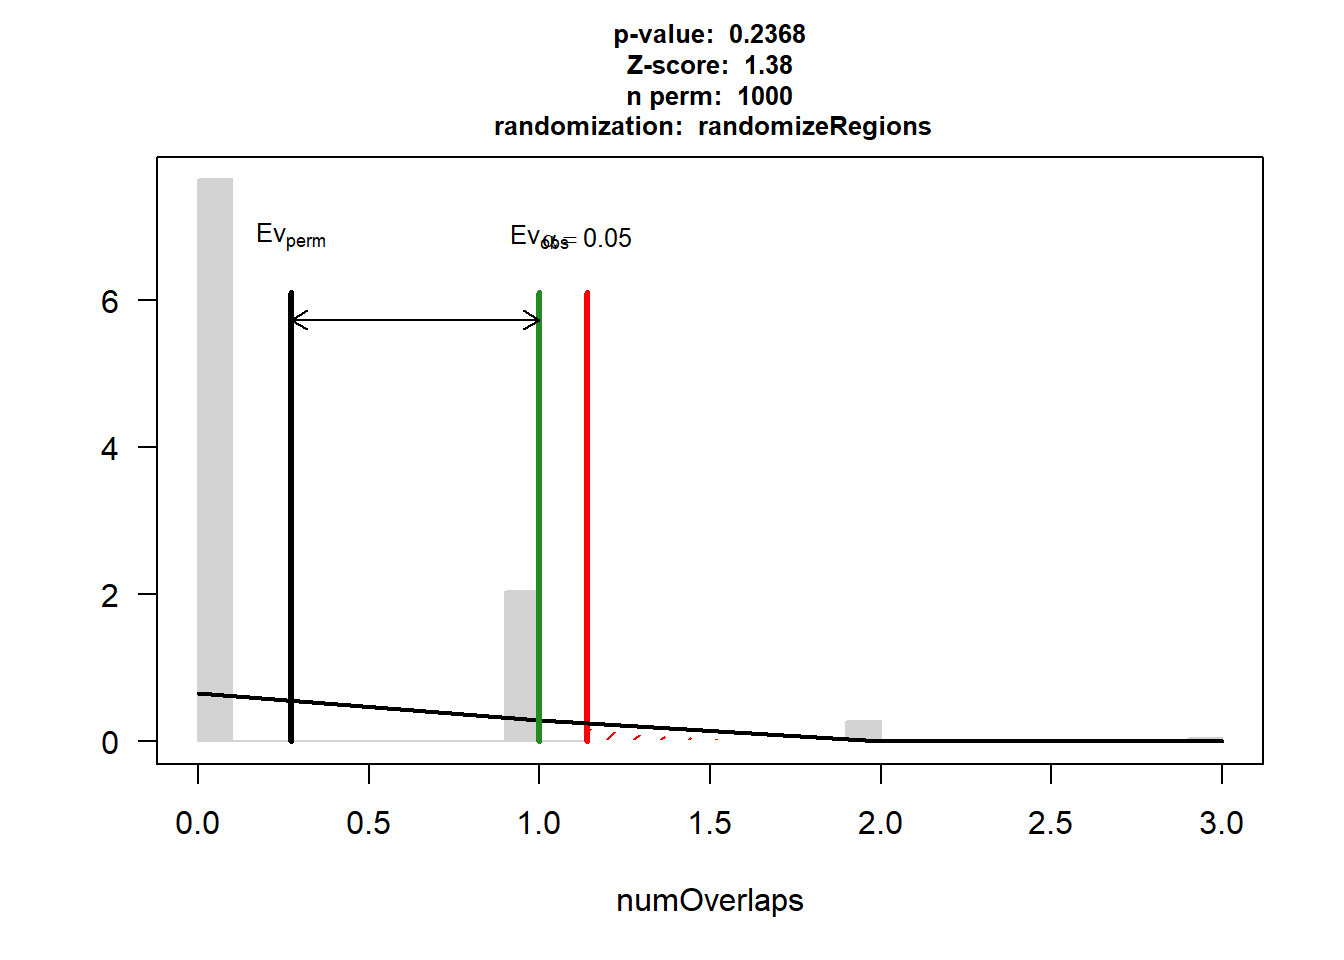
| Version | Author | Date |
|---|---|---|
| 88047ef | reneeisnowhere | 2025-07-28 |
DOX_IHD_3$numOverlaps
P-value: 0.93006993006993
Z-score: -0.2661
Number of iterations: 1000
Alternative: less
Evaluation of the original region set: 0
Evaluation function: numOverlaps
Randomization function: randomizeRegions
attr(,"class")
[1] "permTestResultsList"plot(DOX_IHD_3)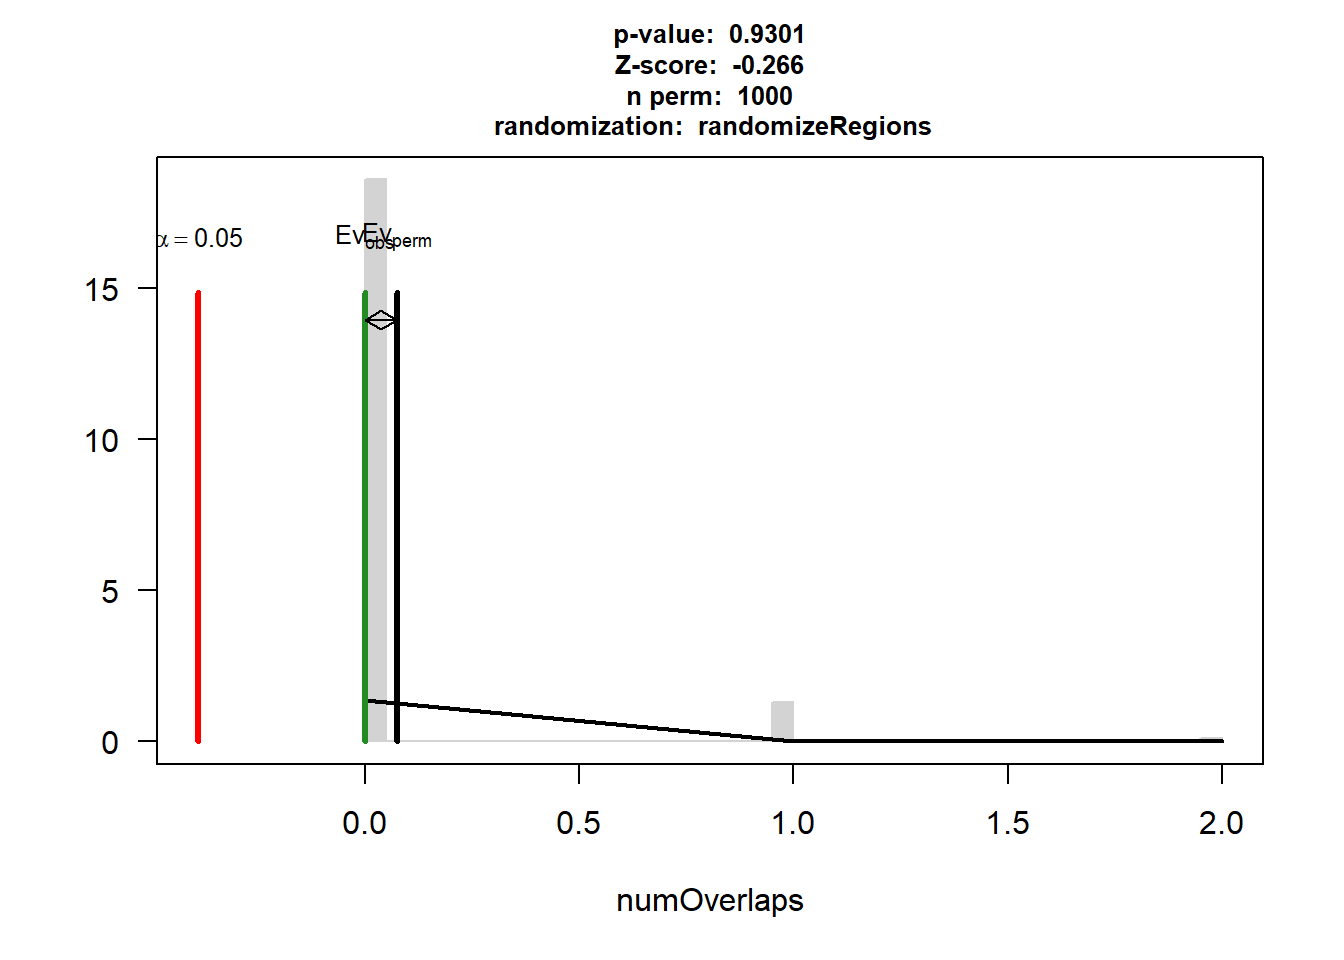
| Version | Author | Date |
|---|---|---|
| 88047ef | reneeisnowhere | 2025-07-28 |
DOX_CAD_3$numOverlaps
P-value: 0.467532467532468
Z-score: 0.3003
Number of iterations: 1000
Alternative: greater
Evaluation of the original region set: 2
Evaluation function: numOverlaps
Randomization function: randomizeRegions
attr(,"class")
[1] "permTestResultsList"plot(DOX_CAD_3)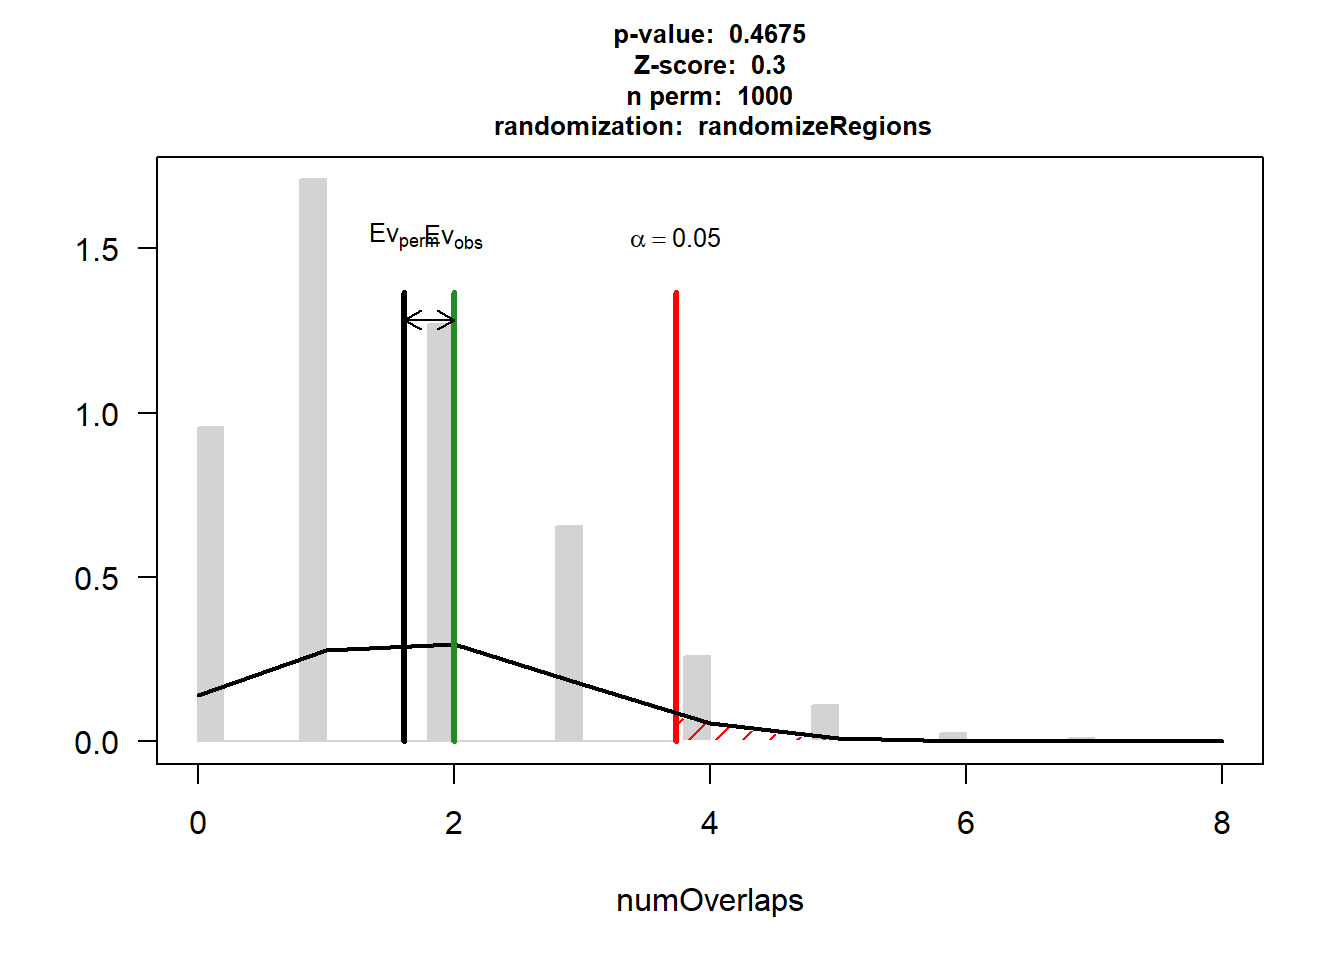
| Version | Author | Date |
|---|---|---|
| 88047ef | reneeisnowhere | 2025-07-28 |
# saveRDS(DOX_AF,"data/Final_four_data/re_analysis/perm_test_100/DOX_AF_24h.RDS")
# saveRDS(DOX_HF,"data/Final_four_data/re_analysis/perm_test_100/DOX_HF_24h.RDS")
# saveRDS(DOX_IHD,"data/Final_four_data/re_analysis/perm_test_100/DOX_IHD_24h.RDS")
# saveRDS(DOX_CAD,"data/Final_four_data/re_analysis/perm_test_100/DOX_CAD_24h.RDS")

# saveRDS(DOX_AF_3,"data/Final_four_data/re_analysis/perm_test_100/DOX_AF_3h.RDS")
# saveRDS(DOX_HF_3,"data/Final_four_data/re_analysis/perm_test_100/DOX_HF_3h.RDS")
# saveRDS(DOX_IHD_3,"data/Final_four_data/re_analysis/perm_test_100/DOX_IHD_3h.RDS")
# saveRDS(DOX_CAD_3,"data/Final_four_data/re_analysis/perm_test_100/DOX_CAD_3h.RDS")

# saveRDS(DOX_AF,"data/Final_four_data/re_analysis/perm_test_1000/DOX_AF_24h.RDS")
# saveRDS(DOX_HF,"data/Final_four_data/re_analysis/perm_test_1000/DOX_HF_24h.RDS")
# saveRDS(DOX_IHD,"data/Final_four_data/re_analysis/perm_test_1000/DOX_IHD_24h.RDS")
# saveRDS(DOX_CAD,"data/Final_four_data/re_analysis/perm_test_1000/DOX_CAD_24h.RDS")

# saveRDS(DOX_AF_3,"data/Final_four_data/re_analysis/perm_test_1000/DOX_AF_3h.RDS")
# saveRDS(DOX_HF_3,"data/Final_four_data/re_analysis/perm_test_1000/DOX_HF_3h.RDS")
# saveRDS(DOX_IHD_3,"data/Final_four_data/re_analysis/perm_test_1000/DOX_IHD_3h.RDS")
# saveRDS(DOX_CAD_3,"data/Final_four_data/re_analysis/perm_test_1000/DOX_CAD_3h.RDS")
PT EPI 24hr check
EPI_24_gr <- EPI_24_sig %>% separate_wider_delim(., cols="genes",names = c("seqnames","start","end"), delim= ".") %>%
  GRanges()

EPI_3_gr <- EPI_3_sig %>% separate_wider_delim(., cols="genes",names = c("seqnames","start","end"), delim= ".") %>%
  GRanges()

EPI_AF <- readRDS("data/Final_four_data/re_analysis/perm_test_1000/EPI_AF_24h.RDS")
EPI_HF <- readRDS("data/Final_four_data/re_analysis/perm_test_1000/EPI_HF_24h.RDS")
EPI_IHD <- readRDS("data/Final_four_data/re_analysis/perm_test_1000/EPI_IHD_24h.RDS")
EPI_CAD <- readRDS("data/Final_four_data/re_analysis/perm_test_1000/EPI_CAD_24h.RDS")

EPI_AF_3 <- readRDS("data/Final_four_data/re_analysis/perm_test_1000/EPI_AF_3h.RDS")
EPI_HF_3 <- readRDS("data/Final_four_data/re_analysis/perm_test_1000/EPI_HF_3h.RDS")
EPI_IHD_3 <- readRDS("data/Final_four_data/re_analysis/perm_test_1000/EPI_IHD_3h.RDS")
EPI_CAD_3 <- readRDS("data/Final_four_data/re_analysis/perm_test_1000/EPI_CAD_3h.RDS")


# EPI_AF_3<- permTest(A= EPI_3_gr,
#                           B= AF_gr,
#                           ntimes=1000,
#                           randomize.function=randomizeRegions,
#                           evaluate.function = numOverlaps,
#                           genome="hg38",
#                           count.once= TRUE,
#                           universe=universe,
#                         #
#                           verbose = TRUE,
#                           BPPARAM = param)
# EPI_HF_3<- permTest(A= EPI_3_gr,
#                           B= HF_gr,
#                           ntimes=1000,
#                           randomize.function=randomizeRegions,
#                           evaluate.function = numOverlaps,
#                           genome="hg38",
#                           count.once= TRUE,
#                           universe=universe,
#
#                           verbose = TRUE,
#                           BPPARAM = param)
#
#
# EPI_IHD_3<- permTest(A= EPI_3_gr,
#                           B= IHD_gr,
#                           ntimes=1000,
#                           randomize.function=randomizeRegions,
#                           evaluate.function = numOverlaps,
#                           genome="hg38",
#                           count.once= TRUE,
#                           universe=universe,
#
#                           verbose = TRUE,
#                           BPPARAM = param)
#
# EPI_CAD_3<- permTest(A= EPI_3_gr,
#                           B= CAD_gr,
#                           ntimes=1000,
#                           randomize.function=randomizeRegions,
#                           evaluate.function = numOverlaps,
#                           genome="hg38",
#                           count.once= TRUE,
#                           universe=universe,
#
#                           verbose = TRUE,
#                           BPPARAM = param)


EPI_AF_3
$numOverlaps
P-value: 0.000999000999000999
Z-score: 7.7892
Number of iterations: 1000
Alternative: greater
Evaluation of the original region set: 14
Evaluation function: numOverlaps
Randomization function: randomizeRegions
attr(,"class")
[1] "permTestResultsList"plot(EPI_AF_3)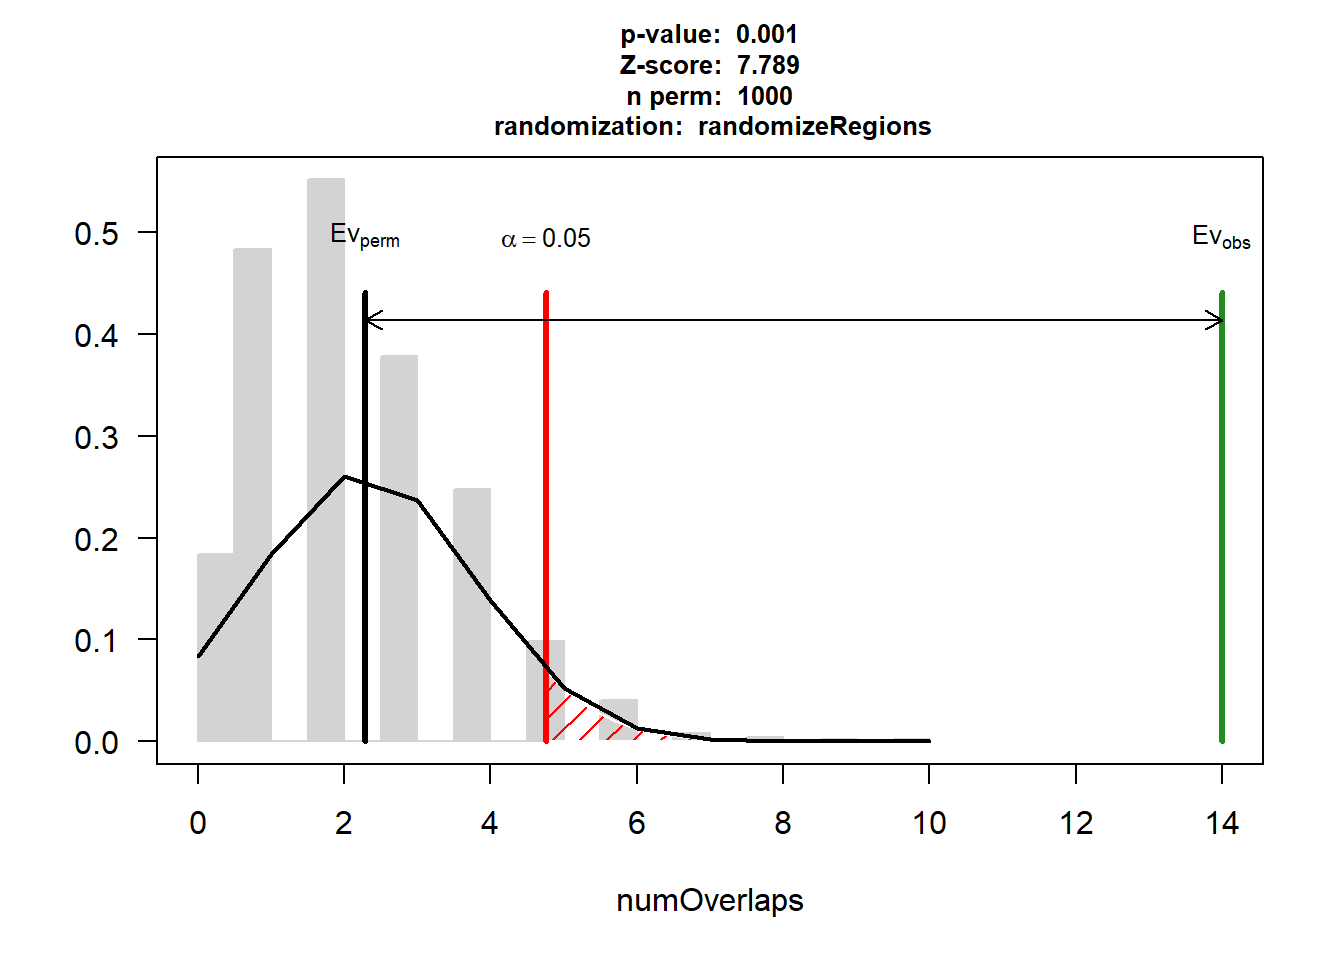
| Version | Author | Date |
|---|---|---|
| 88047ef | reneeisnowhere | 2025-07-28 |
EPI_HF_3$numOverlaps
P-value: 0.155844155844156
Z-score: 1.4052
Number of iterations: 1000
Alternative: greater
Evaluation of the original region set: 3
Evaluation function: numOverlaps
Randomization function: randomizeRegions
attr(,"class")
[1] "permTestResultsList"plot(EPI_HF_3)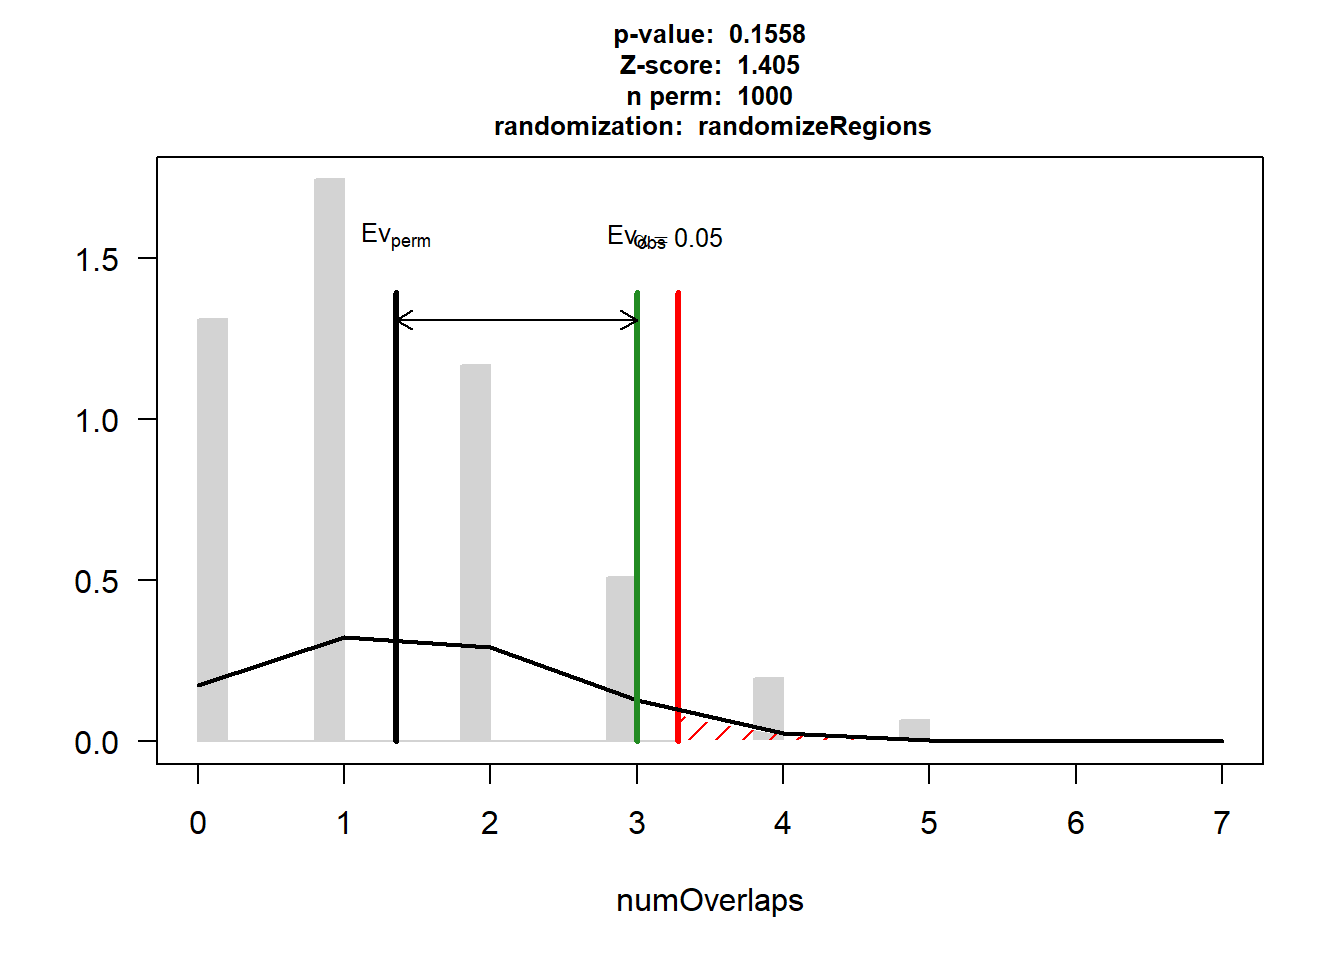
| Version | Author | Date |
|---|---|---|
| 88047ef | reneeisnowhere | 2025-07-28 |
EPI_IHD_3$numOverlaps
P-value: 0.775224775224775
Z-score: -0.4919
Number of iterations: 1000
Alternative: less
Evaluation of the original region set: 0
Evaluation function: numOverlaps
Randomization function: randomizeRegions
attr(,"class")
[1] "permTestResultsList"plot(EPI_IHD_3)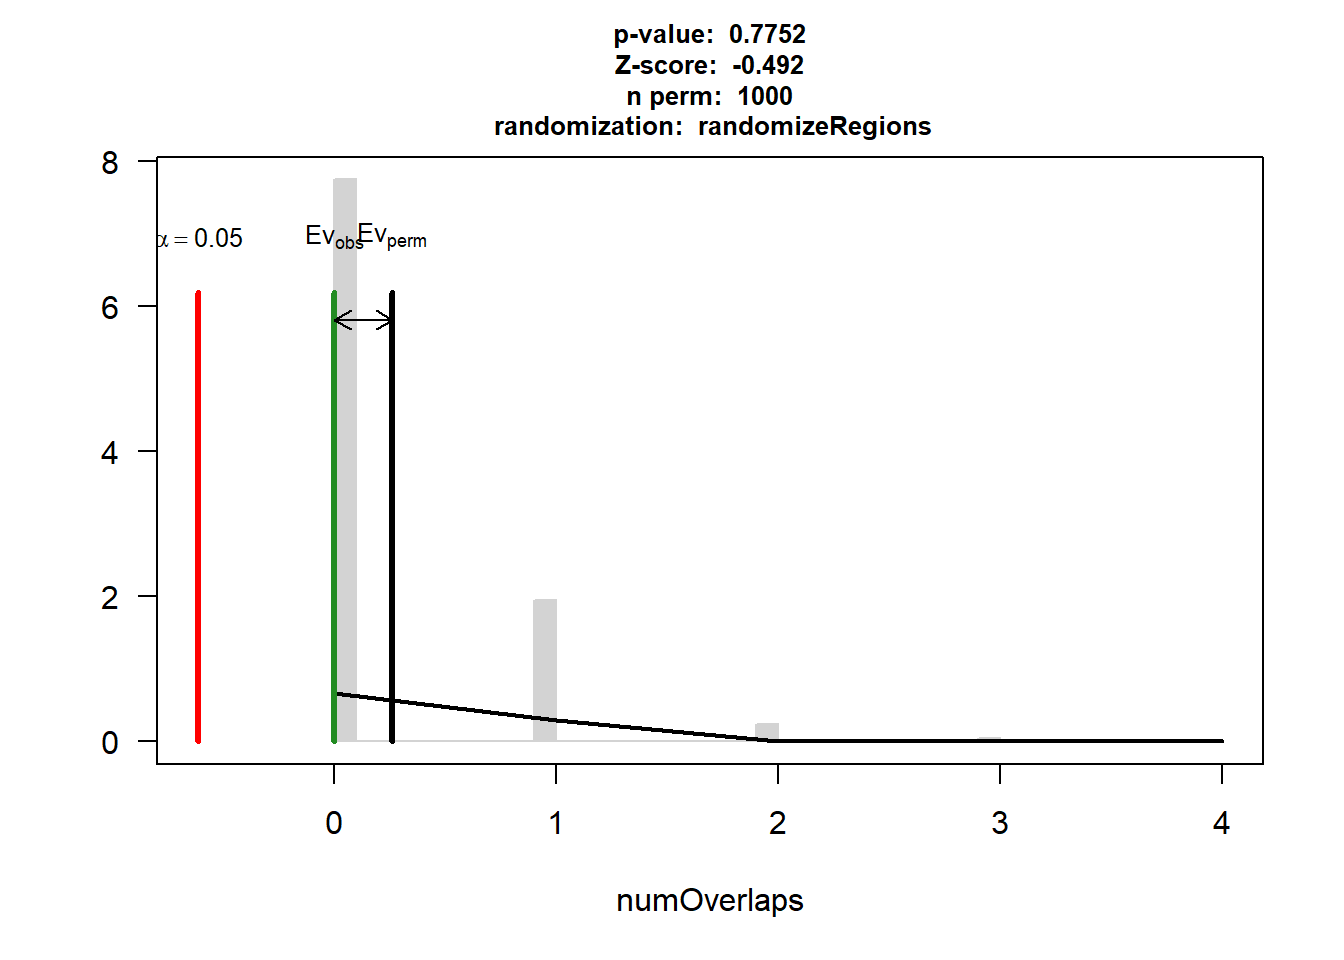
| Version | Author | Date |
|---|---|---|
| 88047ef | reneeisnowhere | 2025-07-28 |
EPI_CAD_3$numOverlaps
P-value: 0.000999000999000999
Z-score: 4.0831
Number of iterations: 1000
Alternative: greater
Evaluation of the original region set: 18
Evaluation function: numOverlaps
Randomization function: randomizeRegions
attr(,"class")
[1] "permTestResultsList"plot(EPI_CAD_3)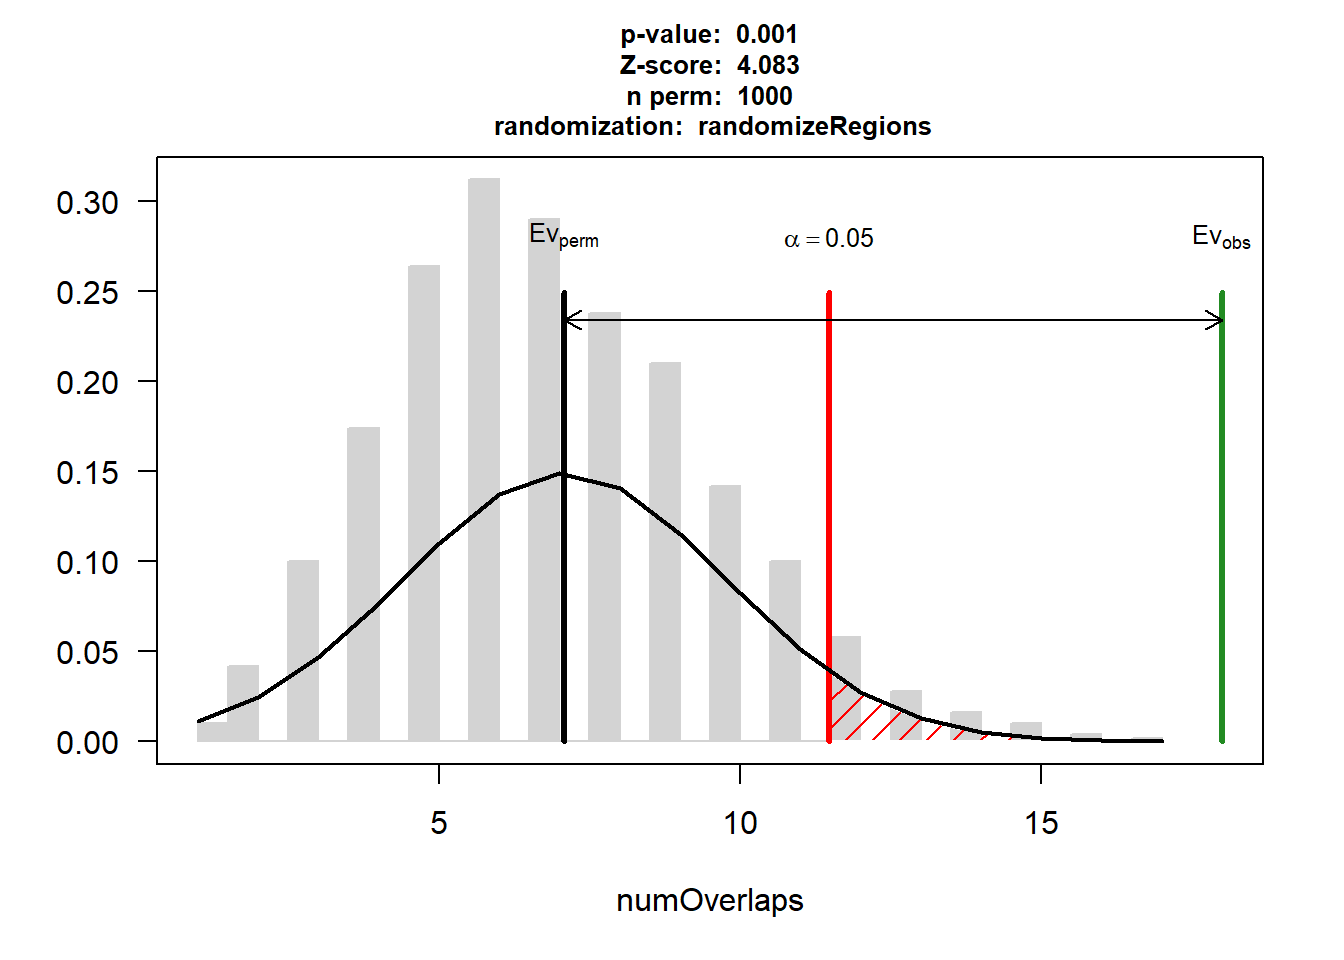
| Version | Author | Date |
|---|---|---|
| 88047ef | reneeisnowhere | 2025-07-28 |
# EPI_AF<- permTest(A= EPI_24_gr,
#                           B= AF_gr,
#                           ntimes=1000,
#                           randomize.function=randomizeRegions,
#                           evaluate.function = numOverlaps,
#                           genome="hg38",
#                           count.once= TRUE,
#                           universe=universe,
#                           verbose = TRUE,
#                           BPPARAM = param)
#
#
# EPI_HF<- permTest(A= EPI_24_gr,
#                           B= HF_gr,
#                           ntimes=1000,
#                           randomize.function=randomizeRegions,
#                           evaluate.function = numOverlaps,
#                           genome="hg38",
#                           count.once= TRUE,
#                           universe=universe,
#                           verbose = TRUE,
#                           BPPARAM = param)
#
#
# EPI_IHD<- permTest(A= EPI_24_gr,
#                           B= IHD_gr,
#                           ntimes=1000,
#                           randomize.function=randomizeRegions,
#                           evaluate.function = numOverlaps,
#                           genome="hg38",
#                           count.once= TRUE,
#                           universe=universe,
#                           verbose = TRUE,
#                           BPPARAM = param)
#
# EPI_CAD <- permTest(A= EPI_24_gr,
#                           B= CAD_gr,
#                           ntimes=1000,
#                           randomize.function=randomizeRegions,
#                           evaluate.function = numOverlaps,
#                           genome="hg38",
#                           count.once= TRUE,
#                           universe=universe,
#                           verbose = TRUE,
#                           BPPARAM = param)


EPI_AF
$numOverlaps
P-value: 0.000999000999000999
Z-score: 10.6464
Number of iterations: 1000
Alternative: greater
Evaluation of the original region set: 39
Evaluation function: numOverlaps
Randomization function: randomizeRegions
attr(,"class")
[1] "permTestResultsList"plot(EPI_AF)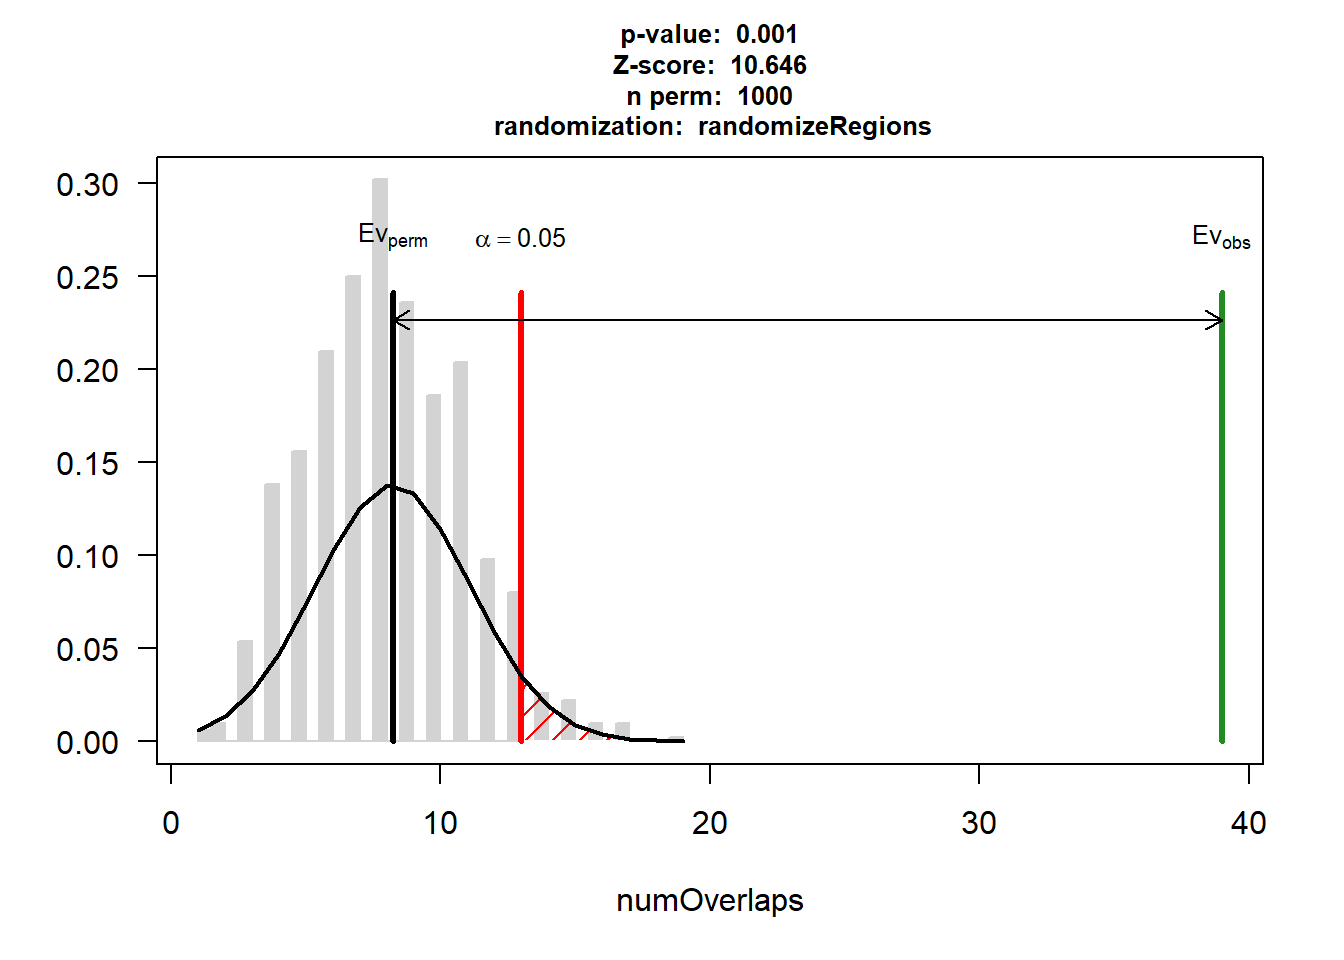
| Version | Author | Date |
|---|---|---|
| 88047ef | reneeisnowhere | 2025-07-28 |
EPI_HF$numOverlaps
P-value: 0.000999000999000999
Z-score: 4.3344
Number of iterations: 1000
Alternative: greater
Evaluation of the original region set: 15
Evaluation function: numOverlaps
Randomization function: randomizeRegions
attr(,"class")
[1] "permTestResultsList"plot(EPI_HF)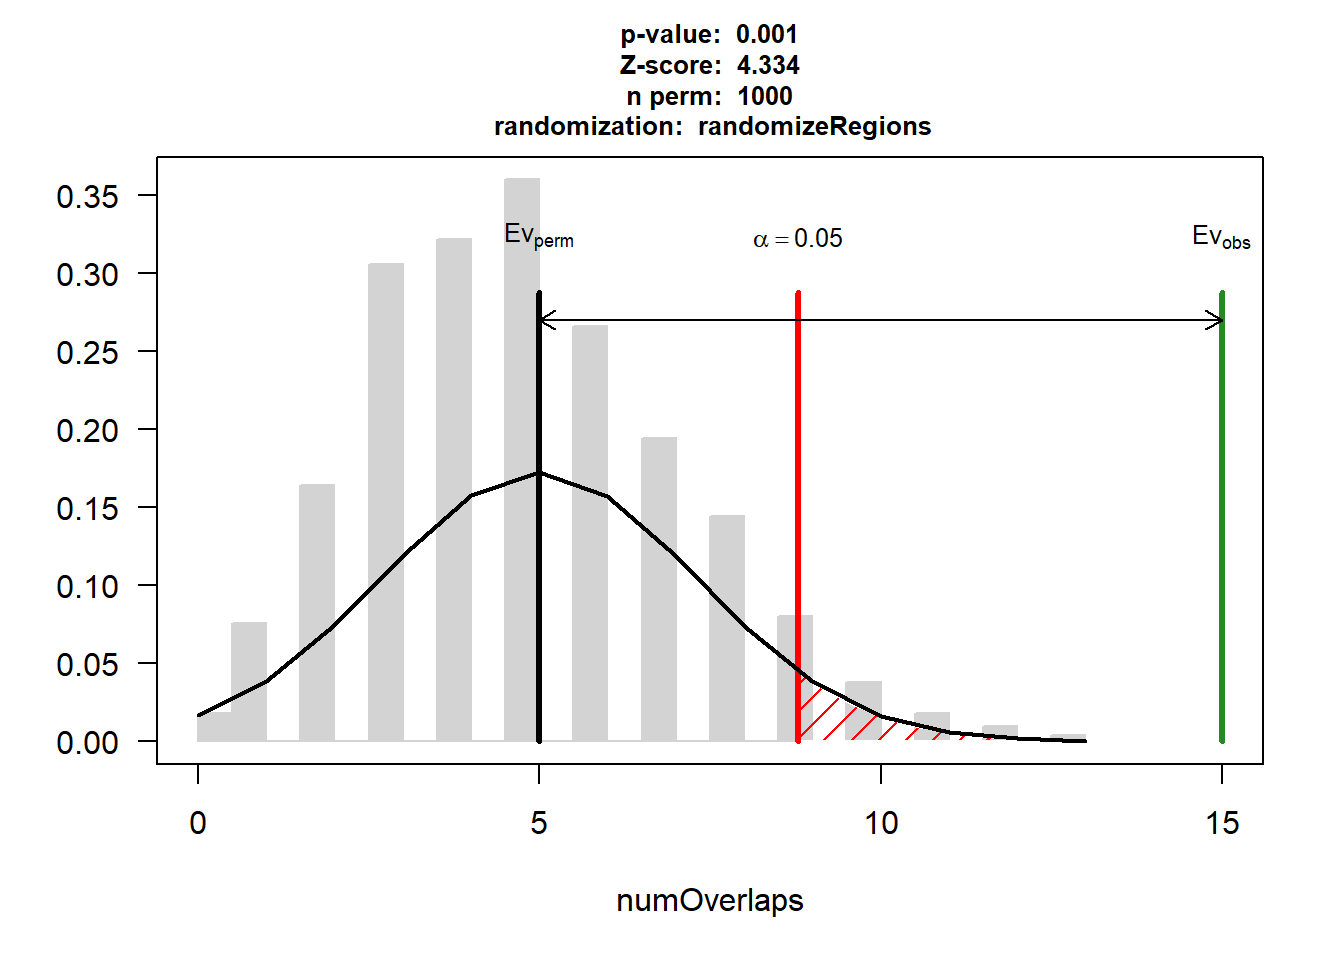
| Version | Author | Date |
|---|---|---|
| 88047ef | reneeisnowhere | 2025-07-28 |
EPI_IHD$numOverlaps
P-value: 0.0639360639360639
Z-score: 2.1658
Number of iterations: 1000
Alternative: greater
Evaluation of the original region set: 3
Evaluation function: numOverlaps
Randomization function: randomizeRegions
attr(,"class")
[1] "permTestResultsList"plot(EPI_IHD)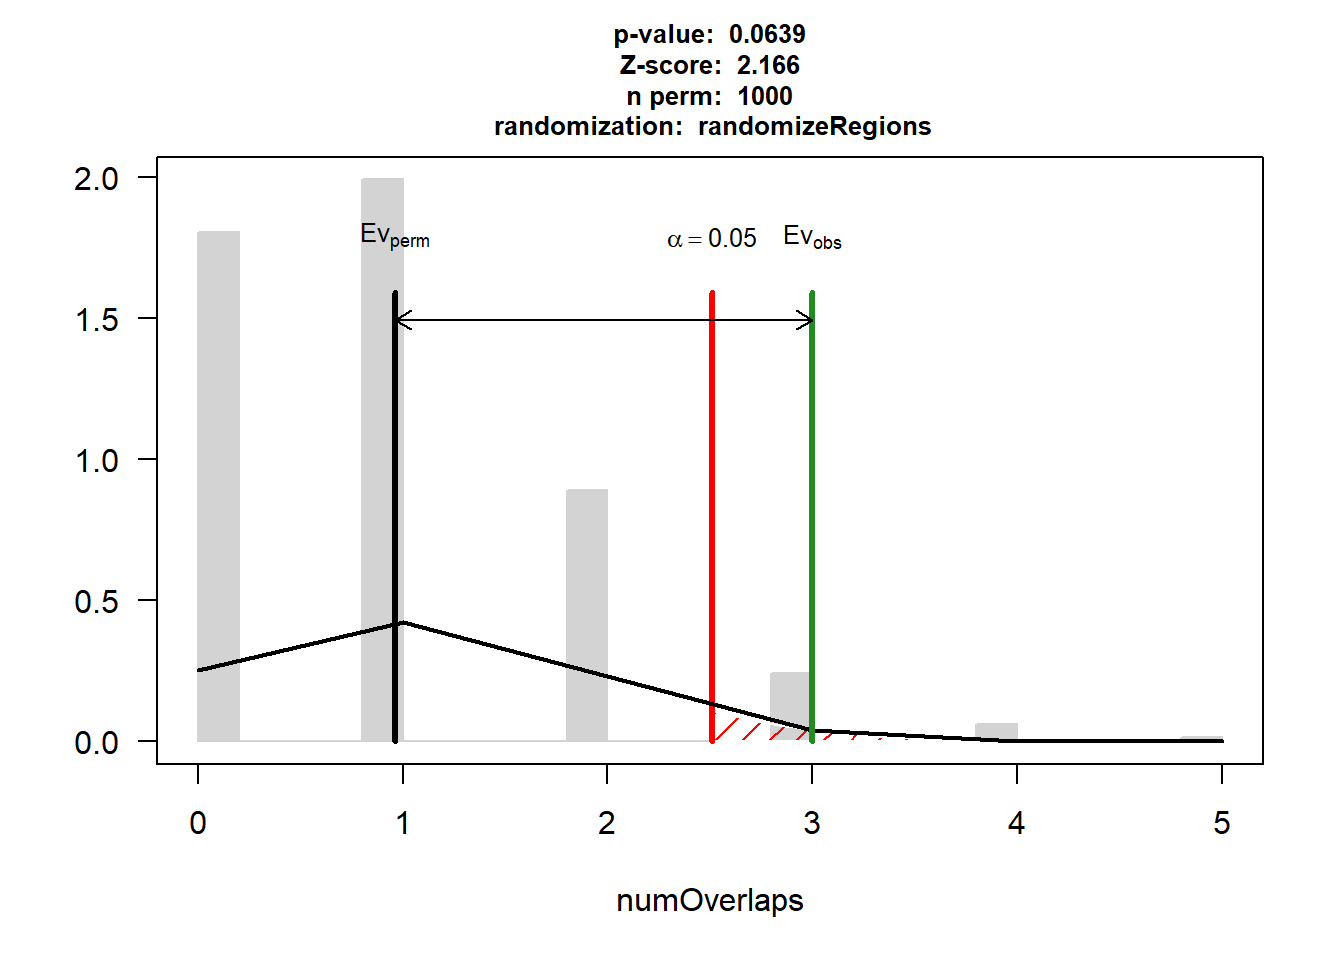
| Version | Author | Date |
|---|---|---|
| 88047ef | reneeisnowhere | 2025-07-28 |
EPI_CAD$numOverlaps
P-value: 0.000999000999000999
Z-score: 6.1142
Number of iterations: 1000
Alternative: greater
Evaluation of the original region set: 58
Evaluation function: numOverlaps
Randomization function: randomizeRegions
attr(,"class")
[1] "permTestResultsList"plot(EPI_CAD)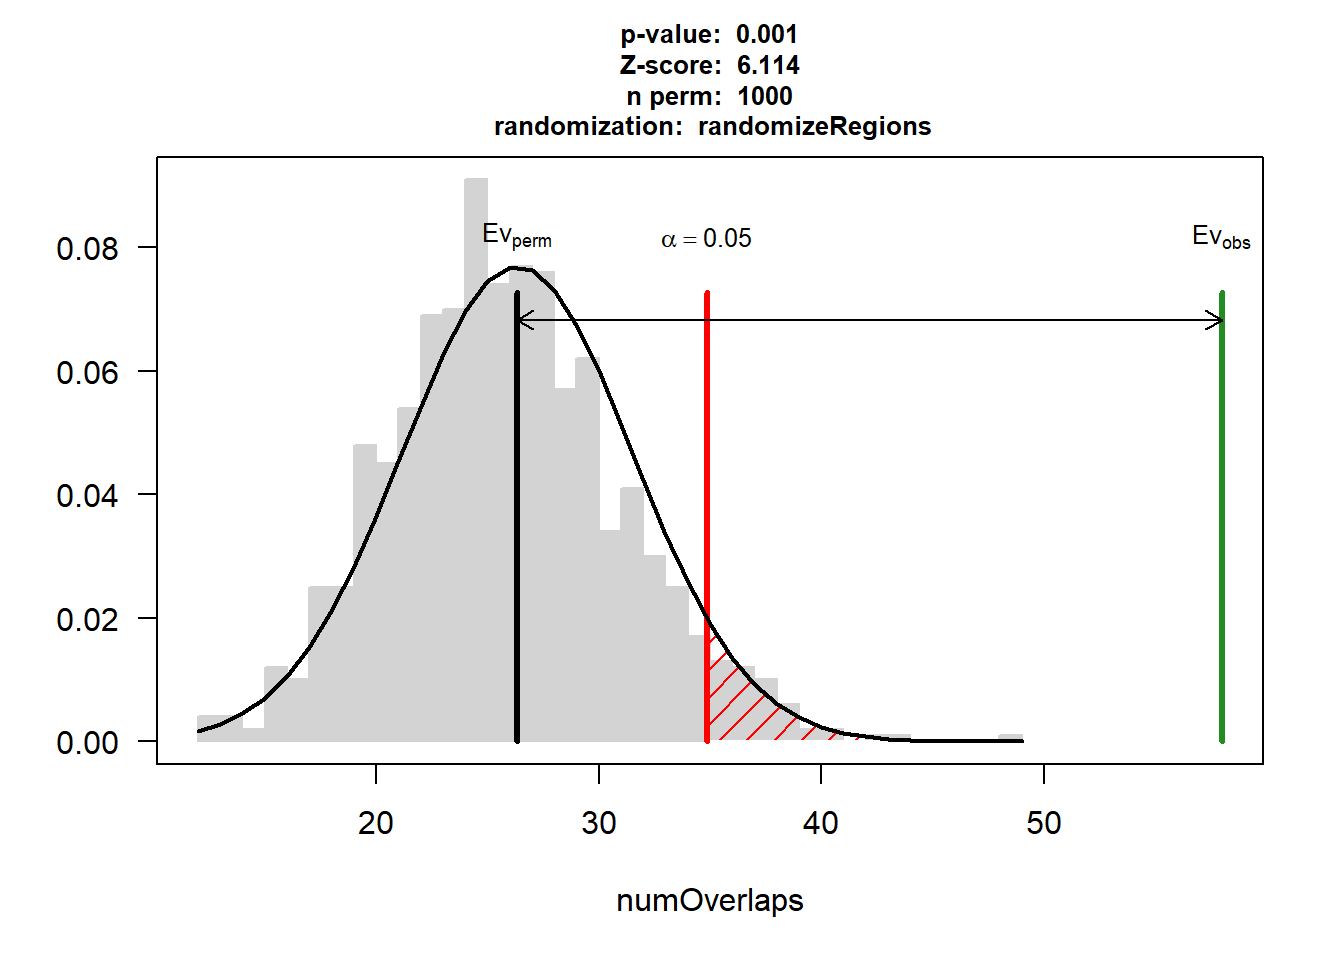
| Version | Author | Date |
|---|---|---|
| 88047ef | reneeisnowhere | 2025-07-28 |
# saveRDS(EPI_AF,"data/Final_four_data/re_analysis/perm_test_100/EPI_AF_24h.RDS")
# saveRDS(EPI_HF,"data/Final_four_data/re_analysis/perm_test_100/EPI_HF_24h.RDS")
# saveRDS(EPI_IHD,"data/Final_four_data/re_analysis/perm_test_100/EPI_IHD_24h.RDS")
# saveRDS(EPI_CAD,"data/Final_four_data/re_analysis/perm_test_100/EPI_CAD_24h.RDS")
#
# saveRDS(EPI_AF_3,"data/Final_four_data/re_analysis/perm_test_100/EPI_AF_3h.RDS")
# saveRDS(EPI_HF_3,"data/Final_four_data/re_analysis/perm_test_100/EPI_HF_3h.RDS")
# saveRDS(EPI_IHD_3,"data/Final_four_data/re_analysis/perm_test_100/EPI_IHD_3h.RDS")
# saveRDS(EPI_CAD_3,"data/Final_four_data/re_analysis/perm_test_100/EPI_CAD_3h.RDS")

# saveRDS(EPI_AF,"data/Final_four_data/re_analysis/perm_test_1000/EPI_AF_24h.RDS")
# saveRDS(EPI_HF,"data/Final_four_data/re_analysis/perm_test_1000/EPI_HF_24h.RDS")
# saveRDS(EPI_IHD,"data/Final_four_data/re_analysis/perm_test_1000/EPI_IHD_24h.RDS")
# saveRDS(EPI_CAD,"data/Final_four_data/re_analysis/perm_test_1000/EPI_CAD_24h.RDS")
#
# saveRDS(EPI_AF_3,"data/Final_four_data/re_analysis/perm_test_1000/EPI_AF_3h.RDS")
# saveRDS(EPI_HF_3,"data/Final_four_data/re_analysis/perm_test_1000/EPI_HF_3h.RDS")
# saveRDS(EPI_IHD_3,"data/Final_four_data/re_analysis/perm_test_1000/EPI_IHD_3h.RDS")
# saveRDS(EPI_CAD_3,"data/Final_four_data/re_analysis/perm_test_1000/EPI_CAD_3h.RDS")
PT DNR 24hr check
DNR_24_gr <- DNR_24_sig %>% separate_wider_delim(., cols="genes",names = c("seqnames","start","end"), delim= ".") %>%
  GRanges()

DNR_3_gr <- DNR_3_sig %>% separate_wider_delim(., cols="genes",names = c("seqnames","start","end"), delim= ".") %>%
  GRanges()

DNR_AF <- readRDS("data/Final_four_data/re_analysis/perm_test_1000/DNR_AF_24h.RDS")
DNR_HF <- readRDS("data/Final_four_data/re_analysis/perm_test_1000/DNR_HF_24h.RDS")
DNR_IHD <- readRDS("data/Final_four_data/re_analysis/perm_test_1000/DNR_IHD_24h.RDS")
DNR_CAD <- readRDS("data/Final_four_data/re_analysis/perm_test_1000/DNR_CAD_24h.RDS")

DNR_AF_3 <- readRDS("data/Final_four_data/re_analysis/perm_test_1000/DNR_AF_3h.RDS")
DNR_HF_3 <- readRDS("data/Final_four_data/re_analysis/perm_test_1000/DNR_HF_3h.RDS")
DNR_IHD_3 <- readRDS("data/Final_four_data/re_analysis/perm_test_1000/DNR_IHD_3h.RDS")
DNR_CAD_3 <- readRDS("data/Final_four_data/re_analysis/perm_test_1000/DNR_CAD_3h.RDS")

# DNR_AF_3<- permTest(A= DNR_3_gr,
#                           B= AF_gr,
#                           ntimes=1000,
#                           randomize.function=randomizeRegions,
#                           evaluate.function = numOverlaps,
#                           genome="hg38",
#                           count.once= TRUE,
#                           universe=universe,
#                         #
#                           verbose = TRUE,
#                           BPPARAM = param)
# DNR_HF_3<- permTest(A= DNR_3_gr,
#                           B= HF_gr,
#                           ntimes=1000,
#                           randomize.function=randomizeRegions,
#                           evaluate.function = numOverlaps,
#                           genome="hg38",
#                           count.once= TRUE,
#                           universe=universe,
#
#                           verbose = TRUE,
#                           BPPARAM = param)
#
#
# DNR_IHD_3<- permTest(A= DNR_3_gr,
#                           B= IHD_gr,
#                           ntimes=1000,
#                           randomize.function=randomizeRegions,
#                           evaluate.function = numOverlaps,
#                           genome="hg38",
#                           count.once= TRUE,
#                           universe=universe,
#
#                           verbose = TRUE,
#                           BPPARAM = param)
#
# DNR_CAD_3<- permTest(A= DNR_3_gr,
#                           B= CAD_gr,
#                           ntimes=1000,
#                           randomize.function=randomizeRegions,
#                           evaluate.function = numOverlaps,
#                           genome="hg38",
#                           count.once= TRUE,
#                           universe=universe,
#
#                           verbose = TRUE,
#                           BPPARAM = param)


DNR_AF_3
$numOverlaps
P-value: 0.000999000999000999
Z-score: 9.0434
Number of iterations: 1000
Alternative: greater
Evaluation of the original region set: 21
Evaluation function: numOverlaps
Randomization function: randomizeRegions
attr(,"class")
[1] "permTestResultsList"plot(DNR_AF_3)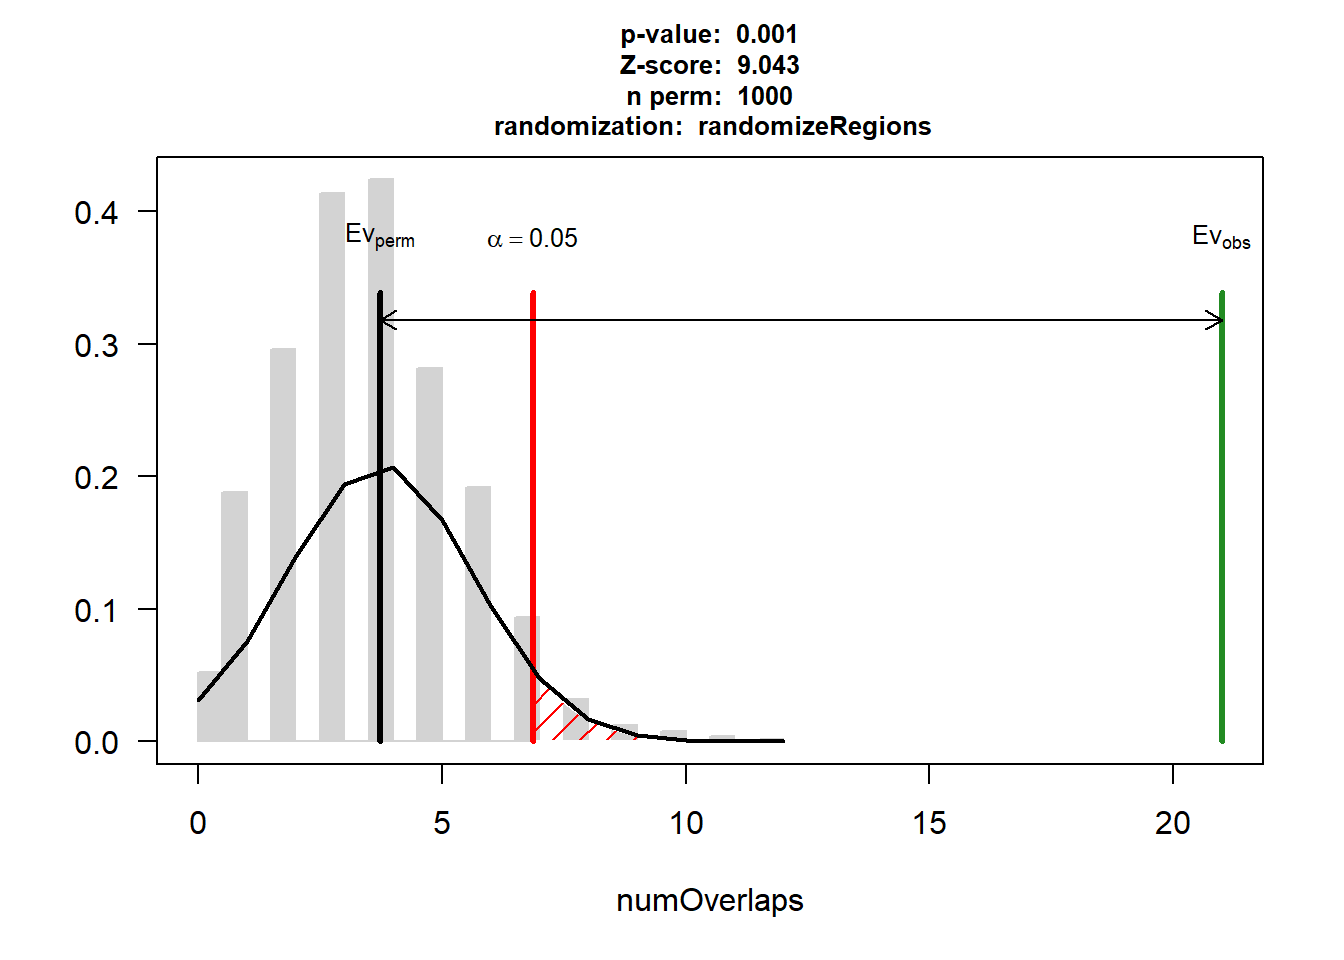
| Version | Author | Date |
|---|---|---|
| 88047ef | reneeisnowhere | 2025-07-28 |
DNR_HF_3$numOverlaps
P-value: 0.035964035964036
Z-score: 2.4989
Number of iterations: 1000
Alternative: greater
Evaluation of the original region set: 6
Evaluation function: numOverlaps
Randomization function: randomizeRegions
attr(,"class")
[1] "permTestResultsList"plot(DNR_HF_3)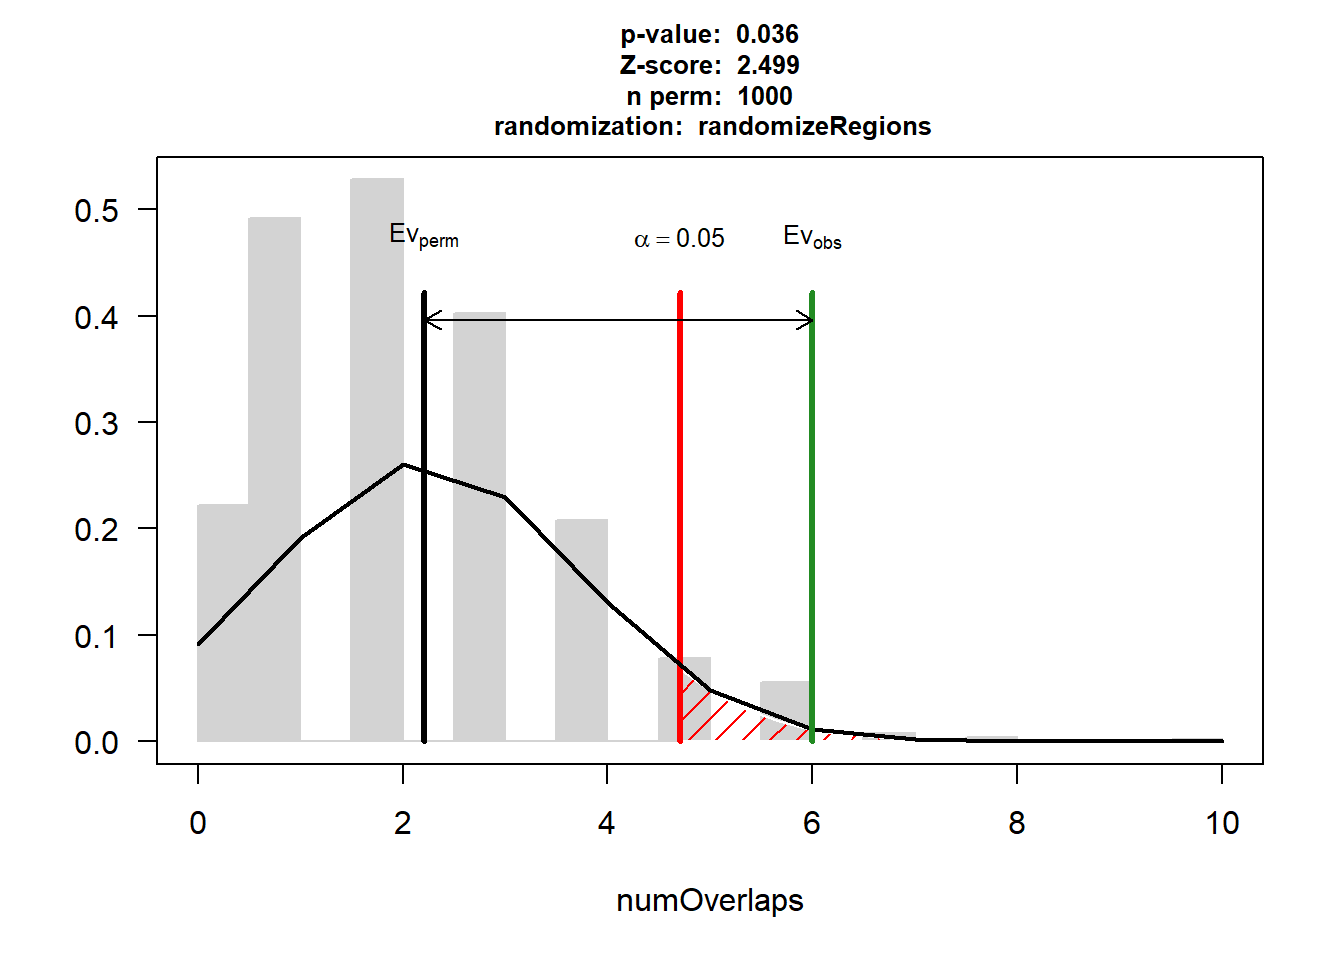
| Version | Author | Date |
|---|---|---|
| 88047ef | reneeisnowhere | 2025-07-28 |
DNR_IHD_3$numOverlaps
P-value: 0.0749250749250749
Z-score: 2.36
Number of iterations: 1000
Alternative: greater
Evaluation of the original region set: 2
Evaluation function: numOverlaps
Randomization function: randomizeRegions
attr(,"class")
[1] "permTestResultsList"plot(DNR_IHD_3)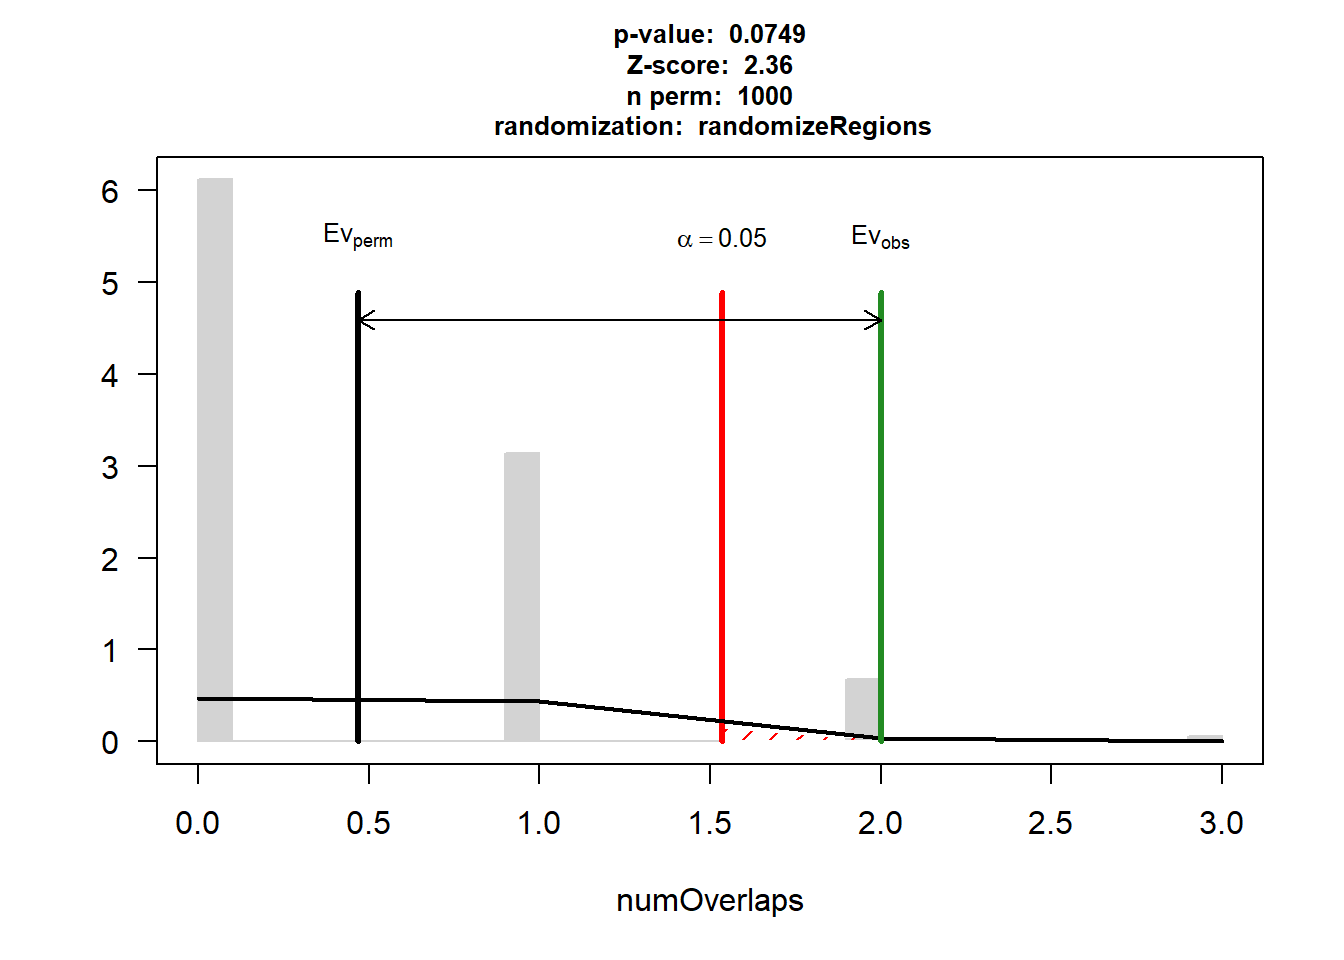
| Version | Author | Date |
|---|---|---|
| 88047ef | reneeisnowhere | 2025-07-28 |
DNR_CAD_3$numOverlaps
P-value: 0.000999000999000999
Z-score: 4.6739
Number of iterations: 1000
Alternative: greater
Evaluation of the original region set: 28
Evaluation function: numOverlaps
Randomization function: randomizeRegions
attr(,"class")
[1] "permTestResultsList"plot(DNR_CAD_3)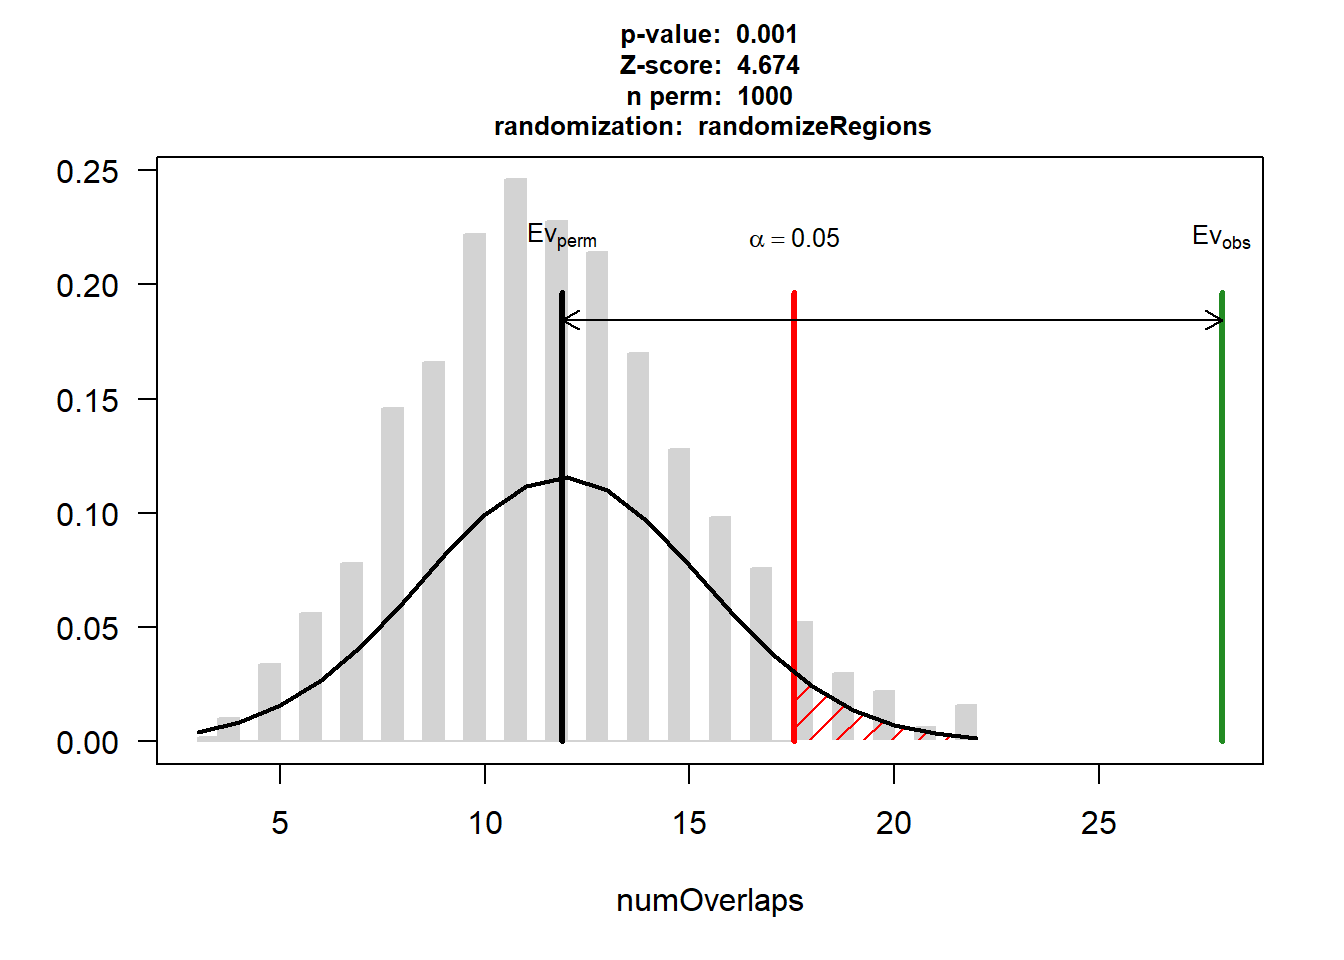
| Version | Author | Date |
|---|---|---|
| 88047ef | reneeisnowhere | 2025-07-28 |
# DNR_AF<- permTest(A= DNR_24_gr,
#                           B= AF_gr,
#                           ntimes=1000,
#                           randomize.function=randomizeRegions,
#                           evaluate.function = numOverlaps,
#                           genome="hg38",
#                           count.once= TRUE,
#                           universe=universe,
#                           verbose = TRUE,
#                           BPPARAM = param)
#
#
# DNR_HF<- permTest(A= DNR_24_gr,
#                           B= HF_gr,
#                           ntimes=1000,
#                           randomize.function=randomizeRegions,
#                           evaluate.function = numOverlaps,
#                           genome="hg38",
#                           count.once= TRUE,
#                           universe=universe,
#                           verbose = TRUE,
#                           BPPARAM = param)
#
#
# DNR_IHD<- permTest(A= DNR_24_gr,
#                           B= IHD_gr,
#                           ntimes=1000,
#                           randomize.function=randomizeRegions,
#                           evaluate.function = numOverlaps,
#                           genome="hg38",
#                           count.once= TRUE,
#                           universe=universe,
#                           verbose = TRUE,
#                           BPPARAM = param)
#
# DNR_CAD <- permTest(A= DNR_24_gr,
#                           B= CAD_gr,
#                           ntimes=1000,
#                           randomize.function=randomizeRegions,
#                           evaluate.function = numOverlaps,
#                           genome="hg38",
#                           count.once= TRUE,
#                           universe=universe,
#                           verbose = TRUE,
#                           BPPARAM = param)
#

DNR_AF
$numOverlaps
P-value: 0.000999000999000999
Z-score: 9.4608
Number of iterations: 1000
Alternative: greater
Evaluation of the original region set: 41
Evaluation function: numOverlaps
Randomization function: randomizeRegions
attr(,"class")
[1] "permTestResultsList"plot(DNR_AF)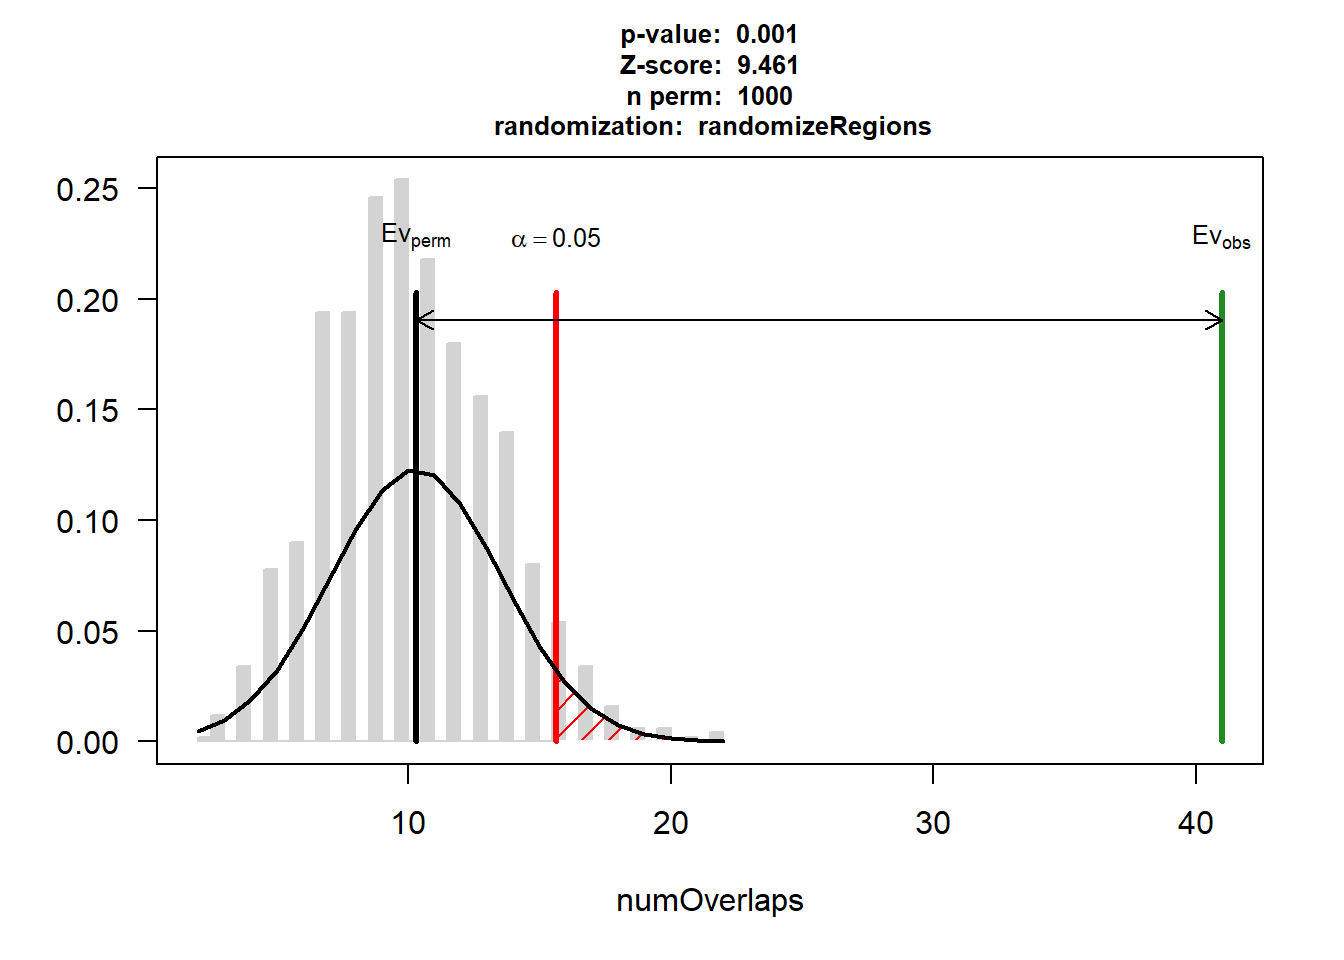
| Version | Author | Date |
|---|---|---|
| 88047ef | reneeisnowhere | 2025-07-28 |
DNR_HF$numOverlaps
P-value: 0.000999000999000999
Z-score: 5.3281
Number of iterations: 1000
Alternative: greater
Evaluation of the original region set: 19
Evaluation function: numOverlaps
Randomization function: randomizeRegions
attr(,"class")
[1] "permTestResultsList"plot(DNR_HF)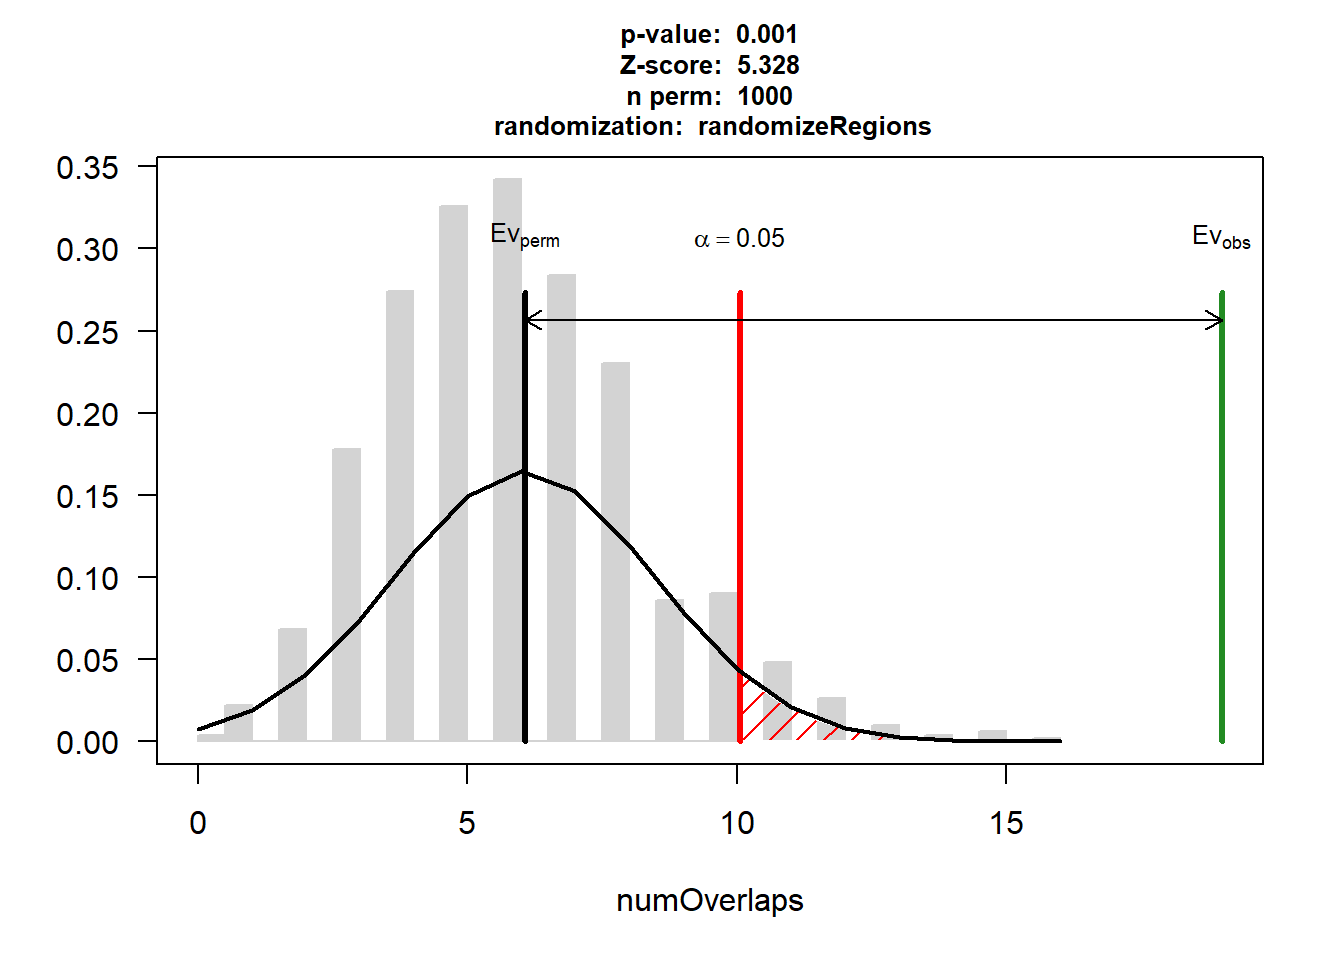
| Version | Author | Date |
|---|---|---|
| 88047ef | reneeisnowhere | 2025-07-28 |
DNR_IHD$numOverlaps
P-value: 0.108891108891109
Z-score: 1.6634
Number of iterations: 1000
Alternative: greater
Evaluation of the original region set: 3
Evaluation function: numOverlaps
Randomization function: randomizeRegions
attr(,"class")
[1] "permTestResultsList"plot(DNR_IHD)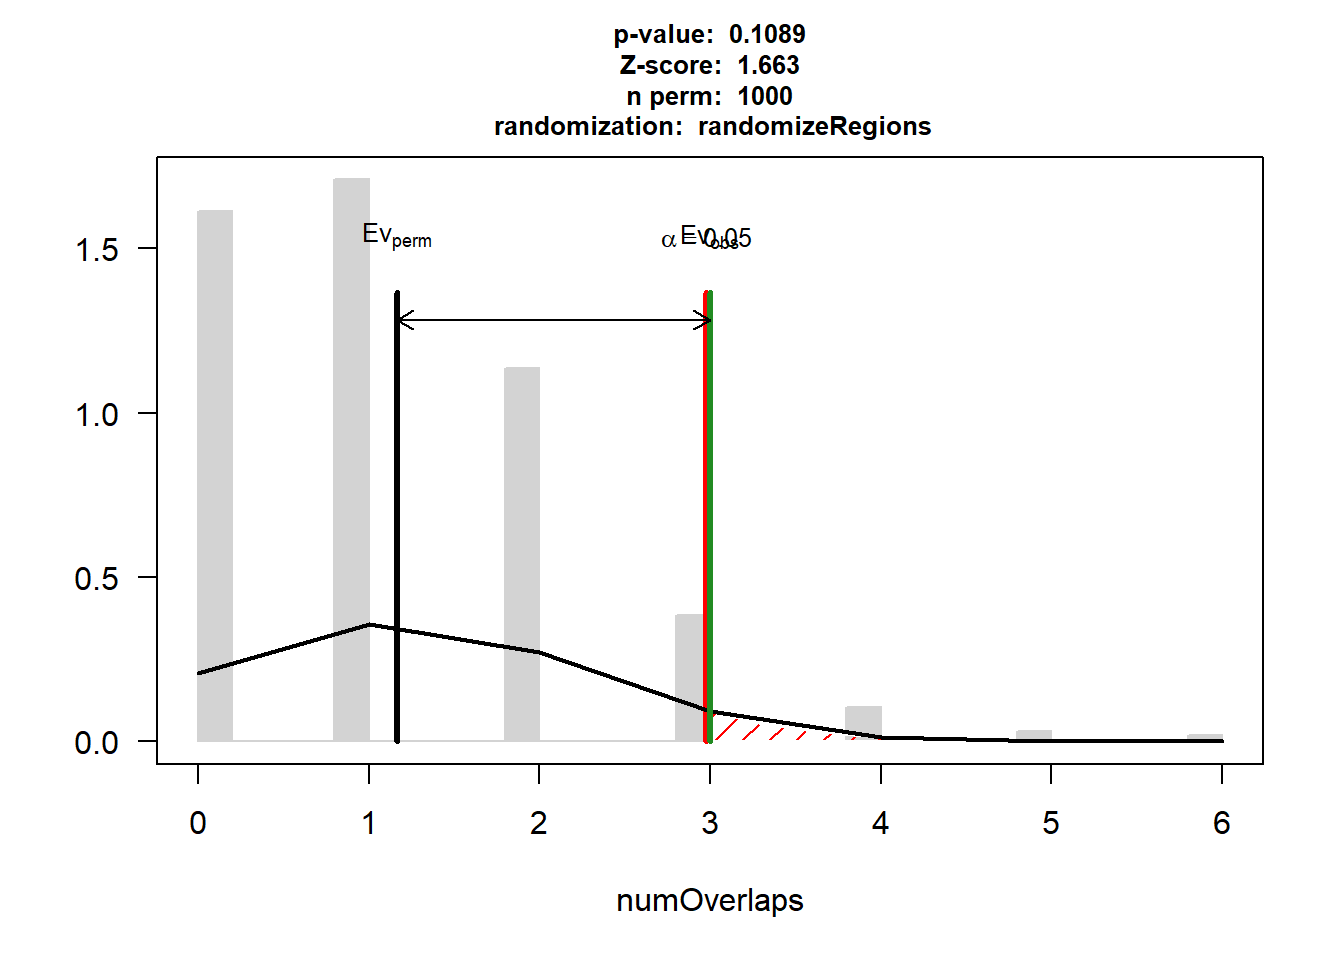
| Version | Author | Date |
|---|---|---|
| 88047ef | reneeisnowhere | 2025-07-28 |
DNR_CAD$numOverlaps
P-value: 0.000999000999000999
Z-score: 6.3211
Number of iterations: 1000
Alternative: greater
Evaluation of the original region set: 68
Evaluation function: numOverlaps
Randomization function: randomizeRegions
attr(,"class")
[1] "permTestResultsList"plot(DNR_CAD)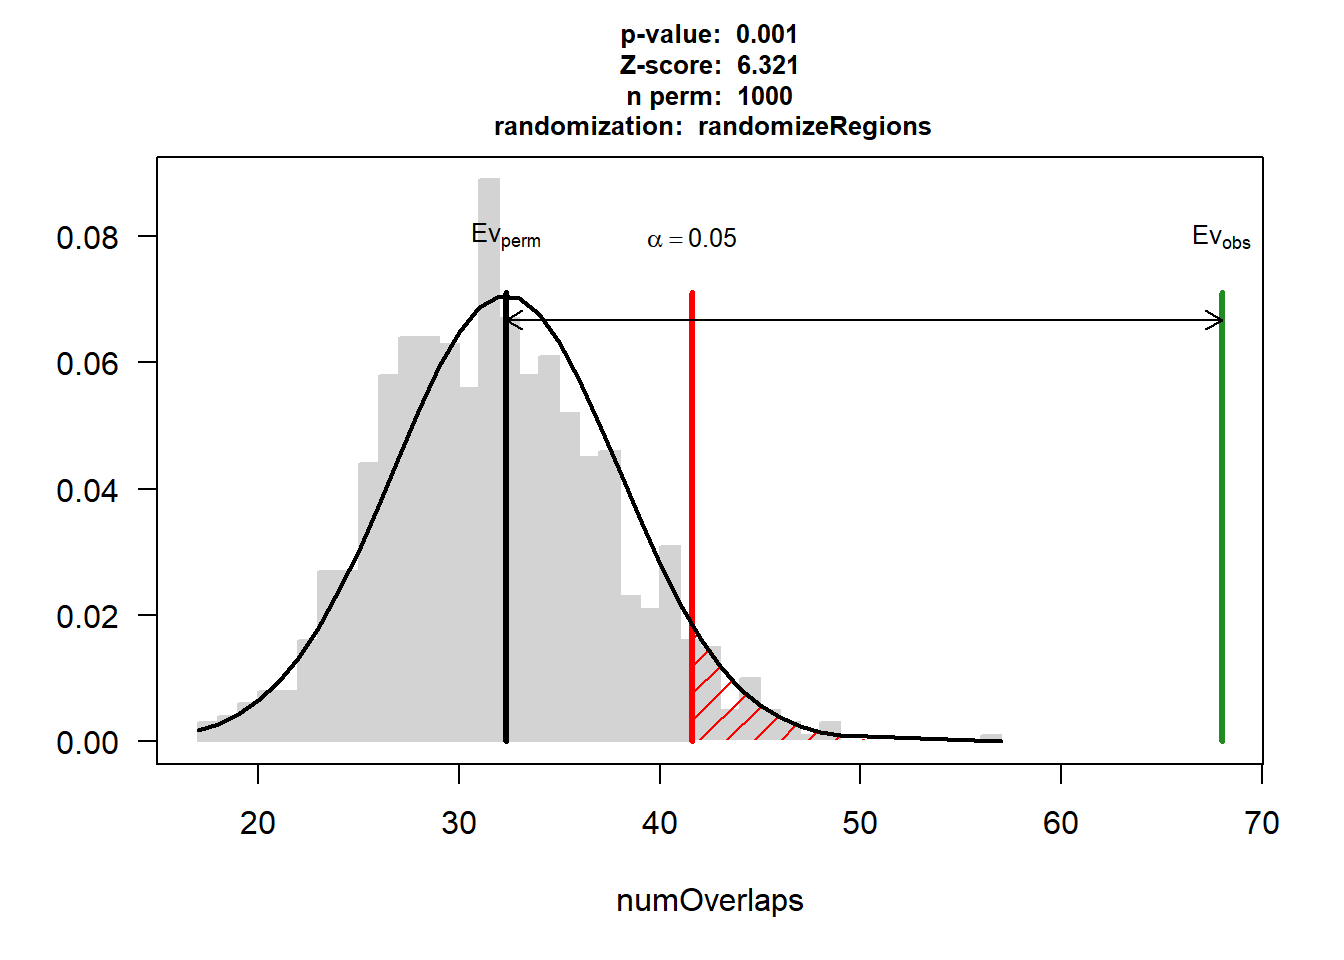
| Version | Author | Date |
|---|---|---|
| 88047ef | reneeisnowhere | 2025-07-28 |
# saveRDS(DNR_AF,"data/Final_four_data/re_analysis/perm_test_100/DNR_AF_24h.RDS")
# saveRDS(DNR_HF,"data/Final_four_data/re_analysis/perm_test_100/DNR_HF_24h.RDS")
# saveRDS(DNR_IHD,"data/Final_four_data/re_analysis/perm_test_100/DNR_IHD_24h.RDS")
# saveRDS(DNR_CAD,"data/Final_four_data/re_analysis/perm_test_100/DNR_CAD_24h.RDS")
#
# saveRDS(DNR_AF_3,"data/Final_four_data/re_analysis/perm_test_100/DNR_AF_3h.RDS")
# saveRDS(DNR_HF_3,"data/Final_four_data/re_analysis/perm_test_100/DNR_HF_3h.RDS")
# saveRDS(DNR_IHD_3,"data/Final_four_data/re_analysis/perm_test_100/DNR_IHD_3h.RDS")
# saveRDS(DNR_CAD_3,"data/Final_four_data/re_analysis/perm_test_100/DNR_CAD_3h.RDS")

# saveRDS(DNR_AF,"data/Final_four_data/re_analysis/perm_test_1000/DNR_AF_24h.RDS")
# saveRDS(DNR_HF,"data/Final_four_data/re_analysis/perm_test_1000/DNR_HF_24h.RDS")
# saveRDS(DNR_IHD,"data/Final_four_data/re_analysis/perm_test_1000/DNR_IHD_24h.RDS")
# saveRDS(DNR_CAD,"data/Final_four_data/re_analysis/perm_test_1000/DNR_CAD_24h.RDS")
#
# saveRDS(DNR_AF_3,"data/Final_four_data/re_analysis/perm_test_1000/DNR_AF_3h.RDS")
# saveRDS(DNR_HF_3,"data/Final_four_data/re_analysis/perm_test_1000/DNR_HF_3h.RDS")
# saveRDS(DNR_IHD_3,"data/Final_four_data/re_analysis/perm_test_1000/DNR_IHD_3h.RDS")
# saveRDS(DNR_CAD_3,"data/Final_four_data/re_analysis/perm_test_1000/DNR_CAD_3h.RDS")
PT MTX 24hr check
MTX_24_gr <- MTX_24_sig %>% separate_wider_delim(., cols="genes",names = c("seqnames","start","end"), delim= ".") %>%
  GRanges()

MTX_3_gr <- MTX_3_sig %>% separate_wider_delim(., cols="genes",names = c("seqnames","start","end"), delim= ".") %>%
  GRanges()

MTX_AF <- readRDS("data/Final_four_data/re_analysis/perm_test_1000/MTX_AF_24h.RDS")
MTX_HF <- readRDS("data/Final_four_data/re_analysis/perm_test_1000/MTX_HF_24h.RDS")
MTX_IHD <- readRDS("data/Final_four_data/re_analysis/perm_test_1000/MTX_IHD_24h.RDS")
MTX_CAD <- readRDS("data/Final_four_data/re_analysis/perm_test_1000/MTX_CAD_24h.RDS")

MTX_AF_3 <- readRDS("data/Final_four_data/re_analysis/perm_test_1000/MTX_AF_3h.RDS")
MTX_HF_3 <- readRDS("data/Final_four_data/re_analysis/perm_test_1000/MTX_HF_3h.RDS")
MTX_IHD_3 <- readRDS("data/Final_four_data/re_analysis/perm_test_1000/MTX_IHD_3h.RDS")
MTX_CAD_3 <- readRDS("data/Final_four_data/re_analysis/perm_test_1000/MTX_CAD_3h.RDS")

# MTX_AF_3<- permTest(A= MTX_3_gr,
#                           B= AF_gr,
#                           ntimes=1000,
#                           randomize.function=randomizeRegions,
#                           evaluate.function = numOverlaps,
#                           genome="hg38",
#                           count.once= TRUE,
#                           universe=universe,
#                         #
#                           verbose = TRUE,
#                           BPPARAM = param)
# MTX_HF_3<- permTest(A= MTX_3_gr,
#                           B= HF_gr,
#                           ntimes=1000,
#                           randomize.function=randomizeRegions,
#                           evaluate.function = numOverlaps,
#                           genome="hg38",
#                           count.once= TRUE,
#                           universe=universe,
#
#                           verbose = TRUE,
#                           BPPARAM = param)
#
#
# MTX_IHD_3<- permTest(A= MTX_3_gr,
#                           B= IHD_gr,
#                           ntimes=1000,
#                           randomize.function=randomizeRegions,
#                           evaluate.function = numOverlaps,
#                           genome="hg38",
#                           count.once= TRUE,
#                           universe=universe,
#
#                           verbose = TRUE,
#                           BPPARAM = param)
#
# MTX_CAD_3<- permTest(A= MTX_3_gr,
#                           B= CAD_gr,
#                           ntimes=1000,
#                           randomize.function=randomizeRegions,
#                           evaluate.function = numOverlaps,
#                           genome="hg38",
#                           count.once= TRUE,
#                           universe=universe,
#
#                           verbose = TRUE,
#                           BPPARAM = param)


MTX_AF_3
$numOverlaps
P-value: 0.877122877122877
Z-score: -0.3634
Number of iterations: 1000
Alternative: less
Evaluation of the original region set: 0
Evaluation function: numOverlaps
Randomization function: randomizeRegions
attr(,"class")
[1] "permTestResultsList"plot(MTX_AF_3)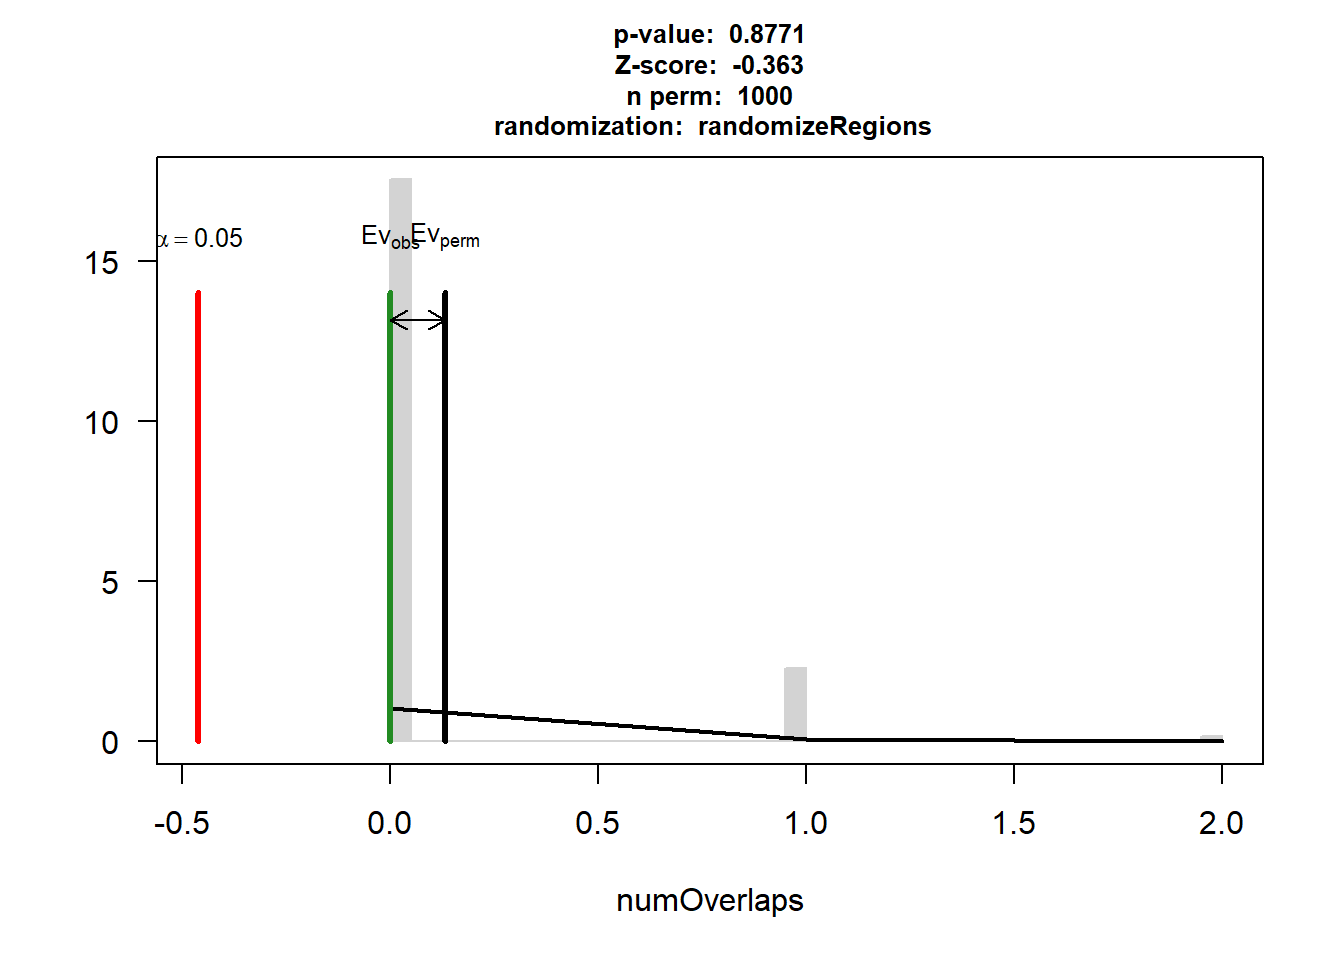
| Version | Author | Date |
|---|---|---|
| 88047ef | reneeisnowhere | 2025-07-28 |
MTX_HF_3$numOverlaps
P-value: 0.0749250749250749
Z-score: 3.3231
Number of iterations: 1000
Alternative: greater
Evaluation of the original region set: 1
Evaluation function: numOverlaps
Randomization function: randomizeRegions
attr(,"class")
[1] "permTestResultsList"plot(MTX_HF_3)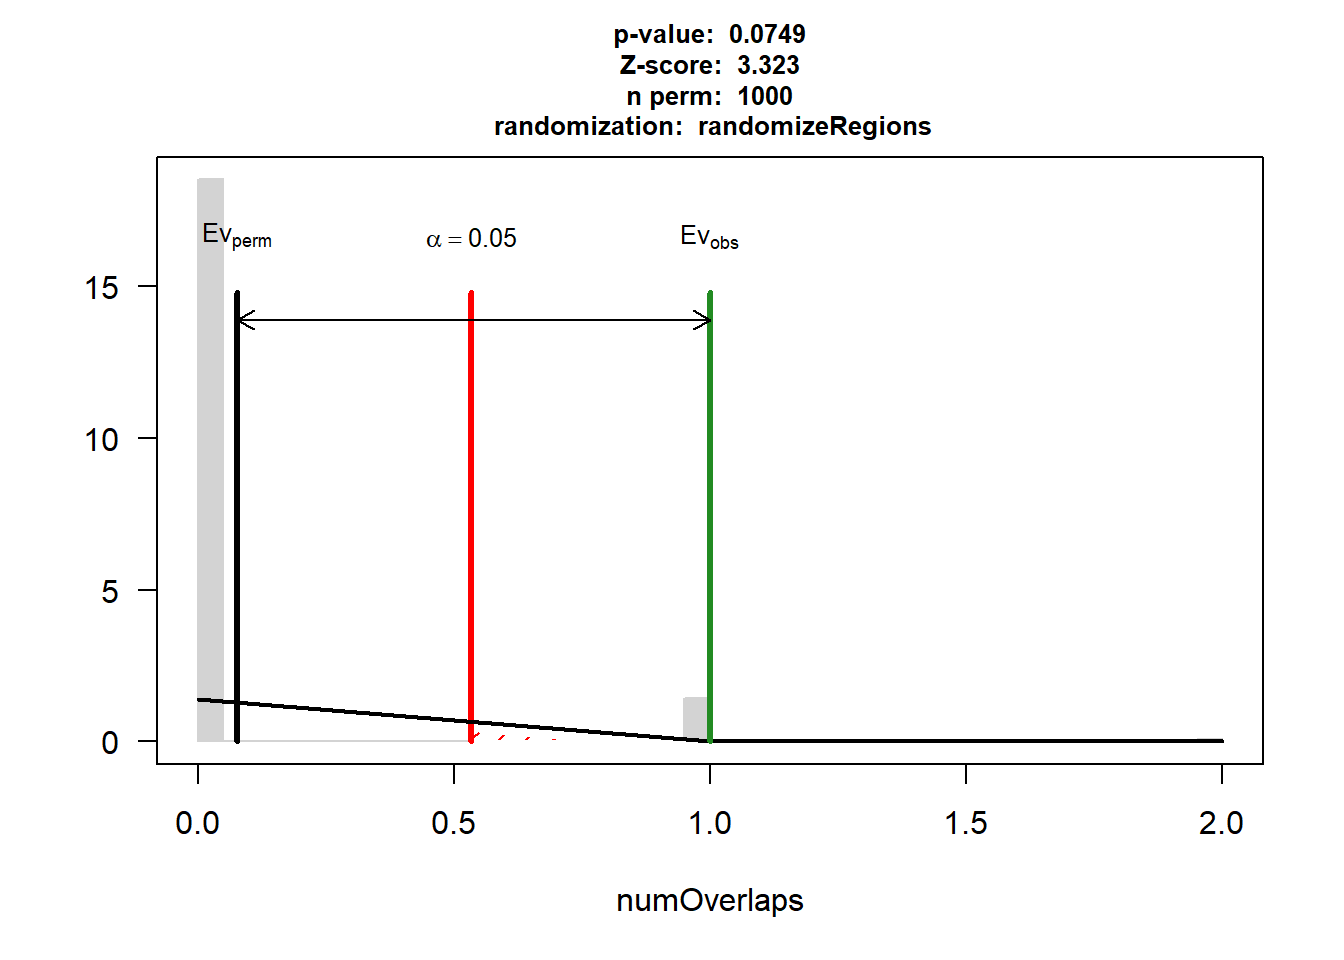
| Version | Author | Date |
|---|---|---|
| 88047ef | reneeisnowhere | 2025-07-28 |
MTX_IHD_3$numOverlaps
P-value: 0.983016983016983
Z-score: -0.1314
Number of iterations: 1000
Alternative: less
Evaluation of the original region set: 0
Evaluation function: numOverlaps
Randomization function: randomizeRegions
attr(,"class")
[1] "permTestResultsList"plot(MTX_IHD_3)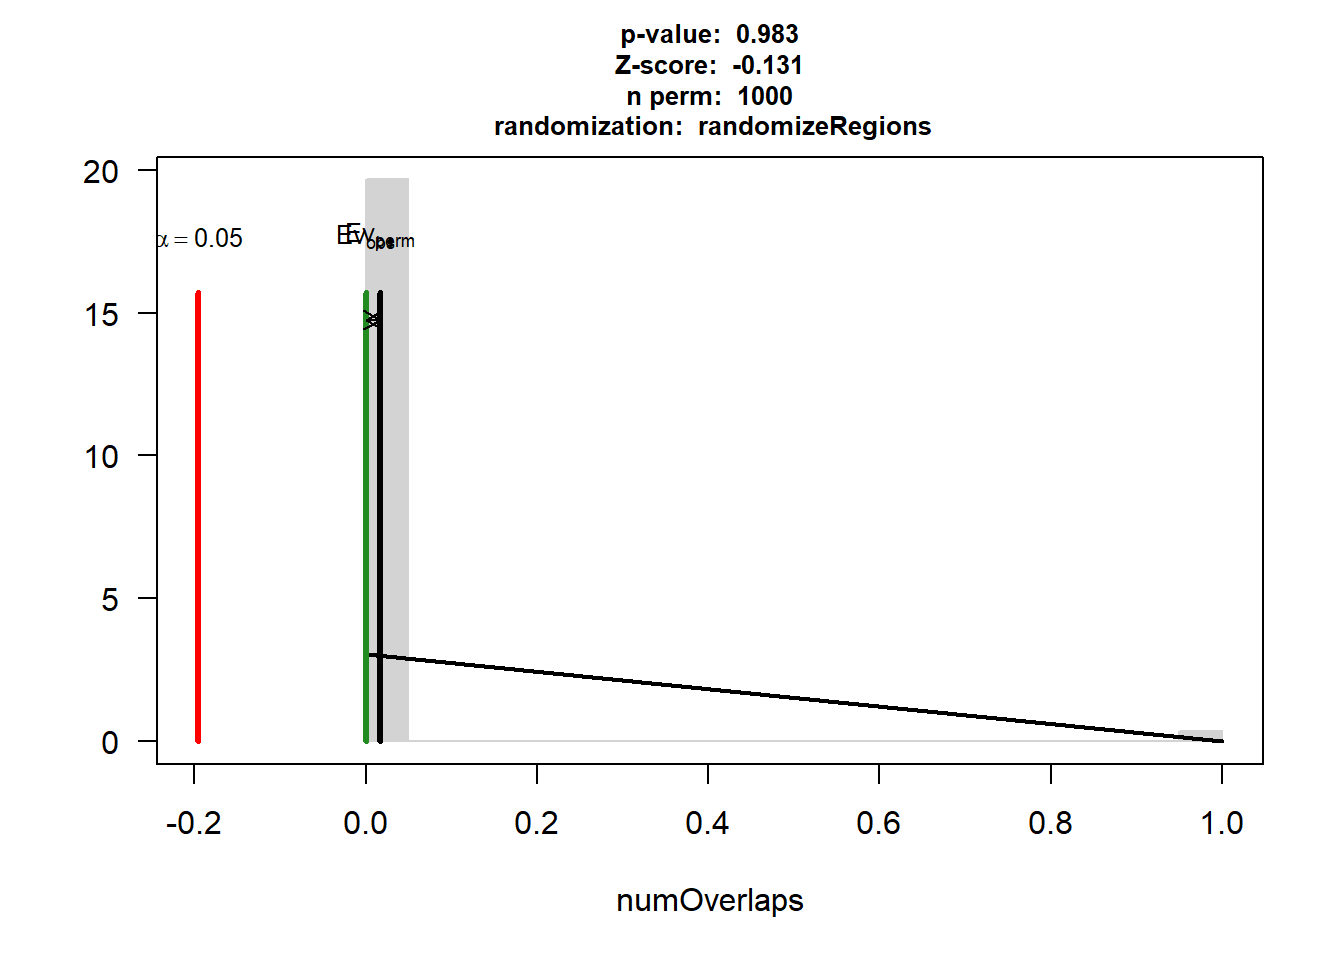
| Version | Author | Date |
|---|---|---|
| 88047ef | reneeisnowhere | 2025-07-28 |
MTX_CAD_3$numOverlaps
P-value: 0.704295704295704
Z-score: -0.5928
Number of iterations: 1000
Alternative: less
Evaluation of the original region set: 0
Evaluation function: numOverlaps
Randomization function: randomizeRegions
attr(,"class")
[1] "permTestResultsList"plot(MTX_CAD_3)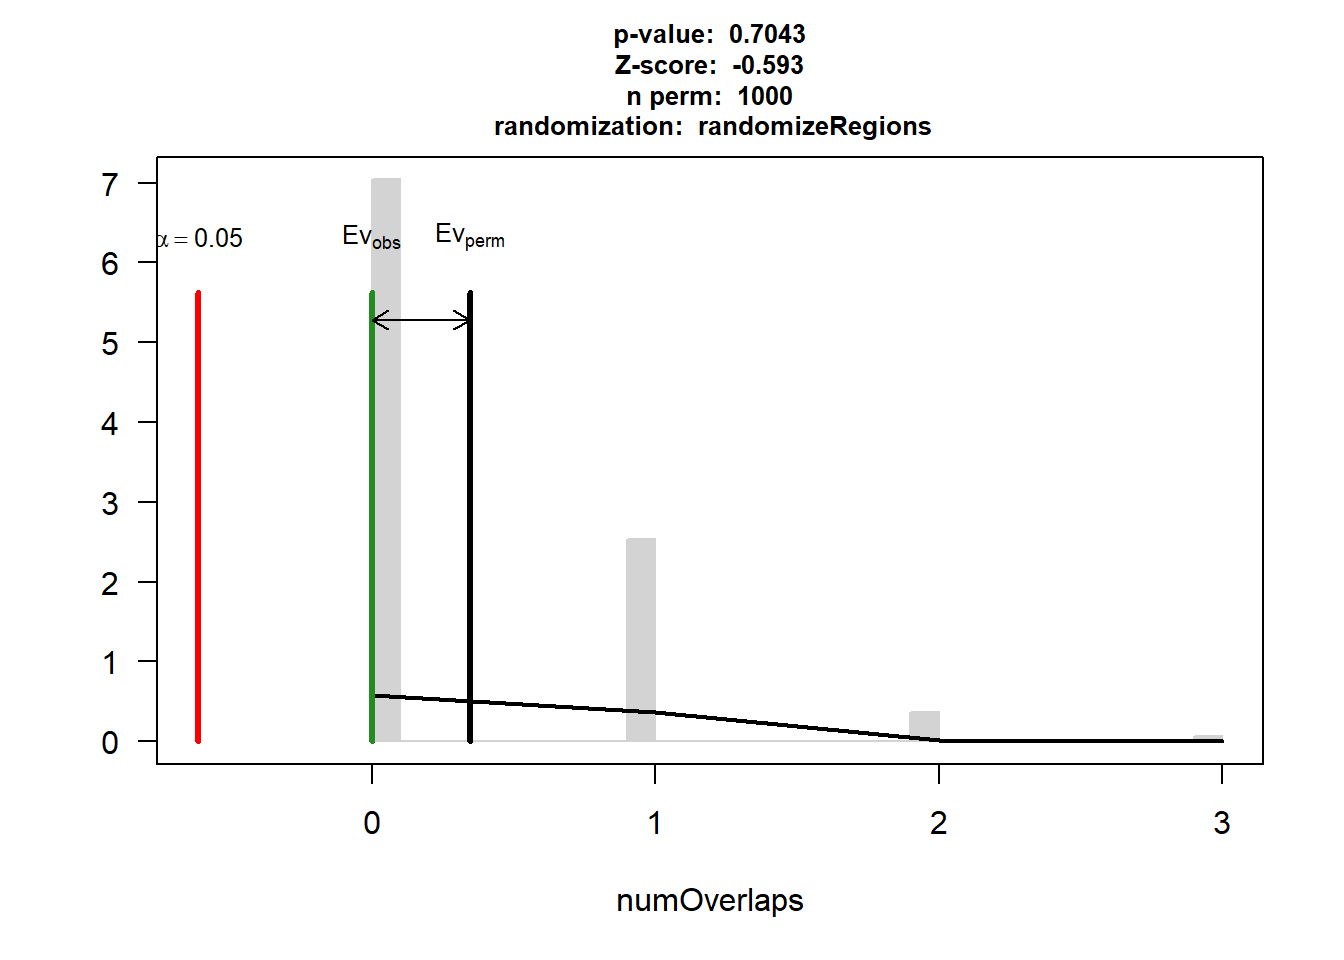
| Version | Author | Date |
|---|---|---|
| 88047ef | reneeisnowhere | 2025-07-28 |
# MTX_AF<- permTest(A= MTX_24_gr,
#                           B= AF_gr,
#                           ntimes=1000,
#                           randomize.function=randomizeRegions,
#                           evaluate.function = numOverlaps,
#                           genome="hg38",
#                           count.once= TRUE,
#                           universe=universe,
#                           verbose = TRUE,
#                           BPPARAM = param)
#
#
# MTX_HF<- permTest(A= MTX_24_gr,
#                           B= HF_gr,
#                           ntimes=1000,
#                           randomize.function=randomizeRegions,
#                           evaluate.function = numOverlaps,
#                           genome="hg38",
#                           count.once= TRUE,
#                           universe=universe,
#                           verbose = TRUE,
#                           BPPARAM = param)
#
#
# MTX_IHD<- permTest(A= MTX_24_gr,
#                           B= IHD_gr,
#                           ntimes=1000,
#                           randomize.function=randomizeRegions,
#                           evaluate.function = numOverlaps,
#                           genome="hg38",
#                           count.once= TRUE,
#                           universe=universe,
#                           verbose = TRUE,
#                           BPPARAM = param)
#
# MTX_CAD <- permTest(A= MTX_24_gr,
#                           B= CAD_gr,
#                           ntimes=1000,
#                           randomize.function=randomizeRegions,
#                           evaluate.function = numOverlaps,
#                           genome="hg38",
#                           count.once= TRUE,
#                           universe=universe,
#                           verbose = TRUE,
#                           BPPARAM = param)


MTX_AF
$numOverlaps
P-value: 0.000999000999000999
Z-score: 8.8214
Number of iterations: 1000
Alternative: greater
Evaluation of the original region set: 20
Evaluation function: numOverlaps
Randomization function: randomizeRegions
attr(,"class")
[1] "permTestResultsList"plot(MTX_AF)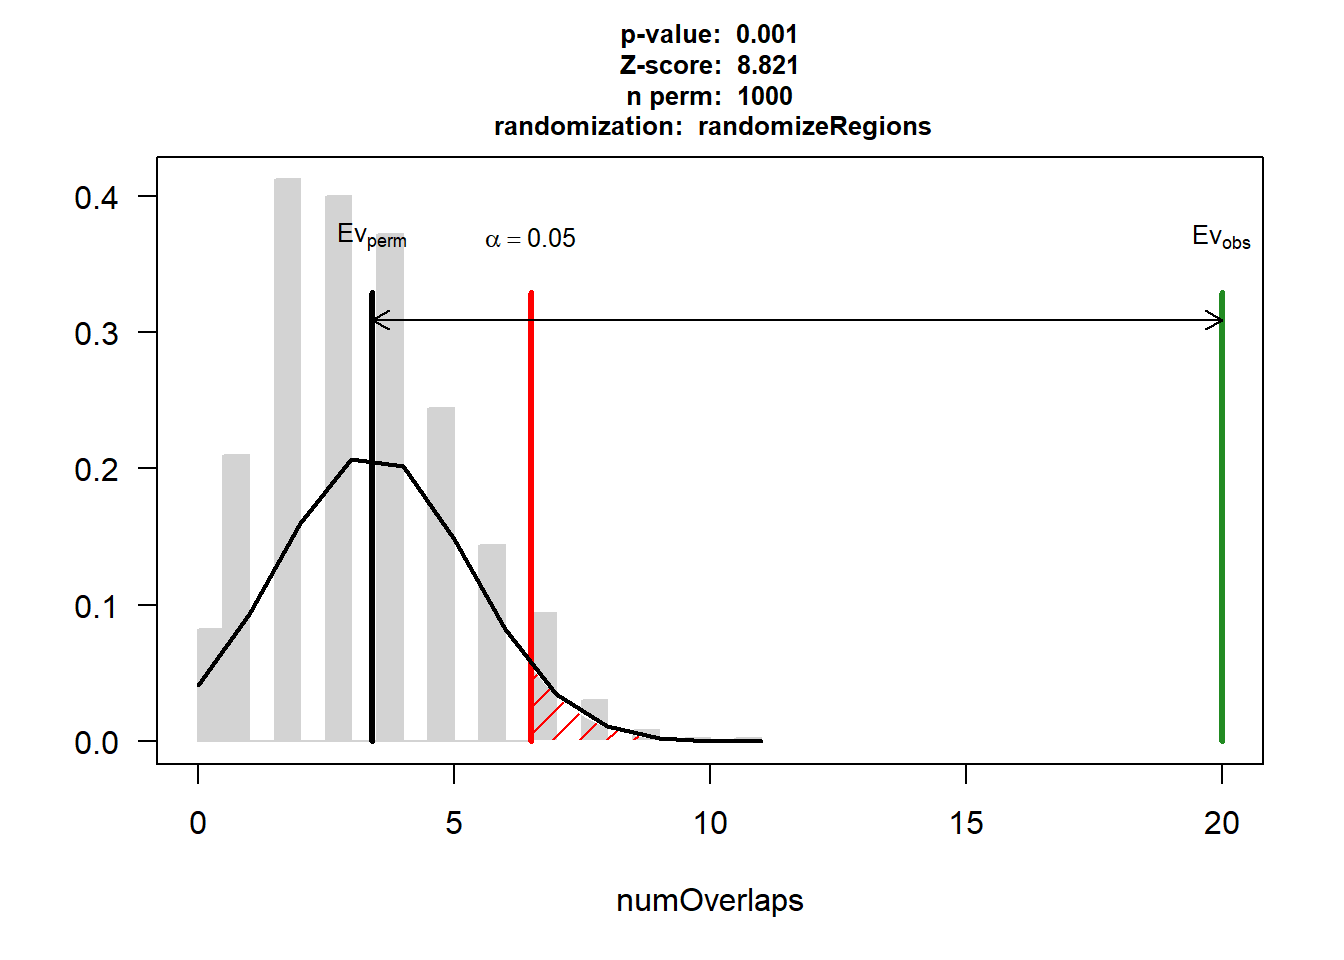
| Version | Author | Date |
|---|---|---|
| 88047ef | reneeisnowhere | 2025-07-28 |
MTX_HF$numOverlaps
P-value: 0.000999000999000999
Z-score: 5.7248
Number of iterations: 1000
Alternative: greater
Evaluation of the original region set: 10
Evaluation function: numOverlaps
Randomization function: randomizeRegions
attr(,"class")
[1] "permTestResultsList"plot(MTX_HF)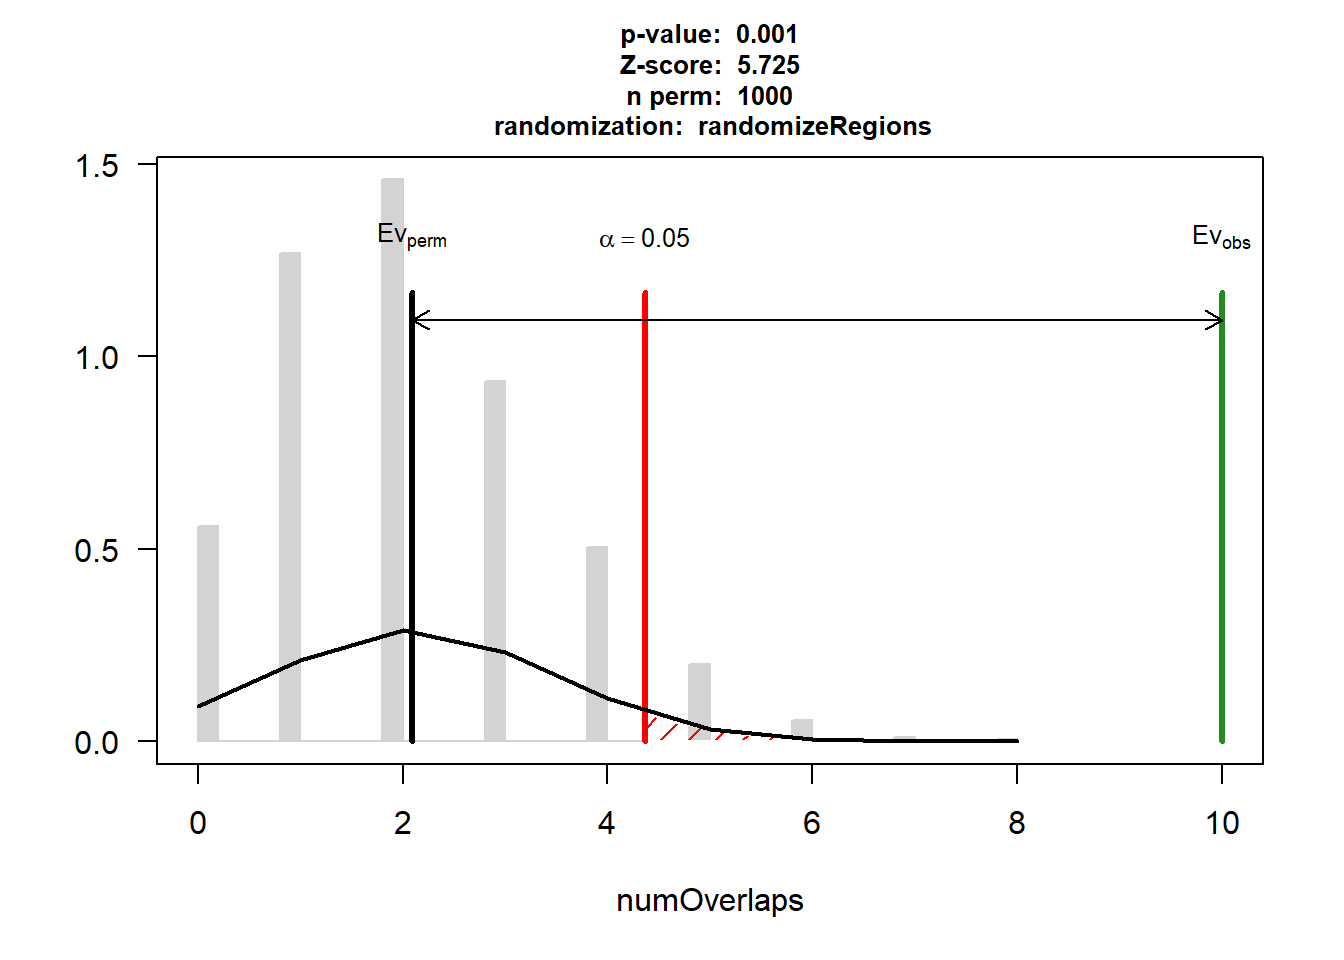
| Version | Author | Date |
|---|---|---|
| 88047ef | reneeisnowhere | 2025-07-28 |
MTX_IHD$numOverlaps
P-value: 0.0549450549450549
Z-score: 2.6148
Number of iterations: 1000
Alternative: greater
Evaluation of the original region set: 2
Evaluation function: numOverlaps
Randomization function: randomizeRegions
attr(,"class")
[1] "permTestResultsList"plot(MTX_IHD)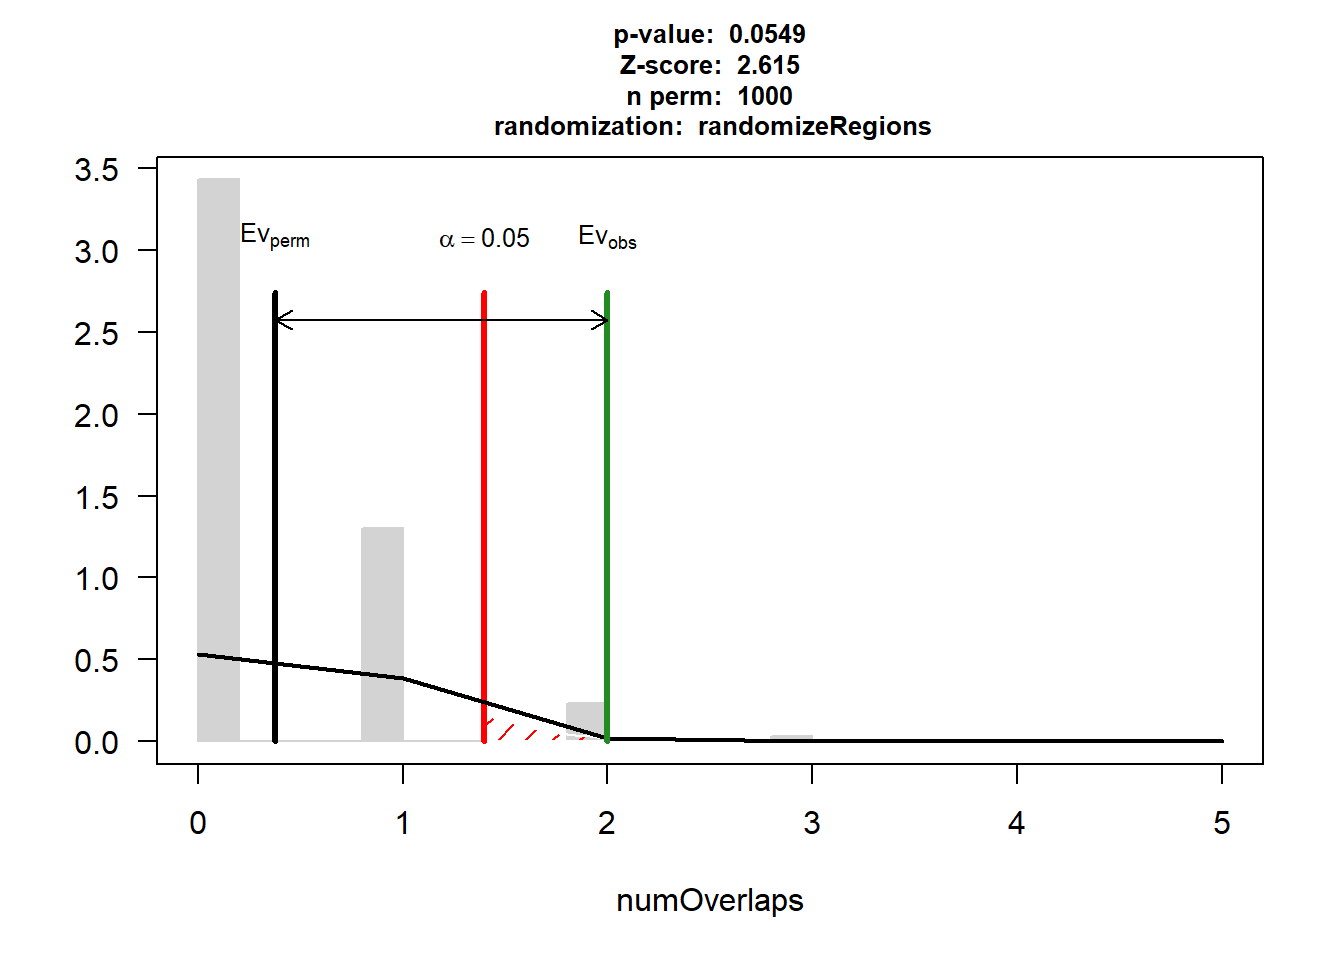
| Version | Author | Date |
|---|---|---|
| 88047ef | reneeisnowhere | 2025-07-28 |
MTX_CAD$numOverlaps
P-value: 0.000999000999000999
Z-score: 5.5747
Number of iterations: 1000
Alternative: greater
Evaluation of the original region set: 28
Evaluation function: numOverlaps
Randomization function: randomizeRegions
attr(,"class")
[1] "permTestResultsList"plot(MTX_CAD)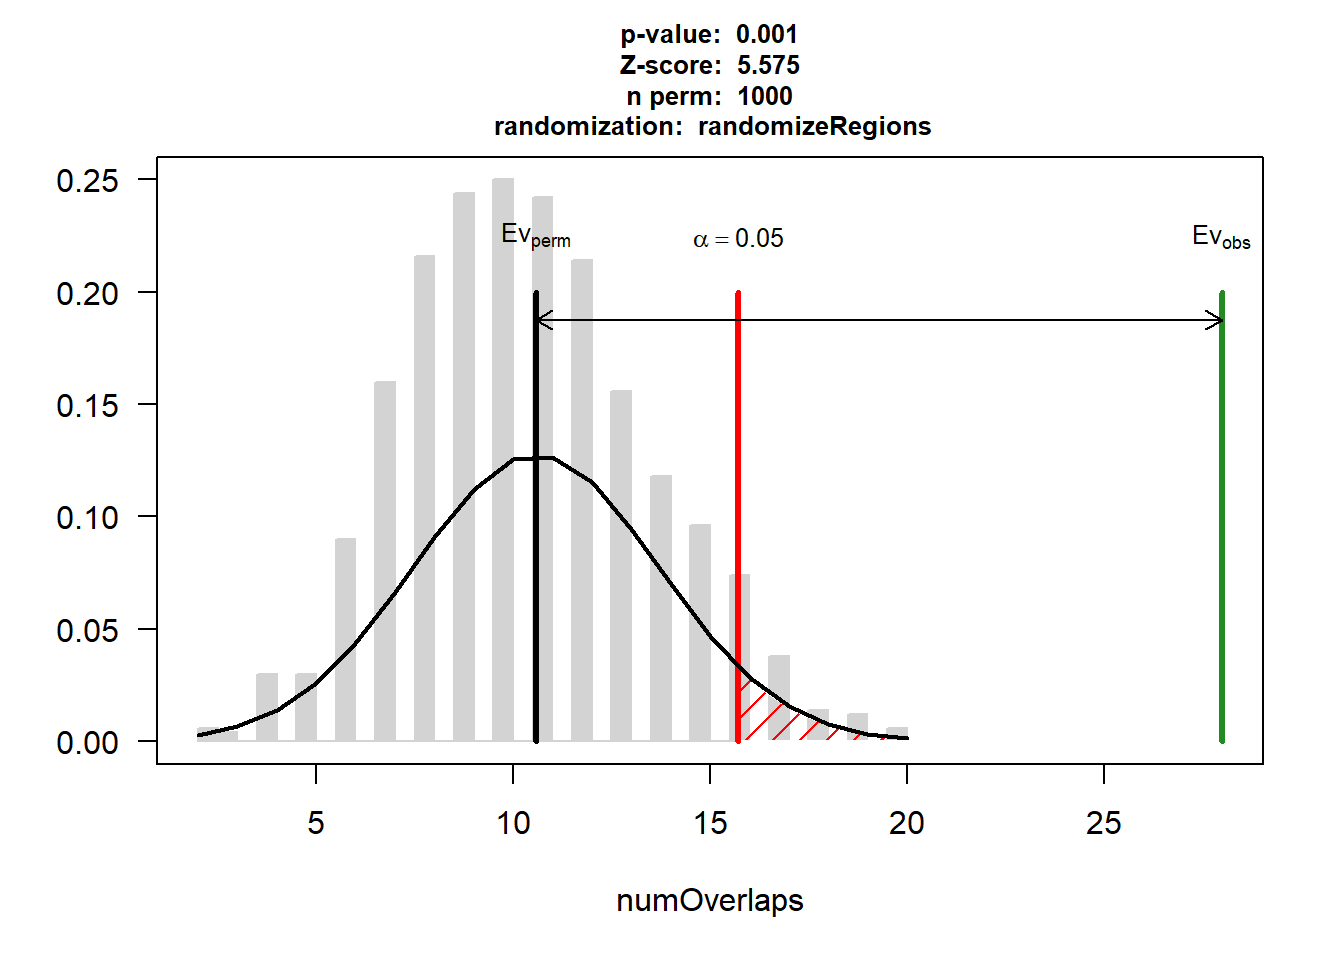
| Version | Author | Date |
|---|---|---|
| 88047ef | reneeisnowhere | 2025-07-28 |
# saveRDS(MTX_AF,"data/Final_four_data/re_analysis/perm_test_100/MTX_AF_24h.RDS")
# saveRDS(MTX_HF,"data/Final_four_data/re_analysis/perm_test_100/MTX_HF_24h.RDS")
# saveRDS(MTX_IHD,"data/Final_four_data/re_analysis/perm_test_100/MTX_IHD_24h.RDS")
# saveRDS(MTX_CAD,"data/Final_four_data/re_analysis/perm_test_100/MTX_CAD_24h.RDS")
#
# saveRDS(MTX_AF_3,"data/Final_four_data/re_analysis/perm_test_100/MTX_AF_3h.RDS")
# saveRDS(MTX_HF_3,"data/Final_four_data/re_analysis/perm_test_100/MTX_HF_3h.RDS")
# saveRDS(MTX_IHD_3,"data/Final_four_data/re_analysis/perm_test_100/MTX_IHD_3h.RDS")
# saveRDS(MTX_CAD_3,"data/Final_four_data/re_analysis/perm_test_100/MTX_CAD_3h.RDS")

# saveRDS(MTX_AF,"data/Final_four_data/re_analysis/perm_test_1000/MTX_AF_24h.RDS")
# saveRDS(MTX_HF,"data/Final_four_data/re_analysis/perm_test_1000/MTX_HF_24h.RDS")
# saveRDS(MTX_IHD,"data/Final_four_data/re_analysis/perm_test_1000/MTX_IHD_24h.RDS")
# saveRDS(MTX_CAD,"data/Final_four_data/re_analysis/perm_test_1000/MTX_CAD_24h.RDS")
#
# saveRDS(MTX_AF_3,"data/Final_four_data/re_analysis/perm_test_1000/MTX_AF_3h.RDS")
# saveRDS(MTX_HF_3,"data/Final_four_data/re_analysis/perm_test_1000/MTX_HF_3h.RDS")
# saveRDS(MTX_IHD_3,"data/Final_four_data/re_analysis/perm_test_1000/MTX_IHD_3h.RDS")
# saveRDS(MTX_CAD_3,"data/Final_four_data/re_analysis/perm_test_1000/MTX_CAD_3h.RDS")
Creating heatmaps
all_results_LFC <- all_results %>%  dplyr::select(source,genes,logFC) %>%
    pivot_wider(id_cols=genes, values_from = logFC, names_from = source) %>%
  dplyr::rename("Peakid"=genes)


ATAC_all_adj.pvals <- readRDS("data/Final_four_data/re_analysis/ATAC_all_adj_pvals.RDS")

AF_heatmap_df <- SNP_overlaps %>%
  as.data.frame() %>%
  dplyr::filter(gwas=="AF") %>%
  group_by(Peakid) %>%
  summarise(SNPS=paste(unique(SNPS),collapse = ";"))

HF_heatmap_df <- SNP_overlaps %>%
  as.data.frame() %>%
  dplyr::filter(gwas=="HF") %>%
  group_by(Peakid) %>%
  summarise(SNPS=paste(unique(SNPS),collapse = ";"))
AF_mat <- AF_heatmap_df %>%
left_join(., all_results_LFC, by=c("Peakid"="Peakid")) %>%
tidyr::unite(., name,Peakid,SNPS) %>%
column_to_rownames("name") %>%
as.matrix()
AF_sig_mat <- AF_heatmap_df %>%
left_join(., ATAC_all_adj.pvals, by=c("Peakid"="genes")) %>%
tidyr::unite(., name,Peakid,SNPS) %>%
column_to_rownames("name") %>%
as.matrix()
simply_AF_lfc <- ComplexHeatmap::Heatmap(AF_mat,
show_row_names = TRUE,
row_names_max_width=
ComplexHeatmap::max_text_width(rownames(AF_mat), gp=gpar(fontsize=14)),
heatmap_legend_param = list(direction = "horizontal"),
column_title = "AF_SNPS",
show_column_names = TRUE,
cluster_rows = FALSE,
cluster_columns = FALSE,
cell_fun = function(j, i, x, y, width, height, fill) {
if (!is.na(AF_sig_mat[i, j]) && AF_sig_mat[i, j] <0.05) {
grid.text("*", x, y, gp = gpar(fontsize = 20)) # Add star if significant
} })
ComplexHeatmap::draw(simply_AF_lfc,
merge_legend = TRUE,
heatmap_legend_side = "left",
annotation_legend_side = "left")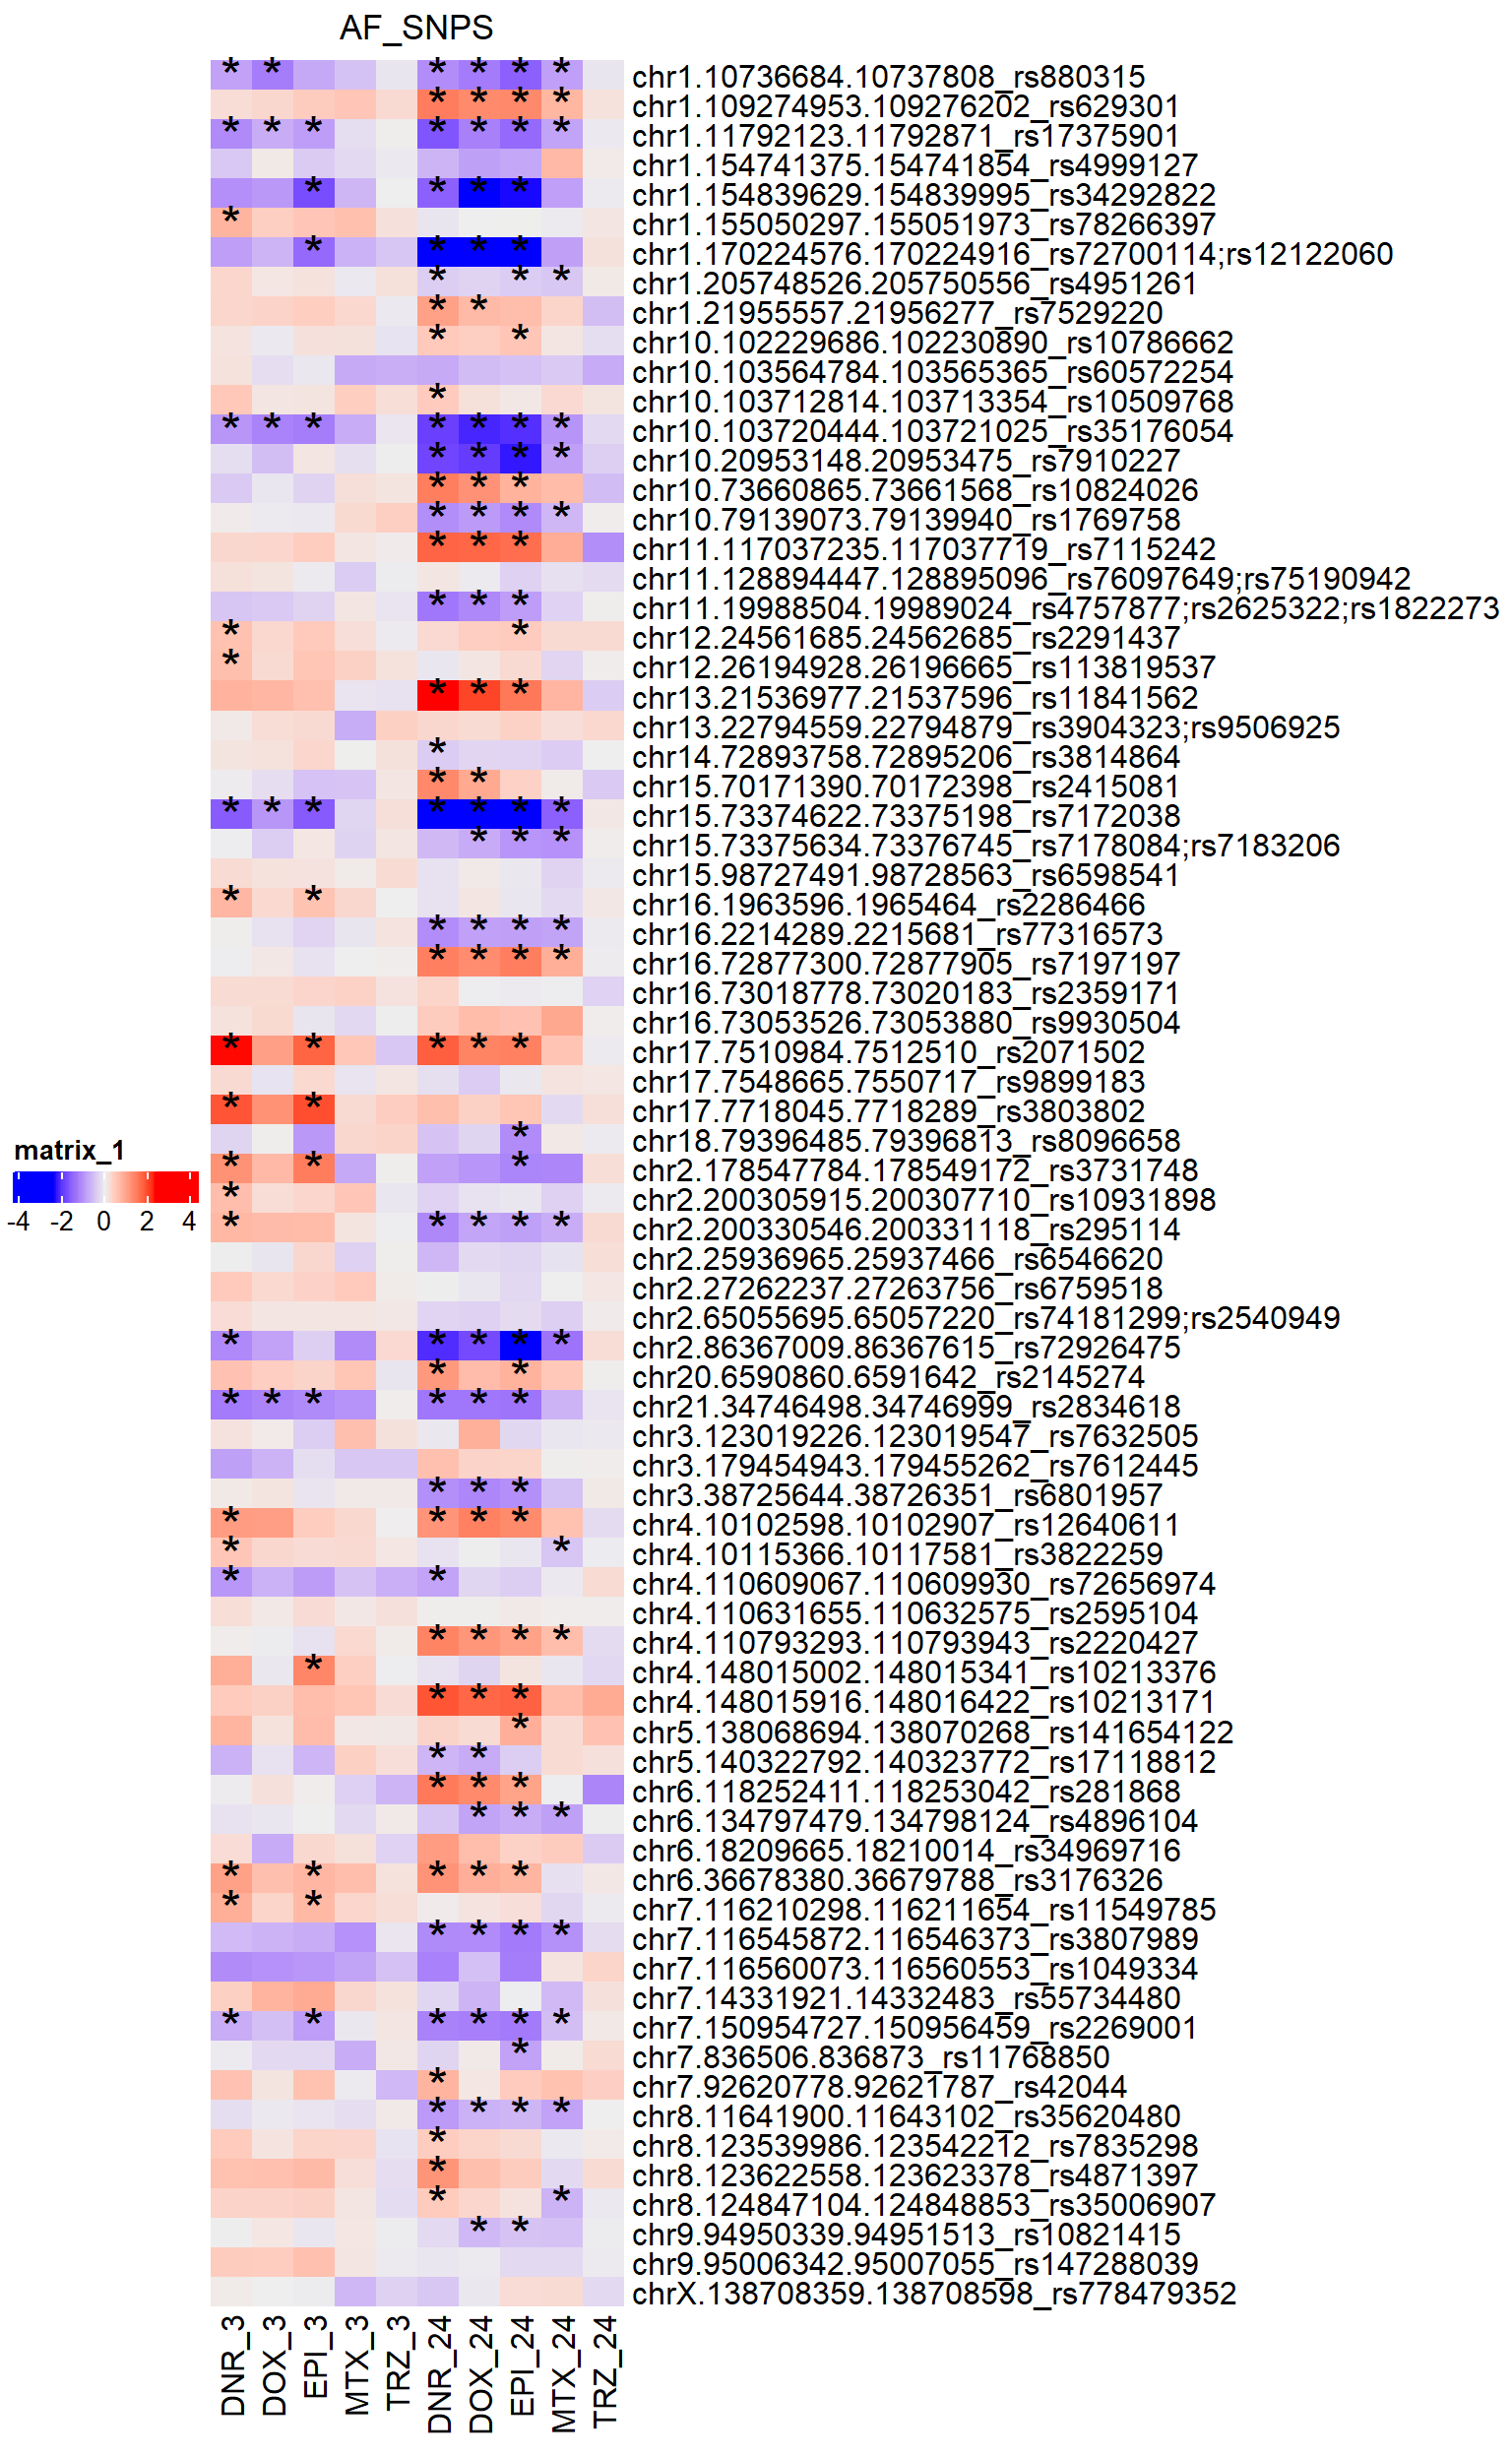
HF_mat <- HF_heatmap_df %>%
  left_join(., all_results_LFC, by=c("Peakid"="Peakid")) %>%
  tidyr::unite(., name,Peakid,SNPS) %>%
  column_to_rownames("name") %>%
  as.matrix()

HF_sig_mat <- HF_heatmap_df %>%
  left_join(., ATAC_all_adj.pvals, by=c("Peakid"="genes")) %>%
  tidyr::unite(., name,Peakid,SNPS) %>%
  column_to_rownames("name") %>%
  as.matrix()


simply_HF_lfc <- ComplexHeatmap::Heatmap(HF_mat,

                        show_row_names = TRUE,
                       row_names_max_width=
ComplexHeatmap::max_text_width(rownames(HF_mat),                                                        gp=gpar(fontsize=14)),
                        heatmap_legend_param = list(direction = "horizontal"),
column_title = "HF_SNPS",

                        show_column_names = TRUE,
                        cluster_rows = FALSE,
                        cluster_columns = FALSE,
                        cell_fun = function(j, i, x, y, width, height, fill) {
                          if (!is.na(HF_sig_mat[i, j]) && HF_sig_mat[i, j] <0.05) {
                              grid.text("*", x, y, gp = gpar(fontsize = 20))  # Add star if significant
                            } })

ComplexHeatmap::draw(simply_HF_lfc,
     merge_legend = TRUE,
     heatmap_legend_side = "left",
    annotation_legend_side = "left")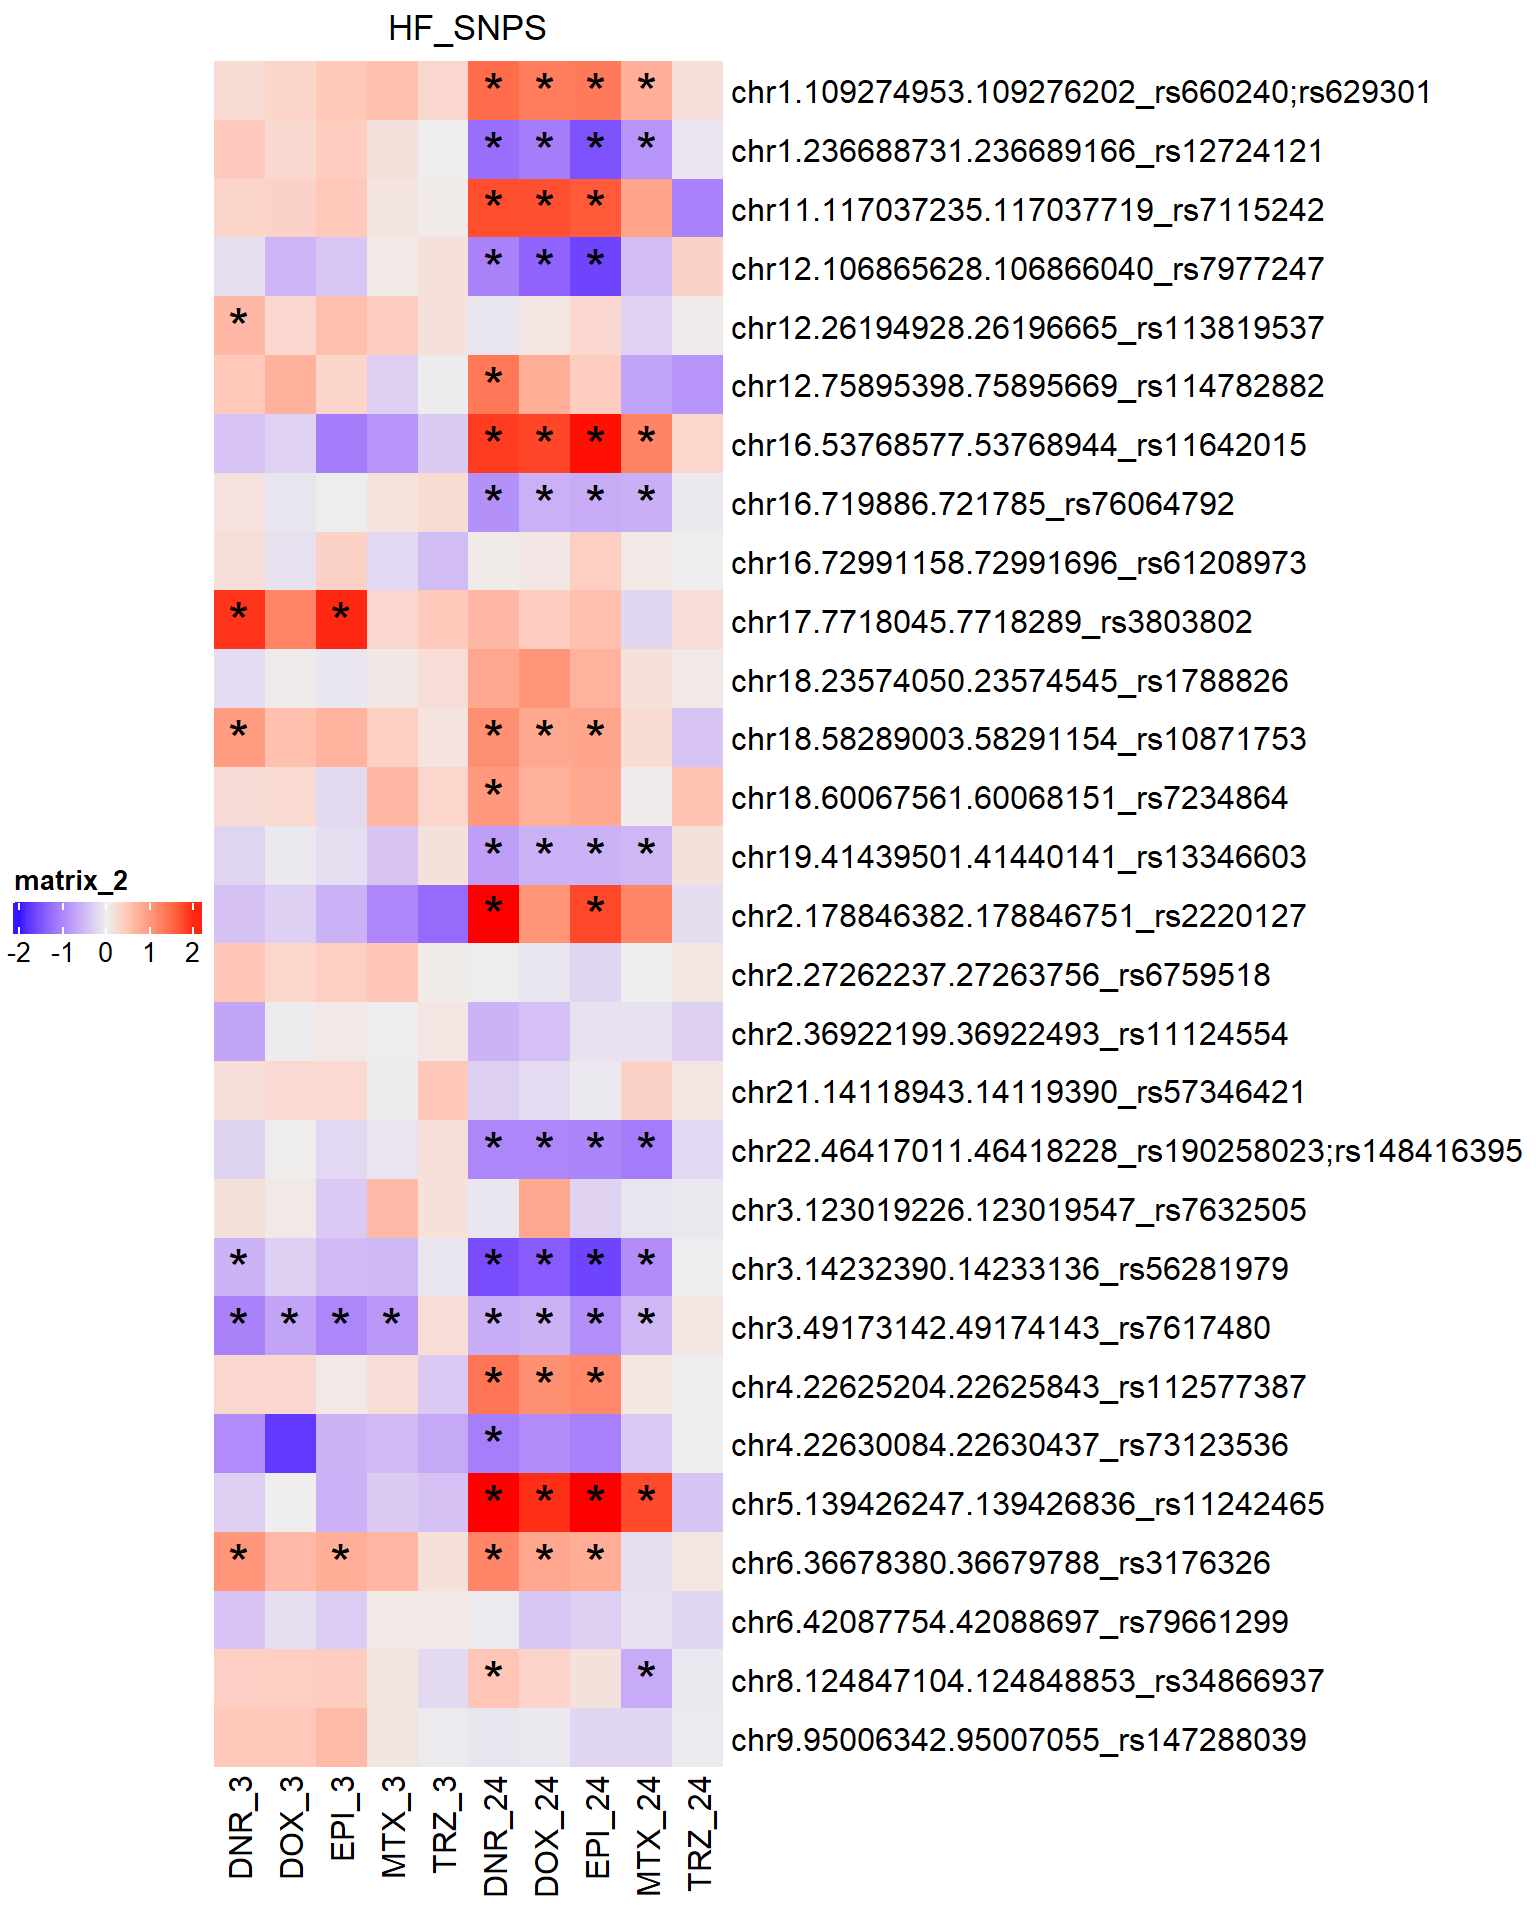
sessionInfo()R version 4.4.2 (2024-10-31 ucrt)
Platform: x86_64-w64-mingw32/x64
Running under: Windows 11 x64 (build 26100)
Matrix products: default
locale:
[1] LC_COLLATE=English_United States.utf8
[2] LC_CTYPE=English_United States.utf8
[3] LC_MONETARY=English_United States.utf8
[4] LC_NUMERIC=C
[5] LC_TIME=English_United States.utf8
time zone: America/Chicago
tzcode source: internal
attached base packages:
[1] grid stats4 stats graphics grDevices utils datasets
[8] methods base
other attached packages:
[1] regioneR_1.38.0
[2] liftOver_1.30.0
[3] Homo.sapiens_1.3.1
[4] TxDb.Hsapiens.UCSC.hg19.knownGene_3.2.2
[5] GO.db_3.20.0
[6] OrganismDbi_1.48.0
[7] gwascat_2.38.0
[8] vargen_0.2.3
[9] devtools_2.4.5
[10] usethis_3.1.0
[11] readxl_1.4.5
[12] smplot2_0.2.5
[13] cowplot_1.1.3
[14] ComplexHeatmap_2.22.0
[15] ggrepel_0.9.6
[16] plyranges_1.26.0
[17] ggsignif_0.6.4
[18] genomation_1.38.0
[19] edgeR_4.4.2
[20] limma_3.62.2
[21] ggpubr_0.6.1
[22] BiocParallel_1.40.2
[23] ggVennDiagram_1.5.4
[24] scales_1.4.0
[25] VennDiagram_1.7.3
[26] futile.logger_1.4.3
[27] gridExtra_2.3
[28] ggfortify_0.4.18
[29] rtracklayer_1.66.0
[30] org.Hs.eg.db_3.20.0
[31] TxDb.Hsapiens.UCSC.hg38.knownGene_3.20.0
[32] GenomicFeatures_1.58.0
[33] AnnotationDbi_1.68.0
[34] Biobase_2.66.0
[35] GenomicRanges_1.58.0
[36] GenomeInfoDb_1.42.3
[37] IRanges_2.40.1
[38] S4Vectors_0.44.0
[39] BiocGenerics_0.52.0
[40] RColorBrewer_1.1-3
[41] broom_1.0.8
[42] kableExtra_1.4.0
[43] lubridate_1.9.4
[44] forcats_1.0.0
[45] stringr_1.5.1
[46] dplyr_1.1.4
[47] purrr_1.0.4
[48] readr_2.1.5
[49] tidyr_1.3.1
[50] tibble_3.3.0
[51] ggplot2_3.5.2
[52] tidyverse_2.0.0
[53] workflowr_1.7.1
loaded via a namespace (and not attached):
[1] fs_1.6.6 matrixStats_1.5.0
[3] bitops_1.0-9 httr_1.4.7
[5] doParallel_1.0.17 profvis_0.4.0
[7] tools_4.4.2 backports_1.5.0
[9] utf8_1.2.6 R6_2.6.1
[11] GetoptLong_1.0.5 urlchecker_1.0.1
[13] withr_3.0.2 prettyunits_1.2.0
[15] cli_3.6.5 textshaping_1.0.1
[17] formatR_1.14 Cairo_1.6-2
[19] labeling_0.4.3 sass_0.4.10
[21] Rsamtools_2.22.0 systemfonts_1.2.3
[23] txdbmaker_1.2.1 foreign_0.8-90
[25] svglite_2.2.1 dichromat_2.0-0.1
[27] sessioninfo_1.2.3 plotrix_3.8-4
[29] BSgenome_1.74.0 pwr_1.3-0
[31] rstudioapi_0.17.1 impute_1.80.0
[33] RSQLite_2.4.1 generics_0.1.4
[35] shape_1.4.6.1 BiocIO_1.16.0
[37] car_3.1-3 Matrix_1.7-3
[39] abind_1.4-8 lifecycle_1.0.4
[41] whisker_0.4.1 yaml_2.3.10
[43] carData_3.0-5 SummarizedExperiment_1.36.0
[45] SparseArray_1.6.2 BiocFileCache_2.14.0
[47] blob_1.2.4 promises_1.3.3
[49] crayon_1.5.3 miniUI_0.1.2
[51] lattice_0.22-7 KEGGREST_1.46.0
[53] magick_2.8.7 pillar_1.11.0
[55] knitr_1.50 rjson_0.2.23
[57] codetools_0.2-20 glue_1.8.0
[59] getPass_0.2-4 data.table_1.17.6
[61] remotes_2.5.0 vctrs_0.6.5
[63] png_0.1-8 cellranger_1.1.0
[65] gtable_0.3.6 cachem_1.1.0
[67] xfun_0.52 S4Arrays_1.6.0
[69] mime_0.13 survival_3.8-3
[71] iterators_1.0.14 statmod_1.5.0
[73] ellipsis_0.3.2 bit64_4.6.0-1
[75] progress_1.2.3 filelock_1.0.3
[77] rprojroot_2.0.4 bslib_0.9.0
[79] KernSmooth_2.23-26 rpart_4.1.24
[81] colorspace_2.1-1 DBI_1.2.3
[83] Hmisc_5.2-3 seqPattern_1.38.0
[85] nnet_7.3-20 tidyselect_1.2.1
[87] processx_3.8.6 bit_4.6.0
[89] compiler_4.4.2 curl_6.4.0
[91] git2r_0.36.2 graph_1.84.1
[93] httr2_1.1.2 htmlTable_2.4.3
[95] xml2_1.3.8 DelayedArray_0.32.0
[97] checkmate_2.3.2 RBGL_1.82.0
[99] callr_3.7.6 rappdirs_0.3.3
[101] digest_0.6.37 rmarkdown_2.29
[103] XVector_0.46.0 htmltools_0.5.8.1
[105] pkgconfig_2.0.3 base64enc_0.1-3
[107] MatrixGenerics_1.18.1 dbplyr_2.5.0
[109] fastmap_1.2.0 rlang_1.1.6
[111] GlobalOptions_0.1.2 htmlwidgets_1.6.4
[113] UCSC.utils_1.2.0 shiny_1.11.1
[115] farver_2.1.2 jquerylib_0.1.4
[117] zoo_1.8-14 jsonlite_2.0.0
[119] VariantAnnotation_1.52.0 RCurl_1.98-1.17
[121] magrittr_2.0.3 Formula_1.2-5
[123] GenomeInfoDbData_1.2.13 patchwork_1.3.1
[125] Rcpp_1.1.0 stringi_1.8.7
[127] zlibbioc_1.52.0 plyr_1.8.9
[129] pkgbuild_1.4.8 parallel_4.4.2
[131] snpStats_1.56.0 Biostrings_2.74.1
[133] splines_4.4.2 hms_1.1.3
[135] circlize_0.4.16 locfit_1.5-9.12
[137] ps_1.9.1 biomaRt_2.62.1
[139] reshape2_1.4.4 pkgload_1.4.0
[141] futile.options_1.0.1 XML_3.99-0.18
[143] evaluate_1.0.4 BiocManager_1.30.26
[145] lambda.r_1.2.4 tzdb_0.5.0
[147] foreach_1.5.2 httpuv_1.6.16
[149] clue_0.3-66 gridBase_0.4-7
[151] xtable_1.8-4 restfulr_0.0.16
[153] rstatix_0.7.2 later_1.4.2
[155] viridisLite_0.4.2 memoise_2.0.1
[157] GenomicAlignments_1.42.0 cluster_2.1.8.1
[159] timechange_0.3.0