TOP2B and Snyder data
Renee Matthews
2025-06-09
Last updated: 2025-08-06
Checks: 7 0
Knit directory: ATAC_learning/
This reproducible R Markdown analysis was created with workflowr (version 1.7.1). The Checks tab describes the reproducibility checks that were applied when the results were created. The Past versions tab lists the development history.
Great! Since the R Markdown file has been committed to the Git repository, you know the exact version of the code that produced these results.
Great job! The global environment was empty. Objects defined in the global environment can affect the analysis in your R Markdown file in unknown ways. For reproduciblity it’s best to always run the code in an empty environment.
The command set.seed(20231016) was run prior to running
the code in the R Markdown file. Setting a seed ensures that any results
that rely on randomness, e.g. subsampling or permutations, are
reproducible.
Great job! Recording the operating system, R version, and package versions is critical for reproducibility.
Nice! There were no cached chunks for this analysis, so you can be confident that you successfully produced the results during this run.
Great job! Using relative paths to the files within your workflowr project makes it easier to run your code on other machines.
Great! You are using Git for version control. Tracking code development and connecting the code version to the results is critical for reproducibility.
The results in this page were generated with repository version ccab94b. See the Past versions tab to see a history of the changes made to the R Markdown and HTML files.
Note that you need to be careful to ensure that all relevant files for
the analysis have been committed to Git prior to generating the results
(you can use wflow_publish or
wflow_git_commit). workflowr only checks the R Markdown
file, but you know if there are other scripts or data files that it
depends on. Below is the status of the Git repository when the results
were generated:
Ignored files:
    Ignored:    .RData
    Ignored:    .Rhistory
    Ignored:    .Rproj.user/
    Ignored:    analysis/H3K27ac_integration_noM.Rmd
    Ignored:    data/ACresp_SNP_table.csv
    Ignored:    data/ARR_SNP_table.csv
    Ignored:    data/All_merged_peaks.tsv
    Ignored:    data/CAD_gwas_dataframe.RDS
    Ignored:    data/CTX_SNP_table.csv
    Ignored:    data/Collapsed_expressed_NG_peak_table.csv
    Ignored:    data/DEG_toplist_sep_n45.RDS
    Ignored:    data/FRiP_first_run.txt
    Ignored:    data/Final_four_data/
    Ignored:    data/Frip_1_reads.csv
    Ignored:    data/Frip_2_reads.csv
    Ignored:    data/Frip_3_reads.csv
    Ignored:    data/Frip_4_reads.csv
    Ignored:    data/Frip_5_reads.csv
    Ignored:    data/Frip_6_reads.csv
    Ignored:    data/GO_KEGG_analysis/
    Ignored:    data/HF_SNP_table.csv
    Ignored:    data/Ind1_75DA24h_dedup_peaks.csv
    Ignored:    data/Ind1_TSS_peaks.RDS
    Ignored:    data/Ind1_firstfragment_files.txt
    Ignored:    data/Ind1_fragment_files.txt
    Ignored:    data/Ind1_peaks_list.RDS
    Ignored:    data/Ind1_summary.txt
    Ignored:    data/Ind2_TSS_peaks.RDS
    Ignored:    data/Ind2_fragment_files.txt
    Ignored:    data/Ind2_peaks_list.RDS
    Ignored:    data/Ind2_summary.txt
    Ignored:    data/Ind3_TSS_peaks.RDS
    Ignored:    data/Ind3_fragment_files.txt
    Ignored:    data/Ind3_peaks_list.RDS
    Ignored:    data/Ind3_summary.txt
    Ignored:    data/Ind4_79B24h_dedup_peaks.csv
    Ignored:    data/Ind4_TSS_peaks.RDS
    Ignored:    data/Ind4_V24h_fraglength.txt
    Ignored:    data/Ind4_fragment_files.txt
    Ignored:    data/Ind4_fragment_filesN.txt
    Ignored:    data/Ind4_peaks_list.RDS
    Ignored:    data/Ind4_summary.txt
    Ignored:    data/Ind5_TSS_peaks.RDS
    Ignored:    data/Ind5_fragment_files.txt
    Ignored:    data/Ind5_fragment_filesN.txt
    Ignored:    data/Ind5_peaks_list.RDS
    Ignored:    data/Ind5_summary.txt
    Ignored:    data/Ind6_TSS_peaks.RDS
    Ignored:    data/Ind6_fragment_files.txt
    Ignored:    data/Ind6_peaks_list.RDS
    Ignored:    data/Ind6_summary.txt
    Ignored:    data/Knowles_4.RDS
    Ignored:    data/Knowles_5.RDS
    Ignored:    data/Knowles_6.RDS
    Ignored:    data/LiSiLTDNRe_TE_df.RDS
    Ignored:    data/MI_gwas.RDS
    Ignored:    data/SNP_GWAS_PEAK_MRC_id
    Ignored:    data/SNP_GWAS_PEAK_MRC_id.csv
    Ignored:    data/SNP_gene_cat_list.tsv
    Ignored:    data/SNP_supp_schneider.RDS
    Ignored:    data/TE_info/
    Ignored:    data/TFmapnames.RDS
    Ignored:    data/all_TSSE_scores.RDS
    Ignored:    data/all_four_filtered_counts.txt
    Ignored:    data/aln_run1_results.txt
    Ignored:    data/anno_ind1_DA24h.RDS
    Ignored:    data/anno_ind4_V24h.RDS
    Ignored:    data/annotated_gwas_SNPS.csv
    Ignored:    data/background_n45_he_peaks.RDS
    Ignored:    data/cardiac_muscle_FRIP.csv
    Ignored:    data/cardiomyocyte_FRIP.csv
    Ignored:    data/col_ng_peak.csv
    Ignored:    data/cormotif_full_4_run.RDS
    Ignored:    data/cormotif_full_4_run_he.RDS
    Ignored:    data/cormotif_full_6_run.RDS
    Ignored:    data/cormotif_full_6_run_he.RDS
    Ignored:    data/cormotif_probability_45_list.csv
    Ignored:    data/cormotif_probability_45_list_he.csv
    Ignored:    data/cormotif_probability_all_6_list.csv
    Ignored:    data/cormotif_probability_all_6_list_he.csv
    Ignored:    data/datasave.RDS
    Ignored:    data/embryo_heart_FRIP.csv
    Ignored:    data/enhancer_list_ENCFF126UHK.bed
    Ignored:    data/enhancerdata/
    Ignored:    data/filt_Peaks_efit2.RDS
    Ignored:    data/filt_Peaks_efit2_bl.RDS
    Ignored:    data/filt_Peaks_efit2_n45.RDS
    Ignored:    data/first_Peaksummarycounts.csv
    Ignored:    data/first_run_frag_counts.txt
    Ignored:    data/full_bedfiles/
    Ignored:    data/gene_ref.csv
    Ignored:    data/gwas_1_dataframe.RDS
    Ignored:    data/gwas_2_dataframe.RDS
    Ignored:    data/gwas_3_dataframe.RDS
    Ignored:    data/gwas_4_dataframe.RDS
    Ignored:    data/gwas_5_dataframe.RDS
    Ignored:    data/high_conf_peak_counts.csv
    Ignored:    data/high_conf_peak_counts.txt
    Ignored:    data/high_conf_peaks_bl_counts.txt
    Ignored:    data/high_conf_peaks_counts.txt
    Ignored:    data/hits_files/
    Ignored:    data/hyper_files/
    Ignored:    data/hypo_files/
    Ignored:    data/ind1_DA24hpeaks.RDS
    Ignored:    data/ind1_TSSE.RDS
    Ignored:    data/ind2_TSSE.RDS
    Ignored:    data/ind3_TSSE.RDS
    Ignored:    data/ind4_TSSE.RDS
    Ignored:    data/ind4_V24hpeaks.RDS
    Ignored:    data/ind5_TSSE.RDS
    Ignored:    data/ind6_TSSE.RDS
    Ignored:    data/initial_complete_stats_run1.txt
    Ignored:    data/left_ventricle_FRIP.csv
    Ignored:    data/median_24_lfc.RDS
    Ignored:    data/median_3_lfc.RDS
    Ignored:    data/mergedPeads.gff
    Ignored:    data/mergedPeaks.gff
    Ignored:    data/motif_list_full
    Ignored:    data/motif_list_n45
    Ignored:    data/motif_list_n45.RDS
    Ignored:    data/multiqc_fastqc_run1.txt
    Ignored:    data/multiqc_fastqc_run2.txt
    Ignored:    data/multiqc_genestat_run1.txt
    Ignored:    data/multiqc_genestat_run2.txt
    Ignored:    data/my_hc_filt_counts.RDS
    Ignored:    data/my_hc_filt_counts_n45.RDS
    Ignored:    data/n45_bedfiles/
    Ignored:    data/n45_files
    Ignored:    data/other_papers/
    Ignored:    data/peakAnnoList_1.RDS
    Ignored:    data/peakAnnoList_2.RDS
    Ignored:    data/peakAnnoList_24_full.RDS
    Ignored:    data/peakAnnoList_24_n45.RDS
    Ignored:    data/peakAnnoList_3.RDS
    Ignored:    data/peakAnnoList_3_full.RDS
    Ignored:    data/peakAnnoList_3_n45.RDS
    Ignored:    data/peakAnnoList_4.RDS
    Ignored:    data/peakAnnoList_5.RDS
    Ignored:    data/peakAnnoList_6.RDS
    Ignored:    data/peakAnnoList_Eight.RDS
    Ignored:    data/peakAnnoList_full_motif.RDS
    Ignored:    data/peakAnnoList_n45_motif.RDS
    Ignored:    data/siglist_full.RDS
    Ignored:    data/siglist_n45.RDS
    Ignored:    data/summarized_peaks_dataframe.txt
    Ignored:    data/summary_peakIDandReHeat.csv
    Ignored:    data/test.list.RDS
    Ignored:    data/testnames.txt
    Ignored:    data/toplist_6.RDS
    Ignored:    data/toplist_full.RDS
    Ignored:    data/toplist_full_DAR_6.RDS
    Ignored:    data/toplist_n45.RDS
    Ignored:    data/trimmed_seq_length.csv
    Ignored:    data/unclassified_full_set_peaks.RDS
    Ignored:    data/unclassified_n45_set_peaks.RDS
    Ignored:    data/xstreme/

Untracked files:
    Untracked:  RNA_seq_integration.Rmd
    Untracked:  Rplot.pdf
    Untracked:  Sig_meta
    Untracked:  analysis/.gitignore
    Untracked:  analysis/Cormotif_analysis_testing diff.Rmd
    Untracked:  analysis/Diagnosis-tmm.Rmd
    Untracked:  analysis/Expressed_RNA_associations.Rmd
    Untracked:  analysis/Figure_1_preprint.Rmd
    Untracked:  analysis/Figure_2_preprint.Rmd
    Untracked:  analysis/Figure_3_preprint.Rmd
    Untracked:  analysis/Figure_4_preprint.Rmd
    Untracked:  analysis/Figure_5_preprint.Rmd
    Untracked:  analysis/Figure_6_preprint.Rmd
    Untracked:  analysis/Figure_7_preprint.Rmd
    Untracked:  analysis/IF_counts_20x.Rmd
    Untracked:  analysis/Jaspar_motif_DAR_paper.Rmd
    Untracked:  analysis/LFC_corr.Rmd
    Untracked:  analysis/SVA.Rmd
    Untracked:  analysis/Supp_Fig_1-11_preprint.Rmd
    Untracked:  analysis/Supp_Fig_12-19_preprint.Rmd
    Untracked:  analysis/Tan2020.Rmd
    Untracked:  analysis/making_master_peaks_list.Rmd
    Untracked:  analysis/my_hc_filt_counts.csv
    Untracked:  code/Concatenations_for_export.R
    Untracked:  code/IGV_snapshot_code.R
    Untracked:  code/LongDARlist.R
    Untracked:  code/just_for_Fun.R
    Untracked:  my_plot.pdf
    Untracked:  my_plot.png
    Untracked:  output/cormotif_probability_45_list.csv
    Untracked:  output/cormotif_probability_all_6_list.csv
    Untracked:  setup.RData

Unstaged changes:
    Modified:   ATAC_learning.Rproj
    Modified:   analysis/AC_shared_analysis.Rmd
    Modified:   analysis/AF_HF_SNPs.Rmd
    Modified:   analysis/Cardiotox_SNPs.Rmd
    Modified:   analysis/Cormotif_analysis.Rmd
    Modified:   analysis/DEG_analysis.Rmd
    Modified:   analysis/GO_analysis_DAR_paper.Rmd
    Modified:   analysis/H3K27ac_integration.Rmd
    Modified:   analysis/Jaspar_motif.Rmd
    Modified:   analysis/Jaspar_motif_ff.Rmd
    Modified:   analysis/SNP_TAD_peaks.Rmd
    Modified:   analysis/TE_analysis_norm.Rmd
    Modified:   analysis/final_four_analysis.Rmd
    Modified:   analysis/index.Rmd
Note that any generated files, e.g. HTML, png, CSS, etc., are not included in this status report because it is ok for generated content to have uncommitted changes.
These are the previous versions of the repository in which changes were
made to the R Markdown (analysis/Top2B_analysis_paper.Rmd)
and HTML (docs/Top2B_analysis_paper.html) files. If you’ve
configured a remote Git repository (see ?wflow_git_remote),
click on the hyperlinks in the table below to view the files as they
were in that past version.
| File | Version | Author | Date | Message |
|---|---|---|---|---|
| Rmd | ccab94b | reneeisnowhere | 2025-08-06 | wflow_publish("analysis/Top2B_analysis_paper.Rmd") |
library(tidyverse)
library(kableExtra)
library(broom)
library(RColorBrewer)
library(ChIPseeker)
library("TxDb.Hsapiens.UCSC.hg38.knownGene")
library("org.Hs.eg.db")
library(rtracklayer)
library(edgeR)
library(ggfortify)
library(limma)
library(readr)
library(BiocGenerics)
library(gridExtra)
library(VennDiagram)
library(scales)
library(BiocParallel)
library(ggpubr)
library(devtools)
library(biomaRt)
library(eulerr)
library(smplot2)
library(genomation)
library(ggsignif)
library(plyranges)
library(ggrepel)
library(epitools)
library(circlize)
library(readxl)
library(regioneR)
library(GenomicRanges)
Loading in dataframes
toptable_results <- readRDS("data/Final_four_data/re_analysis/Toptable_results.RDS")

all_results  <- toptable_results %>%
  imap(~ .x %>% tibble::rownames_to_column(var = "rowname") %>%
         mutate(source = .y)) %>%
  bind_rows()


Top2b_peaks <- import(con="data/other_papers/ChIP3_TOP2B_CM_87-1.bed",format = "bed",genome="hg38")

Motif_list_gr <- readRDS( "data/Final_four_data/re_analysis/Motif_list_granges.RDS")
list2env(Motif_list_gr,envir = .GlobalEnv)
<environment: R_GlobalEnv>df_list <- plyr::llply(Motif_list_gr[c(1:9)], as.data.frame)
list2env(df_list,envir=.GlobalEnv)<environment: R_GlobalEnv>Left_ventricle <- import(con = "C://Users/renee/Downloads/hg38.TADs/hg38/VentricleLeft_STL003_Leung_2015-raw_TADs.txt", format = "bed",genome="hg38")
DOX_3_sig_gr <-
all_results %>%
dplyr::select(source,genes, logFC,adj.P.Val) %>%
mutate("Peakid"=genes) %>%
dplyr::filter(source=="DOX_3") %>%
dplyr::filter(adj.P.Val<0.05) %>%
separate_wider_delim(., cols="genes",names = c("seqnames","start","end"), delim= ".") %>%
GRanges()
DOX_24_sig_gr <-
all_results %>%
dplyr::select(source,genes, logFC,adj.P.Val) %>%
mutate("Peakid"=genes) %>%
dplyr::filter(source=="DOX_24") %>%
dplyr::filter(adj.P.Val<0.05) %>%
separate_wider_delim(., cols="genes",names = c("seqnames","start","end"), delim= ".") %>%
GRanges() Overlapping Top2b and all ATAC regions
Allregion_ol <- join_overlap_intersect(all_regions,Top2b_peaks)%>%
  as.data.frame() %>%
  distinct(Peakid,.keep_all = TRUE)

left_ventricle_ol <- join_overlap_intersect(all_regions ,Left_ventricle) %>%
  as.data.frame() %>%
  distinct(Peakid,.keep_all = TRUE)


TOP2b_overlap <- join_overlap_intersect(all_regions,Top2b_peaks)%>%
  as.data.frame() %>%
  distinct(name,.keep_all = TRUE)


# join_overlap_intersect(all_regions,Top2b_peaks)%>%
#   as.data.frame() %>%
#   group_by(Peakid) %>%
#   tally() %>%
#   dplyr::filter(n>1
#                 )
Proportion of Tob2b peaks found in ATAC peak by treatment:
annotated_regions <- all_results %>%
  dplyr::filter(source=="DOX_3"|source=="DOX_24") %>%
  dplyr::select(source,genes,logFC,adj.P.Val) %>%
  pivot_wider(.,id_cols=genes,names_from = source, values_from = c(logFC, adj.P.Val)) %>%
  mutate(top_2b_ol=case_when(genes %in% Allregion_ol$Peakid~"TOP2b_peak",
         TRUE ~"not_TOP2b_peak")) %>%
  mutate(sig_3=if_else(adj.P.Val_DOX_3<0.05,"sig","not_sig"),
         sig_24=if_else(adj.P.Val_DOX_24<0.05,"sig","not_sig")) %>%
  mutate(sig_3=factor(sig_3,levels=c("sig","not_sig")),
         sig_24=factor(sig_24,levels=c("sig","not_sig"))) %>%
  mutate(TAD_ol=case_when(genes%in% left_ventricle_ol$Peakid~"TAD_peak",
                          TRUE ~"not_TAD_peak"))

annotated_regions %>%
  group_by(sig_3,top_2b_ol) %>% tally%>%
 pivot_wider(., id_cols = sig_3, names_from = top_2b_ol, values_from = n)
# A tibble: 2 × 3
# Groups: sig_3 [2]
sig_3 TOP2b_peak not_TOP2b_peak
<fct> <int> <int>
1 sig 185 3288
2 not_sig 5036 147048annotated_regions %>%
group_by(sig_24,top_2b_ol) %>% tally %>%
pivot_wider(., id_cols = sig_24, names_from = top_2b_ol, values_from = n)# A tibble: 2 × 3
# Groups: sig_24 [2]
sig_24 TOP2b_peak not_TOP2b_peak
<fct> <int> <int>
1 sig 1772 63048
2 not_sig 3449 87288annotated_regions %>%
group_by(sig_3,top_2b_ol) %>% tally%>%
pivot_wider(., id_cols = sig_3, names_from = top_2b_ol, values_from = n) %>%
column_to_rownames("sig_3") %>%
as.matrix() %>%
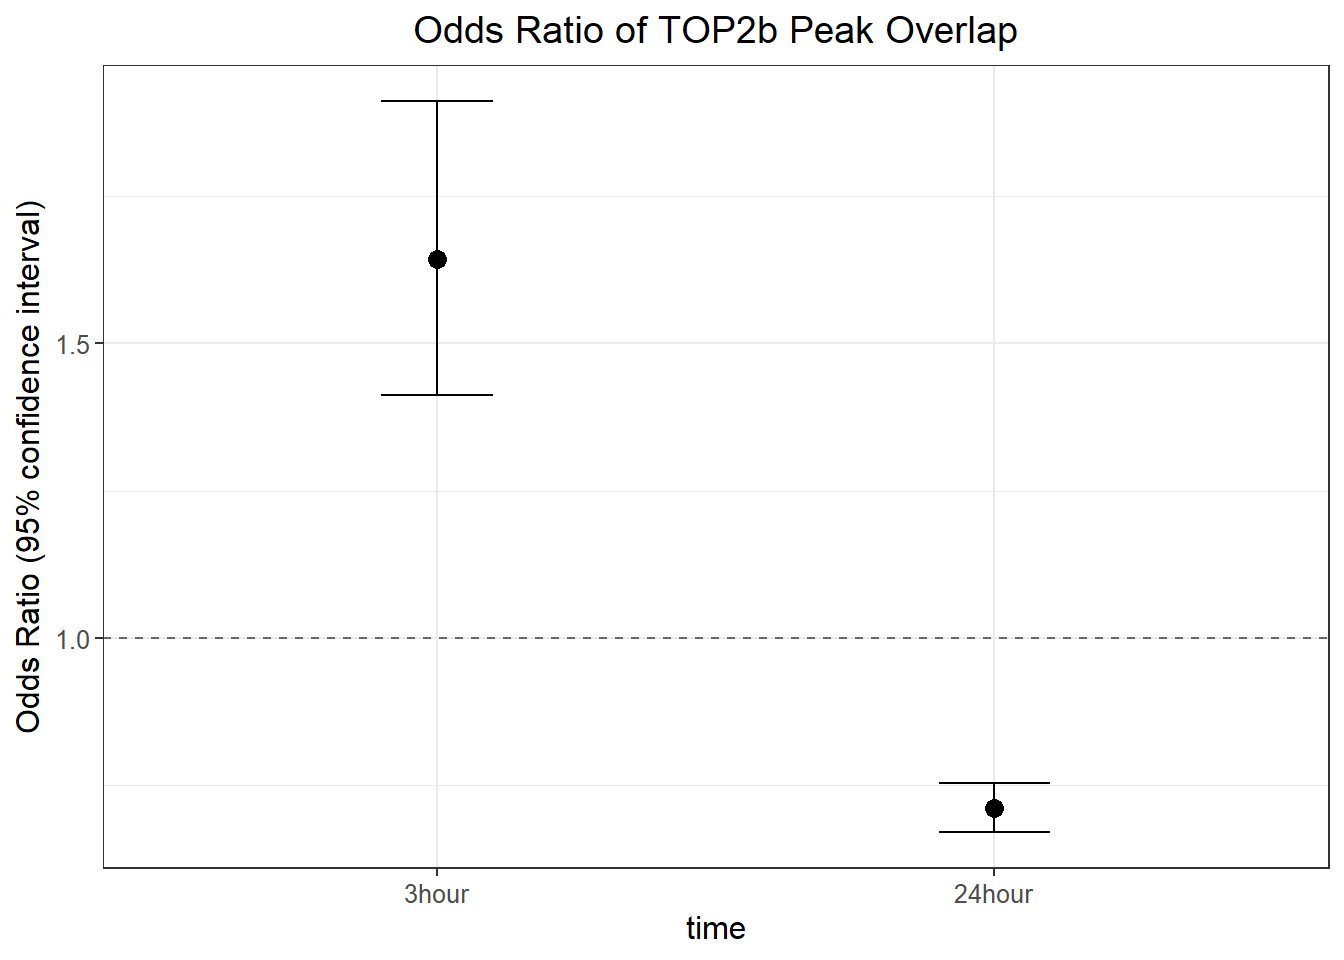
chisq.test(.)
    Pearson's Chi-squared test with Yates' continuity correction

data:  .
X-squared = 41.903, df = 1, p-value = 9.59e-11
annotated_regions %>%
group_by(sig_24,top_2b_ol) %>% tally%>%
pivot_wider(., id_cols = sig_24, names_from = top_2b_ol, values_from = n) %>%
column_to_rownames("sig_24") %>%
as.matrix() %>%
chisq.test(.)
    Pearson's Chi-squared test with Yates' continuity correction

data:  .
X-squared = 132.47, df = 1, p-value < 2.2e-16
annotated_regions %>%
group_by(sig_3,top_2b_ol) %>%
ggplot(., aes(x=sig_3, fill=top_2b_ol))+
geom_bar(position="fill")+
theme_bw()+
ggtitle(" 3 hour DARs and TOP2b")+
ylab("proportion")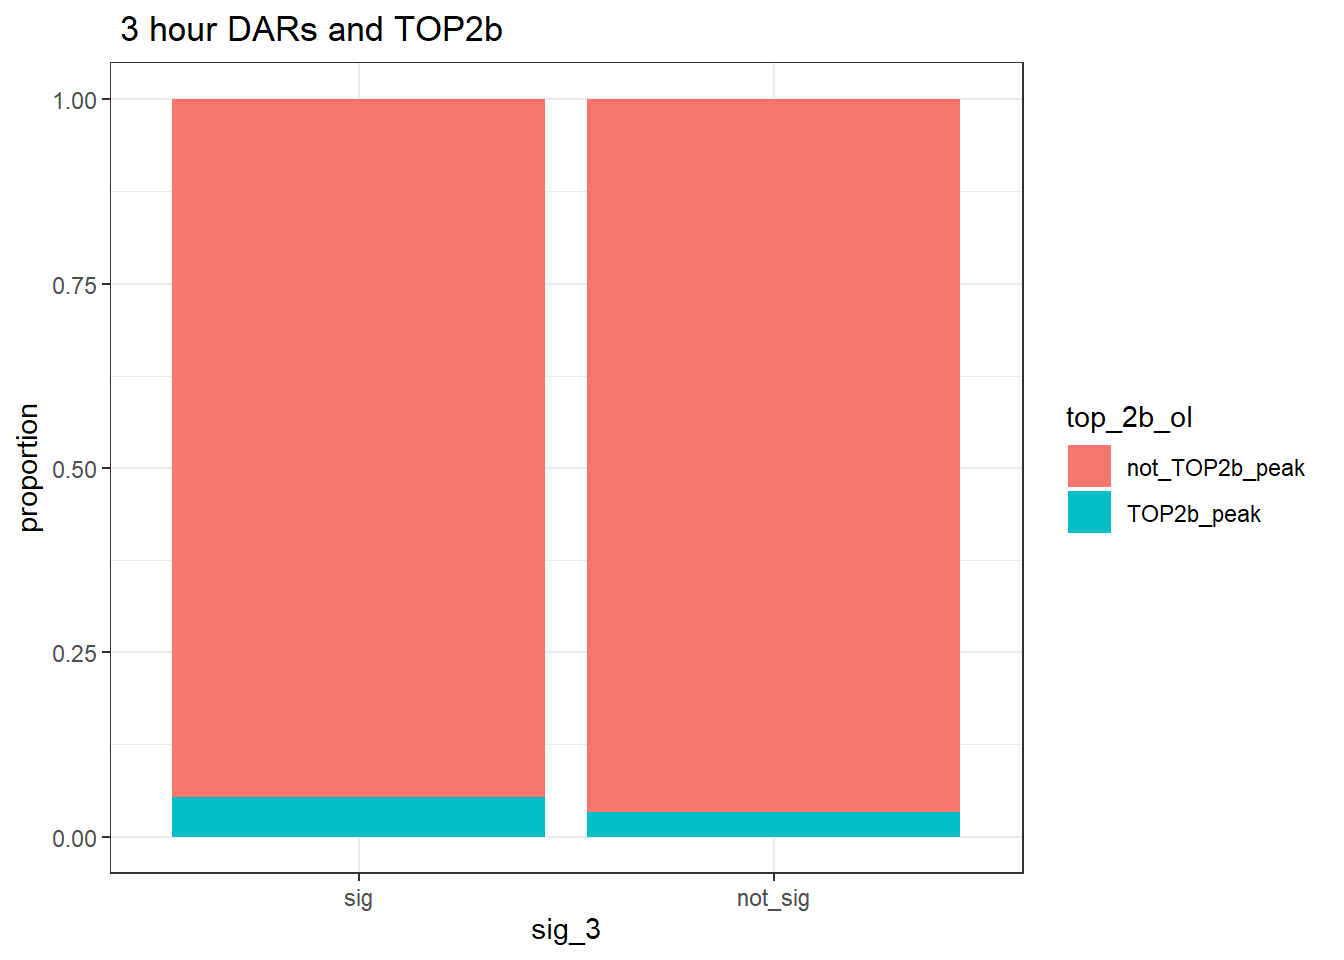
annotated_regions %>%
  group_by(sig_24,top_2b_ol) %>%
  ggplot(., aes(x=sig_24, fill=top_2b_ol))+
  geom_bar(position="fill")+
  theme_bw()+
  ggtitle(" 24 hour DARs and TOP2b")+
  ylab("proportion")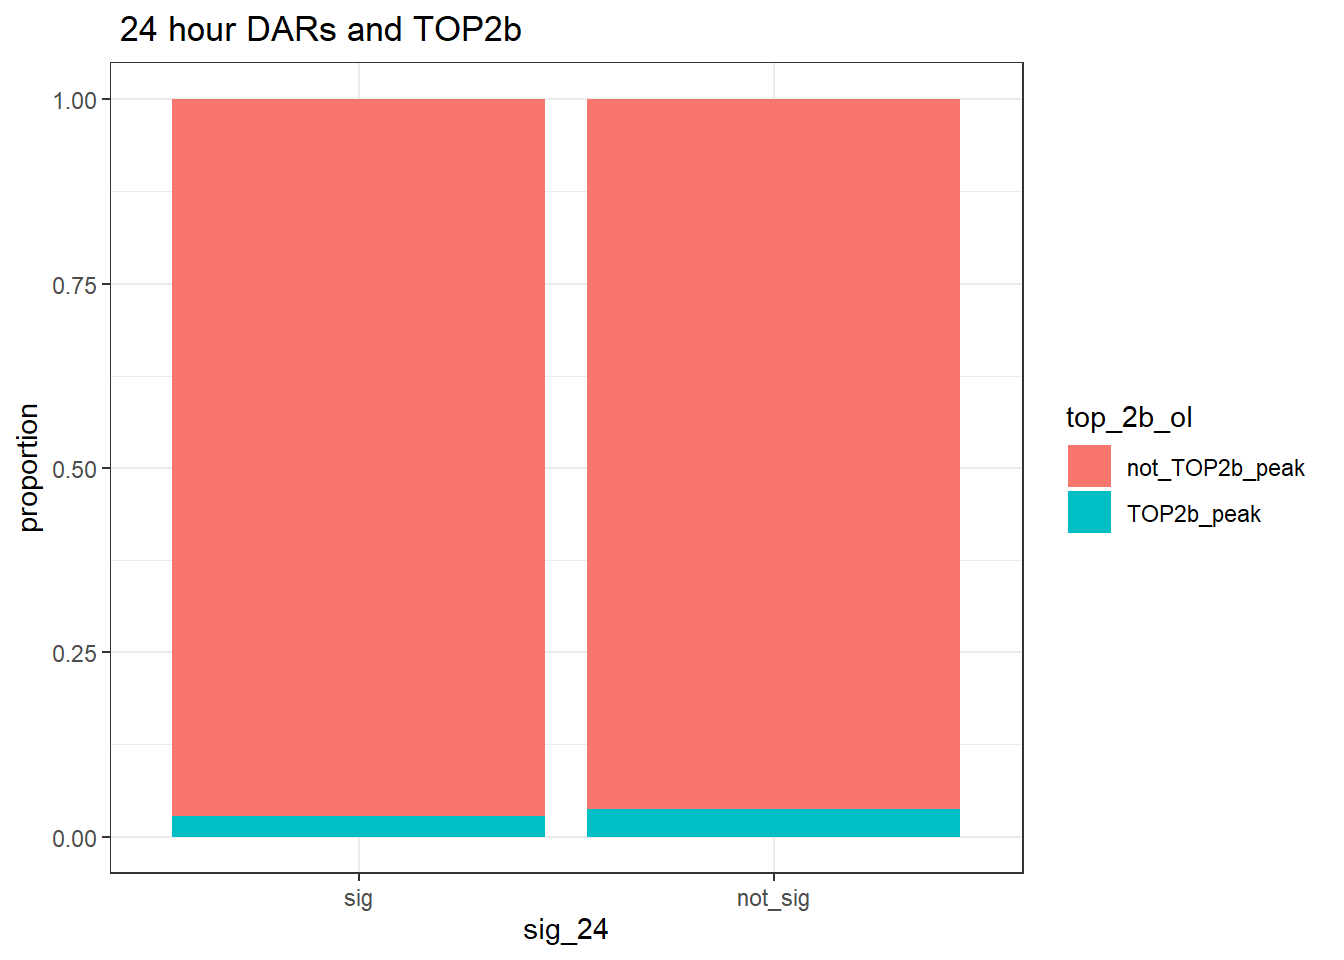
top2b_3hr_or <- annotated_regions %>%
  group_by(sig_3,top_2b_ol) %>%
  tally %>%
  pivot_wider(., id_cols=sig_3, names_from = top_2b_ol, values_from = n) %>%
  column_to_rownames("sig_3") %>%
  as.matrix() %>%
  epitools::oddsratio(., method="wald")

top2b_24hr_or <- annotated_regions %>%
  group_by(sig_24,top_2b_ol) %>%
  tally %>%
  pivot_wider(., id_cols=sig_24, names_from = top_2b_ol, values_from = n) %>%
  column_to_rownames("sig_24") %>%
  as.matrix() %>%
  epitools::oddsratio(., method="wald")

ggplot_format_odds <- data.frame("or_value" = c(top2b_3hr_or$measure[2, "estimate"],top2b_24hr_or$measure[2, "estimate"]),
"lower_ci" = c(top2b_3hr_or$measure[2, "lower"],top2b_24hr_or$measure[2, "lower"]),
"upper_ci" = c(top2b_3hr_or$measure[2, "upper"],top2b_24hr_or$measure[2, "upper"]),
"p_value" = c(top2b_3hr_or$p.value[2,"chi.square"],top2b_24hr_or$p.value[2,"chi.square"]),
group=c("3hour","24hour"))
 ggplot_format_odds %>%
   mutate(group=factor(group, levels= c("3hour","24hour"))) %>%
ggplot(., aes(x = group, y = or_value)) +
  geom_point(size = 3) +
  geom_errorbar(aes(ymin = lower_ci, ymax = upper_ci), width = 0.2) +
  geom_hline(yintercept = 1, linetype = "dashed", color = "gray40") +
  labs(
    title = "Odds Ratio of TOP2b Peak Overlap",
    y = "Odds Ratio (95% confidence interval)",
    x = "time"
  ) +
  theme_bw() +
  theme(
    text = element_text(size = 12),
    plot.title = element_text(hjust = 0.5)
  )
annotated_DARs<- readRDS("data/Final_four_data/re_analysis/DOX_DAR_annotated_peaks_chipannno.RDS")
gene_N_peak <-
annotated_DARs$DOX_3 %>%
  as.data.frame() %>%
  dplyr::select(mcols.genes,annotation, geneId:distanceToTSS)

toplistall_RNA <- readRDS("data/other_papers/toplistall_RNA.RDS") %>%
  mutate(logFC = logFC*(-1))


RNA_results <-
toplistall_RNA %>%
  dplyr::select(time:logFC) %>%
  tidyr::unite("sample",time, id) %>%
  pivot_wider(., id_cols = c(ENTREZID,SYMBOL),names_from = sample, values_from = logFC) %>%
  rename_with(~ str_replace(., "hours", "RNA"))


RNA_adj.pvals <-
toplistall_RNA %>%
dplyr::select(time:SYMBOL,adj.P.Val) %>%
  tidyr::unite("sample",id, time) %>%
  pivot_wider(., id_cols = c(ENTREZID,SYMBOL),names_from = sample, values_from = adj.P.Val) %>%
  rename_with(~ str_replace(., "hours", "pval"))
my_DOX_data <- all_results %>%
dplyr::filter(source=="DOX_3"|source=="DOX_24") %>%
dplyr::select(source,genes,logFC,adj.P.Val) %>%
pivot_wider(.,id_cols=genes,names_from = source, values_from = c(logFC, adj.P.Val))
my_EPI_data <- all_results %>%
dplyr::filter(source=="EPI_3"|source=="EPI_24") %>%
dplyr::select(source,genes,logFC,adj.P.Val) %>%
pivot_wider(.,id_cols=genes,names_from = source, values_from = c(logFC, adj.P.Val))
my_DNR_data <- all_results %>%
dplyr::filter(source=="DNR_3"|source=="DNR_24") %>%
dplyr::select(source,genes,logFC,adj.P.Val) %>%
pivot_wider(.,id_cols=genes,names_from = source, values_from = c(logFC, adj.P.Val))
my_MTX_data <- all_results %>%
dplyr::filter(source=="MTX_3"|source=="MTX_24") %>%
dplyr::select(source,genes,logFC,adj.P.Val) %>%
pivot_wider(.,id_cols=genes,names_from = source, values_from = c(logFC, adj.P.Val))adding DOX_sig and other trts for enrichment with top2b
TSS_listed_df <- annotated_regions %>%
  left_join(.,my_EPI_data,by=c("genes"="genes")) %>%
  mutate(EPI_sig_3=if_else(adj.P.Val_EPI_3<0.05,"sig","not_sig"),
         EPI_sig_24=if_else(adj.P.Val_EPI_24<0.05,"sig","not_sig")) %>%
  mutate(EPI_sig_3=factor(EPI_sig_3,levels=c("sig","not_sig")),
         EPI_sig_24=factor(EPI_sig_24,levels=c("sig","not_sig"))) %>%
  left_join(.,my_DNR_data,by=c("genes"="genes")) %>%
  mutate(DNR_sig_3=if_else(adj.P.Val_DNR_3<0.05,"sig","not_sig"),
         DNR_sig_24=if_else(adj.P.Val_DNR_24<0.05,"sig","not_sig")) %>%
  mutate(DNR_sig_3=factor(DNR_sig_3,levels=c("sig","not_sig")),
         DNR_sig_24=factor(DNR_sig_24,levels=c("sig","not_sig"))) %>%
  left_join(.,my_MTX_data,by=c("genes"="genes")) %>%
  mutate(MTX_sig_3=if_else(adj.P.Val_MTX_3<0.05,"sig","not_sig"),
         MTX_sig_24=if_else(adj.P.Val_MTX_24<0.05,"sig","not_sig")) %>%
  mutate(MTX_sig_3=factor(MTX_sig_3,levels=c("sig","not_sig")),
         MTX_sig_24=factor(MTX_sig_24,levels=c("sig","not_sig"))) %>%
  dplyr::rename("DOX_sig_3"=sig_3, "DOX_sig_24"= sig_24) %>%
  left_join(., gene_N_peak, by= c("genes"="mcols.genes"))
make the odds ratio dataframe
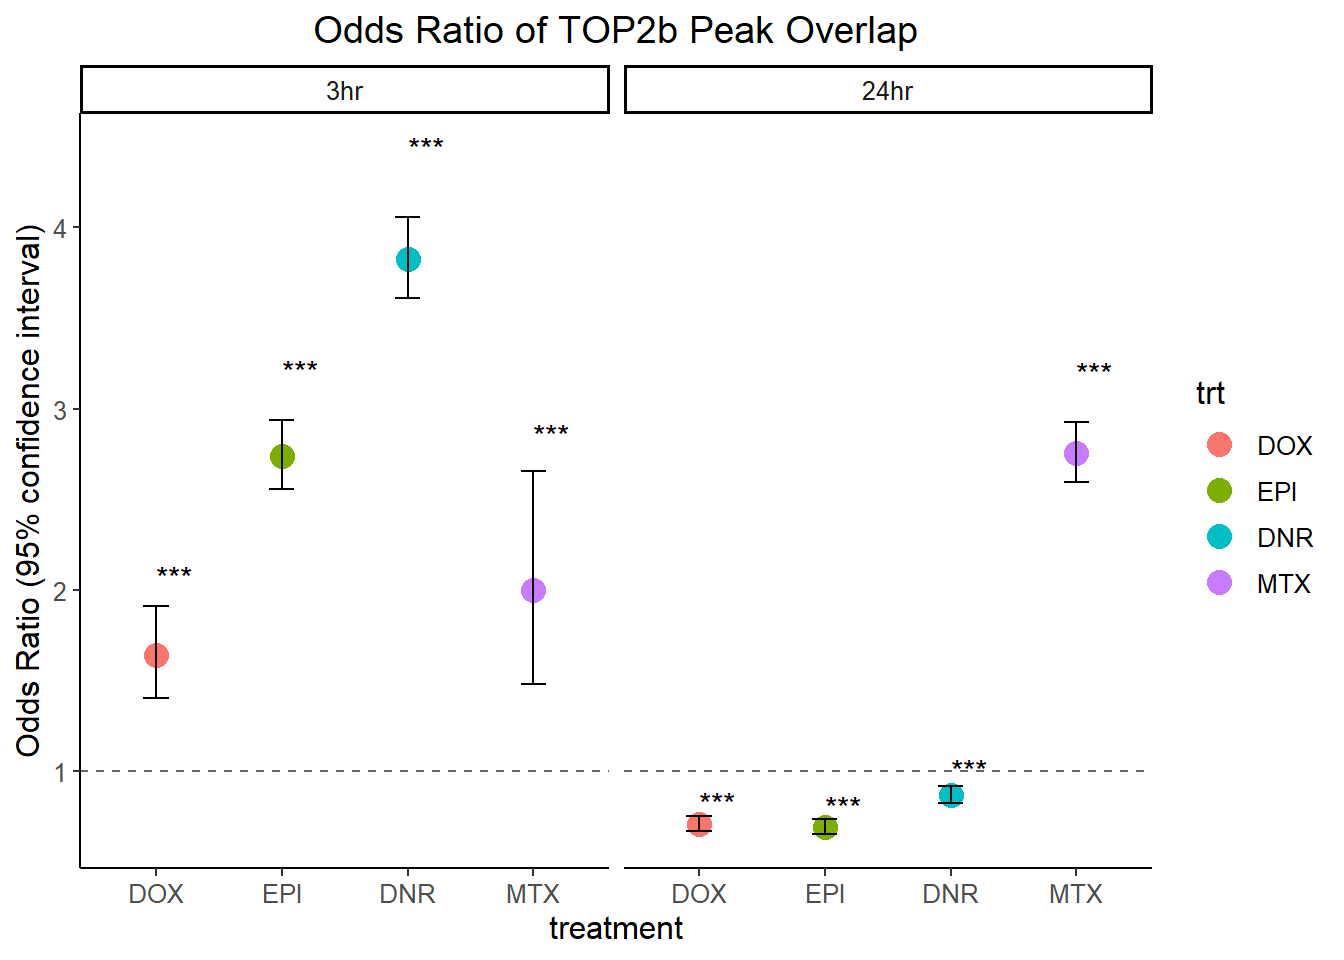
DOX_top2b_3hr_or <-
  TSS_listed_df %>%
  group_by(DOX_sig_3,top_2b_ol) %>%
  tally %>%
  pivot_wider(., id_cols=DOX_sig_3, names_from = top_2b_ol, values_from = n) %>%   column_to_rownames("DOX_sig_3") %>%
  as.matrix() %>%
  fisher.test(.)

DOX_top2b_24hr_or <- TSS_listed_df %>%
  group_by(DOX_sig_24,top_2b_ol) %>%
  tally %>%
  pivot_wider(., id_cols=DOX_sig_24, names_from = top_2b_ol, values_from = n) %>%
  column_to_rownames("DOX_sig_24") %>%
  as.matrix() %>%
  fisher.test(.)

EPI_top2b_3hr_or <-
  TSS_listed_df %>%
  group_by(EPI_sig_3,top_2b_ol) %>%
  tally %>%
  pivot_wider(., id_cols=EPI_sig_3, names_from = top_2b_ol, values_from = n) %>%   column_to_rownames("EPI_sig_3") %>%
  as.matrix() %>%
  fisher.test(.)

EPI_top2b_24hr_or <- TSS_listed_df %>%
  group_by(EPI_sig_24,top_2b_ol) %>%
  tally %>%
  pivot_wider(., id_cols=EPI_sig_24, names_from = top_2b_ol, values_from = n) %>%
  column_to_rownames("EPI_sig_24") %>%
  as.matrix() %>%
  fisher.test(.)

DNR_top2b_3hr_or <-
  TSS_listed_df %>%
  group_by(DNR_sig_3,top_2b_ol) %>%
  tally %>%
  pivot_wider(., id_cols=DNR_sig_3, names_from = top_2b_ol, values_from = n) %>%   column_to_rownames("DNR_sig_3") %>%
  as.matrix() %>%
  fisher.test(.)

DNR_top2b_24hr_or <- TSS_listed_df %>%
  group_by(DNR_sig_24,top_2b_ol) %>%
  tally %>%
  pivot_wider(., id_cols=DNR_sig_24, names_from = top_2b_ol, values_from = n) %>%
  column_to_rownames("DNR_sig_24") %>%
  as.matrix() %>%
 fisher.test(.)

MTX_top2b_3hr_or <-
  TSS_listed_df %>%
  group_by(MTX_sig_3,top_2b_ol) %>%
  tally %>%
  pivot_wider(., id_cols=MTX_sig_3, names_from = top_2b_ol, values_from = n) %>%   column_to_rownames("MTX_sig_3") %>%
  as.matrix() %>%
  fisher.test(.)

MTX_top2b_24hr_or <- TSS_listed_df %>%
  group_by(MTX_sig_24,top_2b_ol) %>%
  tally %>%
  pivot_wider(., id_cols=MTX_sig_24, names_from = top_2b_ol, values_from = n) %>%
  column_to_rownames("MTX_sig_24") %>%
  as.matrix() %>%
  fisher.test(.)
# Define the variable names
var_names <- c("DOX_top2b_3hr_or", "DOX_top2b_24hr_or",
"EPI_top2b_3hr_or", "EPI_top2b_24hr_or",
"DNR_top2b_3hr_or", "DNR_top2b_24hr_or",
"MTX_top2b_3hr_or", "MTX_top2b_24hr_or")
# Optional: label for grouping
group_labels <- c("DOX_3hr", "DOX_24hr", "EPI_3hr", "EPI_24hr", "DNR_3hr", "DNR_24hr", "MTX_3hr", "MTX_24hr")
# Build the data frame
OR_all_trt_result_df <- do.call(rbind, lapply(seq_along(var_names), function(i) {
var <- get(var_names[i])
data.frame(
or_value = unname(var$estimate), # remove the name "odds ratio"
lower_ci = var$conf.int[1],
upper_ci = var$conf.int[2],
p_value = var$p.value,
group = group_labels[i]
)
}))OR_all_trt_result_df %>%
separate_wider_delim(.,cols="group", names = c("trt","time"), delim = "_",cols_remove = FALSE) %>%
mutate(time= factor(time, levels =c("3hr","24hr")),
trt=factor(trt, levels= c("DOX", "EPI", "DNR", "MTX"))) %>%
# mutate(significant=if_else(p_value <0.05,"TRUE","FALSE")) %>%
mutate(
significant = case_when(
p_value < 0.001 ~ "***",
p_value < 0.01 ~ "**",
p_value < 0.05 ~ "*",
TRUE ~ ""
)
) %>%
ggplot(., aes(x = trt, y = or_value)) +
geom_point(aes(color = trt), size=4)+
geom_errorbar(aes(ymin = lower_ci, ymax = upper_ci), width = 0.2) +
geom_hline(yintercept = 1, linetype = "dashed", color = "gray40") +
geom_text(
aes(y = upper_ci + 0.1 * or_value, label = significant),
hjust = 0, # aligns text to the left of the y point
size = 4,
color = "black"
)+
labs(
title = "Odds Ratio of TOP2b Peak Overlap",
y = "Odds Ratio (95% confidence interval)",
x = "treatment"
) +
# coord_flip()+
theme_classic() +
facet_wrap(~time)+
theme(
text = element_text(size = 12),
plot.title = element_text(hjust = 0.5)
)
top2b_overlap <- join_overlap_inner(all_regions,Top2b_peaks)
 AR_total     <- length(unique(all_regions$Peakid))


 Top2B_total  <- length(unique(Top2b_peaks$name))
overlap_n    <- length(unique(top2b_overlap$Peakid))
fit_top2b <- euler(c(
  "ARs" = AR_total-overlap_n,
  "Top2B" = Top2B_total-length(unique(top2b_overlap$name)),
  "ARs&Top2B" = overlap_n
))

plot(fit_top2b, fills = list(fill = c("skyblue", "lightcoral"), alpha = 0.6),
     labels = FALSE, edges = TRUE, quantities = TRUE,
     main = "Overlap between AR and TOP2B peaks")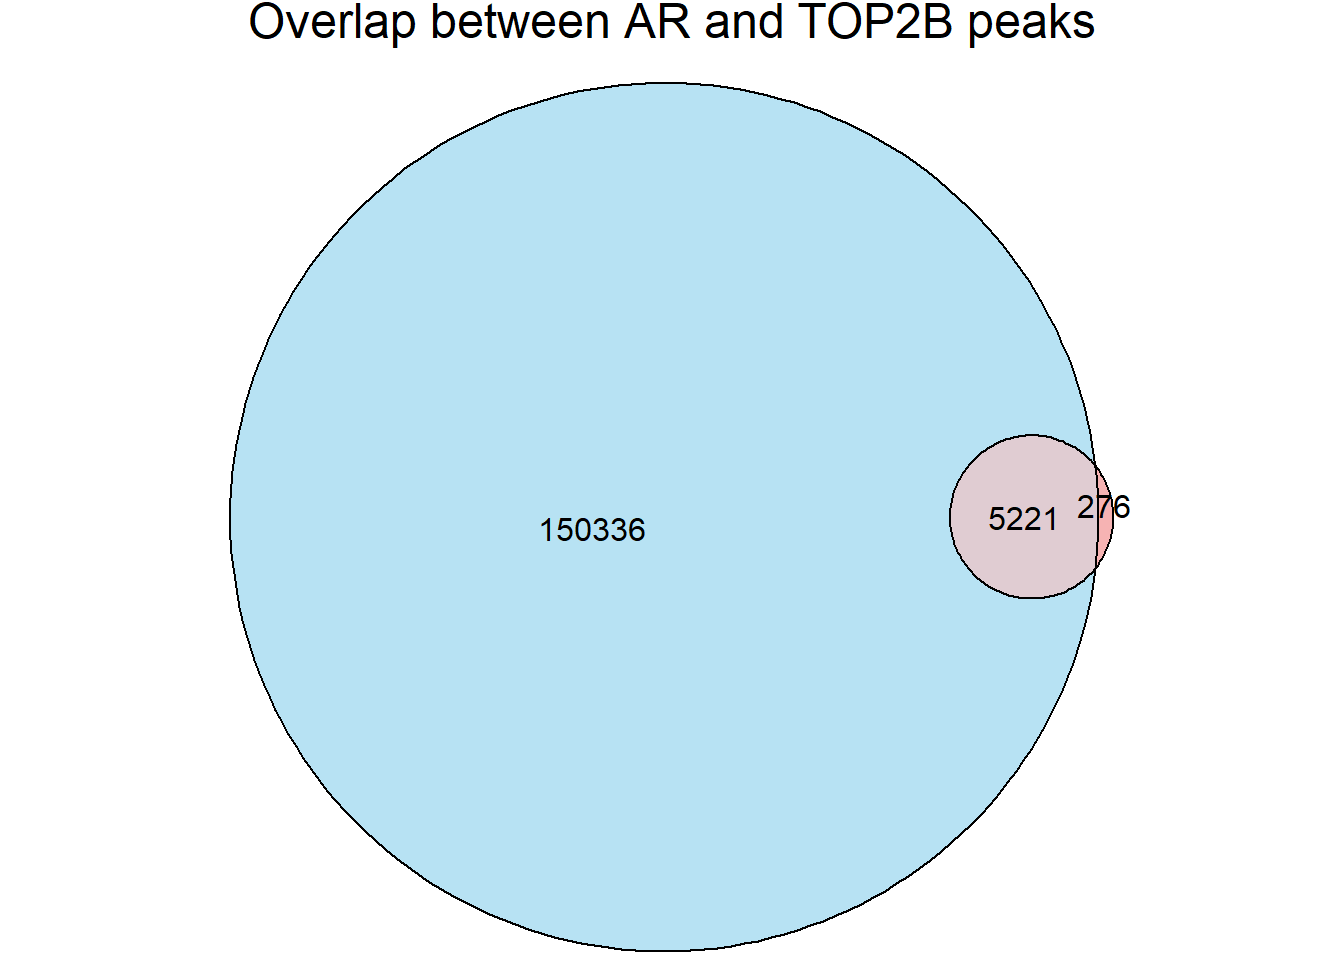
length(intersect(unique(top2b_overlap$Peakid), unique(all_regions$Peakid))) # should match overlap_n[1] 5221significance of Snyder data (Heart left-ventricle)
Snyder_41peaks <- read.delim("data/other_papers/ENCFF966JZT_bed_Snyder_41peaks.bed",header=TRUE) %>%
  GRanges()

genome <- BSgenome.Hsapiens.UCSC.hg38
# perm_test_hlv <- permTest(A= all_regions,
#                           B= Snyder_41peaks,
#                           ntimes=1000,
#                           randomize.function=randomizeRegions,
#                           evaluate.function = numOverlaps,
#                           genome=genome,
#                           count.once= TRUE,
#                           verbose = TRUE)
# saveRDS(perm_test_hlv,"data/Final_four_data/re_analysis/perm_test_results_HLV.RDS")

perm_test_hlv <- readRDS("data/Final_four_data/re_analysis/perm_test_results_HLV.RDS")

perm_test_hlv
$numOverlaps
P-value: 0.000999000999000999
Z-score: 760.9593
Number of iterations: 1000
Alternative: greater
Evaluation of the original region set: 66927
Evaluation function: numOverlaps
Randomization function: randomizeRegions
attr(,"class")
[1] "permTestResultsList"plot(perm_test_hlv)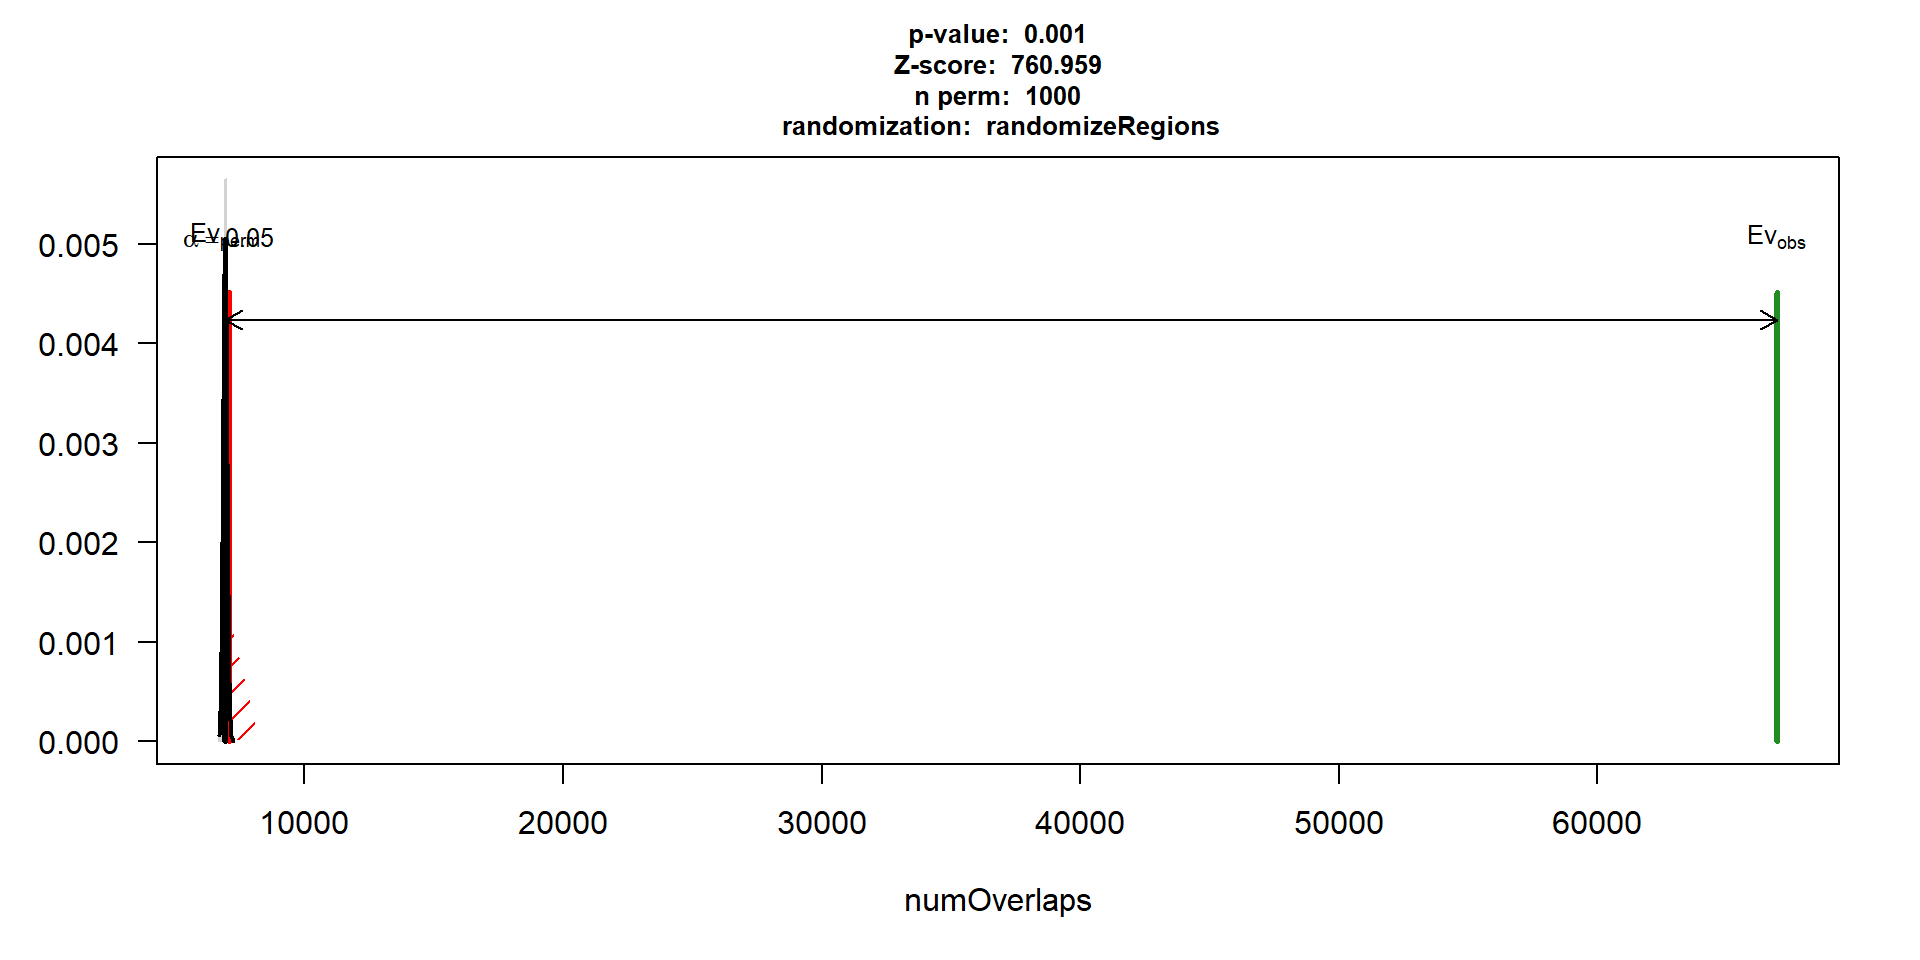
plot(perm_test_hlv, xlim = range(perm_test_hlv$numOverlaps$permuted))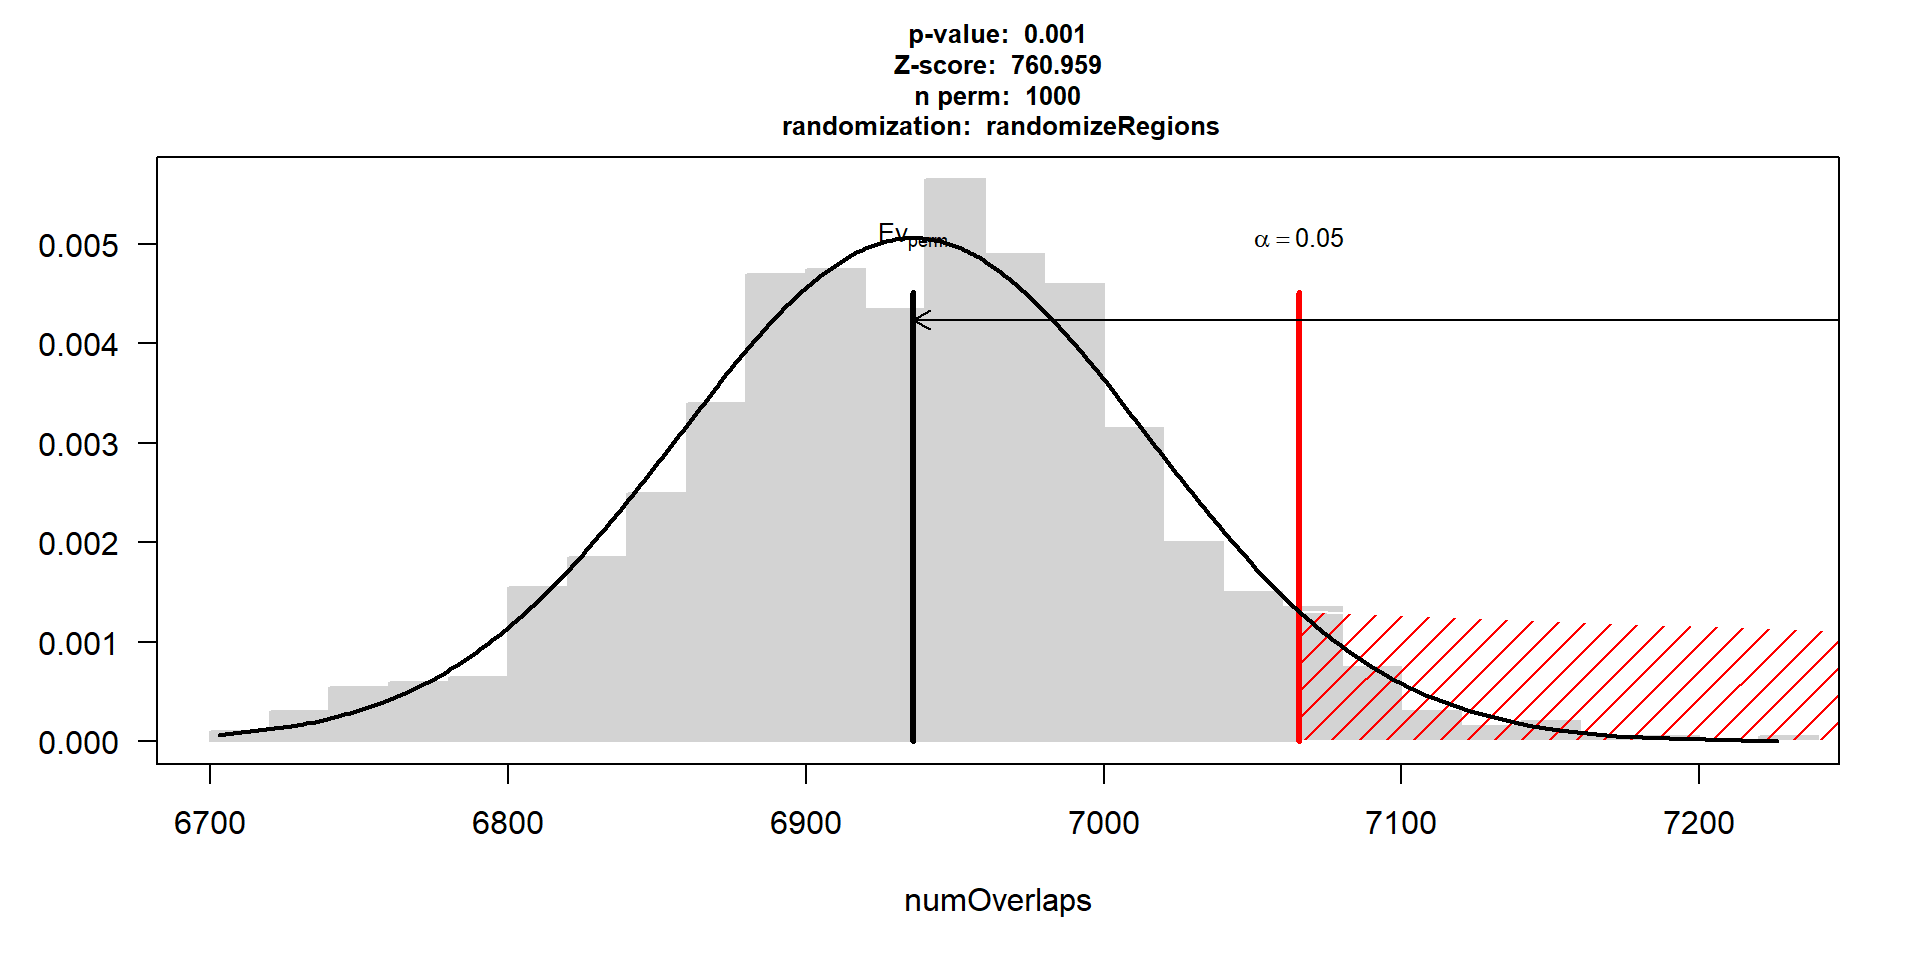
TOP2B and TOP2A expression (log2cpm from RNA data)
drug_pal <- c("#8B006D","#DF707E","#F1B72B", "#3386DD","#707031","#41B333")
RNA_counts <- readRDS("data/other_papers/cpmcount.RDS") %>%
  dplyr::rename_with(.,~gsub(pattern="Da",replacement="DNR",.)) %>%
 dplyr::rename_with(.,~gsub(pattern="Do",replacement="DOX",.)) %>%
  dplyr::rename_with(.,~gsub(pattern="Ep",replacement="EPI",.)) %>%
   dplyr::rename_with(.,~gsub(pattern="Mi",replacement="MTX",.)) %>%
    dplyr::rename_with(.,~gsub(pattern="Tr",replacement="TRZ",.)) %>%
       dplyr::rename_with(.,~gsub(pattern="Ve",replacement="VEH",.)) %>%
  rownames_to_column("ENTREZID")


RNA_results %>%
  dplyr::filter(SYMBOL=="TOP2B")
# A tibble: 1 × 12
ENTREZID SYMBOL `24_RNA_DNR` `24_RNA_DOX` `24_RNA_EPI` `24_RNA_MTX`
<chr> <chr> <dbl> <dbl> <dbl> <dbl>
1 7155 TOP2B -0.940 -0.793 -0.936 -0.394
# ℹ 6 more variables: `24_RNA_TRZ` <dbl>, `3_RNA_DNR` <dbl>, `3_RNA_DOX` <dbl>,
# `3_RNA_EPI` <dbl>, `3_RNA_MTX` <dbl>, `3_RNA_TRZ` <dbl>RNA_counts %>%
dplyr::filter(ENTREZID =="7153") %>%
pivot_longer(cols = !ENTREZID, names_to = "sample", values_to = "counts") %>%
separate("sample", into = c("trt","ind","time")) %>%
mutate(time=factor(time, levels = c("3h","24h"))) %>%
mutate(trt=factor(trt, levels= c("DOX","EPI","DNR","MTX","TRZ","VEH"))) %>%
ggplot(., aes (x = time, y=counts))+
geom_boxplot(aes(fill=trt))+
# facet_wrap(~SYMBOL, scales="free_y")+
scale_fill_manual(values = drug_pal)+
ggtitle("RNA Log2cpm of TOP2a")+
theme_bw()+
ylab("log2 cpm RNA")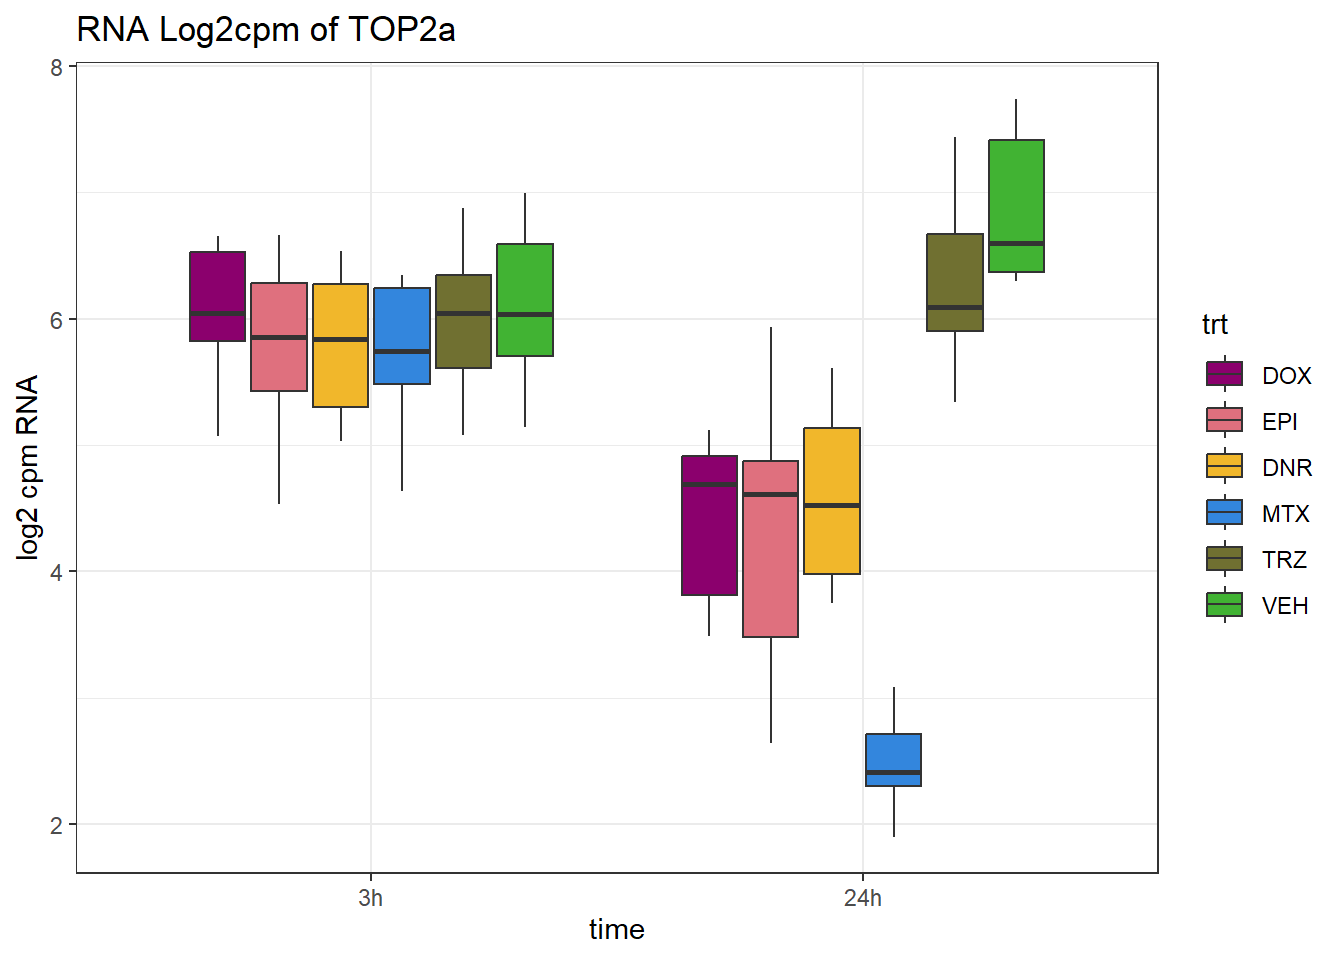
RNA_counts %>%
  dplyr::filter(ENTREZID =="7155") %>%
  pivot_longer(cols = !ENTREZID, names_to = "sample", values_to = "counts") %>%
  separate("sample", into = c("trt","ind","time")) %>%
  mutate(time=factor(time, levels = c("3h","24h"))) %>%
  mutate(trt=factor(trt, levels= c("DOX","EPI","DNR","MTX","TRZ","VEH"))) %>%
  ggplot(., aes (x = time, y=counts))+
  geom_boxplot(aes(fill=trt))+
  # facet_wrap(~SYMBOL, scales="free_y")+
    scale_fill_manual(values = drug_pal)+
  ggtitle("RNA Log2cpm of TOP2b")+
  theme_bw()+
  ylab("log2 cpm RNA")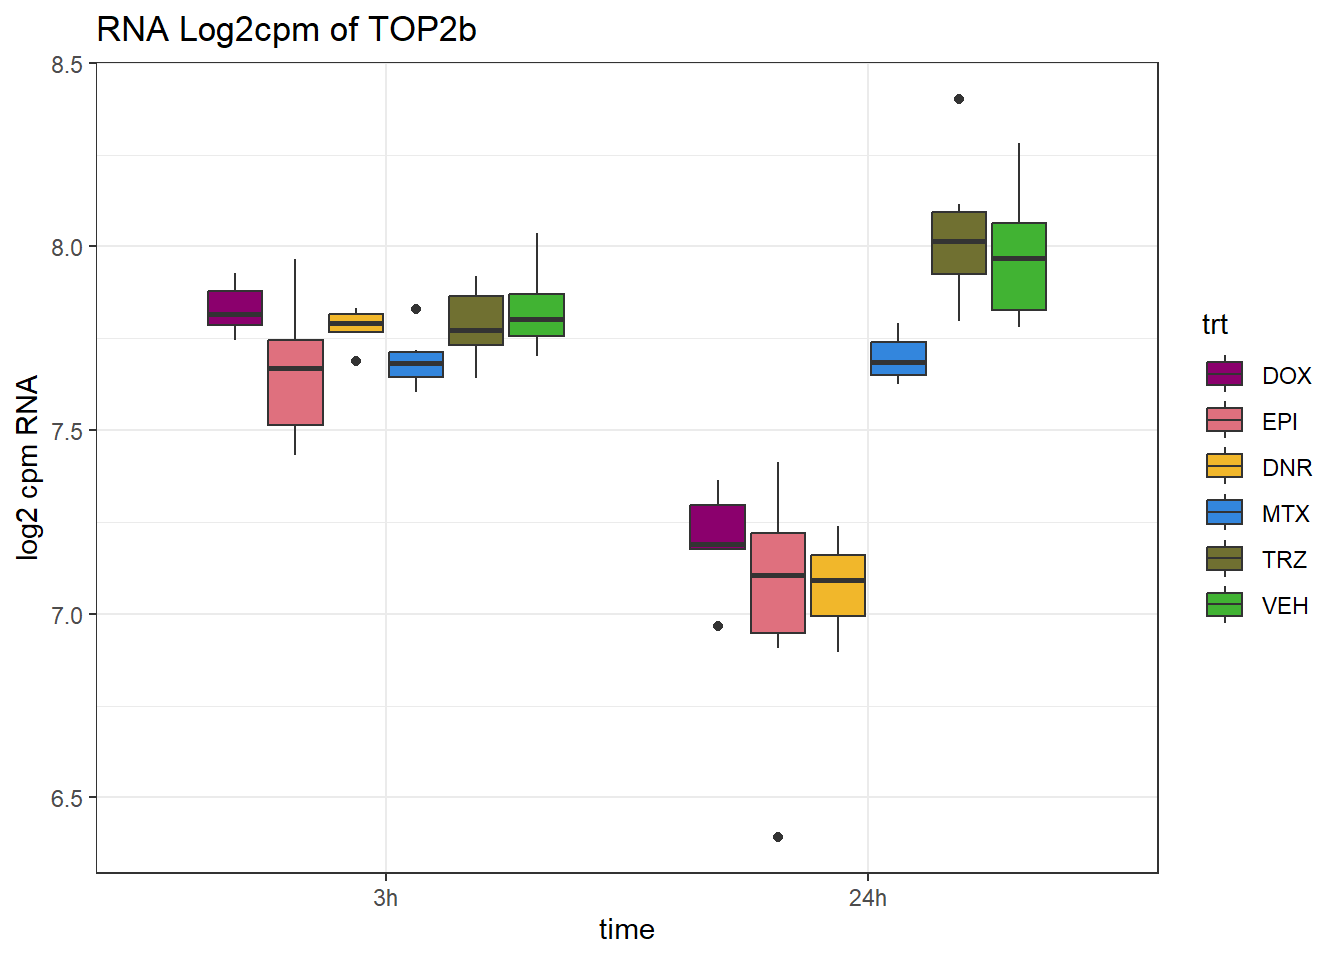
# RNA_counts %>%
#   dplyr::filter(ENTREZID =="7155")
#
# RNA_results %>%
#   dplyr::filter(ENTREZID =="7155")
Expression of genes in specific TAD region
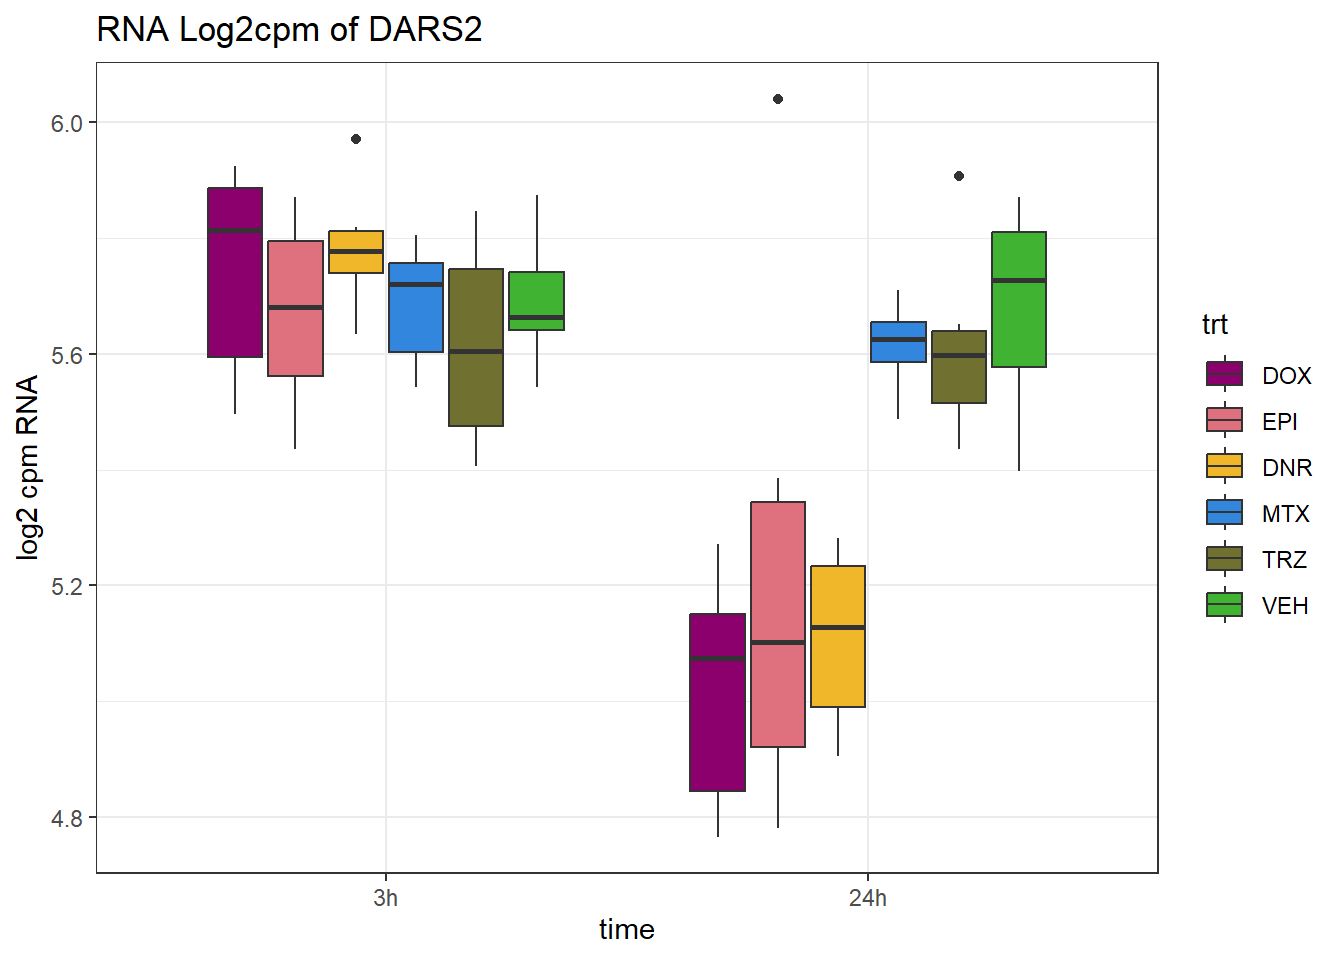
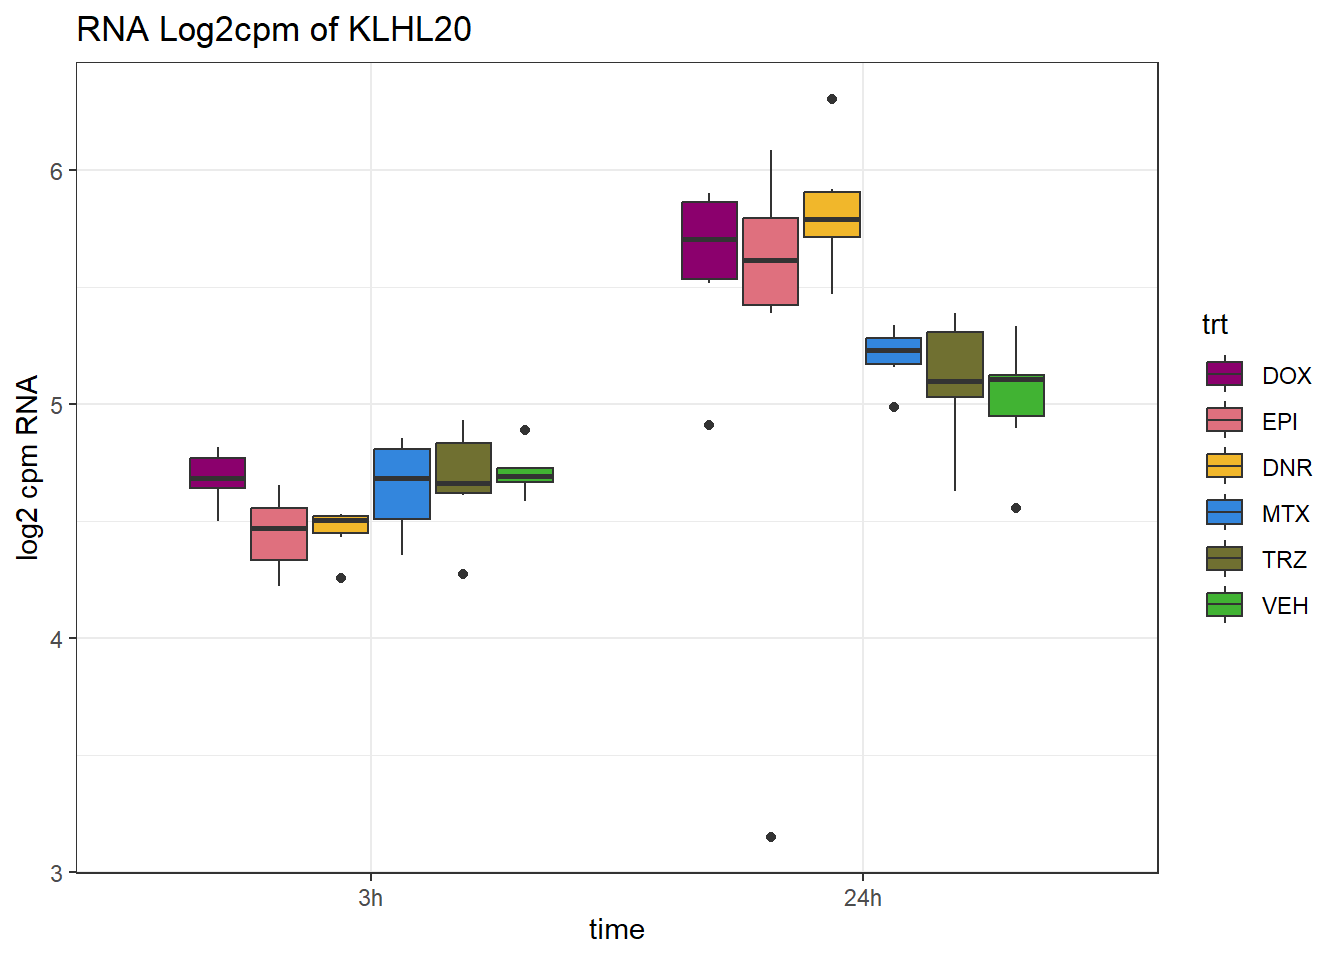
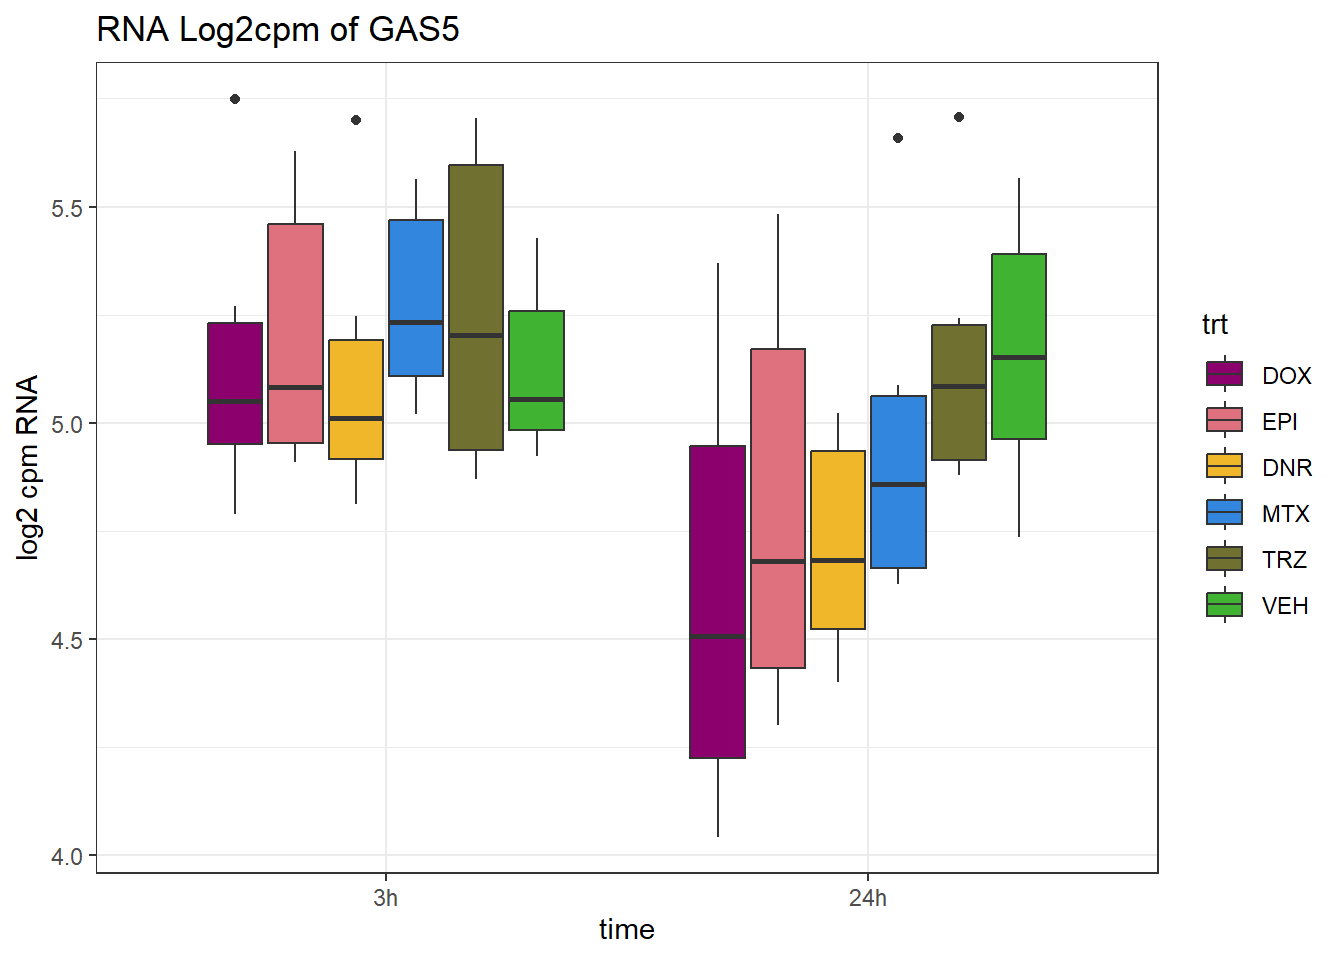
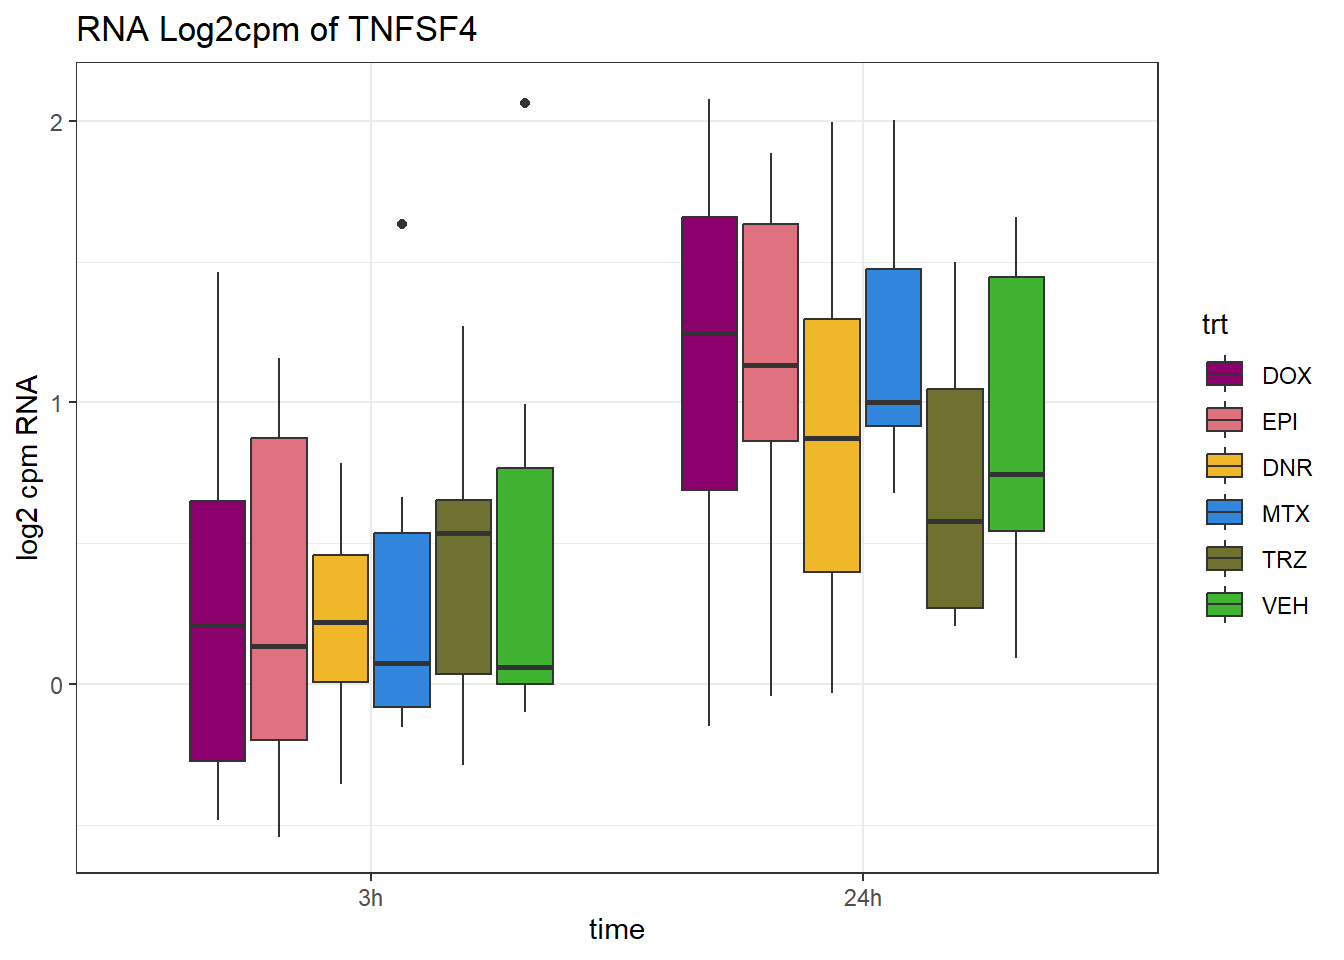
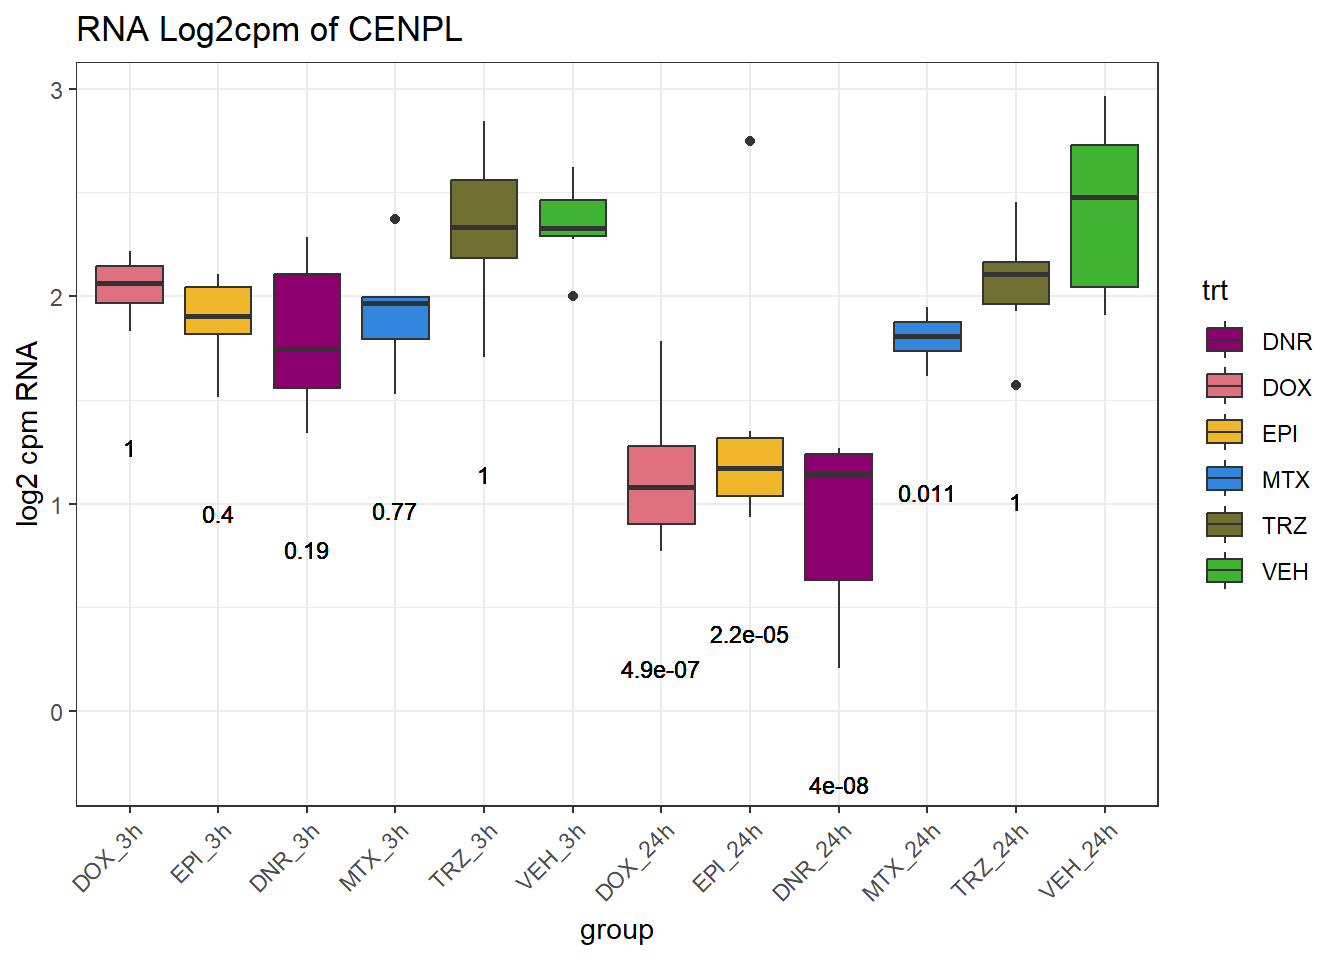
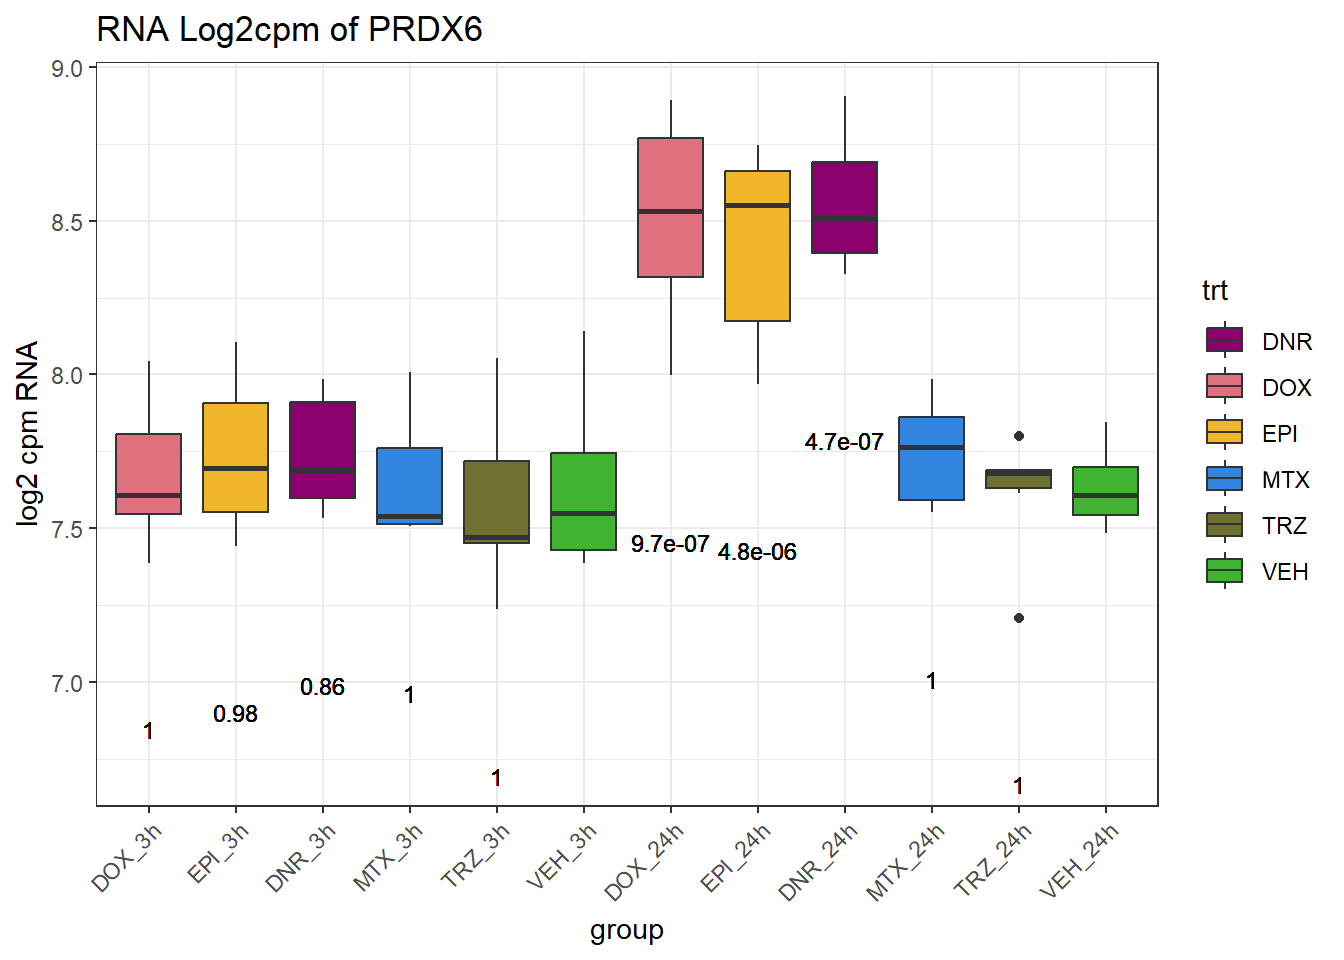
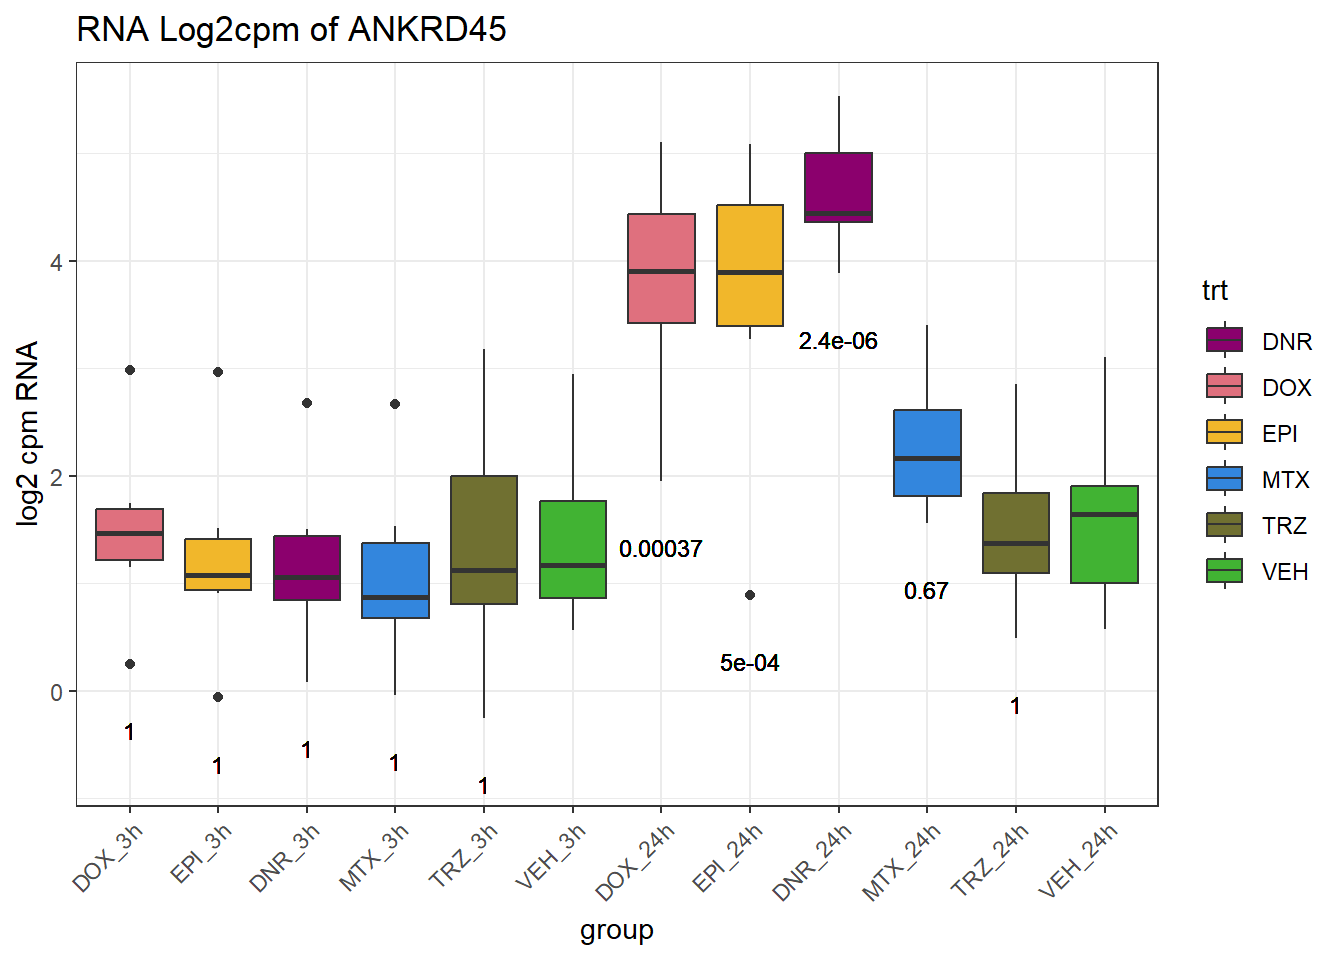
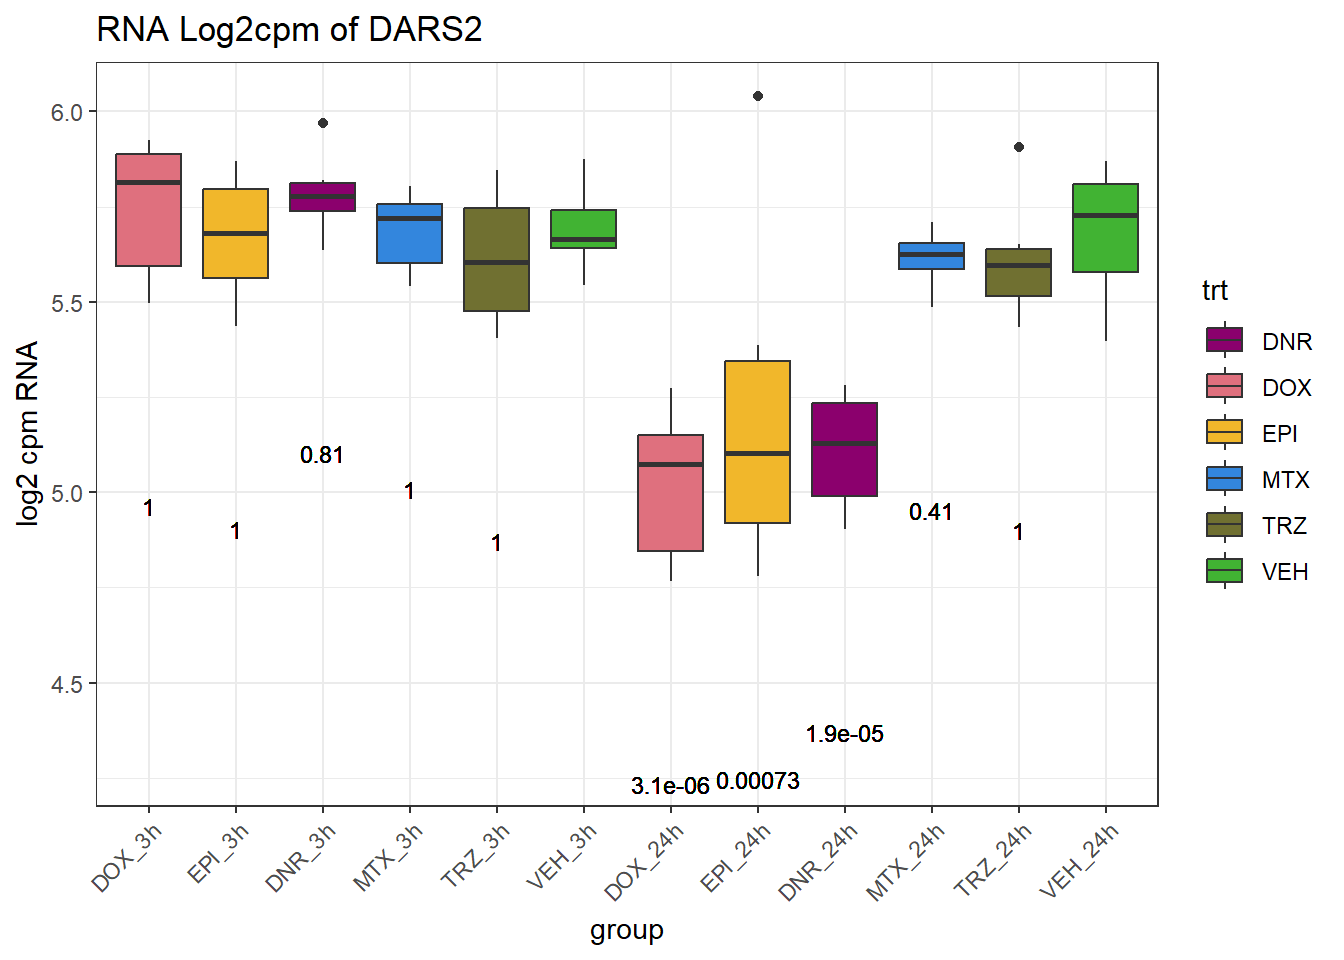
(related to figure 5)
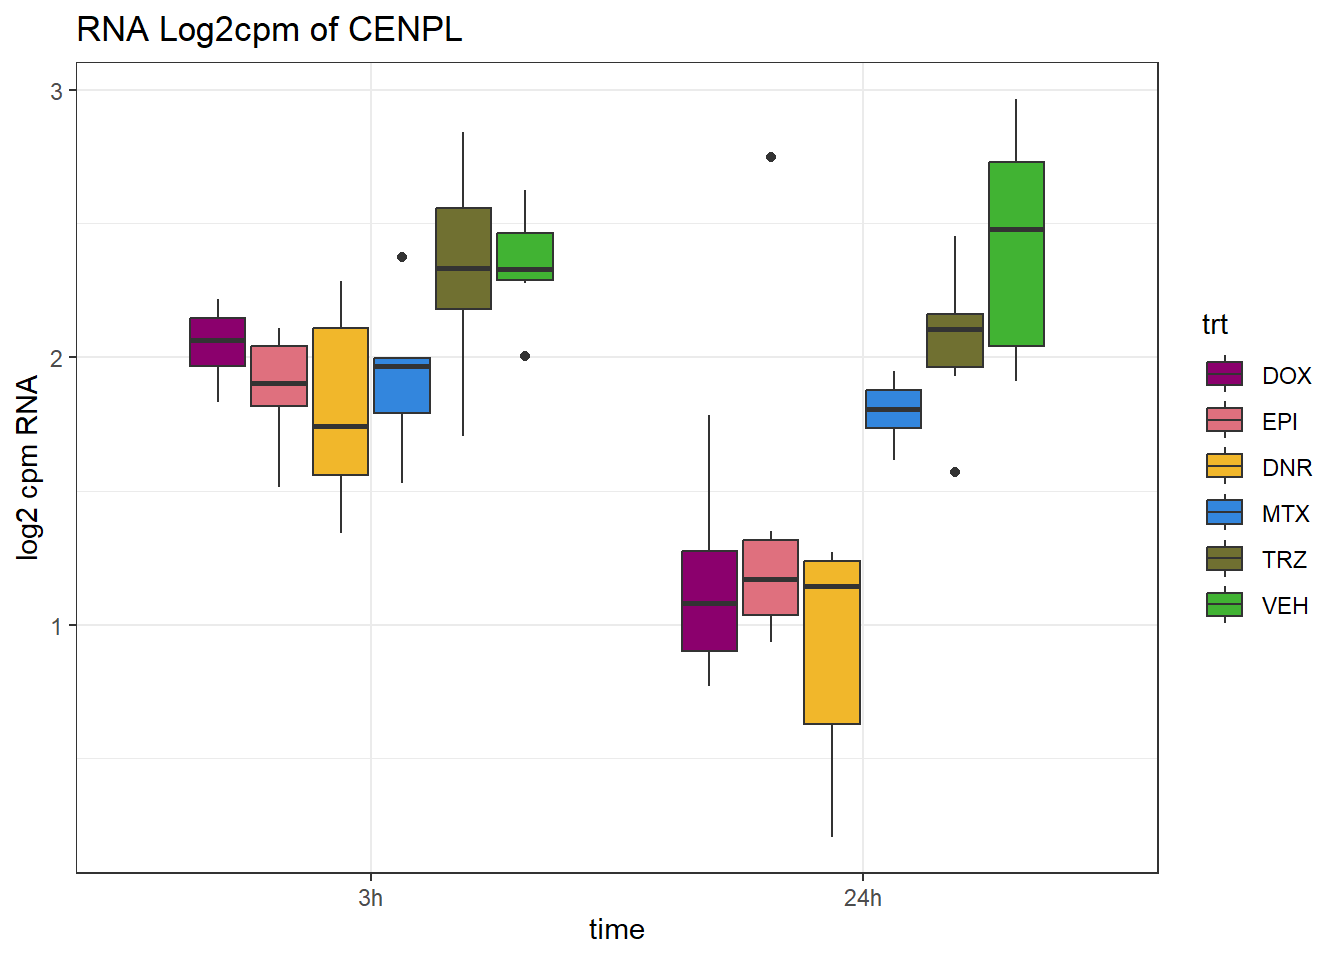
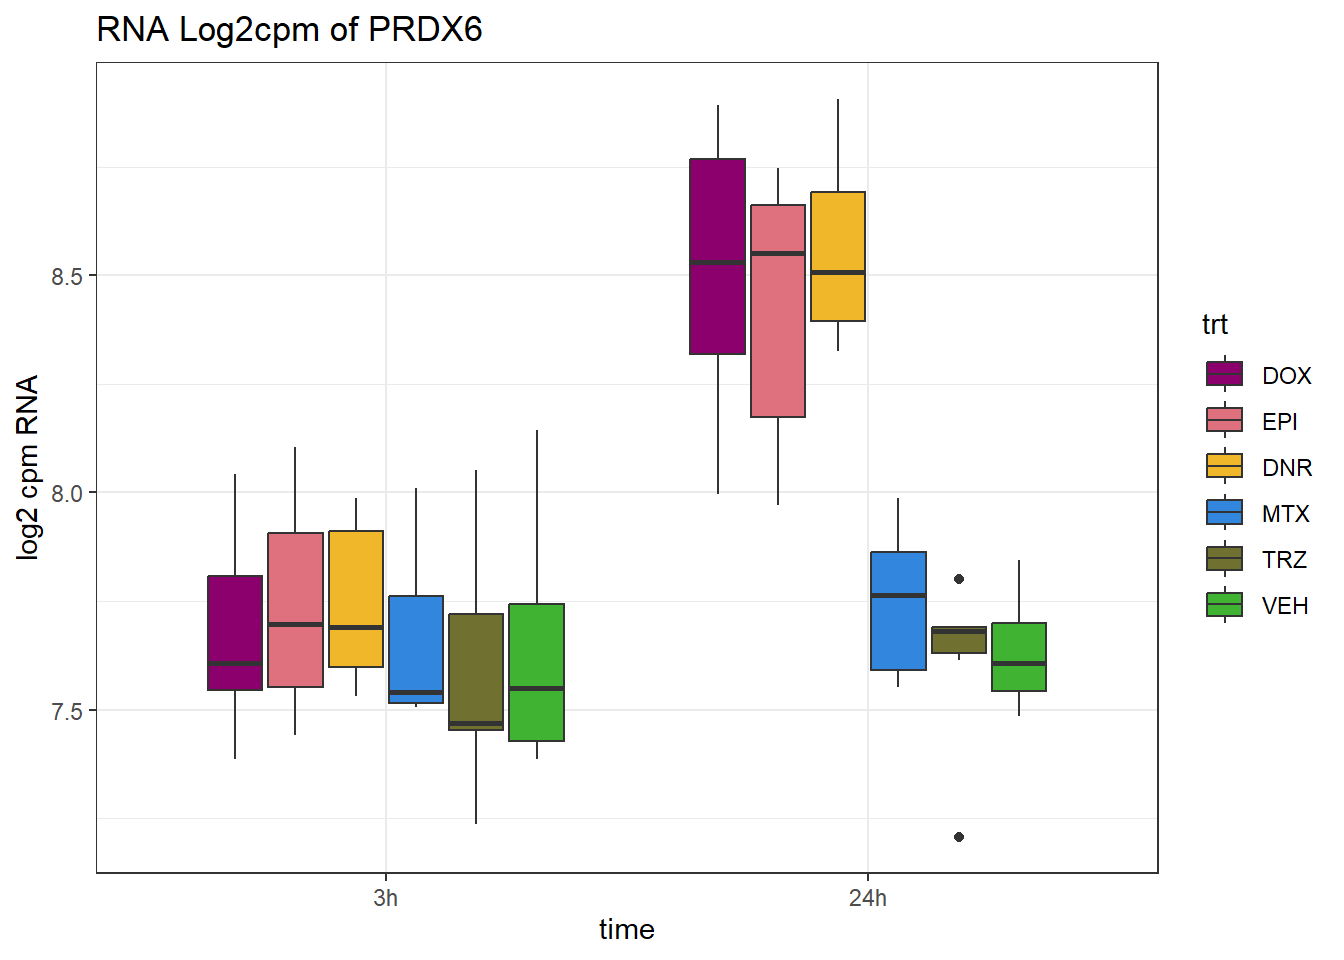
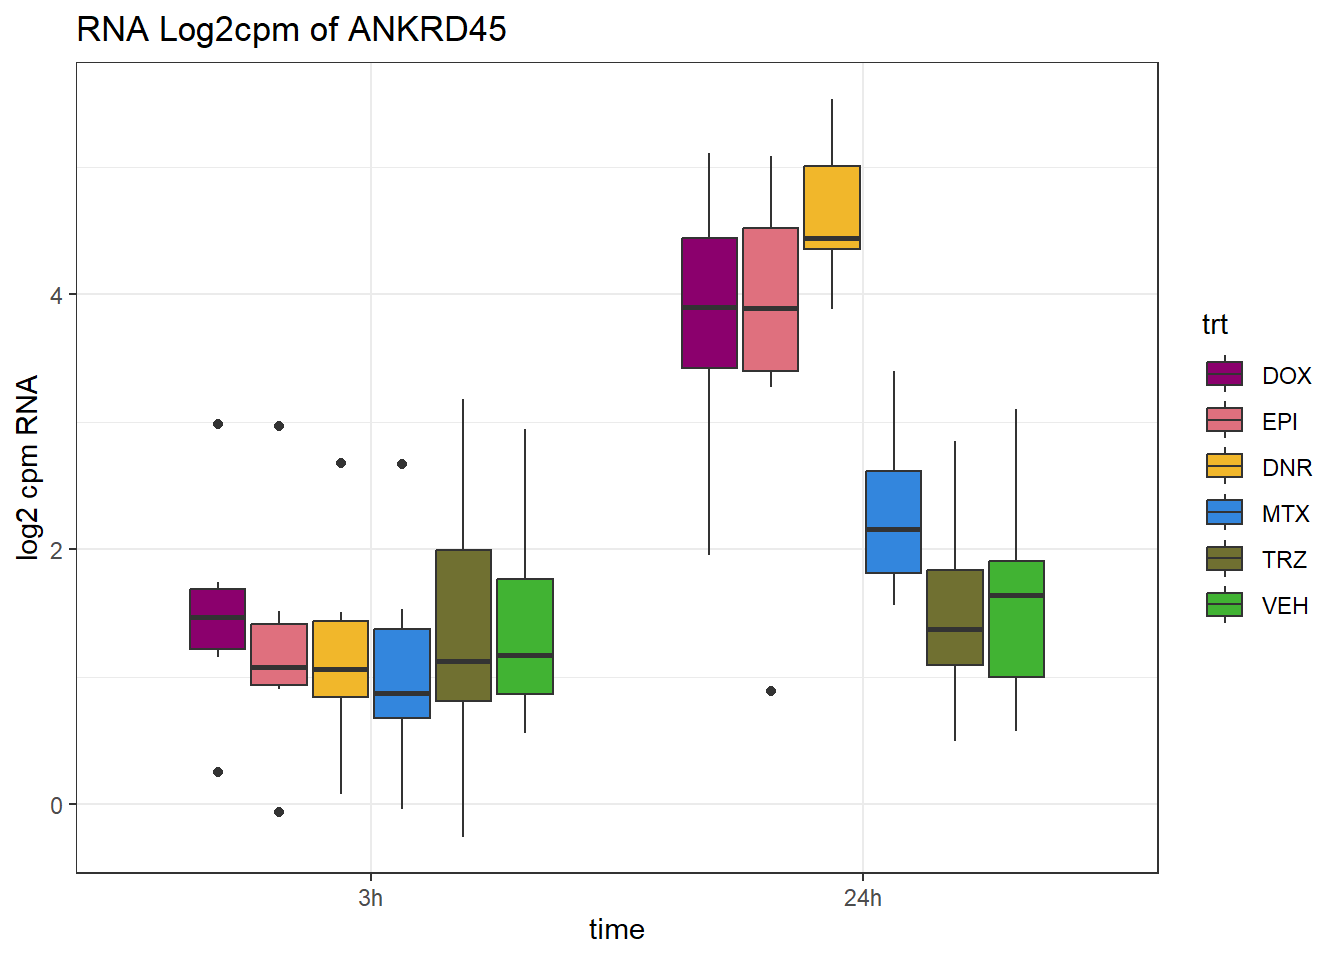
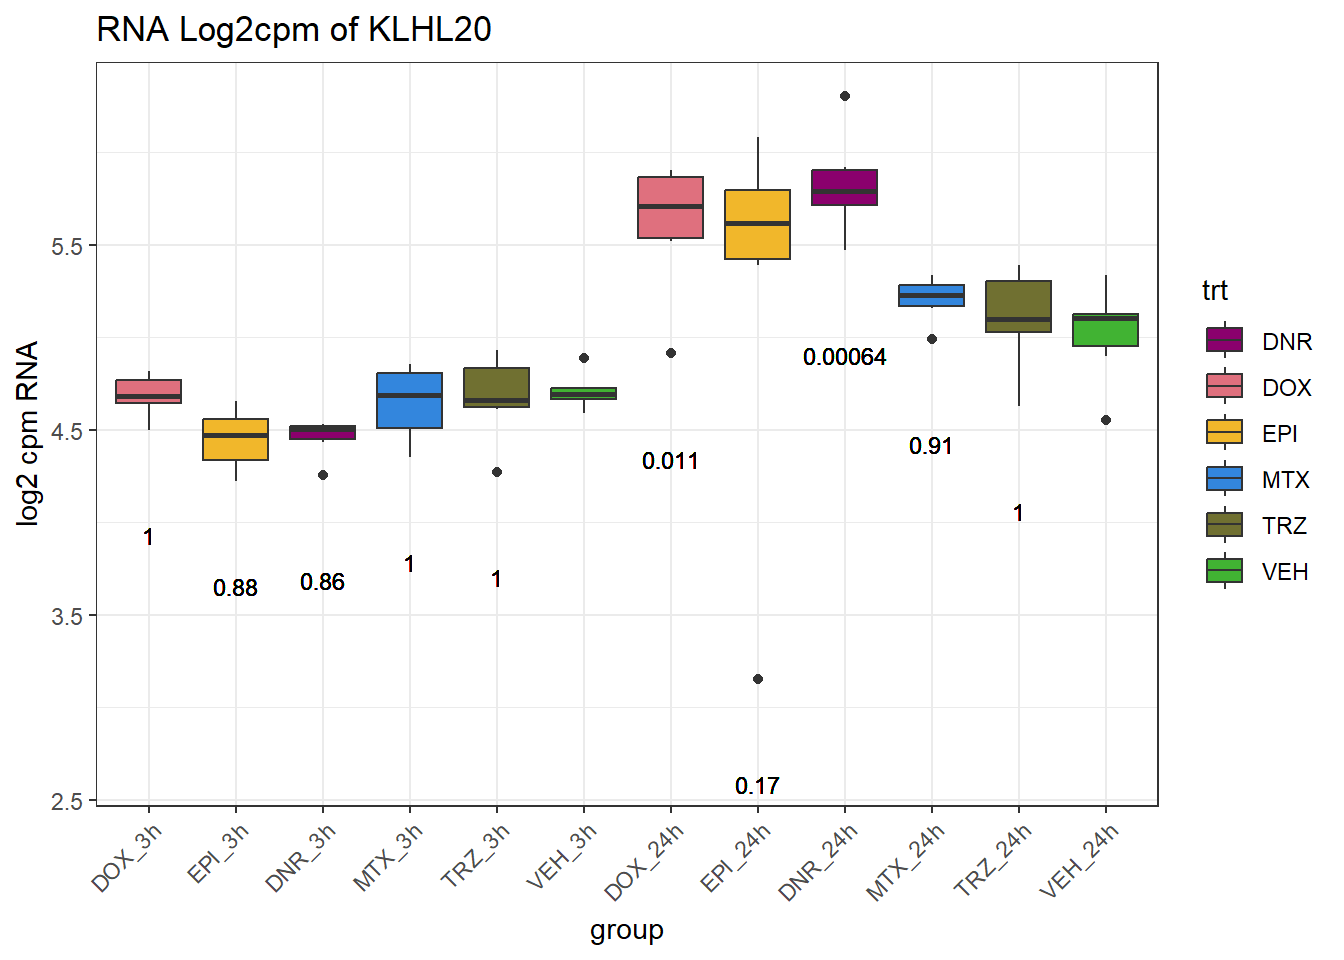
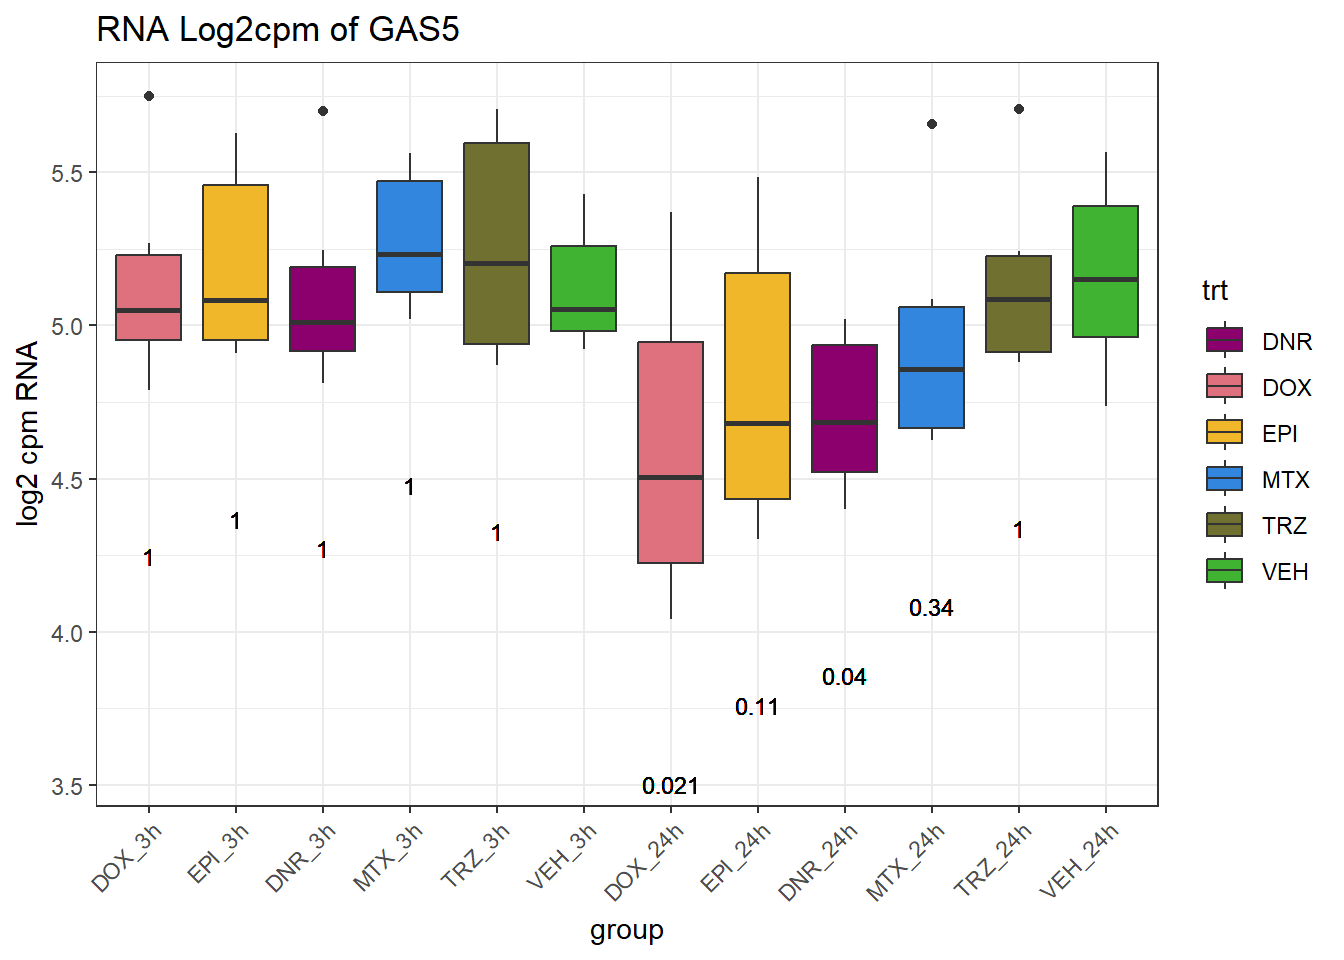
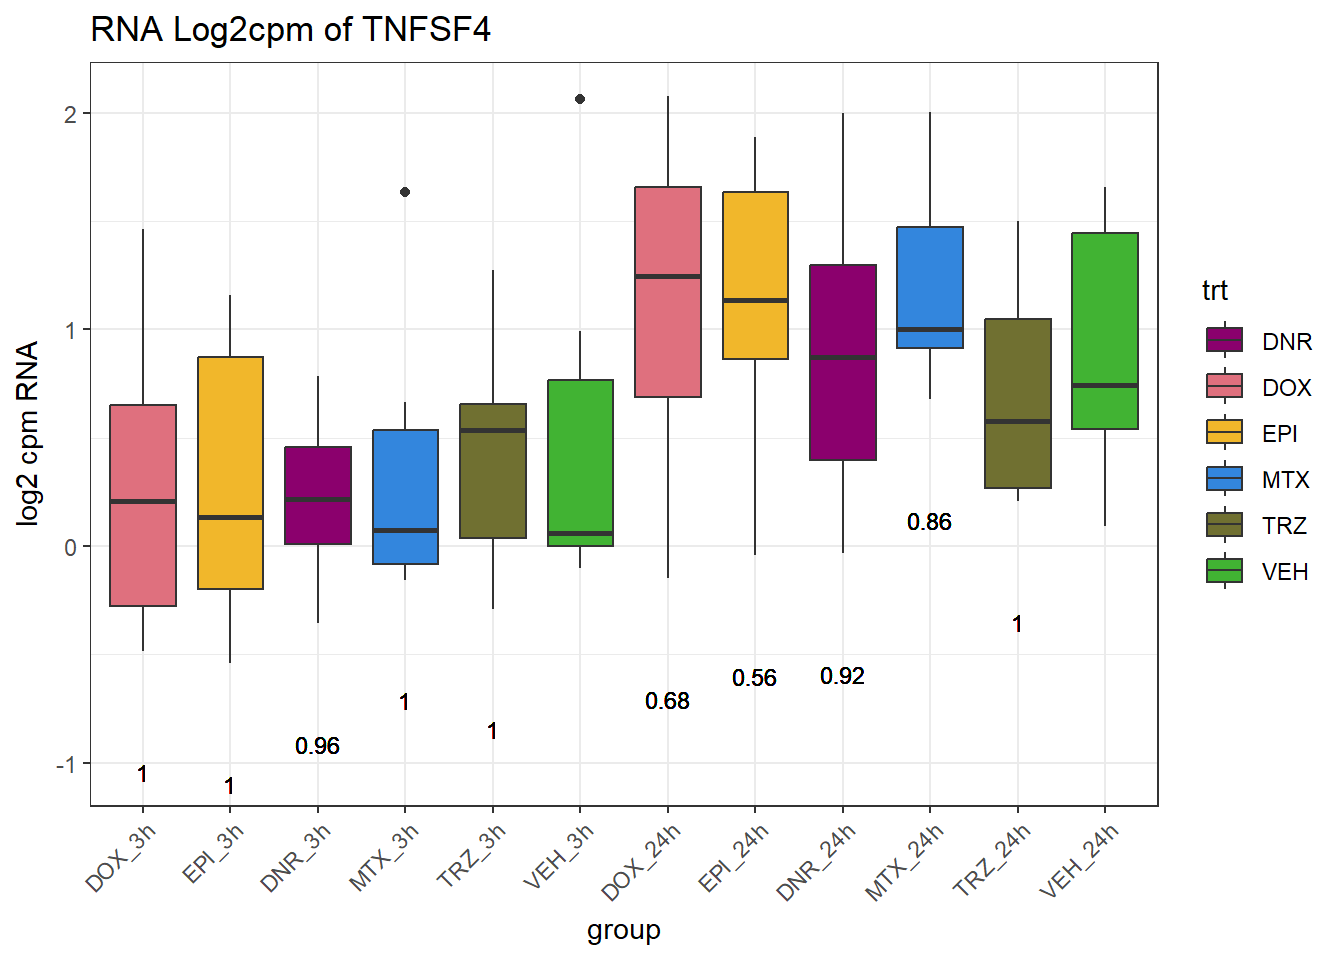
TAD_102_genes <- c("TNFSF18","PRDX6", "TEX50", "KLHL20", "DARS2", "TNFSF4", "SLC9C2", "ANKRD45", "CENPL", "GAS5")

TAD_plot_genes <- RNA_results %>%
  dplyr::filter(SYMBOL%in% TAD_102_genes) %>%
  dplyr::select(ENTREZID,SYMBOL)

 ### Filter pvalues
 clean_RNA_adj.pvals <-  RNA_adj.pvals %>%
    # dplyr::filter(ENTREZID=="55157") %>%
    pivot_longer(cols = contains("pval"), names_to = "sample", values_to = "adj.p.val") %>%
    separate(sample, into = c("trt", "time","pval")) %>%
    mutate(
    time = paste0(time, "h"),  # convert "3" → "3h"
    trt = factor(trt, levels = c("DOX", "EPI", "DNR", "MTX", "TRZ", "VEH"))
  )


for (gene in TAD_plot_genes$ENTREZID) {
  SYMBOL <- TAD_plot_genes$SYMBOL[TAD_plot_genes$ENTREZID == gene]


  # Filter and plot
  gene_plot <- RNA_counts %>%
    filter(ENTREZID == gene) %>%
    pivot_longer(cols = !ENTREZID, names_to = "sample", values_to = "counts") %>%
    separate(sample, into = c("trt", "ind", "time")) %>%
    mutate(
      time = factor(time, levels = c("3h", "24h")),
      trt = factor(trt, levels = c("DOX", "EPI", "DNR", "MTX", "TRZ", "VEH"))
    ) %>%
    ggplot(aes(x = time, y = counts)) +
    geom_boxplot(aes(fill = trt)) +
    scale_fill_manual(values = drug_pal) +
    theme_bw() +
    ylab("log2 cpm RNA") +
    ggtitle(paste0("RNA Log2cpm of ", SYMBOL))

  plot(gene_plot)
}
RNA_pval_clean <- RNA_adj.pvals %>%
  pivot_longer(cols = contains("pval"), names_to = "sample", values_to = "adj.p.val") %>%
    separate(sample, into = c("trt", "time","pval")) %>%
    mutate(
    time = paste0(time, "h"),  # convert "3" → "3h"
    trt = factor(trt, levels = c("DOX", "EPI", "DNR", "MTX", "TRZ", "VEH")),
    group = paste0(trt, "_", time),
    group = factor(group, levels = c(
        "DOX_3h", "EPI_3h", "DNR_3h", "MTX_3h", "TRZ_3h", "VEH_3h",
        "DOX_24h", "EPI_24h", "DNR_24h", "MTX_24h", "TRZ_24h", "VEH_24h"
      ))
    )

for (gene in TAD_plot_genes$ENTREZID) {
  SYMBOL <- TAD_plot_genes$SYMBOL[TAD_plot_genes$ENTREZID == gene]

  # Prep expression data
  gene_expr <- RNA_counts %>%
    filter(ENTREZID == gene) %>%
    pivot_longer(cols = !ENTREZID, names_to = "sample", values_to = "counts") %>%
    separate(sample, into = c("trt", "ind", "time")) %>%
    mutate(
      time = paste0(time),  # if already "3h"/"24h"
      group = paste0(trt, "_", time),
      group = factor(group, levels = c(
        "DOX_3h", "EPI_3h", "DNR_3h", "MTX_3h", "TRZ_3h", "VEH_3h",
        "DOX_24h", "EPI_24h", "DNR_24h", "MTX_24h", "TRZ_24h", "VEH_24h"
      ))
    )

  # Get gene-specific p-values
  gene_pvals <- RNA_pval_clean %>%
    filter(ENTREZID == gene)

  # Merge in p-values by group
  gene_plot_data <- left_join(gene_expr, gene_pvals, by = c("ENTREZID", "group"))

  # Create label position below box
  label_positions <- gene_plot_data %>%
    group_by(group) %>%
    summarise(y = min(counts, na.rm = TRUE) - 0.5, .groups = "drop")

  gene_plot_data <- left_join(gene_plot_data, label_positions, by = "group")
  gene_plot_data <- gene_plot_data %>%
  separate(group, into = c("trt", "time"), sep = "_", remove = FALSE)

  # Plot
  gene_plot <- ggplot(gene_plot_data, aes(x = group, y = counts)) +
    geom_boxplot(aes(fill = trt)) +
    geom_text(
      aes(y = y,
          label = ifelse(trt != "VEH" & !is.na(adj.p.val),
                         paste0("", signif(adj.p.val, 2)),
                         "")),
      size = 3,
      vjust = 1.2
    ) +
    scale_fill_manual(values = drug_pal) +
    theme_bw() +
    ggtitle(paste0("RNA Log2cpm of ", SYMBOL)) +
    ylab("log2 cpm RNA") +
    theme(axis.text.x = element_text(angle = 45, hjust = 1))

plot(gene_plot)
}
sessionInfo()R version 4.4.2 (2024-10-31 ucrt)
Platform: x86_64-w64-mingw32/x64
Running under: Windows 11 x64 (build 26100)
Matrix products: default
locale:
[1] LC_COLLATE=English_United States.utf8
[2] LC_CTYPE=English_United States.utf8
[3] LC_MONETARY=English_United States.utf8
[4] LC_NUMERIC=C
[5] LC_TIME=English_United States.utf8
time zone: America/Chicago
tzcode source: internal
attached base packages:
[1] grid stats4 stats graphics grDevices utils datasets
[8] methods base
other attached packages:
[1] BSgenome.Hsapiens.UCSC.hg38_1.4.5
[2] BSgenome_1.74.0
[3] BiocIO_1.16.0
[4] Biostrings_2.74.1
[5] XVector_0.46.0
[6] regioneR_1.38.0
[7] readxl_1.4.5
[8] circlize_0.4.16
[9] epitools_0.5-10.1
[10] ggrepel_0.9.6
[11] plyranges_1.26.0
[12] ggsignif_0.6.4
[13] genomation_1.38.0
[14] smplot2_0.2.5
[15] eulerr_7.0.2
[16] biomaRt_2.62.1
[17] devtools_2.4.5
[18] usethis_3.1.0
[19] ggpubr_0.6.1
[20] BiocParallel_1.40.2
[21] scales_1.4.0
[22] VennDiagram_1.7.3
[23] futile.logger_1.4.3
[24] gridExtra_2.3
[25] ggfortify_0.4.18
[26] edgeR_4.4.2
[27] limma_3.62.2
[28] rtracklayer_1.66.0
[29] org.Hs.eg.db_3.20.0
[30] TxDb.Hsapiens.UCSC.hg38.knownGene_3.20.0
[31] GenomicFeatures_1.58.0
[32] AnnotationDbi_1.68.0
[33] Biobase_2.66.0
[34] GenomicRanges_1.58.0
[35] GenomeInfoDb_1.42.3
[36] IRanges_2.40.1
[37] S4Vectors_0.44.0
[38] BiocGenerics_0.52.0
[39] ChIPseeker_1.42.1
[40] RColorBrewer_1.1-3
[41] broom_1.0.8
[42] kableExtra_1.4.0
[43] lubridate_1.9.4
[44] forcats_1.0.0
[45] stringr_1.5.1
[46] dplyr_1.1.4
[47] purrr_1.0.4
[48] readr_2.1.5
[49] tidyr_1.3.1
[50] tibble_3.3.0
[51] ggplot2_3.5.2
[52] tidyverse_2.0.0
[53] workflowr_1.7.1
loaded via a namespace (and not attached):
[1] fs_1.6.6
[2] matrixStats_1.5.0
[3] bitops_1.0-9
[4] enrichplot_1.26.6
[5] httr_1.4.7
[6] profvis_0.4.0
[7] tools_4.4.2
[8] backports_1.5.0
[9] utf8_1.2.6
[10] R6_2.6.1
[11] lazyeval_0.2.2
[12] urlchecker_1.0.1
[13] withr_3.0.2
[14] prettyunits_1.2.0
[15] cli_3.6.5
[16] textshaping_1.0.1
[17] formatR_1.14
[18] labeling_0.4.3
[19] sass_0.4.10
[20] Rsamtools_2.22.0
[21] systemfonts_1.2.3
[22] yulab.utils_0.2.0
[23] foreign_0.8-90
[24] DOSE_4.0.1
[25] svglite_2.2.1
[26] R.utils_2.13.0
[27] dichromat_2.0-0.1
[28] sessioninfo_1.2.3
[29] plotrix_3.8-4
[30] pwr_1.3-0
[31] impute_1.80.0
[32] rstudioapi_0.17.1
[33] RSQLite_2.4.1
[34] shape_1.4.6.1
[35] generics_0.1.4
[36] gridGraphics_0.5-1
[37] TxDb.Hsapiens.UCSC.hg19.knownGene_3.2.2
[38] gtools_3.9.5
[39] car_3.1-3
[40] GO.db_3.20.0
[41] Matrix_1.7-3
[42] abind_1.4-8
[43] R.methodsS3_1.8.2
[44] lifecycle_1.0.4
[45] whisker_0.4.1
[46] yaml_2.3.10
[47] carData_3.0-5
[48] SummarizedExperiment_1.36.0
[49] gplots_3.2.0
[50] qvalue_2.38.0
[51] SparseArray_1.6.2
[52] BiocFileCache_2.14.0
[53] blob_1.2.4
[54] promises_1.3.3
[55] crayon_1.5.3
[56] miniUI_0.1.2
[57] ggtangle_0.0.7
[58] lattice_0.22-7
[59] cowplot_1.1.3
[60] KEGGREST_1.46.0
[61] pillar_1.11.0
[62] knitr_1.50
[63] fgsea_1.32.4
[64] rjson_0.2.23
[65] boot_1.3-31
[66] codetools_0.2-20
[67] fastmatch_1.1-6
[68] glue_1.8.0
[69] getPass_0.2-4
[70] ggfun_0.1.9
[71] data.table_1.17.6
[72] remotes_2.5.0
[73] vctrs_0.6.5
[74] png_0.1-8
[75] treeio_1.30.0
[76] cellranger_1.1.0
[77] gtable_0.3.6
[78] cachem_1.1.0
[79] xfun_0.52
[80] S4Arrays_1.6.0
[81] mime_0.13
[82] statmod_1.5.0
[83] ellipsis_0.3.2
[84] nlme_3.1-168
[85] ggtree_3.14.0
[86] bit64_4.6.0-1
[87] filelock_1.0.3
[88] progress_1.2.3
[89] rprojroot_2.0.4
[90] bslib_0.9.0
[91] rpart_4.1.24
[92] KernSmooth_2.23-26
[93] Hmisc_5.2-3
[94] colorspace_2.1-1
[95] DBI_1.2.3
[96] seqPattern_1.38.0
[97] nnet_7.3-20
[98] tidyselect_1.2.1
[99] processx_3.8.6
[100] bit_4.6.0
[101] compiler_4.4.2
[102] curl_6.4.0
[103] git2r_0.36.2
[104] httr2_1.1.2
[105] htmlTable_2.4.3
[106] xml2_1.3.8
[107] DelayedArray_0.32.0
[108] checkmate_2.3.2
[109] caTools_1.18.3
[110] callr_3.7.6
[111] rappdirs_0.3.3
[112] digest_0.6.37
[113] rmarkdown_2.29
[114] base64enc_0.1-3
[115] htmltools_0.5.8.1
[116] pkgconfig_2.0.3
[117] MatrixGenerics_1.18.1
[118] dbplyr_2.5.0
[119] fastmap_1.2.0
[120] GlobalOptions_0.1.2
[121] rlang_1.1.6
[122] htmlwidgets_1.6.4
[123] UCSC.utils_1.2.0
[124] shiny_1.11.1
[125] farver_2.1.2
[126] jquerylib_0.1.4
[127] zoo_1.8-14
[128] jsonlite_2.0.0
[129] GOSemSim_2.32.0
[130] R.oo_1.27.1
[131] RCurl_1.98-1.17
[132] magrittr_2.0.3
[133] Formula_1.2-5
[134] GenomeInfoDbData_1.2.13
[135] ggplotify_0.1.2
[136] patchwork_1.3.1
[137] Rcpp_1.1.0
[138] ape_5.8-1
[139] stringi_1.8.7
[140] zlibbioc_1.52.0
[141] plyr_1.8.9
[142] pkgbuild_1.4.8
[143] parallel_4.4.2
[144] splines_4.4.2
[145] hms_1.1.3
[146] polylabelr_0.3.0
[147] locfit_1.5-9.12
[148] ps_1.9.1
[149] igraph_2.1.4
[150] reshape2_1.4.4
[151] pkgload_1.4.0
[152] futile.options_1.0.1
[153] XML_3.99-0.18
[154] evaluate_1.0.4
[155] lambda.r_1.2.4
[156] tzdb_0.5.0
[157] httpuv_1.6.16
[158] polyclip_1.10-7
[159] gridBase_0.4-7
[160] xtable_1.8-4
[161] restfulr_0.0.16
[162] tidytree_0.4.6
[163] rstatix_0.7.2
[164] later_1.4.2
[165] viridisLite_0.4.2
[166] aplot_0.2.8
[167] memoise_2.0.1
[168] GenomicAlignments_1.42.0
[169] cluster_2.1.8.1
[170] timechange_0.3.0