DAR_analysis
Renee Matthews
2025-05-06
Last updated: 2025-05-06
Checks: 7 0
Knit directory: ATAC_learning/
This reproducible R Markdown analysis was created with workflowr (version 1.7.1). The Checks tab describes the reproducibility checks that were applied when the results were created. The Past versions tab lists the development history.
Great! Since the R Markdown file has been committed to the Git repository, you know the exact version of the code that produced these results.
Great job! The global environment was empty. Objects defined in the global environment can affect the analysis in your R Markdown file in unknown ways. For reproduciblity it’s best to always run the code in an empty environment.
The command set.seed(20231016) was run prior to running
the code in the R Markdown file. Setting a seed ensures that any results
that rely on randomness, e.g. subsampling or permutations, are
reproducible.
Great job! Recording the operating system, R version, and package versions is critical for reproducibility.
Nice! There were no cached chunks for this analysis, so you can be confident that you successfully produced the results during this run.
Great job! Using relative paths to the files within your workflowr project makes it easier to run your code on other machines.
Great! You are using Git for version control. Tracking code development and connecting the code version to the results is critical for reproducibility.
The results in this page were generated with repository version 01178cf. See the Past versions tab to see a history of the changes made to the R Markdown and HTML files.
Note that you need to be careful to ensure that all relevant files for
the analysis have been committed to Git prior to generating the results
(you can use wflow_publish or
wflow_git_commit). workflowr only checks the R Markdown
file, but you know if there are other scripts or data files that it
depends on. Below is the status of the Git repository when the results
were generated:
Ignored files:
    Ignored:    .RData
    Ignored:    .Rhistory
    Ignored:    .Rproj.user/
    Ignored:    data/ACresp_SNP_table.csv
    Ignored:    data/ARR_SNP_table.csv
    Ignored:    data/All_merged_peaks.tsv
    Ignored:    data/CAD_gwas_dataframe.RDS
    Ignored:    data/CTX_SNP_table.csv
    Ignored:    data/Collapsed_expressed_NG_peak_table.csv
    Ignored:    data/DEG_toplist_sep_n45.RDS
    Ignored:    data/FRiP_first_run.txt
    Ignored:    data/Final_four_data/
    Ignored:    data/Frip_1_reads.csv
    Ignored:    data/Frip_2_reads.csv
    Ignored:    data/Frip_3_reads.csv
    Ignored:    data/Frip_4_reads.csv
    Ignored:    data/Frip_5_reads.csv
    Ignored:    data/Frip_6_reads.csv
    Ignored:    data/GO_KEGG_analysis/
    Ignored:    data/HF_SNP_table.csv
    Ignored:    data/Ind1_75DA24h_dedup_peaks.csv
    Ignored:    data/Ind1_TSS_peaks.RDS
    Ignored:    data/Ind1_firstfragment_files.txt
    Ignored:    data/Ind1_fragment_files.txt
    Ignored:    data/Ind1_peaks_list.RDS
    Ignored:    data/Ind1_summary.txt
    Ignored:    data/Ind2_TSS_peaks.RDS
    Ignored:    data/Ind2_fragment_files.txt
    Ignored:    data/Ind2_peaks_list.RDS
    Ignored:    data/Ind2_summary.txt
    Ignored:    data/Ind3_TSS_peaks.RDS
    Ignored:    data/Ind3_fragment_files.txt
    Ignored:    data/Ind3_peaks_list.RDS
    Ignored:    data/Ind3_summary.txt
    Ignored:    data/Ind4_79B24h_dedup_peaks.csv
    Ignored:    data/Ind4_TSS_peaks.RDS
    Ignored:    data/Ind4_V24h_fraglength.txt
    Ignored:    data/Ind4_fragment_files.txt
    Ignored:    data/Ind4_fragment_filesN.txt
    Ignored:    data/Ind4_peaks_list.RDS
    Ignored:    data/Ind4_summary.txt
    Ignored:    data/Ind5_TSS_peaks.RDS
    Ignored:    data/Ind5_fragment_files.txt
    Ignored:    data/Ind5_fragment_filesN.txt
    Ignored:    data/Ind5_peaks_list.RDS
    Ignored:    data/Ind5_summary.txt
    Ignored:    data/Ind6_TSS_peaks.RDS
    Ignored:    data/Ind6_fragment_files.txt
    Ignored:    data/Ind6_peaks_list.RDS
    Ignored:    data/Ind6_summary.txt
    Ignored:    data/Knowles_4.RDS
    Ignored:    data/Knowles_5.RDS
    Ignored:    data/Knowles_6.RDS
    Ignored:    data/LiSiLTDNRe_TE_df.RDS
    Ignored:    data/MI_gwas.RDS
    Ignored:    data/SNP_GWAS_PEAK_MRC_id
    Ignored:    data/SNP_GWAS_PEAK_MRC_id.csv
    Ignored:    data/SNP_gene_cat_list.tsv
    Ignored:    data/SNP_supp_schneider.RDS
    Ignored:    data/TE_info/
    Ignored:    data/TFmapnames.RDS
    Ignored:    data/all_TSSE_scores.RDS
    Ignored:    data/all_four_filtered_counts.txt
    Ignored:    data/aln_run1_results.txt
    Ignored:    data/anno_ind1_DA24h.RDS
    Ignored:    data/anno_ind4_V24h.RDS
    Ignored:    data/annotated_gwas_SNPS.csv
    Ignored:    data/background_n45_he_peaks.RDS
    Ignored:    data/cardiac_muscle_FRIP.csv
    Ignored:    data/cardiomyocyte_FRIP.csv
    Ignored:    data/col_ng_peak.csv
    Ignored:    data/cormotif_full_4_run.RDS
    Ignored:    data/cormotif_full_4_run_he.RDS
    Ignored:    data/cormotif_full_6_run.RDS
    Ignored:    data/cormotif_full_6_run_he.RDS
    Ignored:    data/cormotif_probability_45_list.csv
    Ignored:    data/cormotif_probability_45_list_he.csv
    Ignored:    data/cormotif_probability_all_6_list.csv
    Ignored:    data/cormotif_probability_all_6_list_he.csv
    Ignored:    data/datasave.RDS
    Ignored:    data/embryo_heart_FRIP.csv
    Ignored:    data/enhancer_list_ENCFF126UHK.bed
    Ignored:    data/enhancerdata/
    Ignored:    data/filt_Peaks_efit2.RDS
    Ignored:    data/filt_Peaks_efit2_bl.RDS
    Ignored:    data/filt_Peaks_efit2_n45.RDS
    Ignored:    data/first_Peaksummarycounts.csv
    Ignored:    data/first_run_frag_counts.txt
    Ignored:    data/full_bedfiles/
    Ignored:    data/gene_ref.csv
    Ignored:    data/gwas_1_dataframe.RDS
    Ignored:    data/gwas_2_dataframe.RDS
    Ignored:    data/gwas_3_dataframe.RDS
    Ignored:    data/gwas_4_dataframe.RDS
    Ignored:    data/gwas_5_dataframe.RDS
    Ignored:    data/high_conf_peak_counts.csv
    Ignored:    data/high_conf_peak_counts.txt
    Ignored:    data/high_conf_peaks_bl_counts.txt
    Ignored:    data/high_conf_peaks_counts.txt
    Ignored:    data/hits_files/
    Ignored:    data/hyper_files/
    Ignored:    data/hypo_files/
    Ignored:    data/ind1_DA24hpeaks.RDS
    Ignored:    data/ind1_TSSE.RDS
    Ignored:    data/ind2_TSSE.RDS
    Ignored:    data/ind3_TSSE.RDS
    Ignored:    data/ind4_TSSE.RDS
    Ignored:    data/ind4_V24hpeaks.RDS
    Ignored:    data/ind5_TSSE.RDS
    Ignored:    data/ind6_TSSE.RDS
    Ignored:    data/initial_complete_stats_run1.txt
    Ignored:    data/left_ventricle_FRIP.csv
    Ignored:    data/median_24_lfc.RDS
    Ignored:    data/median_3_lfc.RDS
    Ignored:    data/mergedPeads.gff
    Ignored:    data/mergedPeaks.gff
    Ignored:    data/motif_list_full
    Ignored:    data/motif_list_n45
    Ignored:    data/motif_list_n45.RDS
    Ignored:    data/multiqc_fastqc_run1.txt
    Ignored:    data/multiqc_fastqc_run2.txt
    Ignored:    data/multiqc_genestat_run1.txt
    Ignored:    data/multiqc_genestat_run2.txt
    Ignored:    data/my_hc_filt_counts.RDS
    Ignored:    data/my_hc_filt_counts_n45.RDS
    Ignored:    data/n45_bedfiles/
    Ignored:    data/n45_files
    Ignored:    data/other_papers/
    Ignored:    data/peakAnnoList_1.RDS
    Ignored:    data/peakAnnoList_2.RDS
    Ignored:    data/peakAnnoList_24_full.RDS
    Ignored:    data/peakAnnoList_24_n45.RDS
    Ignored:    data/peakAnnoList_3.RDS
    Ignored:    data/peakAnnoList_3_full.RDS
    Ignored:    data/peakAnnoList_3_n45.RDS
    Ignored:    data/peakAnnoList_4.RDS
    Ignored:    data/peakAnnoList_5.RDS
    Ignored:    data/peakAnnoList_6.RDS
    Ignored:    data/peakAnnoList_Eight.RDS
    Ignored:    data/peakAnnoList_full_motif.RDS
    Ignored:    data/peakAnnoList_n45_motif.RDS
    Ignored:    data/siglist_full.RDS
    Ignored:    data/siglist_n45.RDS
    Ignored:    data/summarized_peaks_dataframe.txt
    Ignored:    data/summary_peakIDandReHeat.csv
    Ignored:    data/test.list.RDS
    Ignored:    data/testnames.txt
    Ignored:    data/toplist_6.RDS
    Ignored:    data/toplist_full.RDS
    Ignored:    data/toplist_full_DAR_6.RDS
    Ignored:    data/toplist_n45.RDS
    Ignored:    data/trimmed_seq_length.csv
    Ignored:    data/unclassified_full_set_peaks.RDS
    Ignored:    data/unclassified_n45_set_peaks.RDS
    Ignored:    data/xstreme/

Untracked files:
    Untracked:  analysis/Cormotif_analysis.Rmd
    Untracked:  analysis/Diagnosis-tmm.Rmd
    Untracked:  analysis/Expressed_RNA_associations.Rmd
    Untracked:  analysis/LFC_corr.Rmd
    Untracked:  analysis/QC_on_reads.Rmd
    Untracked:  analysis/SVA.Rmd
    Untracked:  analysis/Tan2020.Rmd
    Untracked:  analysis/making_master_peaks_list.Rmd
    Untracked:  analysis/my_hc_filt_counts.csv
    Untracked:  code/IGV_snapshot_code.R
    Untracked:  code/LongDARlist.R
    Untracked:  code/just_for_Fun.R
    Untracked:  output/cormotif_probability_45_list.csv
    Untracked:  output/cormotif_probability_all_6_list.csv
    Untracked:  setup.RData

Unstaged changes:
    Modified:   ATAC_learning.Rproj
    Modified:   analysis/Counts_matrix.Rmd
    Modified:   analysis/Jaspar_motif.Rmd
    Modified:   analysis/Jaspar_motif_ff.Rmd
    Modified:   analysis/final_four_analysis.Rmd
Note that any generated files, e.g. HTML, png, CSS, etc., are not included in this status report because it is ok for generated content to have uncommitted changes.
These are the previous versions of the repository in which changes were
made to the R Markdown (analysis/DEG_analysis.Rmd) and HTML
(docs/DEG_analysis.html) files. If you’ve configured a
remote Git repository (see ?wflow_git_remote), click on the
hyperlinks in the table below to view the files as they were in that
past version.
| File | Version | Author | Date | Message |
|---|---|---|---|---|
| Rmd | 01178cf | reneeisnowhere | 2025-05-06 | adding in segment |
library(tidyverse)
library(kableExtra)
library(broom)
library(RColorBrewer)
library(ChIPseeker)
library("TxDb.Hsapiens.UCSC.hg38.knownGene")
library("org.Hs.eg.db")
library(rtracklayer)
library(edgeR)
library(ggfortify)
library(limma)
library(readr)
library(BiocGenerics)
library(gridExtra)
library(VennDiagram)
library(scales)
library(BiocParallel)
library(ggpubr)
library(devtools)
library(eulerr)
library(ggsignif)
library(plyranges)
library(ggrepel)
library(ComplexHeatmap)
library(cowplot)
library(smplot2)
library(data.table)
Differentail analysis
Loading counts matrix and making filtered matrix
raw_counts <- read_delim("data/Final_four_data/re_analysis/Raw_unfiltered_counts.tsv",delim="\t") %>%
  column_to_rownames("Peakid") %>%
  as.matrix()

lcpm <- cpm(raw_counts, log= TRUE)
  ### for determining the basic cutoffs
filt_raw_counts <- raw_counts[rowMeans(lcpm)> 0,]

filt_raw_counts_noY <- filt_raw_counts[!grepl("chrY",rownames(filt_raw_counts)),]
dim(filt_raw_counts_noY)
[1] 155557 48Number of filtered regions without the y chromosome = 155557 regions
making the metadata form
annotation_mat <- data.frame(timeset=colnames(filt_raw_counts_noY)) %>%
  mutate(sample = timeset) %>%
  separate(timeset, into = c("indv","trt","time"), sep= "_") %>%
  mutate(time = factor(time, levels = c("3h", "24h"))) %>%
  mutate(trt = factor(trt, levels = c("DOX","EPI", "DNR", "MTX", "TRZ", "VEH"))) %>%
  mutate(indv=factor(indv, levels = c("A","B","C","D"))) %>%
  mutate(trt_time=paste0(trt,"_",time))
prepare DGE object
group <- c( rep(c(1,2,3,4,5,6,7,8,9,10,11,12),4))
group <- factor(group, levels =c("1","2","3","4","5","6","7","8","9","10","11","12"))
dge <-  DGEList.data.frame(counts = filt_raw_counts_noY, group = group, genes = row.names(filt_raw_counts_noY))
dge <- calcNormFactors(dge)

dge$samples
group lib.size norm.factors
D_DNR_24h 1 16022907 1.0239692
D_DNR_3h 2 12283494 0.9612342
D_DOX_24h 3 17860884 1.0367665
D_DOX_3h 4 13506791 1.0325656
D_EPI_24h 5 18628141 1.0327372
D_EPI_3h 6 11218019 1.0171289
D_MTX_24h 7 15070579 1.1107812
D_MTX_3h 8 8224116 1.0938773
D_TRZ_24h 9 13765197 0.9916489
D_TRZ_3h 10 9838944 1.0289011
D_VEH_24h 11 18137669 0.9855606
D_VEH_3h 12 5215243 1.1193711
A_DNR_24h 1 12446867 0.9913953
A_DNR_3h 2 13336679 0.9109168
A_DOX_24h 3 11024760 0.8994761
A_DOX_3h 4 11312301 0.9817107
A_EPI_24h 5 10054890 0.8306893
A_EPI_3h 6 13289458 0.8846067
A_MTX_24h 7 12051332 1.0488547
A_MTX_3h 8 19529308 0.9756453
A_TRZ_24h 9 11144980 0.8850322
A_TRZ_3h 10 10815793 0.9696953
A_VEH_24h 11 10644539 0.9044966
A_VEH_3h 12 10146179 1.0015305
B_DNR_24h 1 8695642 1.0170461
B_DNR_3h 2 11572135 0.8666718
B_DOX_24h 3 7780737 1.0039941
B_DOX_3h 4 6315637 0.8935147
B_EPI_24h 5 7912993 1.0275056
B_EPI_3h 6 7196001 0.9035920
B_MTX_24h 7 7434261 1.0947453
B_MTX_3h 8 10544429 0.8769442
B_TRZ_24h 9 6552039 0.9772581
B_TRZ_3h 10 6390372 0.9027404
B_VEH_24h 11 3521378 1.0063550
B_VEH_3h 12 4936492 1.0027569
C_DNR_24h 1 11796366 1.0773328
C_DNR_3h 2 6968392 1.0576684
C_DOX_24h 3 8352016 1.1219236
C_DOX_3h 4 5992702 1.0623451
C_EPI_24h 5 7970178 1.1143342
C_EPI_3h 6 5933236 1.0854547
C_MTX_24h 7 5584157 1.1803465
C_MTX_3h 8 9157251 1.0227009
C_TRZ_24h 9 5662913 1.0288892
C_TRZ_3h 10 4552166 1.0697477
C_VEH_24h 11 7597538 1.0237355
C_VEH_3h 12 6681133 1.0107246Making model matrix
group_1 <- c(rep(c("DNR_24","DNR_3","DOX_24","DOX_3","EPI_24","EPI_3","MTX_24","MTX_3","TRZ_24","TRZ_3","VEH_24", "VEH_3"),4))

 mm <- model.matrix(~0 +group_1)
colnames(mm) <-  c("DNR_24", "DNR_3", "DOX_24","DOX_3","EPI_24", "EPI_3","MTX_24", "MTX_3", "TRZ_24","TRZ_3","VEH_24", "VEH_3")
mm
DNR_24 DNR_3 DOX_24 DOX_3 EPI_24 EPI_3 MTX_24 MTX_3 TRZ_24 TRZ_3 VEH_24
1 1 0 0 0 0 0 0 0 0 0 0
2 0 1 0 0 0 0 0 0 0 0 0
3 0 0 1 0 0 0 0 0 0 0 0
4 0 0 0 1 0 0 0 0 0 0 0
5 0 0 0 0 1 0 0 0 0 0 0
6 0 0 0 0 0 1 0 0 0 0 0
7 0 0 0 0 0 0 1 0 0 0 0
8 0 0 0 0 0 0 0 1 0 0 0
9 0 0 0 0 0 0 0 0 1 0 0
10 0 0 0 0 0 0 0 0 0 1 0
11 0 0 0 0 0 0 0 0 0 0 1
12 0 0 0 0 0 0 0 0 0 0 0
13 1 0 0 0 0 0 0 0 0 0 0
14 0 1 0 0 0 0 0 0 0 0 0
15 0 0 1 0 0 0 0 0 0 0 0
16 0 0 0 1 0 0 0 0 0 0 0
17 0 0 0 0 1 0 0 0 0 0 0
18 0 0 0 0 0 1 0 0 0 0 0
19 0 0 0 0 0 0 1 0 0 0 0
20 0 0 0 0 0 0 0 1 0 0 0
21 0 0 0 0 0 0 0 0 1 0 0
22 0 0 0 0 0 0 0 0 0 1 0
23 0 0 0 0 0 0 0 0 0 0 1
24 0 0 0 0 0 0 0 0 0 0 0
25 1 0 0 0 0 0 0 0 0 0 0
26 0 1 0 0 0 0 0 0 0 0 0
27 0 0 1 0 0 0 0 0 0 0 0
28 0 0 0 1 0 0 0 0 0 0 0
29 0 0 0 0 1 0 0 0 0 0 0
30 0 0 0 0 0 1 0 0 0 0 0
31 0 0 0 0 0 0 1 0 0 0 0
32 0 0 0 0 0 0 0 1 0 0 0
33 0 0 0 0 0 0 0 0 1 0 0
34 0 0 0 0 0 0 0 0 0 1 0
35 0 0 0 0 0 0 0 0 0 0 1
36 0 0 0 0 0 0 0 0 0 0 0
37 1 0 0 0 0 0 0 0 0 0 0
38 0 1 0 0 0 0 0 0 0 0 0
39 0 0 1 0 0 0 0 0 0 0 0
40 0 0 0 1 0 0 0 0 0 0 0
41 0 0 0 0 1 0 0 0 0 0 0
42 0 0 0 0 0 1 0 0 0 0 0
43 0 0 0 0 0 0 1 0 0 0 0
44 0 0 0 0 0 0 0 1 0 0 0
45 0 0 0 0 0 0 0 0 1 0 0
46 0 0 0 0 0 0 0 0 0 1 0
47 0 0 0 0 0 0 0 0 0 0 1
48 0 0 0 0 0 0 0 0 0 0 0
VEH_3
1 0
2 0
3 0
4 0
5 0
6 0
7 0
8 0
9 0
10 0
11 0
12 1
13 0
14 0
15 0
16 0
17 0
18 0
19 0
20 0
21 0
22 0
23 0
24 1
25 0
26 0
27 0
28 0
29 0
30 0
31 0
32 0
33 0
34 0
35 0
36 1
37 0
38 0
39 0
40 0
41 0
42 0
43 0
44 0
45 0
46 0
47 0
48 1
attr(,"assign")
[1] 1 1 1 1 1 1 1 1 1 1 1 1
attr(,"contrasts")
attr(,"contrasts")$group_1
[1] "contr.treatment"In this pipeline, I first run voom transformation, then estimate the intra-individual correlation. Next I do voom again with correlation info. I fit the linear model, define contrasts, then apply the contrasts and perform eBayes to get statistics.
y <- voom(dge, mm,plot =FALSE)

corfit <- duplicateCorrelation(y, mm, block = annotation_mat$indv)

v <- voom(dge, mm, block = annotation_mat$indv, correlation = corfit$consensus)

fit <- lmFit(v, mm, block = annotation_mat$indv, correlation = corfit$consensus)


cm <- makeContrasts(
  DNR_3.VEH_3 = DNR_3-VEH_3,
  DOX_3.VEH_3 = DOX_3-VEH_3,
  EPI_3.VEH_3 = EPI_3-VEH_3,
  MTX_3.VEH_3 = MTX_3-VEH_3,
  TRZ_3.VEH_3 = TRZ_3-VEH_3,
  DNR_24.VEH_24 =DNR_24-VEH_24,
  DOX_24.VEH_24= DOX_24-VEH_24,
  EPI_24.VEH_24= EPI_24-VEH_24,
  MTX_24.VEH_24= MTX_24-VEH_24,
  TRZ_24.VEH_24= TRZ_24-VEH_24,
  levels = mm)


fit2<- contrasts.fit(fit, contrasts=cm)

efit2 <- eBayes(fit2)

results = decideTests(efit2)

summary(results)
DNR_3.VEH_3 DOX_3.VEH_3 EPI_3.VEH_3 MTX_3.VEH_3 TRZ_3.VEH_3
Down 10868 2244 7162 444 1
NotSig 132819 152084 141323 154753 155556
Up 11870 1229 7072 360 0
DNR_24.VEH_24 DOX_24.VEH_24 EPI_24.VEH_24 MTX_24.VEH_24 TRZ_24.VEH_24
Down 39400 32313 32932 14182 0
NotSig 75562 90737 89056 131307 155557
Up 40595 32507 33569 10068 0plotSA(efit2, main="Mean-Variance trend for final model")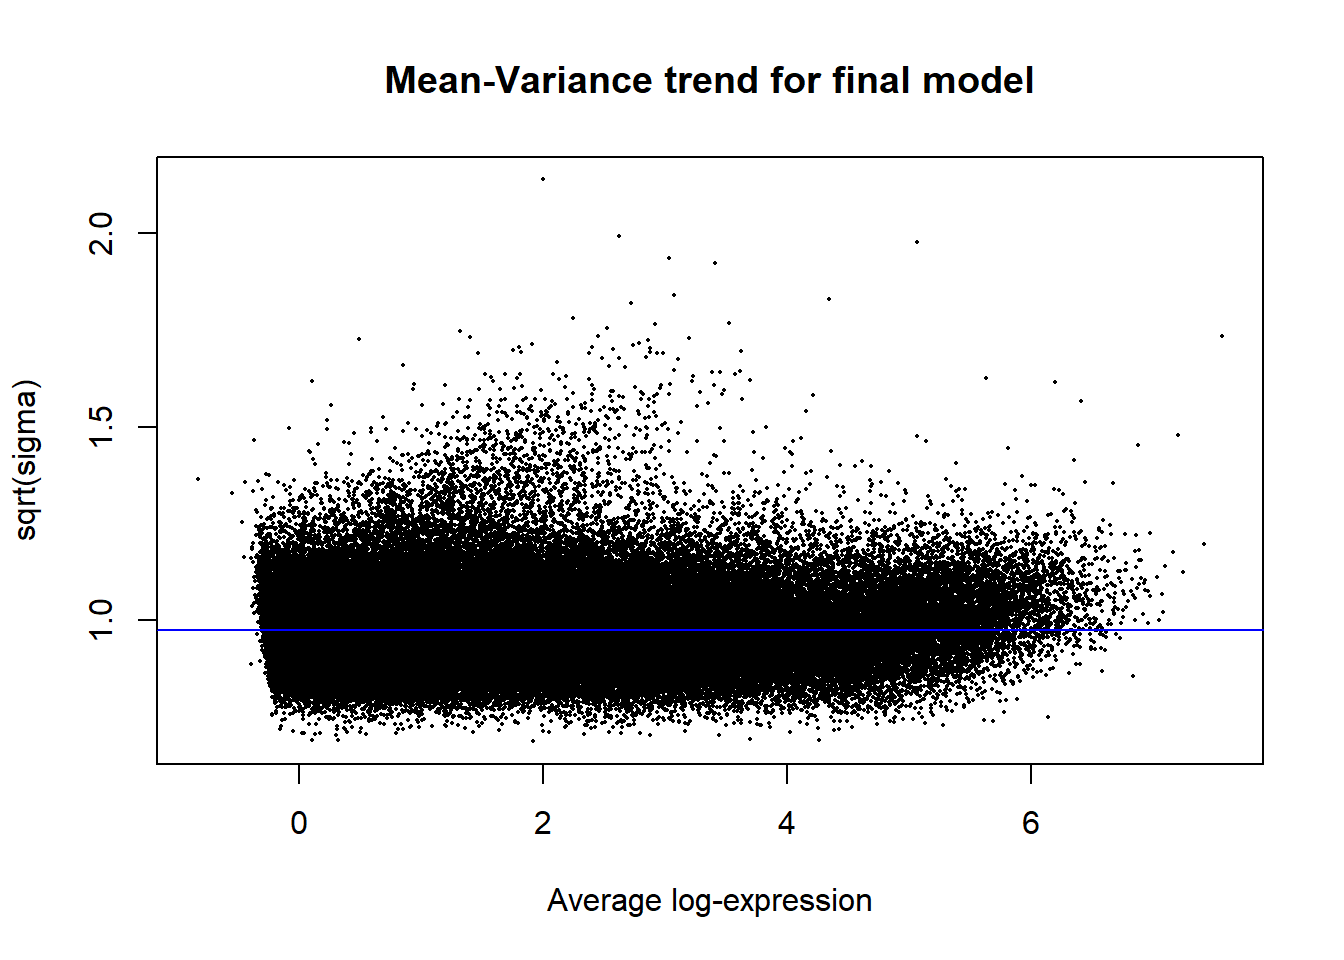
V.DNR_3.top= topTable(efit2, coef=1, adjust.method="BH", number=Inf, sort.by="p")
V.DOX_3.top= topTable(efit2, coef=2, adjust.method="BH", number=Inf, sort.by="p")
V.EPI_3.top= topTable(efit2, coef=3, adjust.method="BH", number=Inf, sort.by="p")
V.MTX_3.top= topTable(efit2, coef=4, adjust.method="BH", number=Inf, sort.by="p")
V.TRZ_3.top= topTable(efit2, coef=5, adjust.method="BH", number=Inf, sort.by="p")
V.DNR_24.top= topTable(efit2, coef=6, adjust.method="BH", number=Inf, sort.by="p")
V.DOX_24.top= topTable(efit2, coef=7, adjust.method="BH", number=Inf, sort.by="p")
V.EPI_24.top= topTable(efit2, coef=8, adjust.method="BH", number=Inf, sort.by="p")
V.MTX_24.top= topTable(efit2, coef=9, adjust.method="BH", number=Inf, sort.by="p")
V.TRZ_24.top= topTable(efit2, coef=10, adjust.method="BH", number=Inf, sort.by="p")


# plot_filenames <- c("V.DNR_3.top","V.DOX_3.top","V.EPI_3.top","V.MTX_3.top",
#                     "V.TRZ_.top","V.DNR_24.top","V.DOX_24.top","V.EPI_24.top",
#                     "V.MTX_24.top","V.TRZ_24.top")
# plot_files <- c( V.DNR_3.top,V.DOX_3.top,V.EPI_3.top,V.MTX_3.top,
#                     V.TRZ_3.top,V.DNR_24.top,V.DOX_24.top,V.EPI_24.top,
#                     V.MTX_24.top,V.TRZ_24.top)

save_list <- list("DNR_3"=V.DNR_3.top,"DOX_3"=V.DOX_3.top,"EPI_3"=V.EPI_3.top,"MTX_3"=V.MTX_3.top,"TRZ_3"=V.TRZ_3.top,"DNR_24"=V.DNR_24.top,"DOX_24"=V.DOX_24.top,"EPI_24"=V.EPI_24.top,"MTX_24"= V.MTX_24.top, "TRZ_24"=V.TRZ_24.top)

saveRDS(save_list,"data/Final_four_data/re_analysis/Toptable_results.RDS")
volcanosig <- function(df, psig.lvl) {
df <- df %>%
mutate(threshold = ifelse(adj.P.Val > psig.lvl, "A", ifelse(adj.P.Val <= psig.lvl & logFC<=0,"B","C")))
# ifelse(adj.P.Val <= psig.lvl & logFC >= 0,"B", "C")))
##This is where I could add labels, but I have taken out
# df <- df %>% mutate(genelabels = "")
# df$genelabels[1:topg] <- df$rownames[1:topg]
ggplot(df, aes(x=logFC, y=-log10(P.Value))) +
geom_point(aes(color=threshold))+
# geom_text_repel(aes(label = genelabels), segment.curvature = -1e-20,force = 1,size=2.5,
# arrow = arrow(length = unit(0.015, "npc")), max.overlaps = Inf) +
#geom_hline(yintercept = -log10(psig.lvl))+
xlab(expression("Log"[2]*" FC"))+
ylab(expression("-log"[10]*"P Value"))+
scale_color_manual(values = c("black", "red","blue"))+
theme_cowplot()+
ylim(0,20)+
xlim(-6,6)+
theme(legend.position = "none",
plot.title = element_text(size = rel(1.5), hjust = 0.5),
axis.title = element_text(size = rel(0.8)))
}
v1 <- volcanosig(V.DNR_3.top, 0.01)+ ggtitle("DNR 3 hour")
v2 <- volcanosig(V.DNR_24.top, 0.01)+ ggtitle("DNR 24 hour")+ylab("")
v3 <- volcanosig(V.DOX_3.top, 0.01)+ ggtitle("DOX 3 hour")
v4 <- volcanosig(V.DOX_24.top, 0.01)+ ggtitle("DOX 24 hour")+ylab("")
v5 <- volcanosig(V.EPI_3.top, 0.01)+ ggtitle("EPI 3 hour")
v6 <- volcanosig(V.EPI_24.top, 0.01)+ ggtitle("EPI 24 hour")+ylab("")
v7 <- volcanosig(V.MTX_3.top, 0.01)+ ggtitle("MTX 3 hour")
v8 <- volcanosig(V.MTX_24.top, 0.01)+ ggtitle("MTX 24 hour")+ylab("")
v9 <- volcanosig(V.TRZ_3.top, 0.01)+ ggtitle("TRZ 3 hour")
v10 <- volcanosig(V.TRZ_24.top, 0.01)+ ggtitle("TRZ 24 hour")+ylab("")
plot_grid(v1,v2, rel_widths =c(.9,1))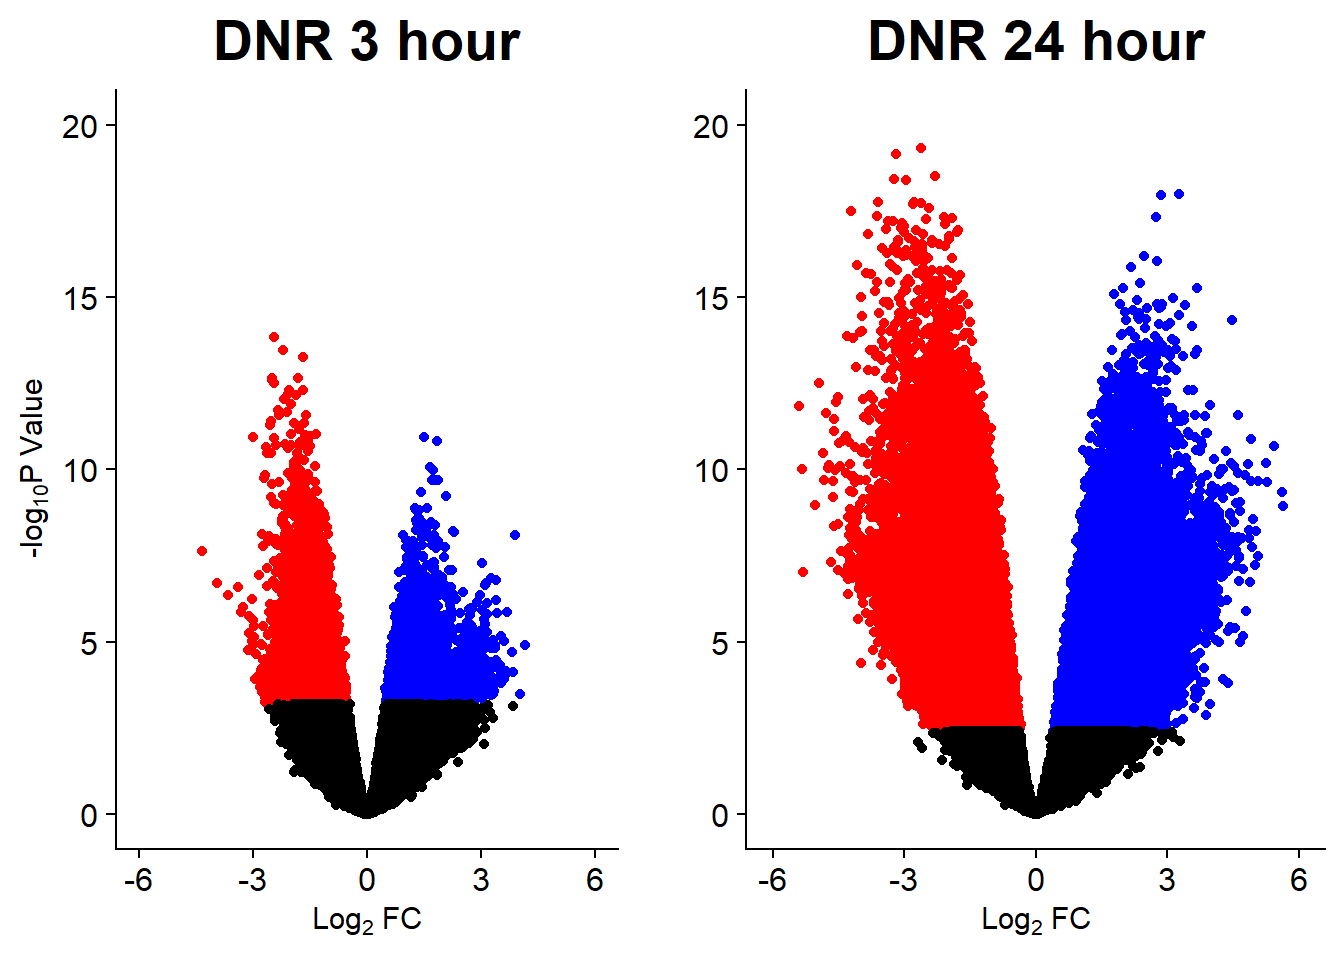
plot_grid(v3,v4, rel_widths =c(.9,1))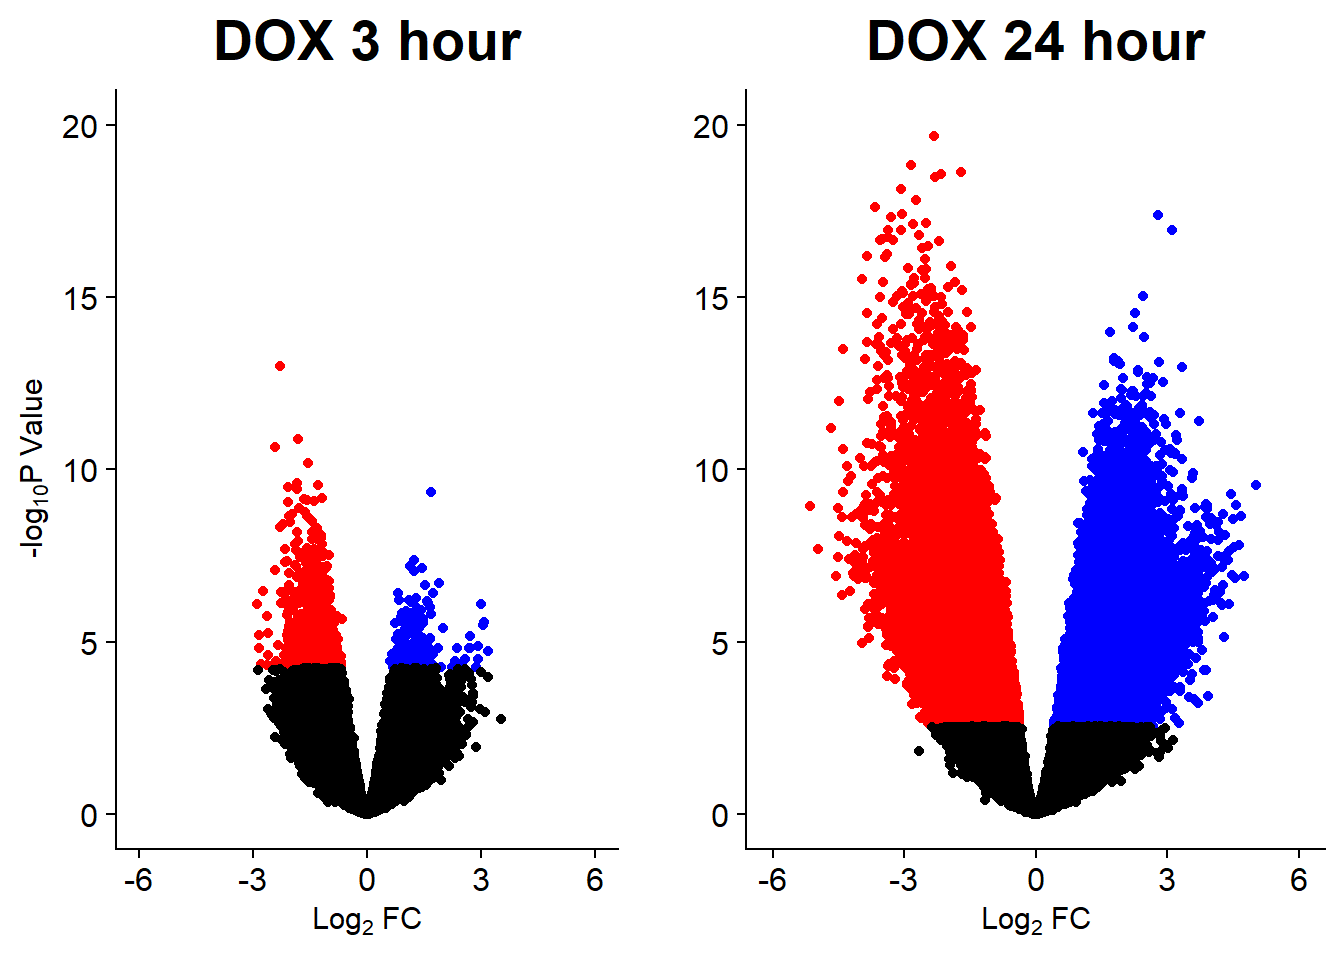
plot_grid(v5,v6, rel_widths =c(.9,1))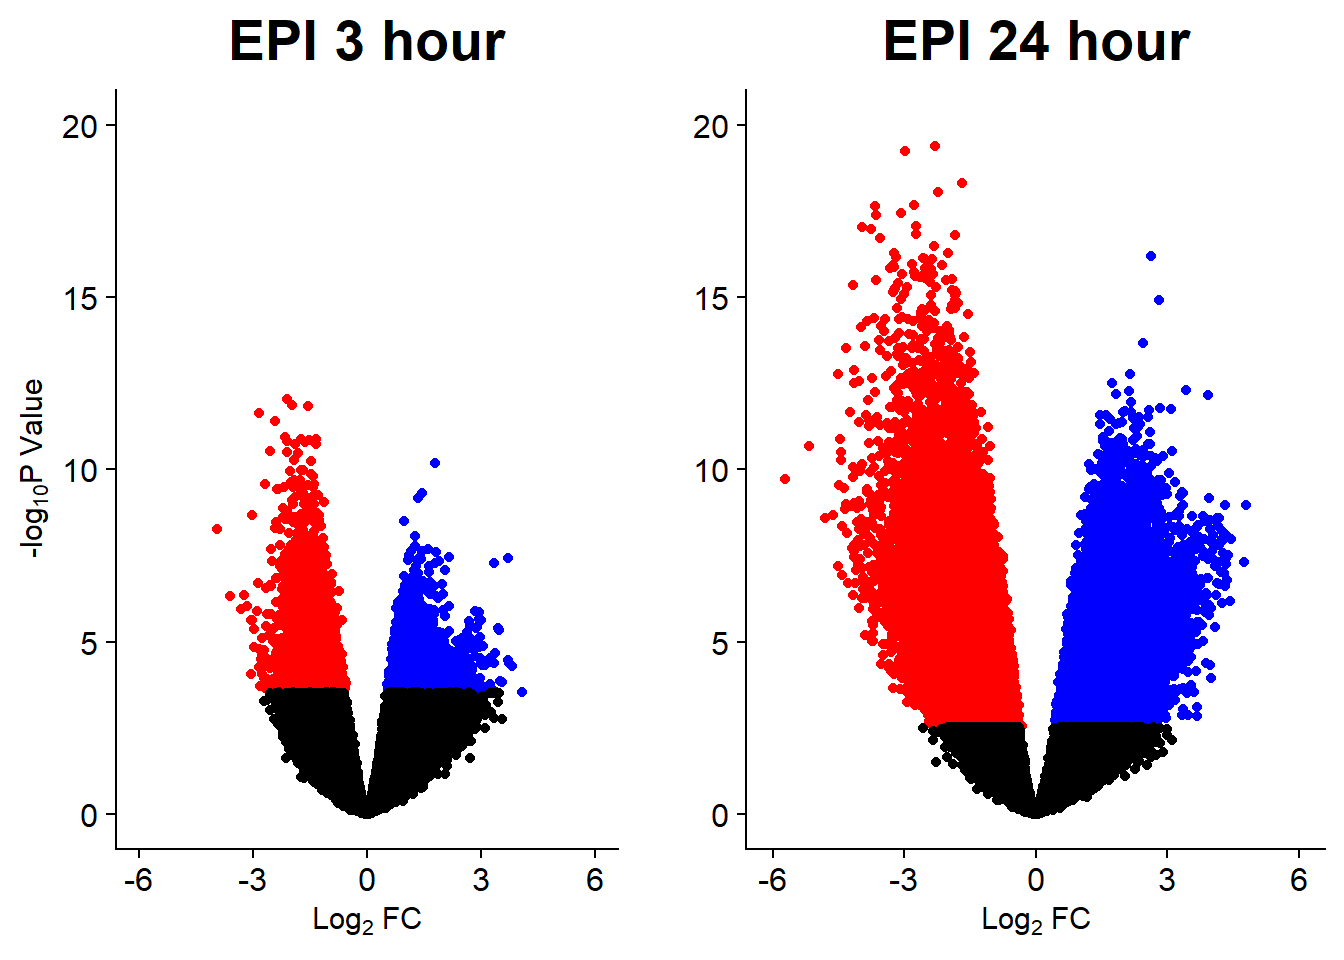
plot_grid(v7,v8, rel_widths =c(.9,1))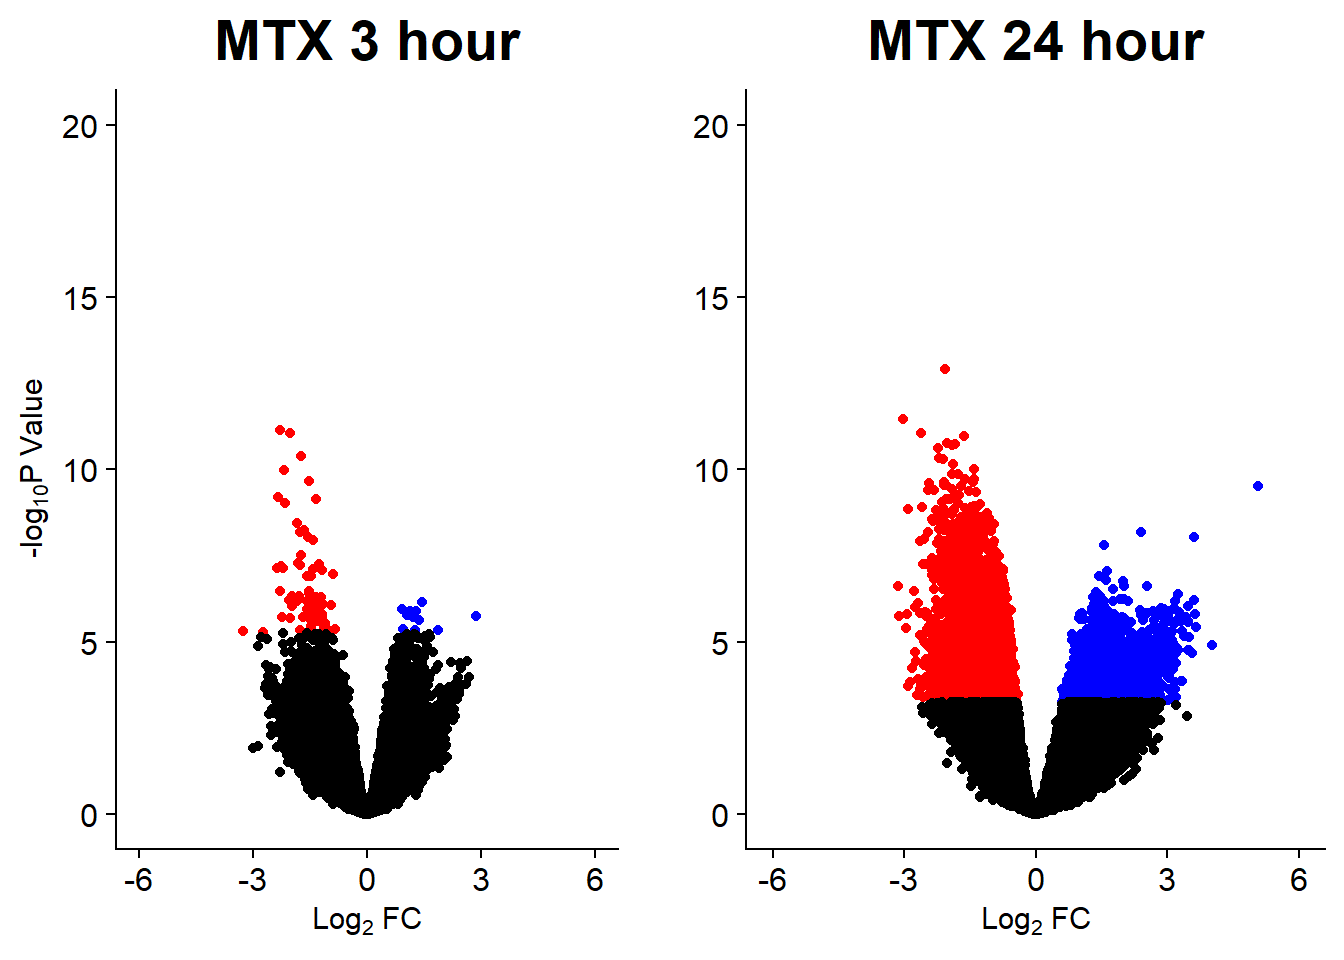
plot_grid(v9,v10, rel_widths =c(.9,1))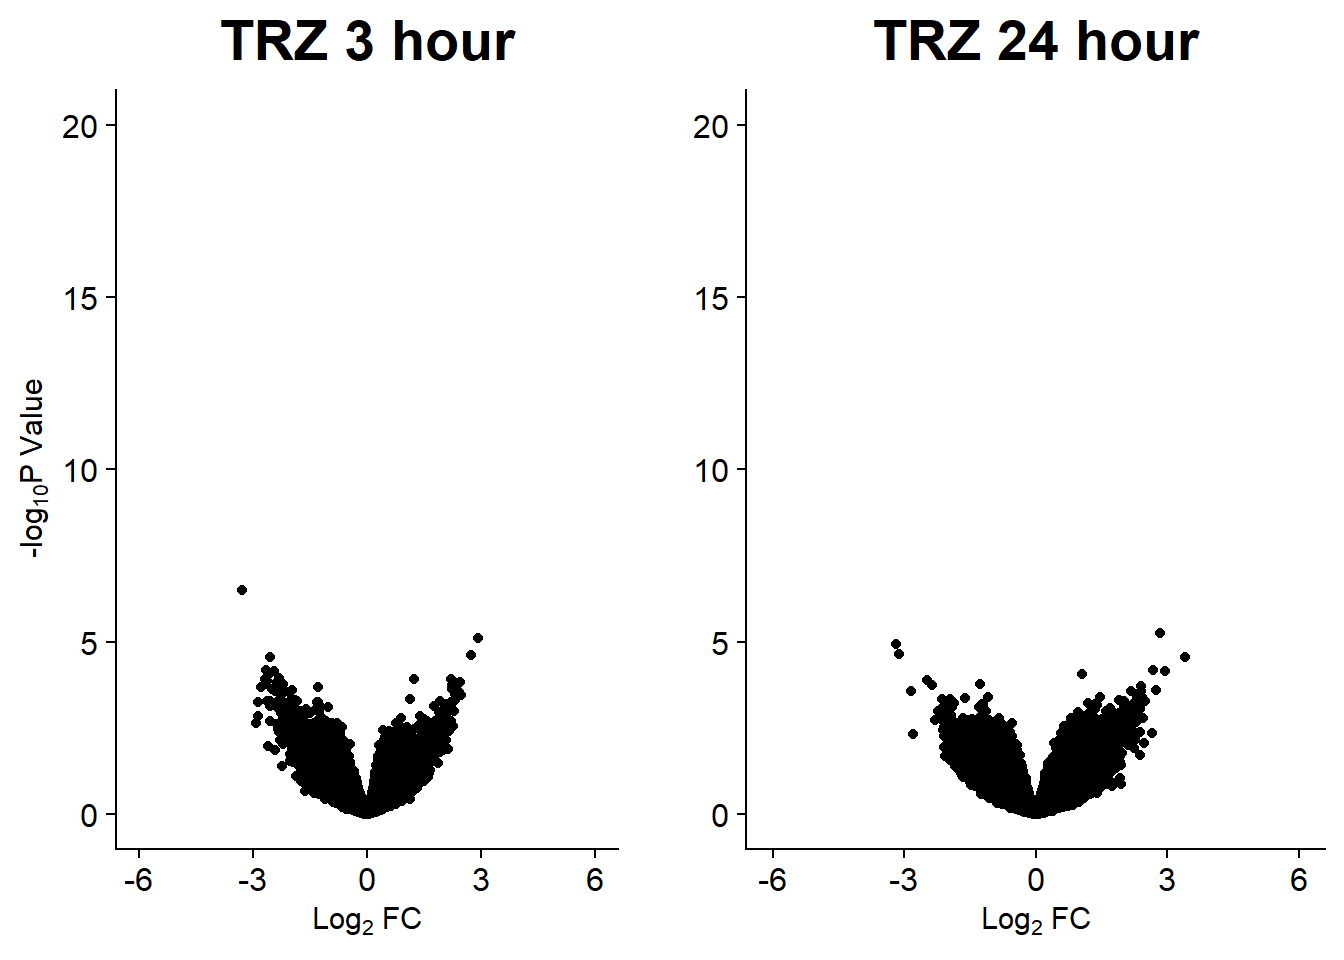
Making the median dataframes by time. The files were saved as .csv for future use.
all_results <- bind_rows(save_list, .id = "group")

median_df <- all_results %>%
  separate(group, into=c("trt","time"),sep = "_") %>%
  pivot_wider(., id_cols=c(time,genes), names_from = trt, values_from = logFC) %>%
  rowwise() %>%
  mutate(median_ATAC_lfc= median(c_across(DNR:TRZ)))

median_3_lfc <-   median_df %>%
    dplyr::filter(time == "3") %>%
  ungroup() %>%
  dplyr::select(time, genes,median_ATAC_lfc) %>%
  dplyr::rename("med_3h_lfc"=median_ATAC_lfc, "peak"=genes)


median_24_lfc <- median_df %>%
    dplyr::filter(time == "24") %>%
  ungroup() %>%
  dplyr::select(time, genes,median_ATAC_lfc) %>%
  dplyr::rename("med_24h_lfc"=median_ATAC_lfc,, "peak"=genes)

write_csv(median_3_lfc, "data/Final_four_data/re_analysis/median_3_lfc_norm.csv")
write_csv(median_24_lfc, "data/Final_four_data/re_analysis/median_24_lfc_norm.csv")
sessionInfo()R version 4.4.2 (2024-10-31 ucrt)
Platform: x86_64-w64-mingw32/x64
Running under: Windows 11 x64 (build 26100)
Matrix products: default
locale:
[1] LC_COLLATE=English_United States.utf8
[2] LC_CTYPE=English_United States.utf8
[3] LC_MONETARY=English_United States.utf8
[4] LC_NUMERIC=C
[5] LC_TIME=English_United States.utf8
time zone: America/Chicago
tzcode source: internal
attached base packages:
[1] grid stats4 stats graphics grDevices utils datasets
[8] methods base
other attached packages:
[1] data.table_1.17.0
[2] smplot2_0.2.5
[3] cowplot_1.1.3
[4] ComplexHeatmap_2.22.0
[5] ggrepel_0.9.6
[6] plyranges_1.26.0
[7] ggsignif_0.6.4
[8] eulerr_7.0.2
[9] devtools_2.4.5
[10] usethis_3.1.0
[11] ggpubr_0.6.0
[12] BiocParallel_1.40.0
[13] scales_1.3.0
[14] VennDiagram_1.7.3
[15] futile.logger_1.4.3
[16] gridExtra_2.3
[17] ggfortify_0.4.17
[18] edgeR_4.4.2
[19] limma_3.62.2
[20] rtracklayer_1.66.0
[21] org.Hs.eg.db_3.20.0
[22] TxDb.Hsapiens.UCSC.hg38.knownGene_3.20.0
[23] GenomicFeatures_1.58.0
[24] AnnotationDbi_1.68.0
[25] Biobase_2.66.0
[26] GenomicRanges_1.58.0
[27] GenomeInfoDb_1.42.3
[28] IRanges_2.40.1
[29] S4Vectors_0.44.0
[30] BiocGenerics_0.52.0
[31] ChIPseeker_1.42.1
[32] RColorBrewer_1.1-3
[33] broom_1.0.7
[34] kableExtra_1.4.0
[35] lubridate_1.9.4
[36] forcats_1.0.0
[37] stringr_1.5.1
[38] dplyr_1.1.4
[39] purrr_1.0.4
[40] readr_2.1.5
[41] tidyr_1.3.1
[42] tibble_3.2.1
[43] ggplot2_3.5.1
[44] tidyverse_2.0.0
[45] workflowr_1.7.1
loaded via a namespace (and not attached):
[1] fs_1.6.5
[2] matrixStats_1.5.0
[3] bitops_1.0-9
[4] enrichplot_1.26.6
[5] httr_1.4.7
[6] doParallel_1.0.17
[7] profvis_0.4.0
[8] tools_4.4.2
[9] backports_1.5.0
[10] R6_2.6.1
[11] lazyeval_0.2.2
[12] GetoptLong_1.0.5
[13] urlchecker_1.0.1
[14] withr_3.0.2
[15] cli_3.6.4
[16] formatR_1.14
[17] labeling_0.4.3
[18] sass_0.4.9
[19] Rsamtools_2.22.0
[20] systemfonts_1.2.1
[21] yulab.utils_0.2.0
[22] foreign_0.8-88
[23] DOSE_4.0.0
[24] svglite_2.1.3
[25] R.utils_2.13.0
[26] sessioninfo_1.2.3
[27] plotrix_3.8-4
[28] pwr_1.3-0
[29] rstudioapi_0.17.1
[30] RSQLite_2.3.9
[31] shape_1.4.6.1
[32] generics_0.1.3
[33] gridGraphics_0.5-1
[34] TxDb.Hsapiens.UCSC.hg19.knownGene_3.2.2
[35] BiocIO_1.16.0
[36] vroom_1.6.5
[37] gtools_3.9.5
[38] car_3.1-3
[39] GO.db_3.20.0
[40] Matrix_1.7-3
[41] abind_1.4-8
[42] R.methodsS3_1.8.2
[43] lifecycle_1.0.4
[44] whisker_0.4.1
[45] yaml_2.3.10
[46] carData_3.0-5
[47] SummarizedExperiment_1.36.0
[48] gplots_3.2.0
[49] qvalue_2.38.0
[50] SparseArray_1.6.2
[51] blob_1.2.4
[52] promises_1.3.2
[53] crayon_1.5.3
[54] miniUI_0.1.1.1
[55] ggtangle_0.0.6
[56] lattice_0.22-6
[57] KEGGREST_1.46.0
[58] pillar_1.10.1
[59] knitr_1.49
[60] fgsea_1.32.2
[61] rjson_0.2.23
[62] boot_1.3-31
[63] codetools_0.2-20
[64] fastmatch_1.1-6
[65] glue_1.8.0
[66] getPass_0.2-4
[67] ggfun_0.1.8
[68] remotes_2.5.0
[69] vctrs_0.6.5
[70] png_0.1-8
[71] treeio_1.30.0
[72] gtable_0.3.6
[73] cachem_1.1.0
[74] xfun_0.51
[75] S4Arrays_1.6.0
[76] mime_0.12
[77] iterators_1.0.14
[78] statmod_1.5.0
[79] ellipsis_0.3.2
[80] nlme_3.1-167
[81] ggtree_3.14.0
[82] bit64_4.6.0-1
[83] rprojroot_2.0.4
[84] bslib_0.9.0
[85] rpart_4.1.24
[86] KernSmooth_2.23-26
[87] Hmisc_5.2-2
[88] colorspace_2.1-1
[89] DBI_1.2.3
[90] nnet_7.3-20
[91] tidyselect_1.2.1
[92] processx_3.8.6
[93] bit_4.6.0
[94] compiler_4.4.2
[95] curl_6.2.1
[96] git2r_0.35.0
[97] htmlTable_2.4.3
[98] xml2_1.3.7
[99] DelayedArray_0.32.0
[100] checkmate_2.3.2
[101] caTools_1.18.3
[102] callr_3.7.6
[103] digest_0.6.37
[104] rmarkdown_2.29
[105] XVector_0.46.0
[106] base64enc_0.1-3
[107] htmltools_0.5.8.1
[108] pkgconfig_2.0.3
[109] MatrixGenerics_1.18.1
[110] fastmap_1.2.0
[111] GlobalOptions_0.1.2
[112] rlang_1.1.5
[113] htmlwidgets_1.6.4
[114] UCSC.utils_1.2.0
[115] shiny_1.10.0
[116] farver_2.1.2
[117] jquerylib_0.1.4
[118] zoo_1.8-13
[119] jsonlite_1.9.1
[120] GOSemSim_2.32.0
[121] R.oo_1.27.0
[122] RCurl_1.98-1.16
[123] magrittr_2.0.3
[124] Formula_1.2-5
[125] GenomeInfoDbData_1.2.13
[126] ggplotify_0.1.2
[127] patchwork_1.3.0
[128] munsell_0.5.1
[129] Rcpp_1.0.14
[130] ape_5.8-1
[131] stringi_1.8.4
[132] zlibbioc_1.52.0
[133] plyr_1.8.9
[134] pkgbuild_1.4.6
[135] parallel_4.4.2
[136] Biostrings_2.74.1
[137] splines_4.4.2
[138] circlize_0.4.16
[139] hms_1.1.3
[140] locfit_1.5-9.12
[141] ps_1.9.0
[142] igraph_2.1.4
[143] reshape2_1.4.4
[144] pkgload_1.4.0
[145] futile.options_1.0.1
[146] XML_3.99-0.18
[147] evaluate_1.0.3
[148] lambda.r_1.2.4
[149] tzdb_0.4.0
[150] foreach_1.5.2
[151] httpuv_1.6.15
[152] clue_0.3-66
[153] xtable_1.8-4
[154] restfulr_0.0.15
[155] tidytree_0.4.6
[156] rstatix_0.7.2
[157] later_1.4.1
[158] viridisLite_0.4.2
[159] aplot_0.2.5
[160] memoise_2.0.1
[161] GenomicAlignments_1.42.0
[162] cluster_2.1.8.1
[163] timechange_0.3.0