Fit Statistic Boxplots
2019-05-08
Last updated: 2019-10-18
Checks: 6 1
Knit directory: mcfa-fit/
This reproducible R Markdown analysis was created with workflowr (version 1.4.0). The Checks tab describes the reproducibility checks that were applied when the results were created. The Past versions tab lists the development history.
The R Markdown file has unstaged changes. To know which version of the R Markdown file created these results, you’ll want to first commit it to the Git repo. If you’re still working on the analysis, you can ignore this warning. When you’re finished, you can run wflow_publish to commit the R Markdown file and build the HTML.
Great job! The global environment was empty. Objects defined in the global environment can affect the analysis in your R Markdown file in unknown ways. For reproduciblity it’s best to always run the code in an empty environment.
The command set.seed(20190507) was run prior to running the code in the R Markdown file. Setting a seed ensures that any results that rely on randomness, e.g. subsampling or permutations, are reproducible.
Great job! Recording the operating system, R version, and package versions is critical for reproducibility.
Nice! There were no cached chunks for this analysis, so you can be confident that you successfully produced the results during this run.
Great job! Using relative paths to the files within your workflowr project makes it easier to run your code on other machines.
Great! You are using Git for version control. Tracking code development and connecting the code version to the results is critical for reproducibility. The version displayed above was the version of the Git repository at the time these results were generated.
Note that you need to be careful to ensure that all relevant files for the analysis have been committed to Git prior to generating the results (you can use wflow_publish or wflow_git_commit). workflowr only checks the R Markdown file, but you know if there are other scripts or data files that it depends on. Below is the status of the Git repository when the results were generated:
Ignored files:
    Ignored:    .RData
    Ignored:    .RDataTmp
    Ignored:    .Rhistory
    Ignored:    .Rproj.user/

Untracked files:
    Untracked:  analysis/est_ulsmv.Rmd
    Untracked:  analysis/est_wlsmv.Rmd

Unstaged changes:
    Modified:   analysis/est_mlr.Rmd
    Modified:   analysis/fit_boxplots.Rmd
    Modified:   analysis/index.Rmd
    Modified:   analysis/index_cfi.Rmd
    Modified:   analysis/index_rmsea.Rmd
    Modified:   analysis/index_srmr.Rmd
    Modified:   analysis/index_tli.Rmd
    Modified:   analysis/roc_analyses.Rmd
Note that any generated files, e.g. HTML, png, CSS, etc., are not included in this status report because it is ok for generated content to have uncommitted changes.
These are the previous versions of the R Markdown and HTML files. If you’ve configured a remote Git repository (see ?wflow_git_remote), click on the hyperlinks in the table below to view them.
| File | Version | Author | Date | Message |
|---|---|---|---|---|
| html | 982c8f1 | noah-padgett | 2019-05-18 | roc analyses completed |
| html | a1b0dc1 | noah-padgett | 2019-05-08 | Build site. |
| Rmd | b794176 | noah-padgett | 2019-05-08 | updated tables and figures |
Purpose of this file:
- Create simple boxplots for trends
- Creating publication boxplots
Packages and Set-Up
##Chunk iptions
knitr::opts_chunk$set(out.width = "225%")

## Packages
## General Packages
library(tidyverse)
-- Attaching packages -------------------------------------- tidyverse 1.2.1 --v ggplot2 3.2.0 v purrr 0.3.2
v tibble 2.1.1 v dplyr 0.8.1
v tidyr 0.8.3 v stringr 1.4.0
v readr 1.3.1 v forcats 0.4.0-- Conflicts ----------------------------------------- tidyverse_conflicts() --
x dplyr::filter() masks stats::filter()
x dplyr::lag() masks stats::lag()# Formatting and Tables
library(kableExtra)
Attaching package: 'kableExtra'The following object is masked from 'package:dplyr':
group_rowslibrary(xtable)
# For plotting
library(ggplot2)
theme_set(theme_bw())
# Data manipulating
library(dplyr)
## One global parameter for printing figures
save.fig <- FData Management
sim_results <- as_tibble(read.table('data/compiled_fit_results.txt', header=T,sep='\t'))

## Next, turn condition into a factor for plotting
sim_results$Condition <- as.factor(sim_results$Condition)

## Next, since TLI is non-normed, any value greater than 1 needs to be rescaled to 1.
sim_results$TLI <- ifelse(sim_results$TLI > 1, 1, sim_results$TLI)
sim_results$TLI <- ifelse(sim_results$TLI < 0, 0, sim_results$TLI)
## Next, summarize the results of the chi-square test of model fit. This is done simply by comparing the p-value to alpha (0.05) and indicating whether the model was flagged as fitting or not.
# Note: if  p < 0.05 then this variable is flagged as 0, and 1 otherwise
sim_results$Chi2_pvalue_decision <- ifelse(sim_results$chisqu_pvalue < 0.05, 0, 1)
# 0 = rejected that these data fit this model
# 1 = failed to reject that these data fit this model
Adding Labels to Conditions
Currently, each condition is kind of like a hidden id that we don’t know what the actual factor is. So, first thing isto create meaningful labels for us to use. Remember, the 72 conditions for the this study were
- Level-1 sample size (5, 10, 30)
- Level-2 sample size (30, 50, 100, 200)
- Observed indicator ICC (.1, .3, .5)
- Latent variable ICC (.1, .5)
## level-1 Sample size
ss_l1 <- c(5, 10, 30) ## 6 conditions each
ss_l2 <- c(30, 50, 100, 200) ## 18 condition each
icc_ov <- c(.1, .3, .5) ## 2 conditions each
icc_lv <- c(.1, .5) ## every other condition
nCon <- 72 # number of conditions
nRep <- 500 # number of replications per condition
nMod <- 12 ## numberof estimated models per conditions
## Total number of rows: 432,000
ss_l2 <- c(rep(ss_l2[1], 18*nRep*nMod), rep(ss_l2[2], 18*nRep*nMod),
           rep(ss_l2[3], 18*nRep*nMod), rep(ss_l2[4], 18*nRep*nMod))
ss_l1 <- rep(c(rep(ss_l1[1],6*nRep*nMod), rep(ss_l1[2],6*nRep*nMod), rep(ss_l1[3],6*nRep*nMod)), 4)
icc_ov <- rep(c(rep(icc_ov[1], 2*nRep*nMod), rep(icc_ov[2], 2*nRep*nMod), rep(icc_ov[3], 2*nRep*nMod)), 12)
icc_lv <- rep(c(rep(icc_lv[1], nRep*nMod), rep(icc_lv[2], nRep*nMod)), 36)
## Force these vectors to be column vectors
ss_l1 <- matrix(ss_l1, ncol=1)
ss_l2 <- matrix(ss_l2, ncol=1)
icc_ov <- matrix(icc_ov, ncol=1)
icc_lv <- matrix(icc_lv, ncol=1)
## Add the labels to the results data frame
sim_results <- sim_results[order(sim_results$Condition),]
sim_results <- cbind(sim_results, ss_l1, ss_l2, icc_ov, icc_lv)

## Force the conditions to be factors
sim_results$ss_l1 <- as.factor(sim_results$ss_l1)
sim_results$ss_l2 <- as.factor(sim_results$ss_l2)
sim_results$icc_ov <- as.factor(sim_results$icc_ov)
sim_results$icc_lv <- as.factor(sim_results$icc_lv)
sim_results$Model <- factor(sim_results$Model, levels = c('C','M1','M2','M12'), ordered = T)
## Set up iterators for remainder of script
mods <- c('C', 'M1', 'M2', 'M12')
ests <- c('MLR', 'ULSMV', 'WLSMV')
Boxplots
One of the best ways to visualize the results of the distribution of fit statistics across conditions is to use boxplots. In the section, we created three sets of boxplots. First, the boxplots are large and give a very course overview of the results across conditions, but can be difficult to make sense of because of how large they are. Secondly, the boxplots are made with facets by model and estimator from the larger set of data so that more concise plots can be made for easier viewing. Third, subsets based on Model and estimator are made to create a “smaller” plot that is easier to handle. Most of these latter plots are included in my thesis document.
For all graphs, we haved placed a dashed line where the commonly used cut-off for these fit statistics lies.
Hu and Bentler (1999) commonly reported cut-off criteria:
- CFI > .95
- TLI > .95
- RMSEA < .06
- SRMR < .08
- Note: For SRMR, there are two versions SRMR-Within and SRMR-Between. The same commonly use cut-off is applied but is likely inappropriate for both.
First, filter the results to the converged and admissible replications/
mydata <- filter(sim_results, Converge == 1 & Admissible == 1)Large General Boxplots
For these larger Boxplots, there are two sets.
Coarse distributions of each fit statistic
Marginal Plots of Condition (ss_l1, ss_l2, icc_ov, icc_lv)
For outliers, we used alpha shading to limit the opacity. This was done to help show the relative differences in density of outliers across different conditions. This was recommended by Dr. Mandy Herring from the Baylor University Statistics Department during Noah Padgett’s thesis defense. We set the alpha shading to 0.10 (i.e., 10% opacity).
Coarse Boxplots
## Set 1 Coarse distributions of each fit statistic
p <- ggplot(mydata, aes(x=Condition, y=CFI))+
    geom_boxplot(outlier.alpha = .1)+
    geom_abline(intercept = .95, slope=0,
                linetype='dashed', color = 'red')
p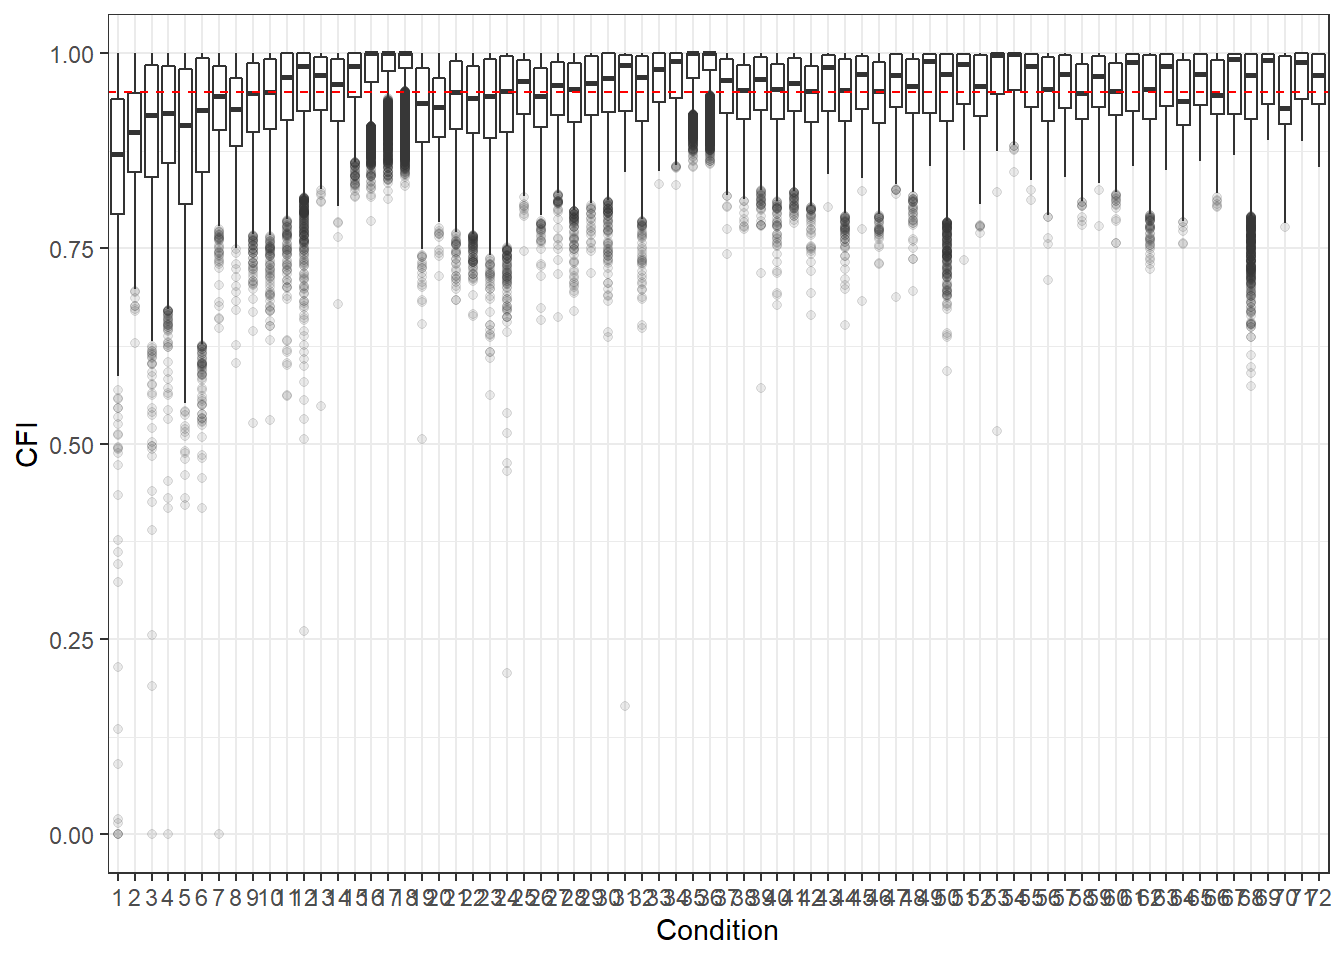
| Version | Author | Date |
|---|---|---|
| a1b0dc1 | noah-padgett | 2019-05-08 |
if(save.fig == T) ggsave("cfi_all_conditions.pdf",plot = p, width=12, height=6, units='in')

p <- ggplot(mydata, aes(x=Condition, y=TLI))+
    geom_boxplot(outlier.alpha = .1)+
    geom_abline(intercept = .95, slope=0,
                linetype='dashed', color = 'red')
p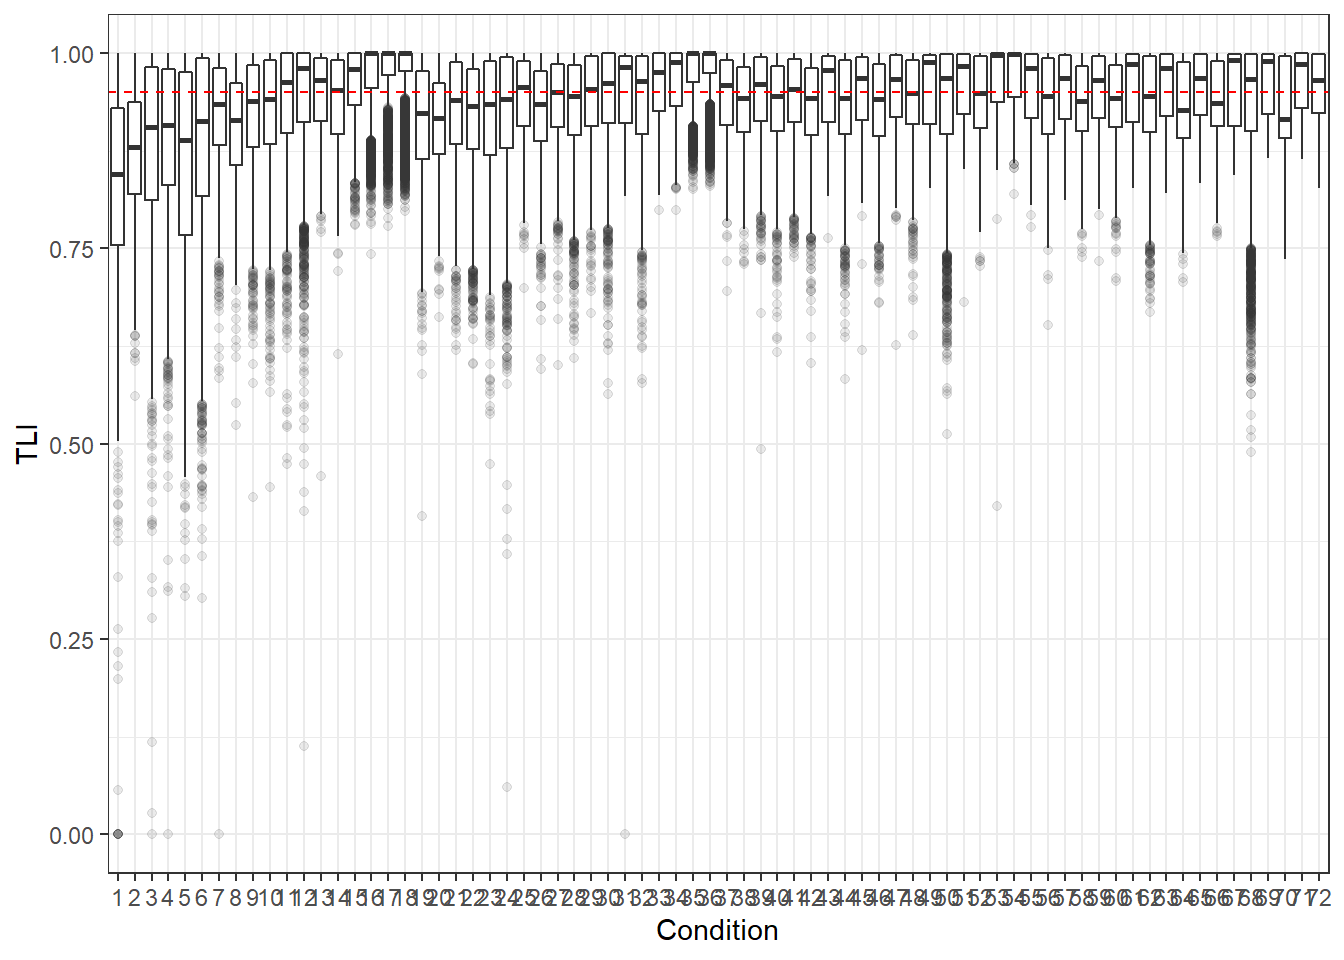
| Version | Author | Date |
|---|---|---|
| a1b0dc1 | noah-padgett | 2019-05-08 |
if(save.fig == T) ggsave("tli_all_conditions.pdf",plot = p, width=12, height=6, units='in')

p <- ggplot(mydata, aes(x=Condition, y=RMSEA))+
    geom_boxplot(outlier.alpha = .1)+
    geom_abline(intercept = .06, slope=0,
                linetype='dashed', color = 'red')
p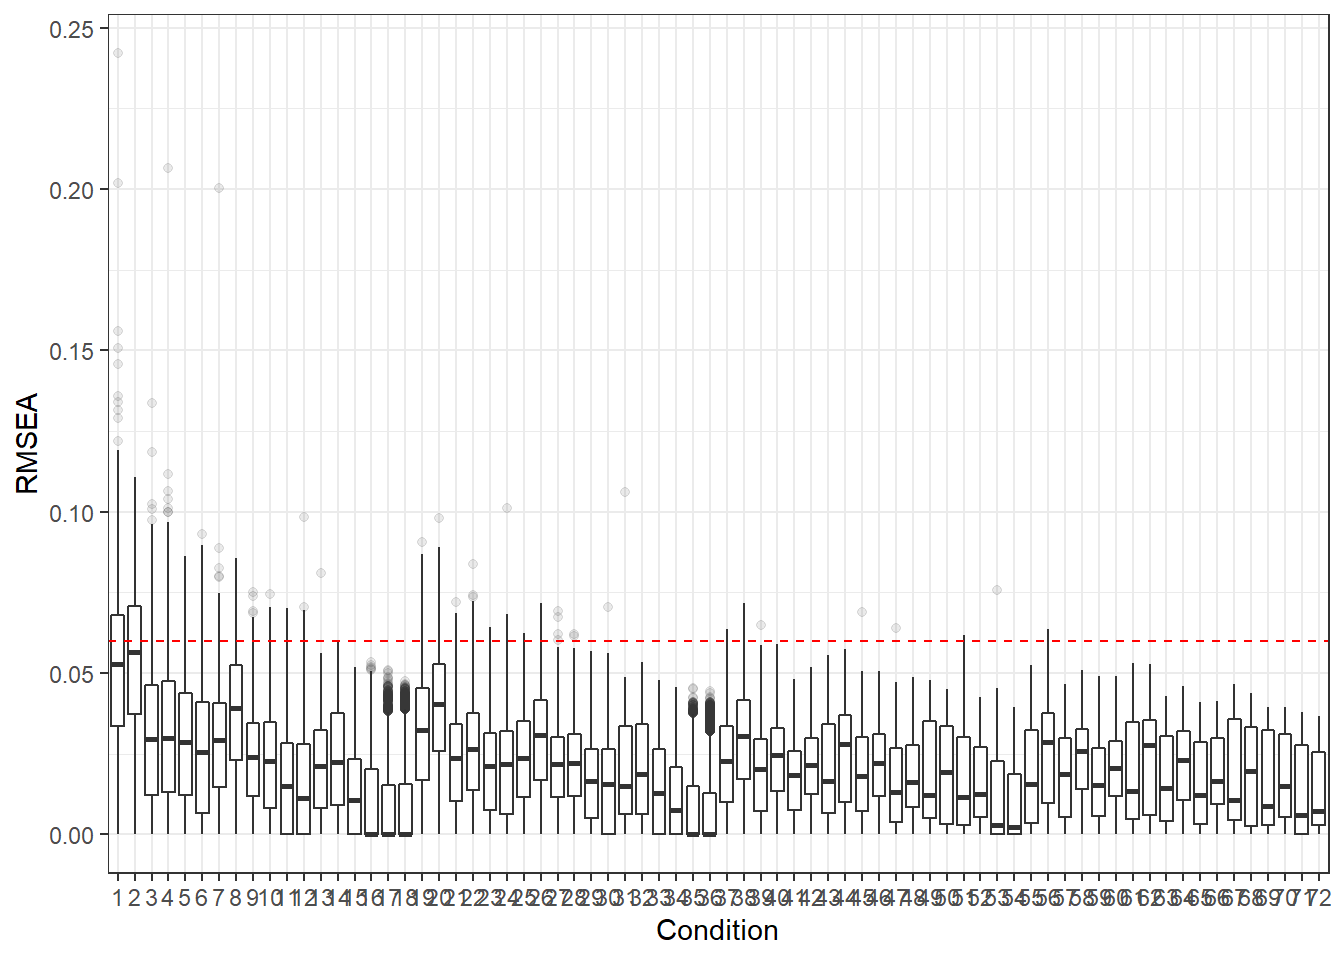
| Version | Author | Date |
|---|---|---|
| a1b0dc1 | noah-padgett | 2019-05-08 |
if(save.fig == T) ggsave("rmsea_all_conditions.pdf",plot = p, width=12, height=6, units='in')

p <- ggplot(mydata, aes(x=Condition, y=SRMRW))+
    geom_boxplot(outlier.alpha = .1)+
    geom_abline(intercept = .08, slope=0,
                linetype='dashed', color = 'red')
p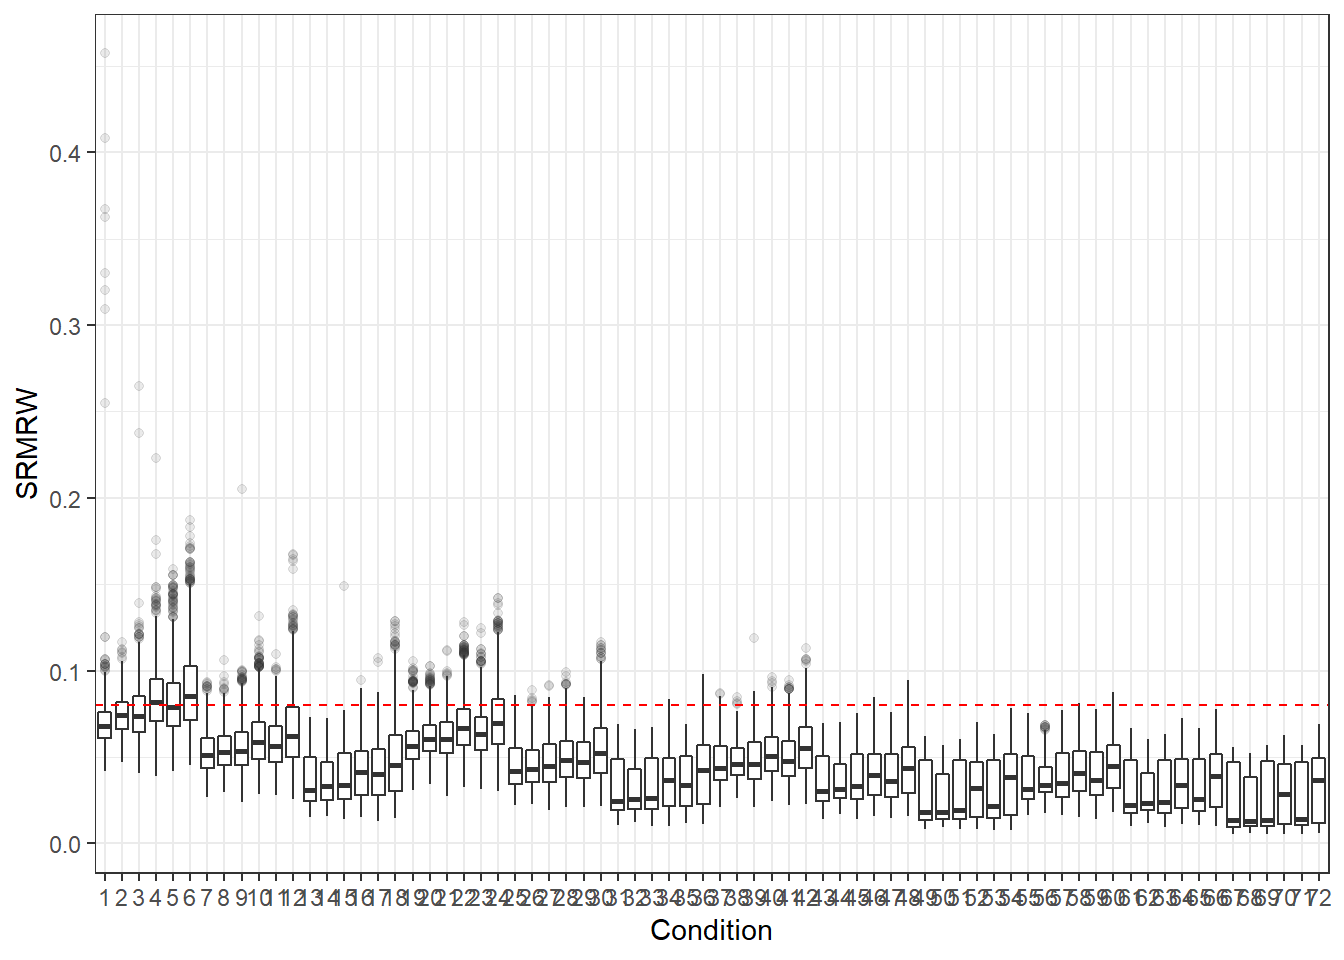
| Version | Author | Date |
|---|---|---|
| a1b0dc1 | noah-padgett | 2019-05-08 |
if(save.fig == T) ggsave("srmrw_all_conditions.pdf",plot = p, width=12, height=6, units='in')

p <- ggplot(mydata, aes(x=Condition, y=SRMRB))+
    geom_boxplot(outlier.alpha = .1)+
    geom_abline(intercept = .08, slope=0,
                linetype='dashed', color = 'red')+
    lims(y=c(0,1))
p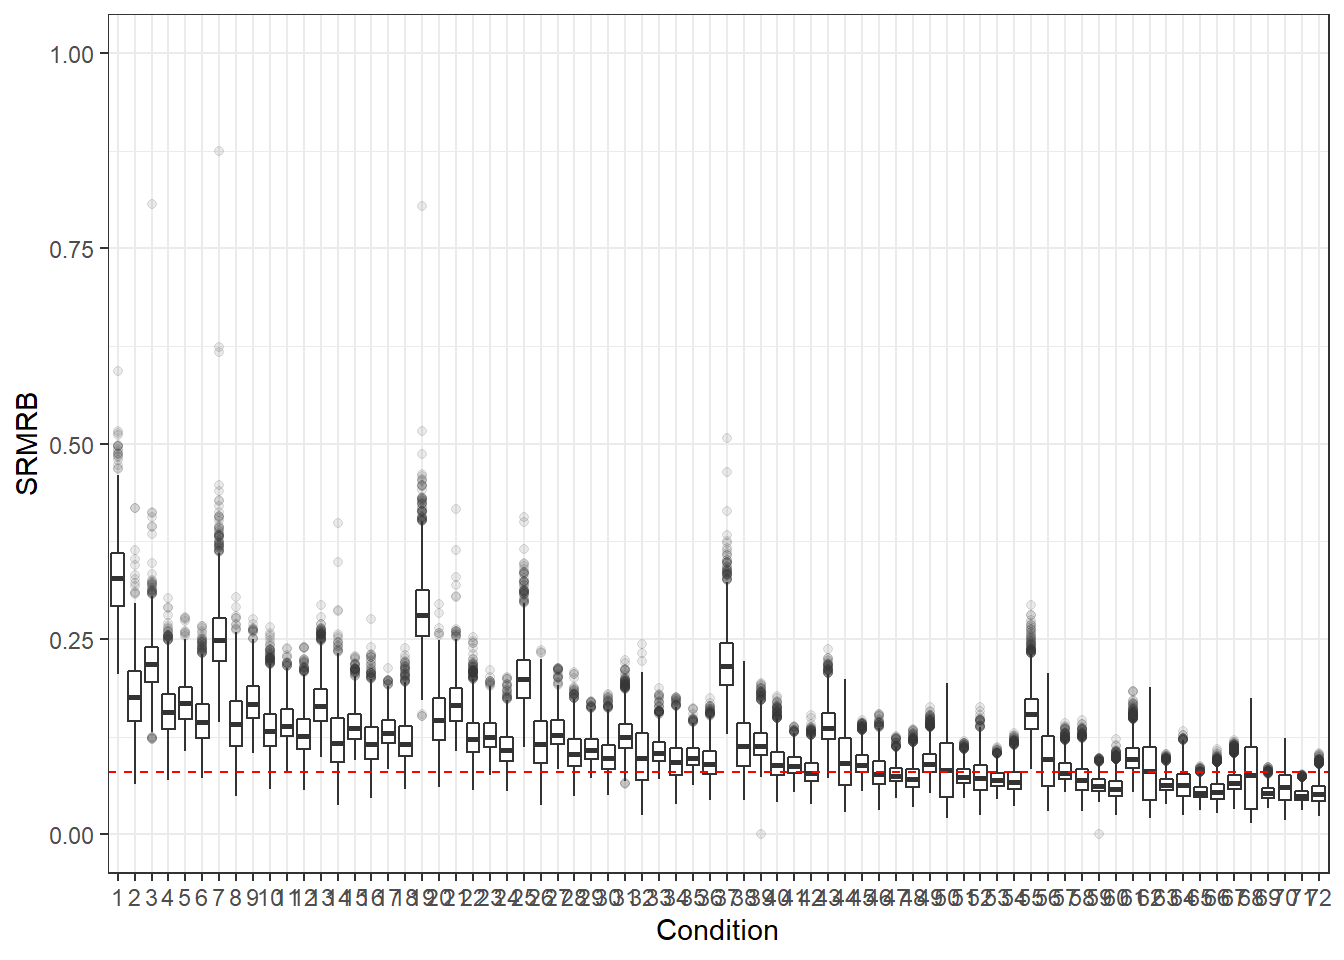
| Version | Author | Date |
|---|---|---|
| a1b0dc1 | noah-padgett | 2019-05-08 |
if(save.fig == T) ggsave("srmrb_all_conditions.pdf",plot = p, width=12, height=6, units='in')

## SRMRB without range restriction
p <- ggplot(mydata, aes(x=Condition, y=SRMRB))+
    geom_boxplot(outlier.alpha = .1)+
    geom_abline(intercept = .08, slope=0,
                linetype='dashed', color = 'red')
p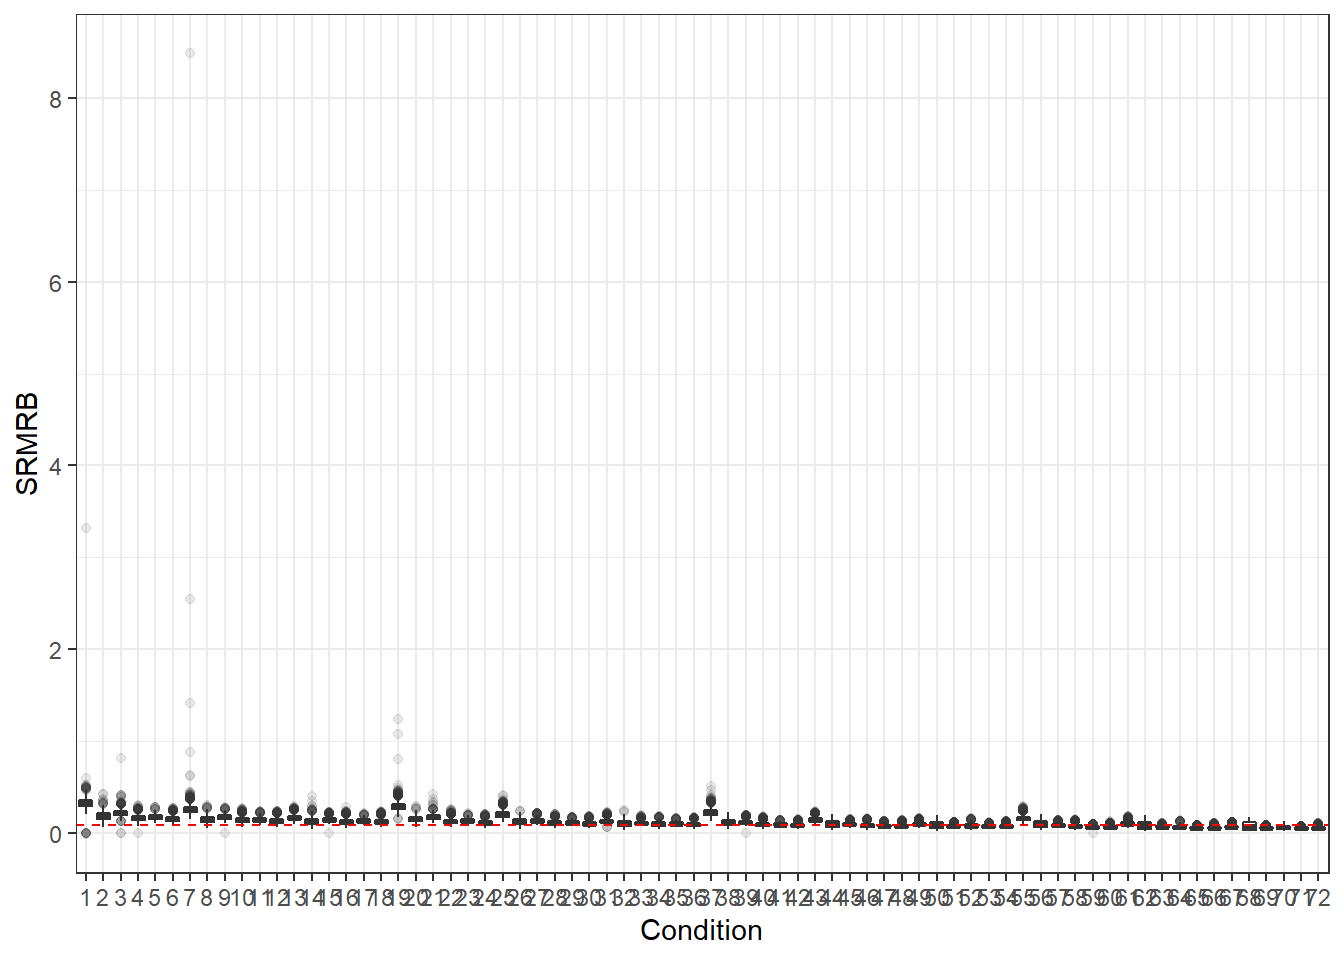
| Version | Author | Date |
|---|---|---|
| a1b0dc1 | noah-padgett | 2019-05-08 |
Marginal Plots of Conditions
CFI
p <- ggplot(mydata, aes(x=Model, y=CFI))+
    geom_boxplot(outlier.alpha = .1)+
    geom_abline(intercept = .95, slope=0,
                linetype='dashed', color = 'red')
p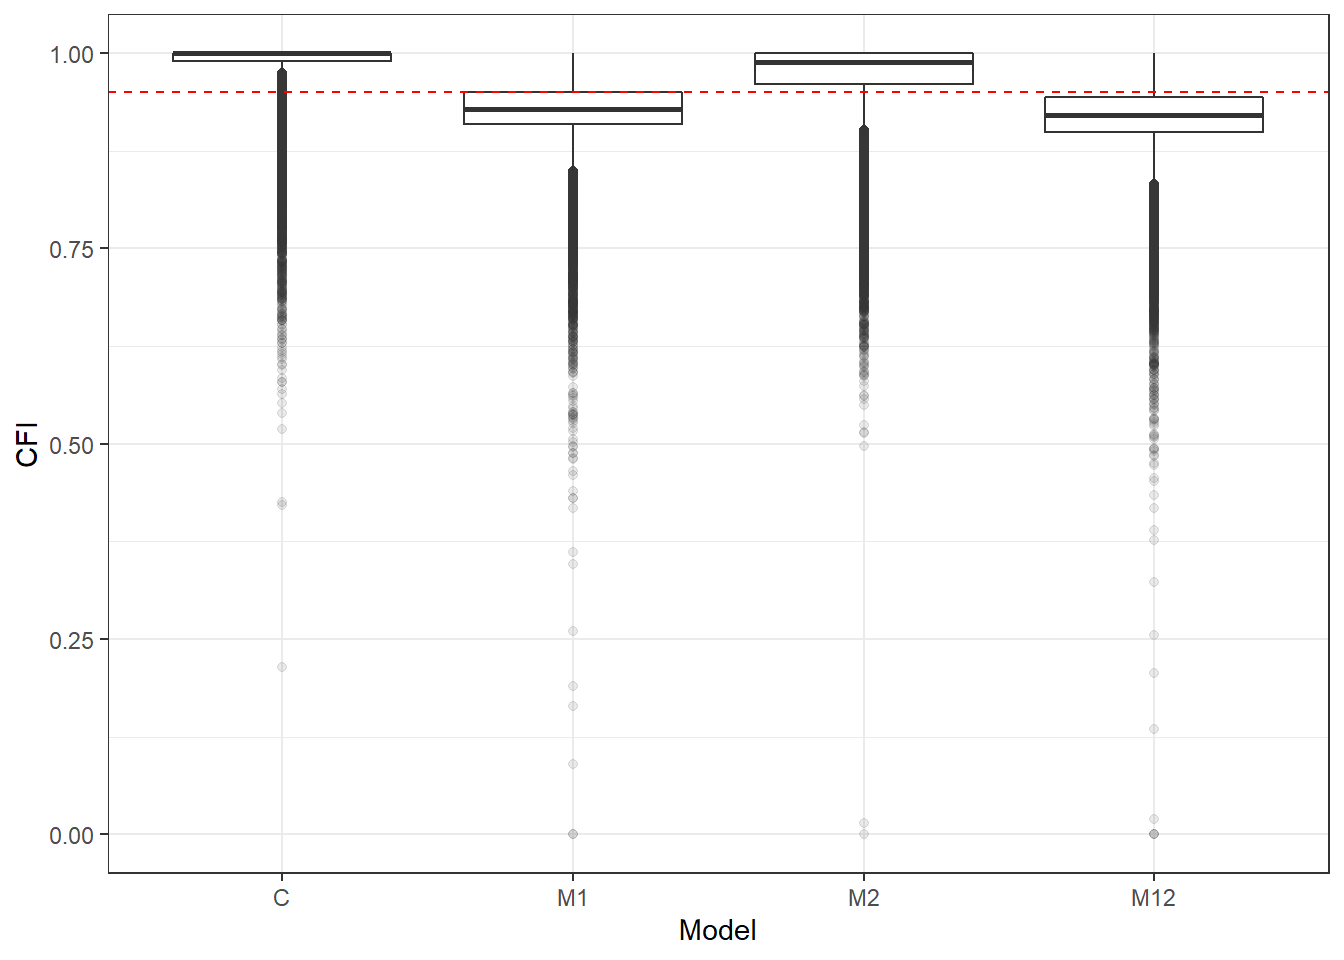
| Version | Author | Date |
|---|---|---|
| a1b0dc1 | noah-padgett | 2019-05-08 |
if(save.fig == T) ggsave("cfi_marginal_model.pdf",plot = p, width=6, height=4, units='in')

p <- ggplot(mydata, aes(x=Estimator, y=CFI))+
    geom_boxplot(outlier.alpha = .1)+
    geom_abline(intercept = .95, slope=0,
                linetype='dashed', color = 'red')
p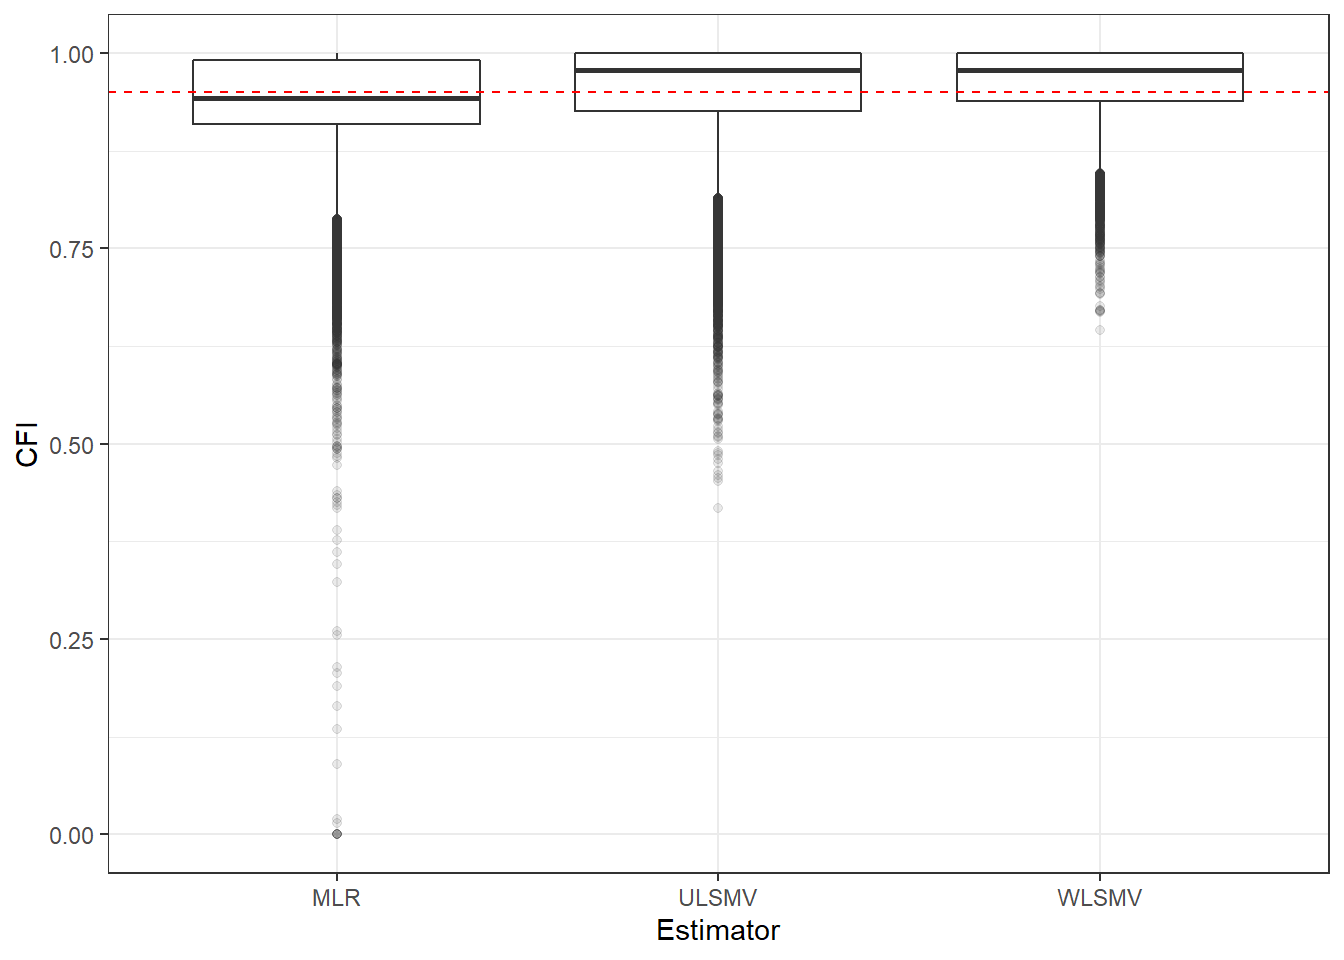
| Version | Author | Date |
|---|---|---|
| a1b0dc1 | noah-padgett | 2019-05-08 |
if(save.fig == T) ggsave("cfi_marginal_estimator.pdf",plot = p, width=6, height=4, units='in')

p <- ggplot(mydata, aes(x=ss_l1, y=CFI))+
    geom_boxplot(outlier.alpha = .1)+
    geom_abline(intercept = .95, slope=0,
                linetype='dashed', color = 'red')
p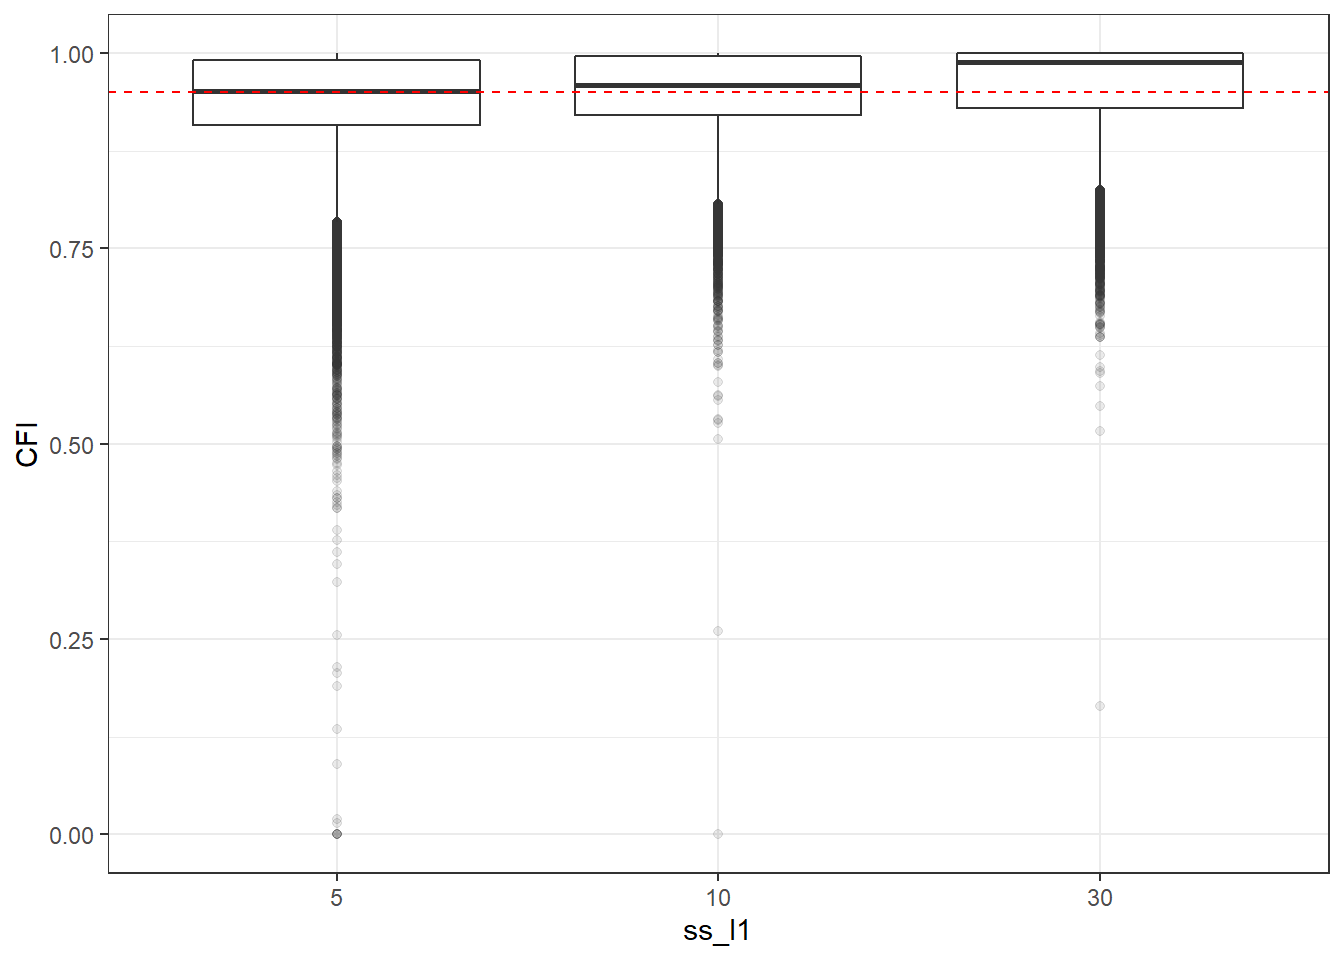
| Version | Author | Date |
|---|---|---|
| a1b0dc1 | noah-padgett | 2019-05-08 |
if(save.fig == T) ggsave("cfi_marginal_ssl1.pdf",plot = p, width=6, height=4, units='in')


p <- ggplot(mydata, aes(x=ss_l2, y=CFI))+
    geom_boxplot(outlier.alpha = .1)+
    geom_abline(intercept = .95, slope=0,
                linetype='dashed', color = 'red')
p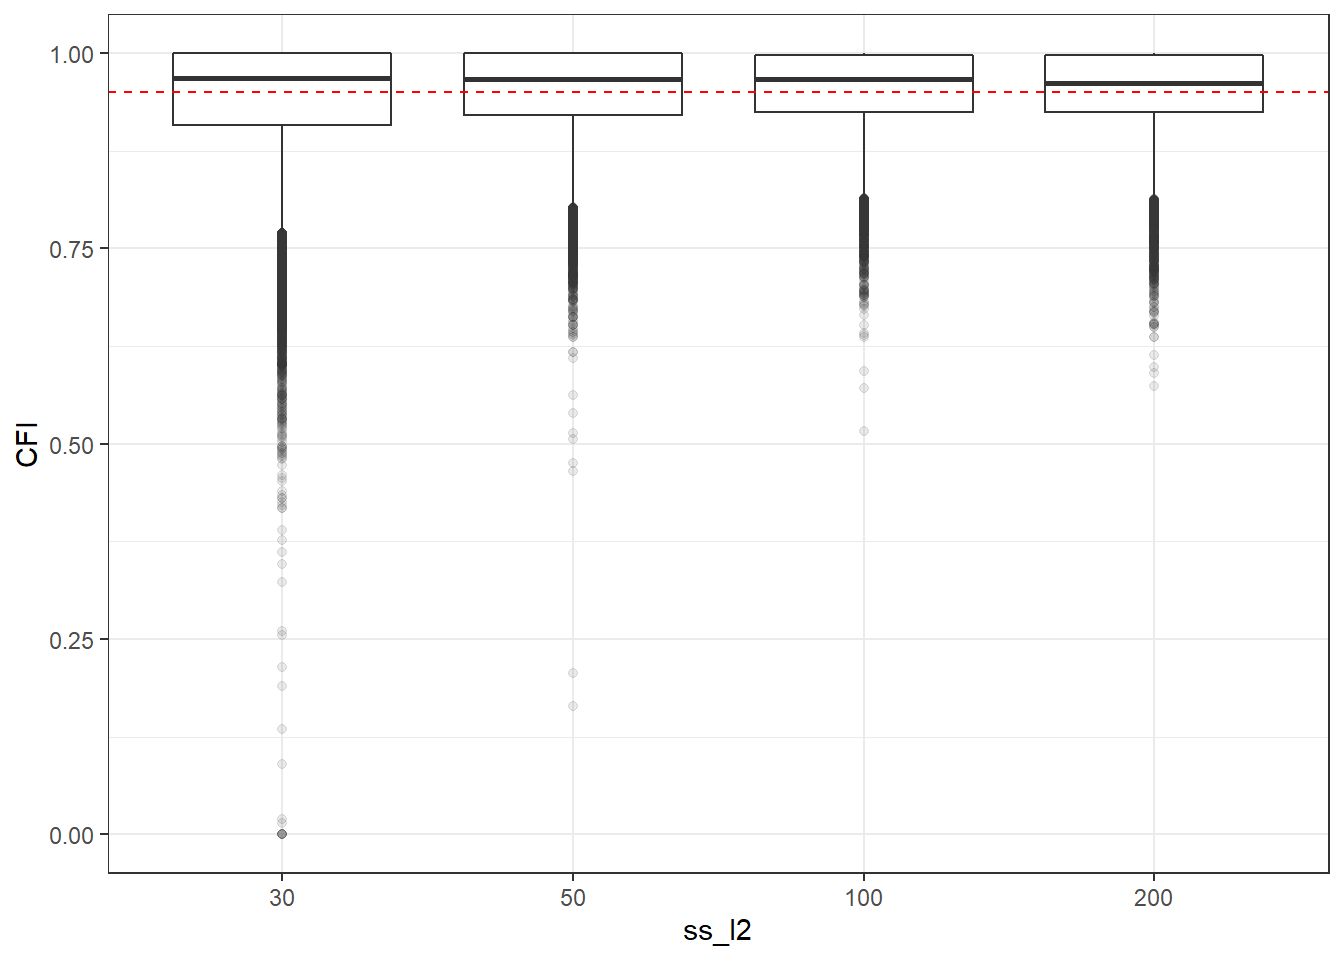
| Version | Author | Date |
|---|---|---|
| a1b0dc1 | noah-padgett | 2019-05-08 |
if(save.fig == T) ggsave("cfi_marginal_ss_l2.pdf",plot = p,width=6, height=4, units='in')


p <- ggplot(mydata, aes(x=icc_ov, y=CFI))+
    geom_boxplot(outlier.alpha = .1)+
    geom_abline(intercept = .95, slope=0,
                linetype='dashed', color = 'red') +
    labs(title = 'CFI by Obs. Var. ICC')
p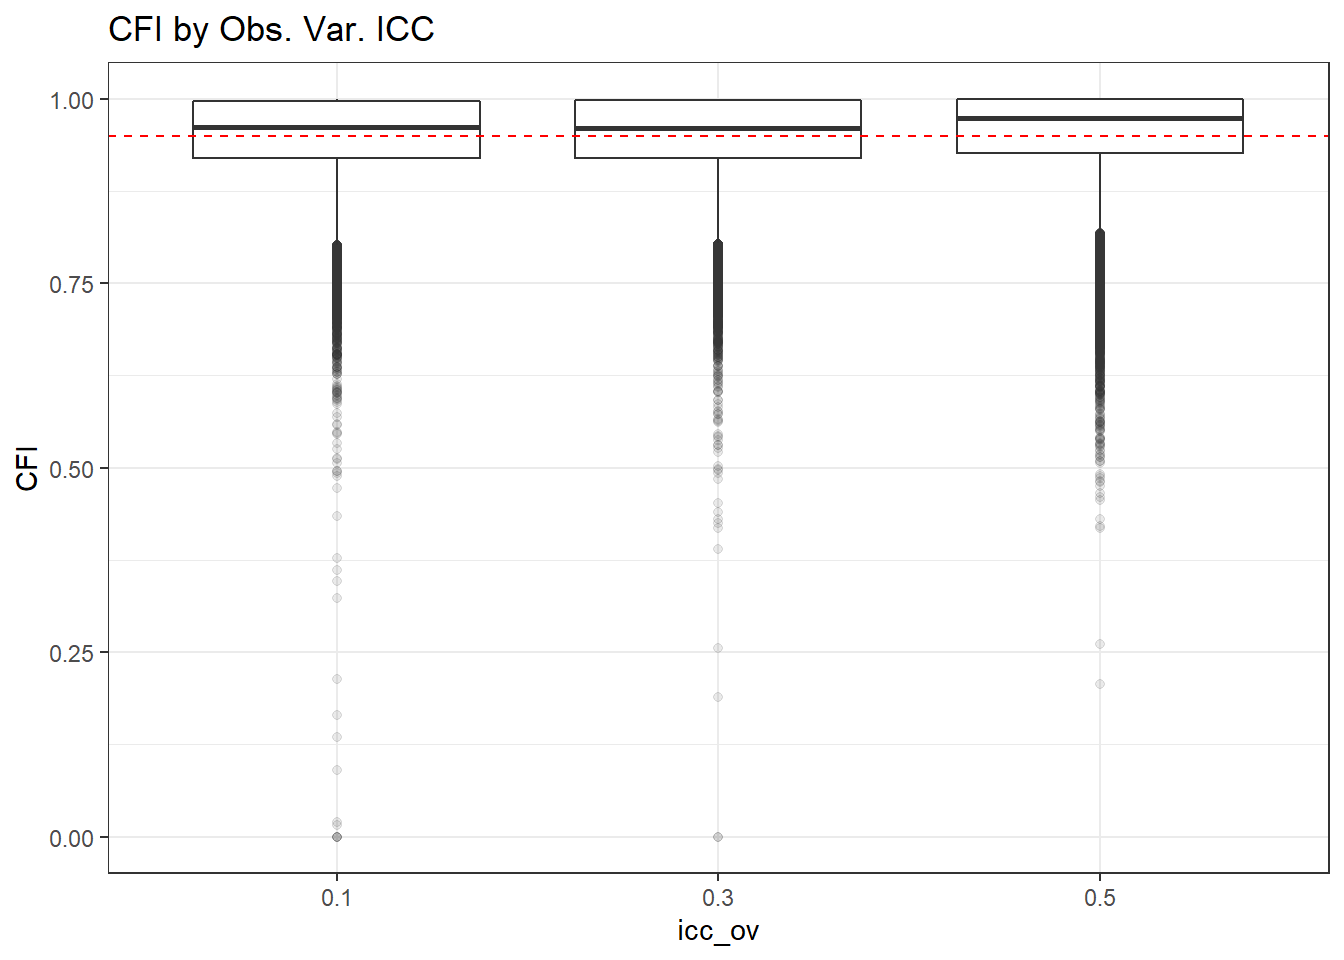
| Version | Author | Date |
|---|---|---|
| a1b0dc1 | noah-padgett | 2019-05-08 |
if(save.fig == T) ggsave("cfi_marginal_icc_ov.pdf",plot = p, width=6, height=4, units='in')


p <- ggplot(mydata, aes(x=icc_lv, y=CFI))+
    geom_boxplot(outlier.alpha = .1)+
    geom_abline(intercept = .95, slope=0,
                linetype='dashed', color = 'red')
p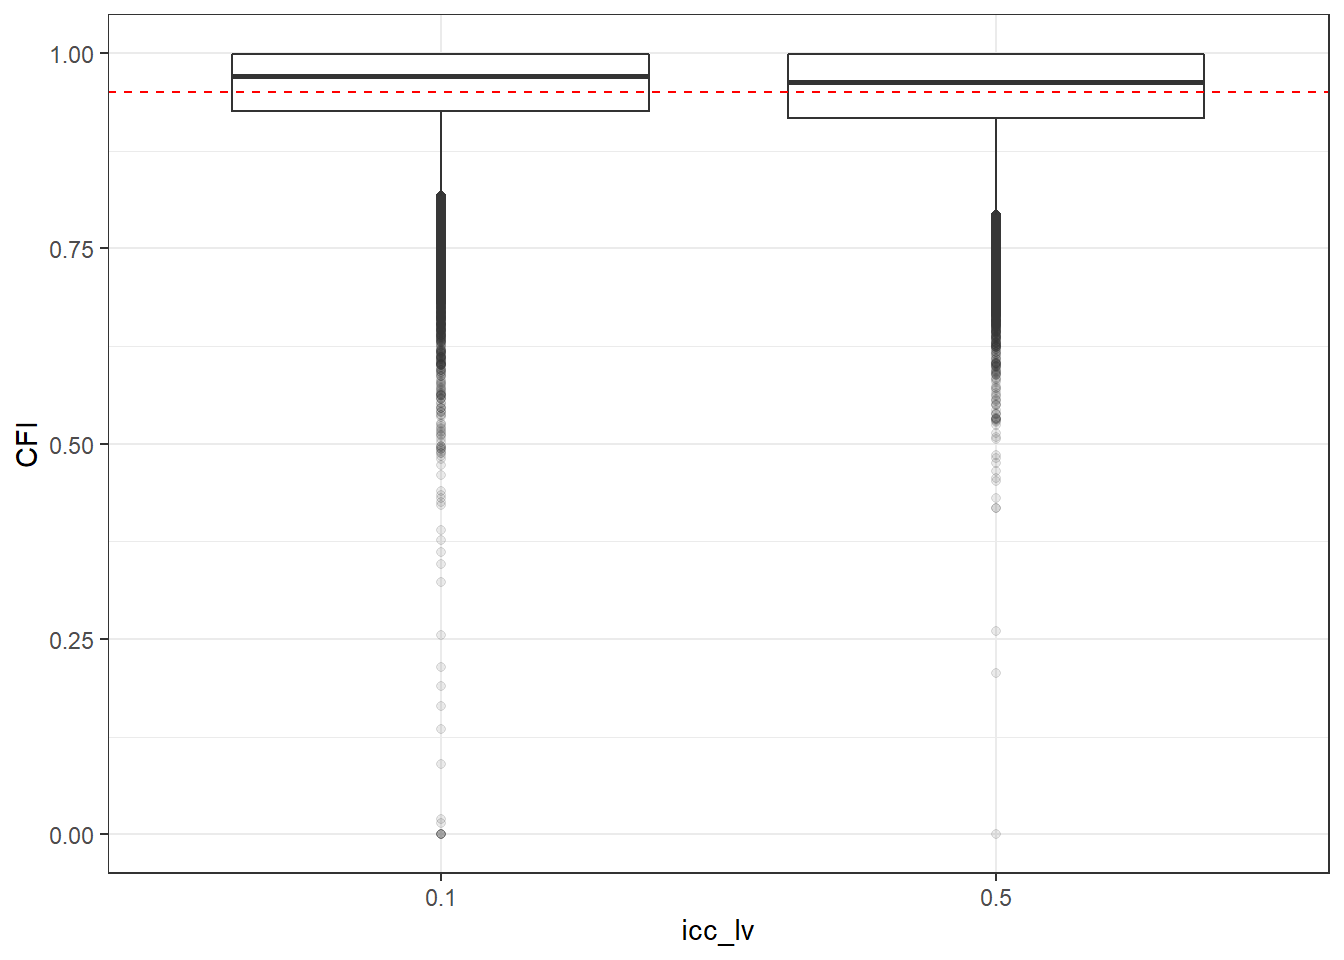
| Version | Author | Date |
|---|---|---|
| a1b0dc1 | noah-padgett | 2019-05-08 |
if(save.fig == T) ggsave("cfi_marginal_icc_lv.pdf",plot = p, width=6, height=4, units='in')TLI
p <- ggplot(mydata, aes(x=Model, y=TLI))+
    geom_boxplot(outlier.alpha = .1)+
    geom_abline(intercept = .95, slope=0,
                linetype='dashed', color = 'red')
p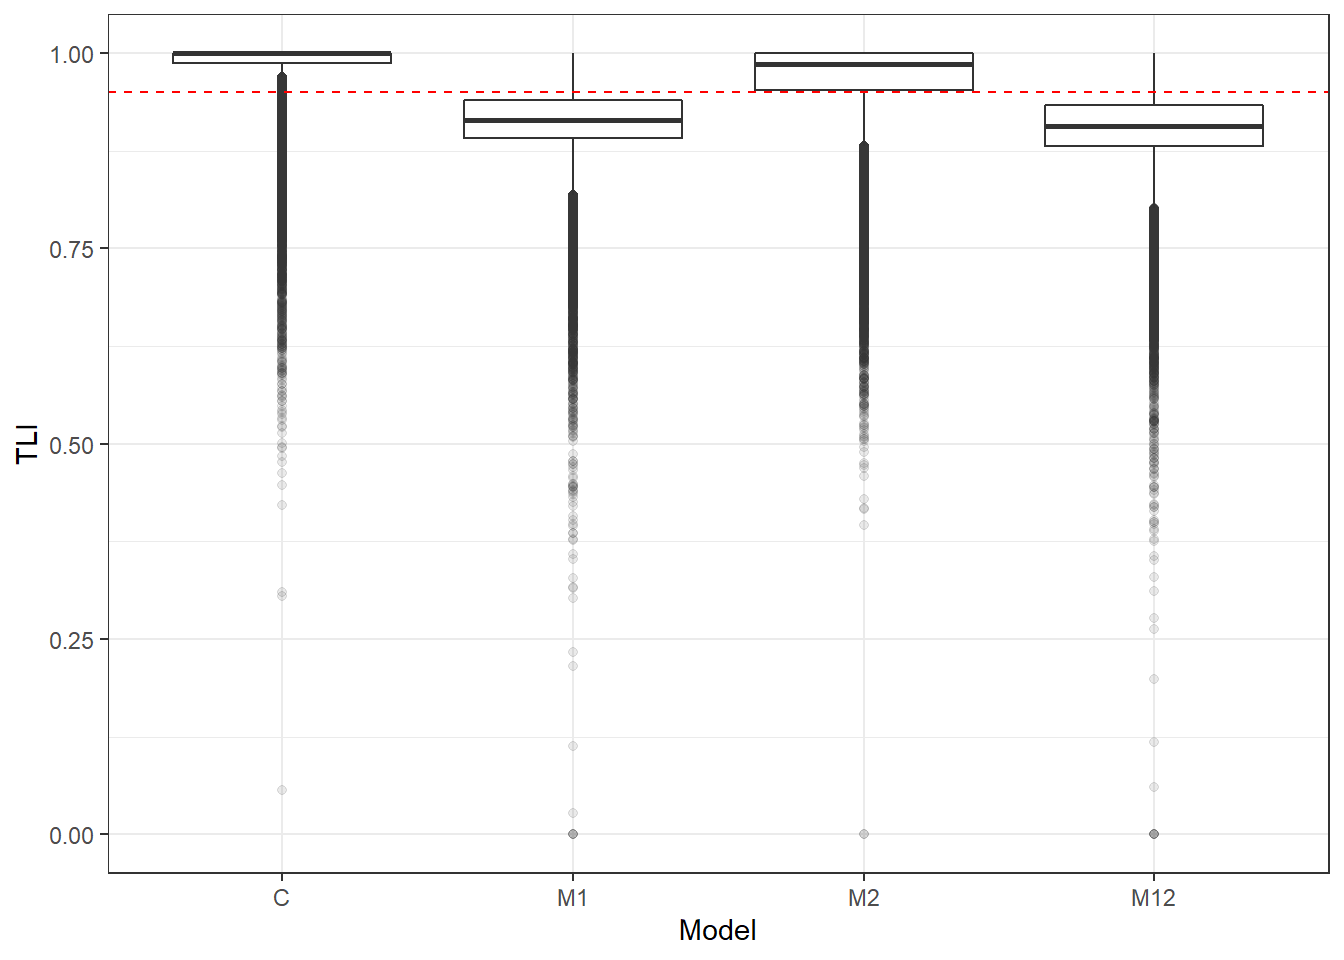
| Version | Author | Date |
|---|---|---|
| a1b0dc1 | noah-padgett | 2019-05-08 |
if(save.fig == T) ggsave("tli_marginal_model.pdf",plot = p, width=6, height=4, units='in')
p <- ggplot(mydata, aes(x=Estimator, y=TLI))+
    geom_boxplot(outlier.alpha = .1)+
    geom_abline(intercept = .95, slope=0,
                linetype='dashed', color = 'red')
p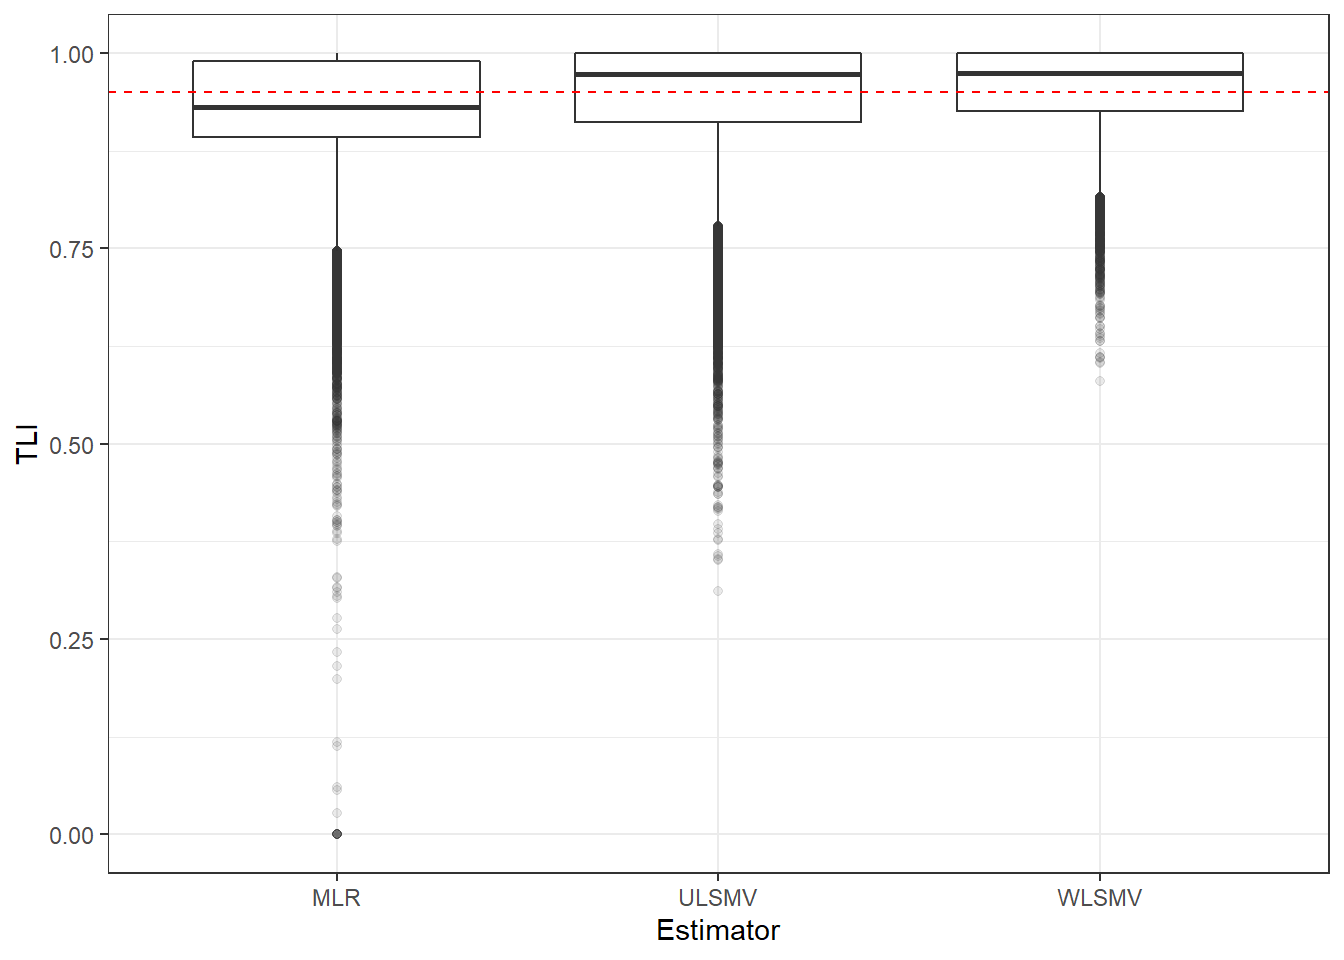
| Version | Author | Date |
|---|---|---|
| a1b0dc1 | noah-padgett | 2019-05-08 |
if(save.fig == T) ggsave("tli_marginal_estimator.pdf",plot = p,width=6, height=4, units='in')

p <- ggplot(mydata, aes(x=ss_l1, y=TLI))+
    geom_boxplot(outlier.alpha = .1)+
    geom_abline(intercept = .95, slope=0,
                linetype='dashed', color = 'red')
p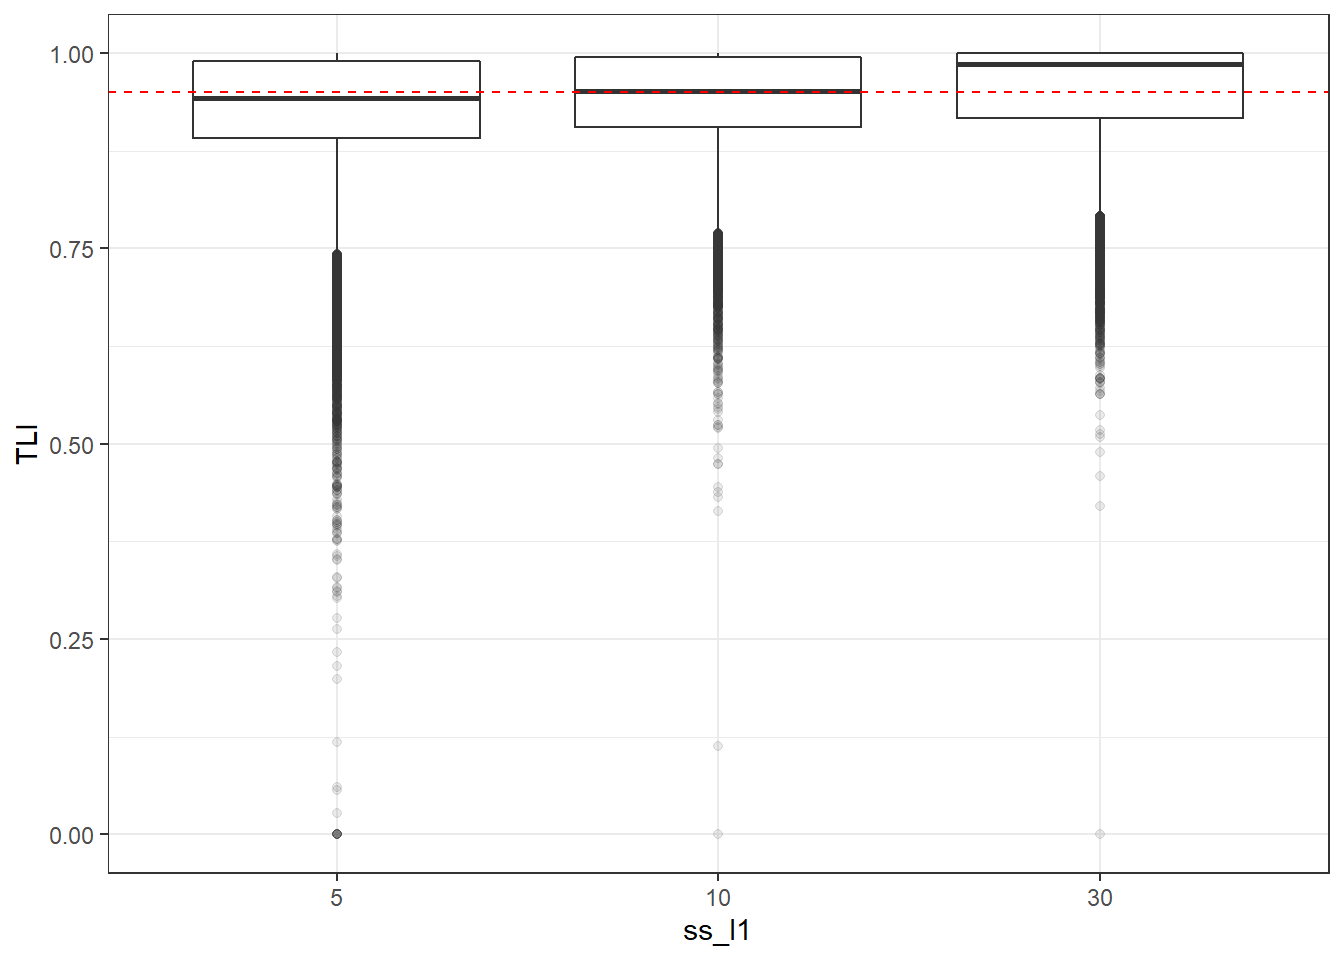
| Version | Author | Date |
|---|---|---|
| a1b0dc1 | noah-padgett | 2019-05-08 |
if(save.fig == T) ggsave("tli_marginal_ss_l1.pdf",plot = p, width=6, height=4, units='in')


p <- ggplot(mydata, aes(x=ss_l2, y=TLI))+
    geom_boxplot(outlier.alpha = .1)+
    geom_abline(intercept = .95, slope=0,
                linetype='dashed', color = 'red')
p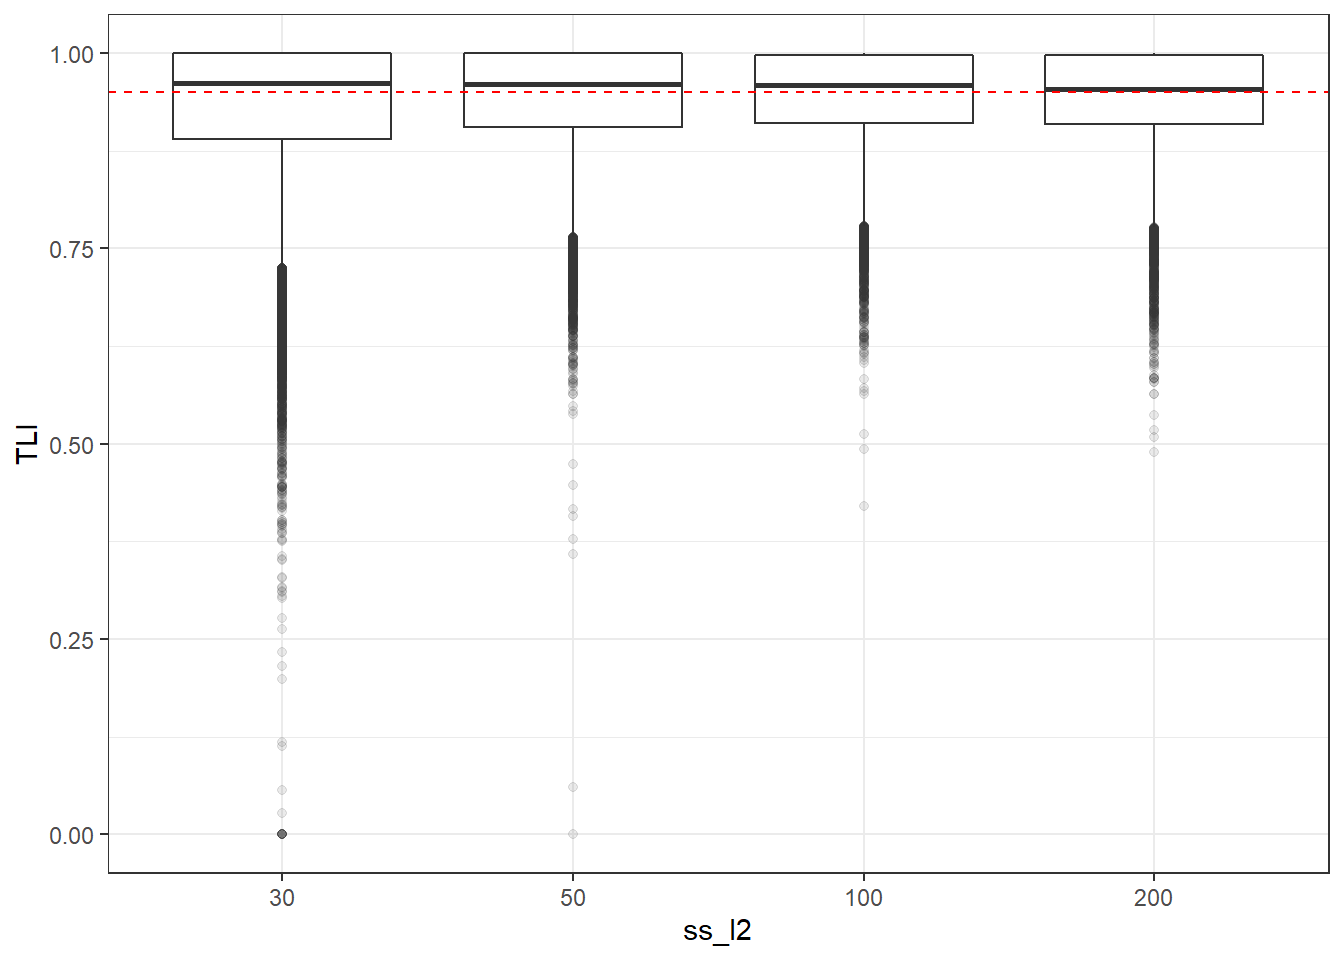
| Version | Author | Date |
|---|---|---|
| a1b0dc1 | noah-padgett | 2019-05-08 |
if(save.fig == T) ggsave("tli_marginal_ss_l2.pdf",plot = p, width=6, height=4, units='in')

p <- ggplot(mydata, aes(x=icc_ov, y=TLI))+
    geom_boxplot(outlier.alpha = .1)+
    geom_abline(intercept = .95, slope=0,
                linetype='dashed', color = 'red')
p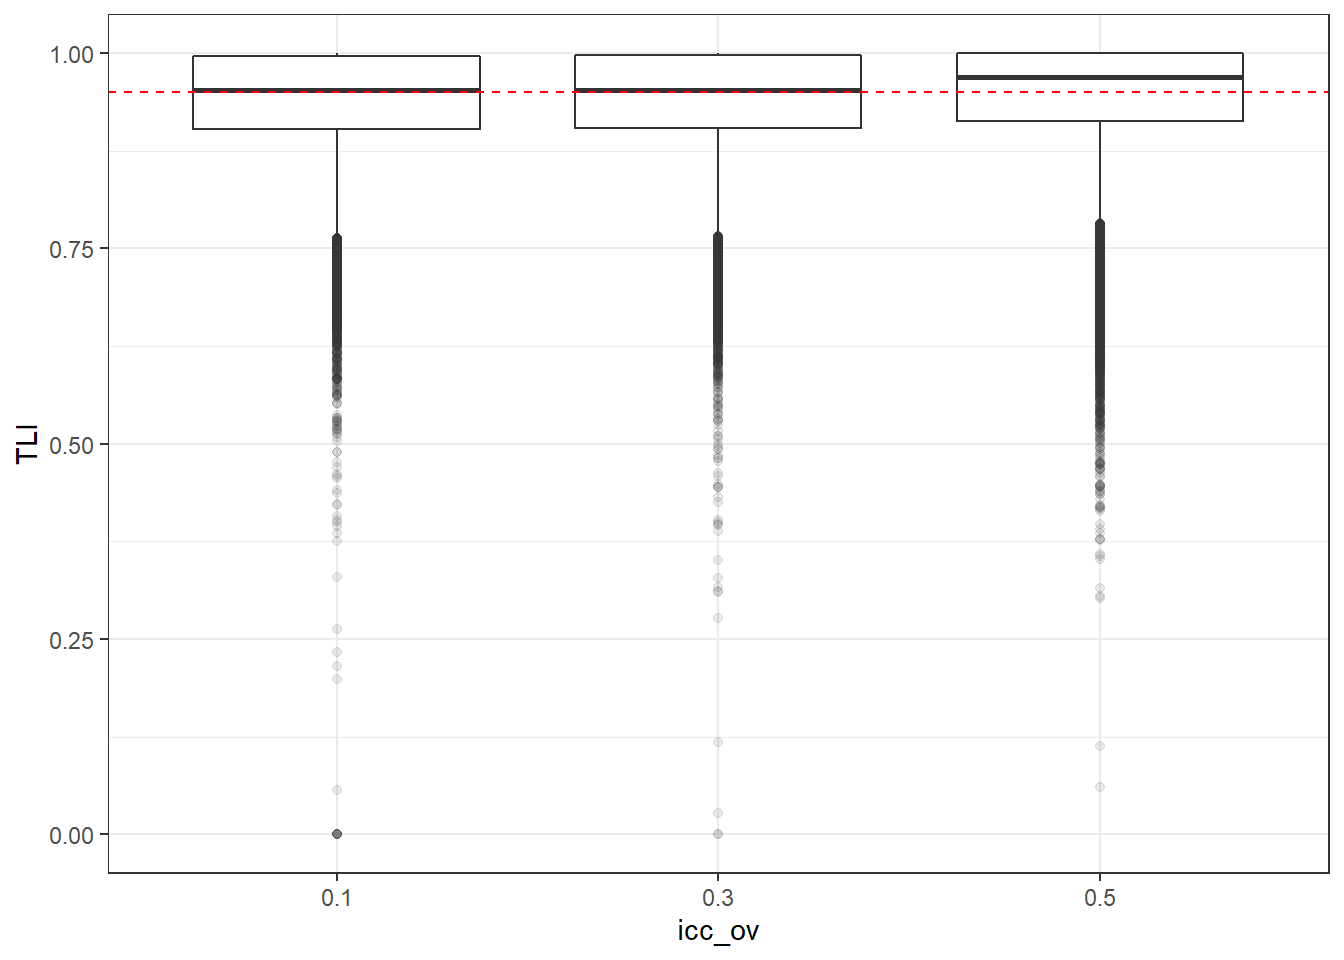
| Version | Author | Date |
|---|---|---|
| a1b0dc1 | noah-padgett | 2019-05-08 |
if(save.fig == T) ggsave("tli_marginal_icc_ov.pdf",plot = p, width=6, height=4, units='in')

p <- ggplot(mydata, aes(x=icc_lv, y=TLI))+
    geom_boxplot(outlier.alpha = .1)+
    geom_abline(intercept = .95, slope=0,
                linetype='dashed', color = 'red')
p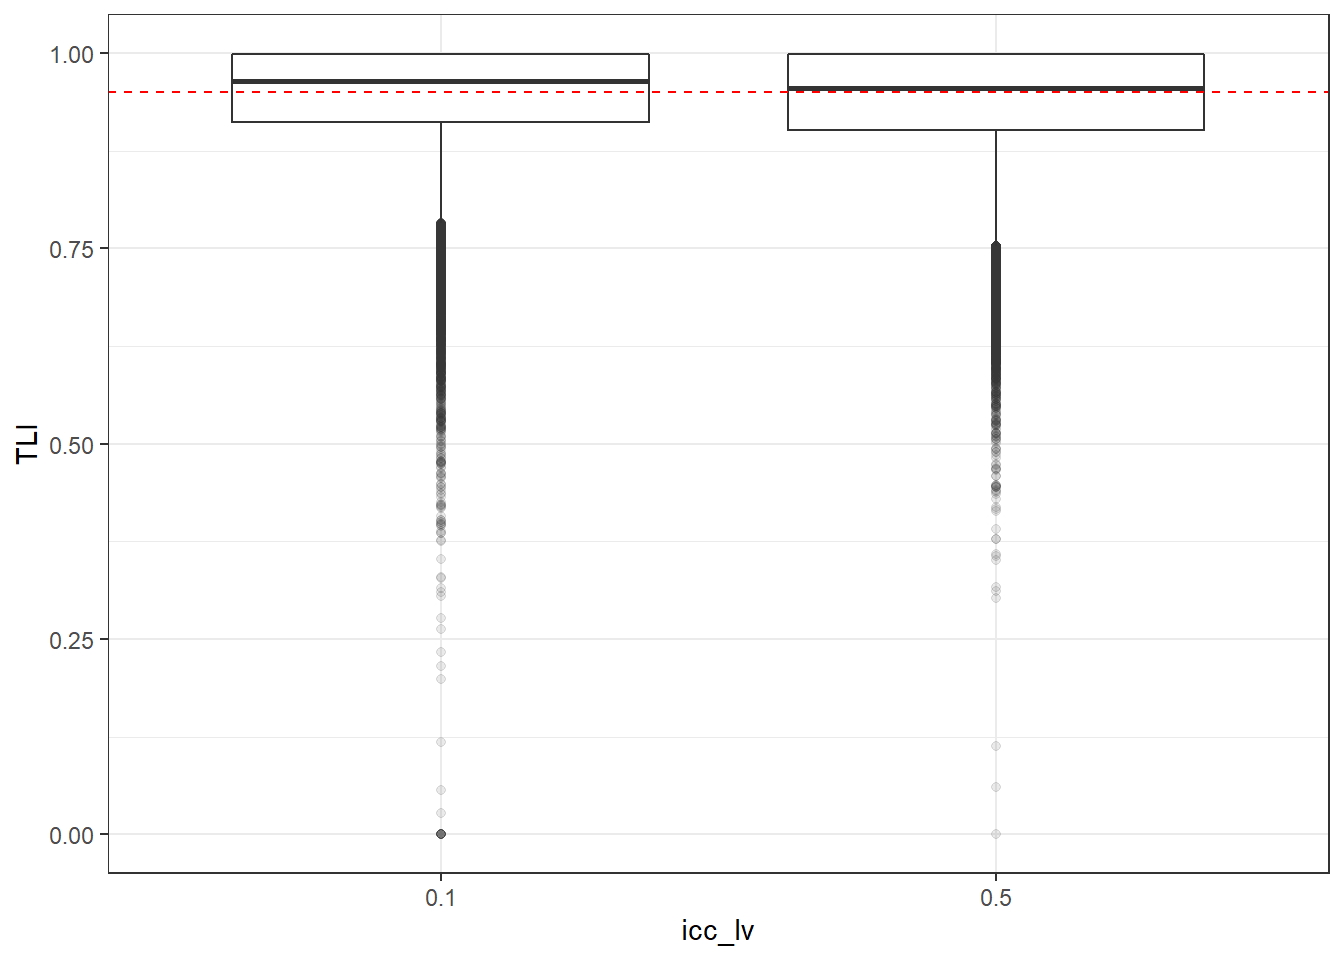
| Version | Author | Date |
|---|---|---|
| a1b0dc1 | noah-padgett | 2019-05-08 |
if(save.fig == T) ggsave("tli_marginal_icc_lv.pdf",plot = p, width=6, height=4, units='in')RMSEA
p <- ggplot(mydata, aes(x=Model, y=RMSEA))+
    geom_boxplot(outlier.alpha = .1)+
    geom_abline(intercept = .06, slope=0,
                linetype='dashed', color = 'red')
p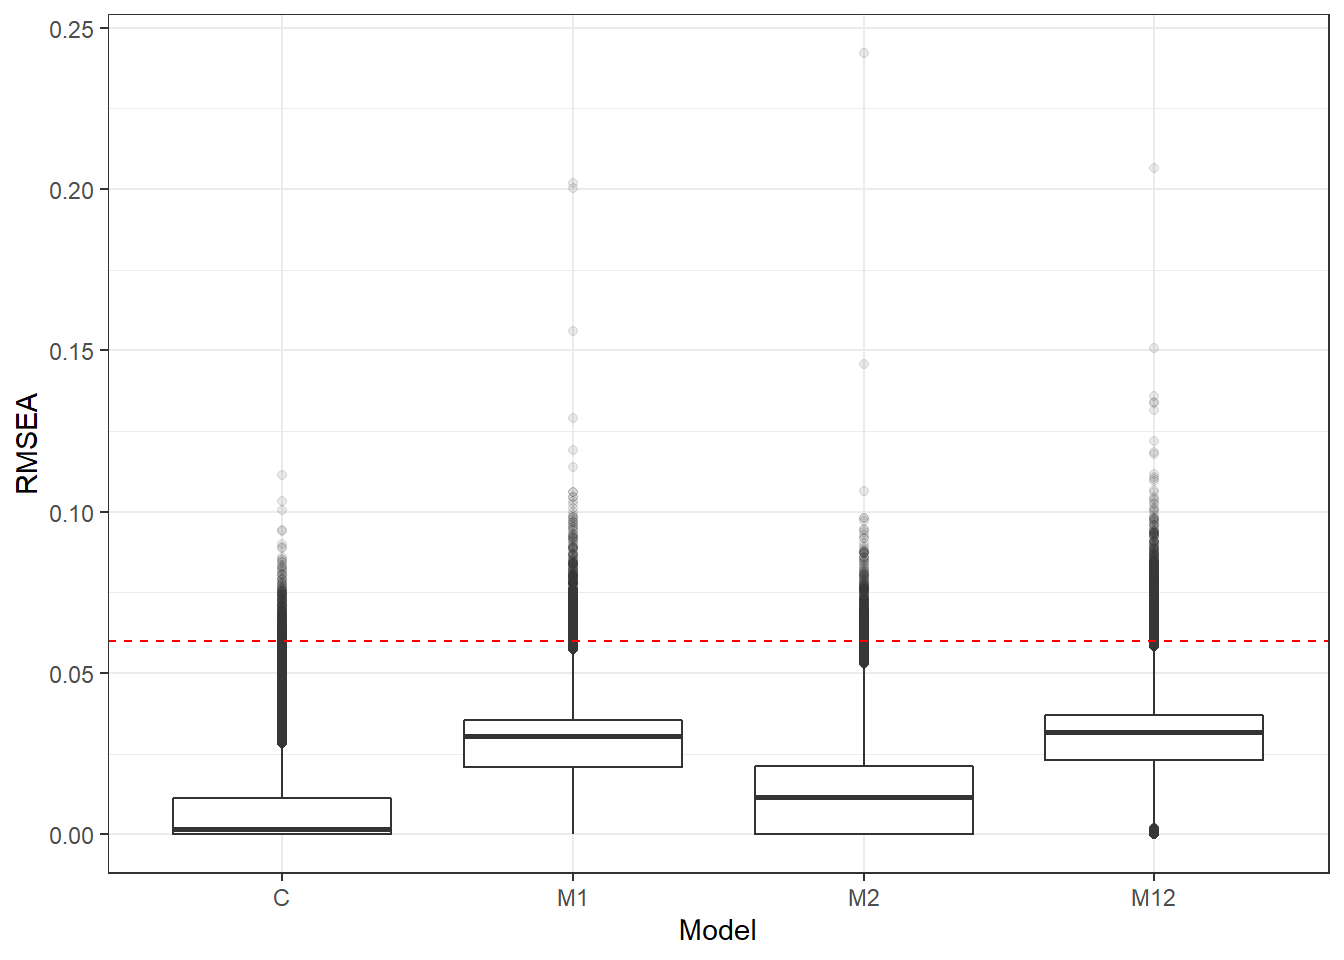
| Version | Author | Date |
|---|---|---|
| a1b0dc1 | noah-padgett | 2019-05-08 |
if(save.fig == T) ggsave("rmsea_marginal_model.pdf",plot = p, width=6, height=4, units='in')

p <- ggplot(mydata, aes(x=Estimator, y=RMSEA))+
    geom_boxplot(outlier.alpha = .1)+
    geom_abline(intercept = .06, slope=0,
                linetype='dashed', color = 'red')
p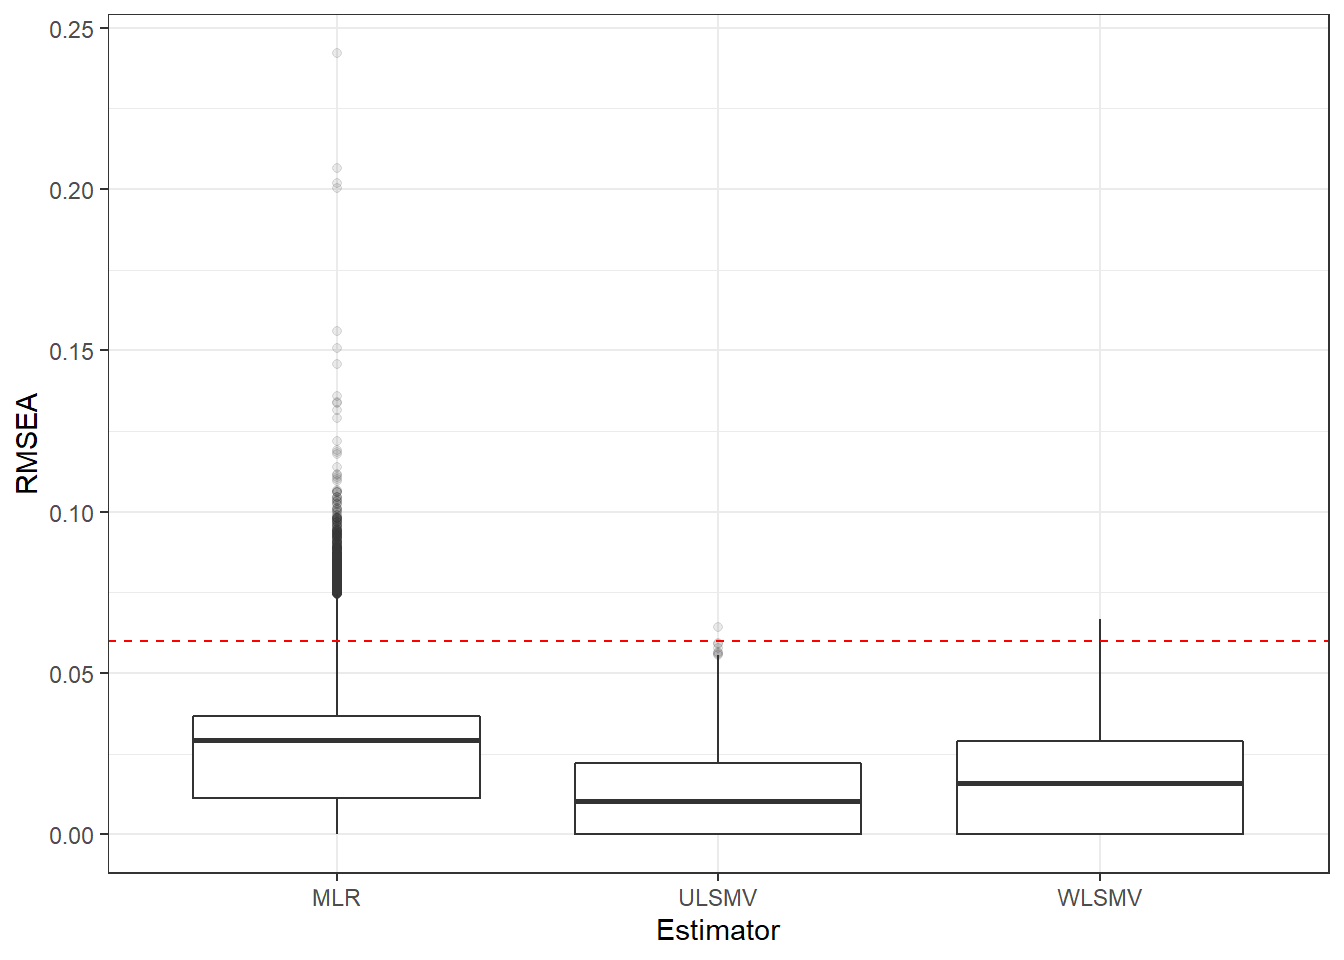
| Version | Author | Date |
|---|---|---|
| a1b0dc1 | noah-padgett | 2019-05-08 |
if(save.fig == T) ggsave("rmsea_marginal_estimator.pdf",plot = p, width=6, height=4, units='in')


p <- ggplot(mydata, aes(x=ss_l1, y=RMSEA))+
    geom_boxplot(outlier.alpha = .1)+
    geom_abline(intercept = .06, slope=0,
                linetype='dashed', color = 'red')
p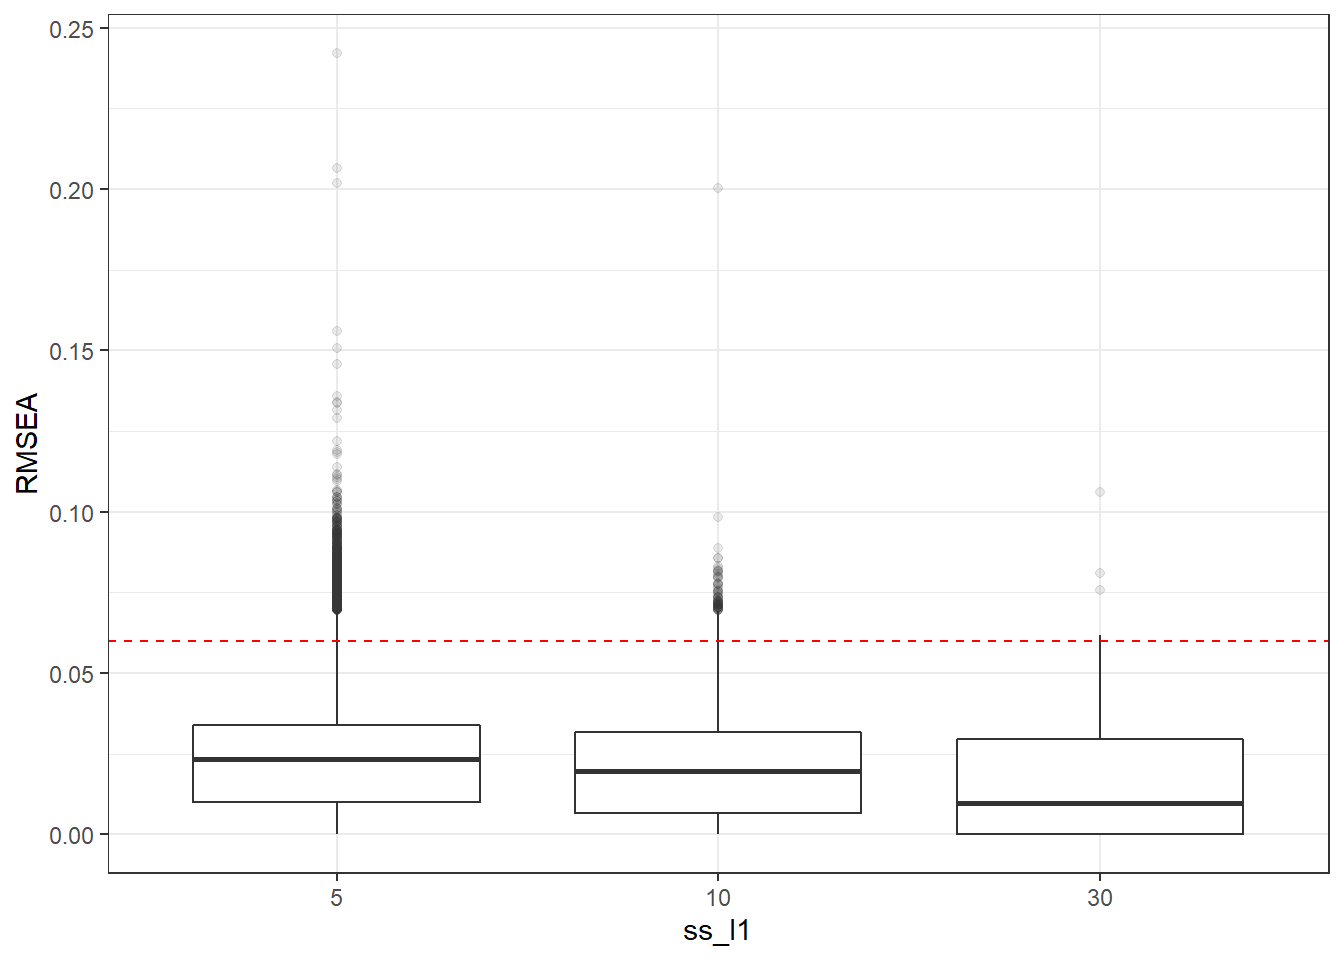
| Version | Author | Date |
|---|---|---|
| a1b0dc1 | noah-padgett | 2019-05-08 |
if(save.fig == T) ggsave("rmsea_marginal_ss_l1.pdf",plot = p, width=6, height=4, units='in')


p <- ggplot(mydata, aes(x=ss_l2, y=RMSEA))+
    geom_boxplot(outlier.alpha = .1)+
    geom_abline(intercept = .06, slope=0,
                linetype='dashed', color = 'red')
p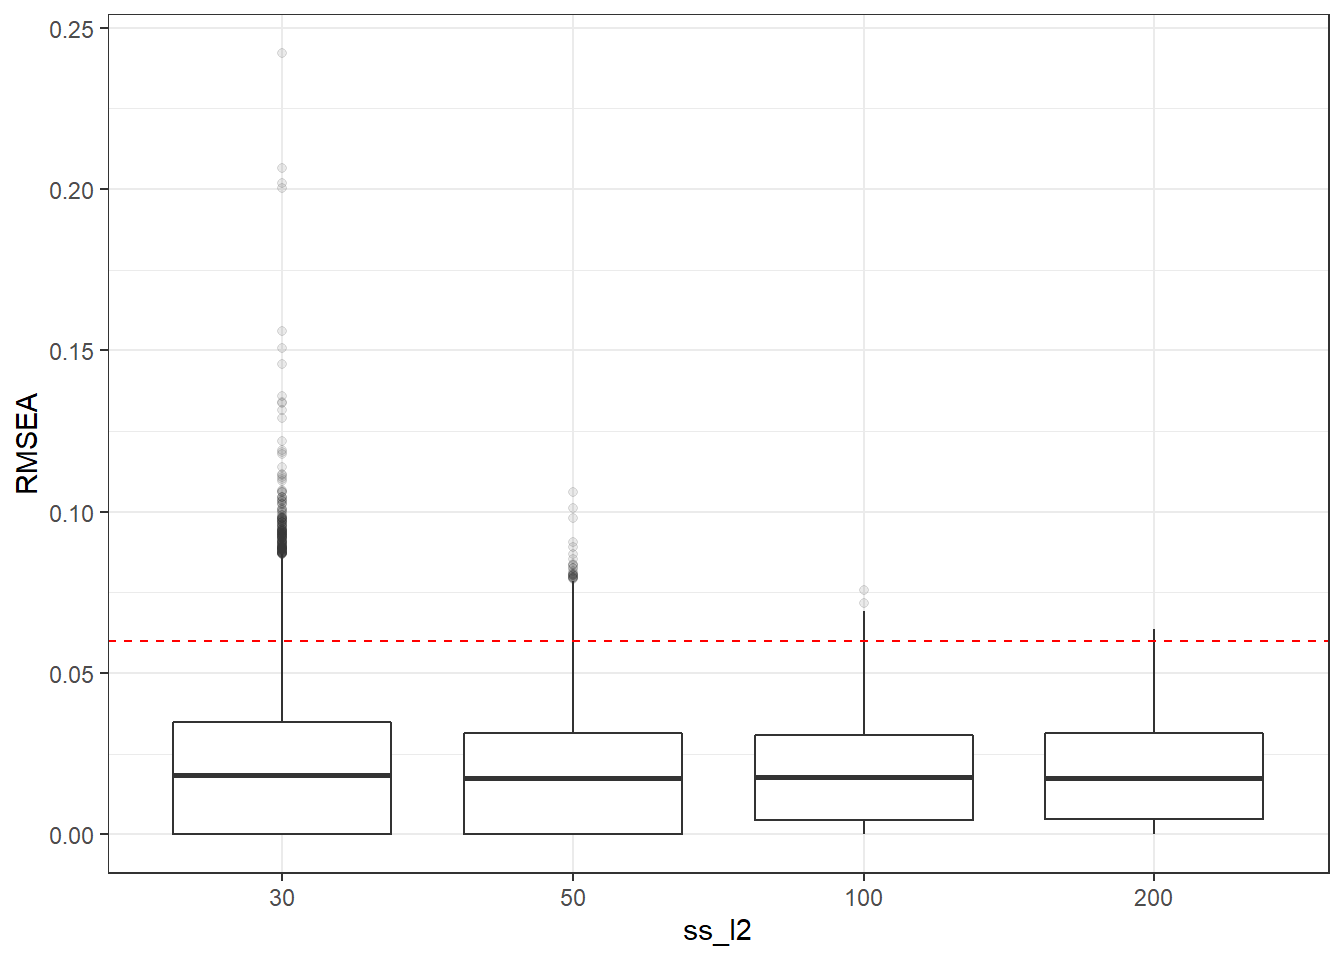
| Version | Author | Date |
|---|---|---|
| a1b0dc1 | noah-padgett | 2019-05-08 |
if(save.fig == T) ggsave("rmsea_marginal_ss_l2.pdf",plot = p, width=6, height=4, units='in')

p <- ggplot(mydata, aes(x=icc_ov, y=RMSEA))+
    geom_boxplot(outlier.alpha = .1)+
    geom_abline(intercept = .06, slope=0,
                linetype='dashed', color = 'red')
p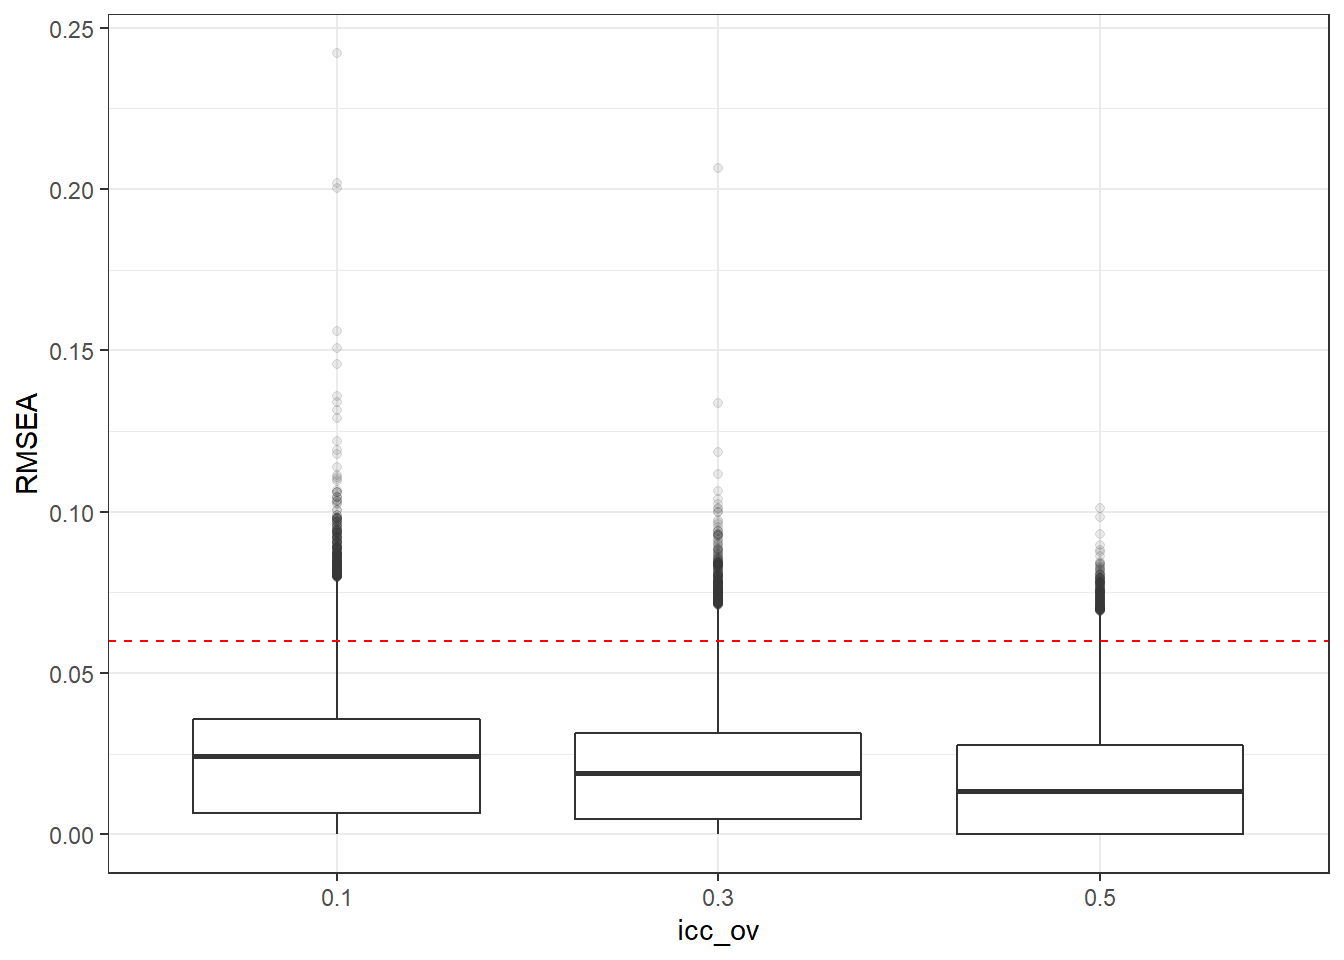
| Version | Author | Date |
|---|---|---|
| a1b0dc1 | noah-padgett | 2019-05-08 |
if(save.fig == T) ggsave("rmsea_marginal_icc_ov.pdf",plot = p, width=6, height=4, units='in')


p <- ggplot(mydata, aes(x=icc_lv, y=RMSEA))+
    geom_boxplot(outlier.alpha = .1)+
    geom_abline(intercept = .06, slope=0,
                linetype='dashed', color = 'red')
p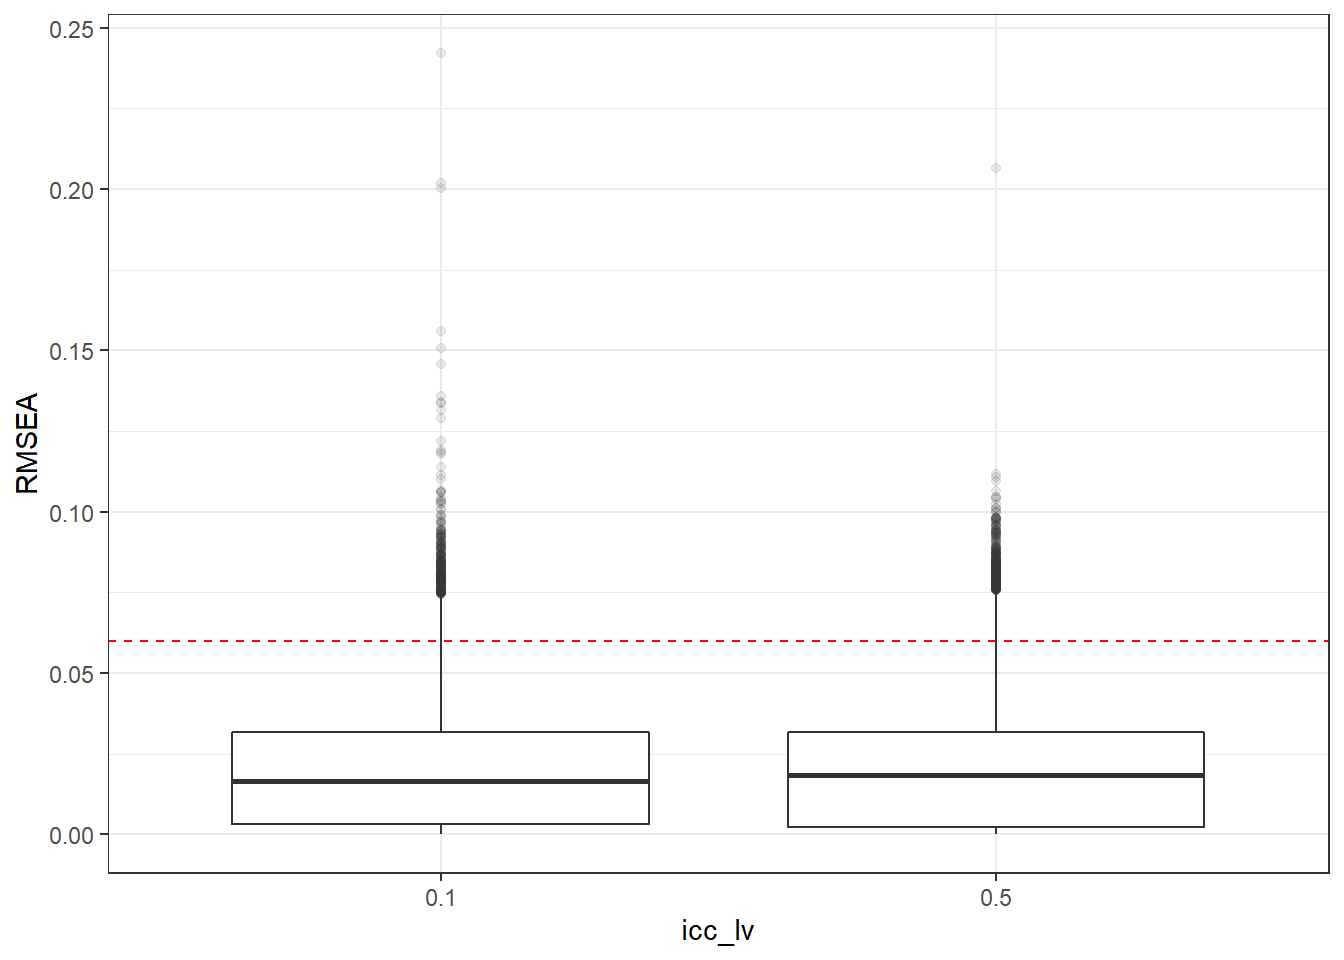
| Version | Author | Date |
|---|---|---|
| a1b0dc1 | noah-padgett | 2019-05-08 |
if(save.fig == T) ggsave("rmsea_marginal_icc_lv.pdf",plot = p, width=6, height=4, units='in')SRMRW
p <- ggplot(mydata, aes(x=Model, y=SRMRW))+
    geom_boxplot(outlier.alpha = .1)+
    geom_abline(intercept = .08, slope=0,
                linetype='dashed', color = 'red')
p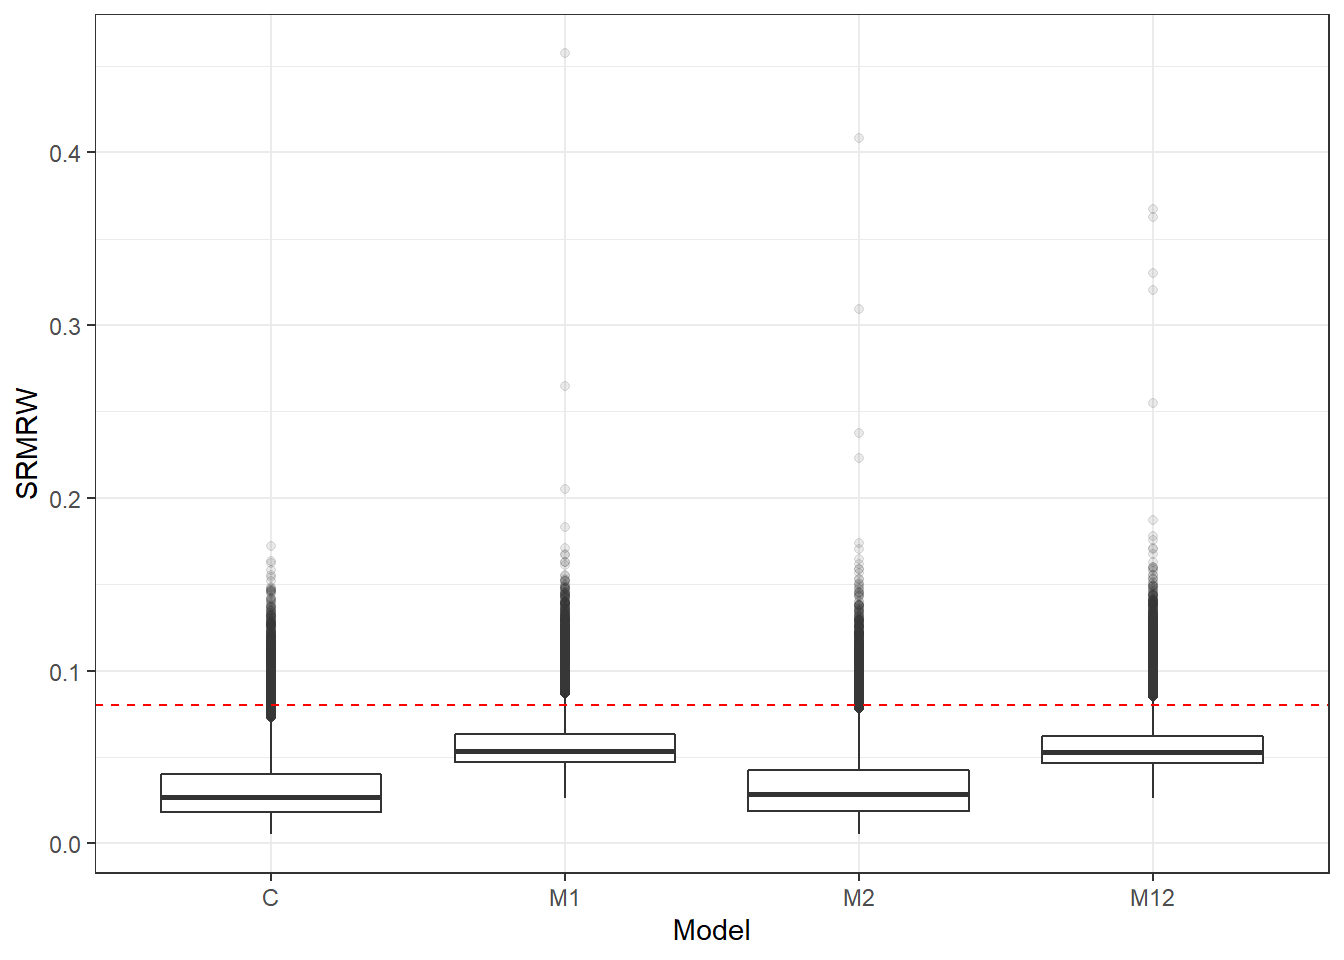
| Version | Author | Date |
|---|---|---|
| a1b0dc1 | noah-padgett | 2019-05-08 |
if(save.fig == T) ggsave("srmrw_marginal_model.pdf",plot = p, width=6, height=4, units='in')

p <- ggplot(mydata, aes(x=Estimator, y=SRMRW))+
    geom_boxplot(outlier.alpha = .1)+
    geom_abline(intercept = .08, slope=0,
                linetype='dashed', color = 'red')
p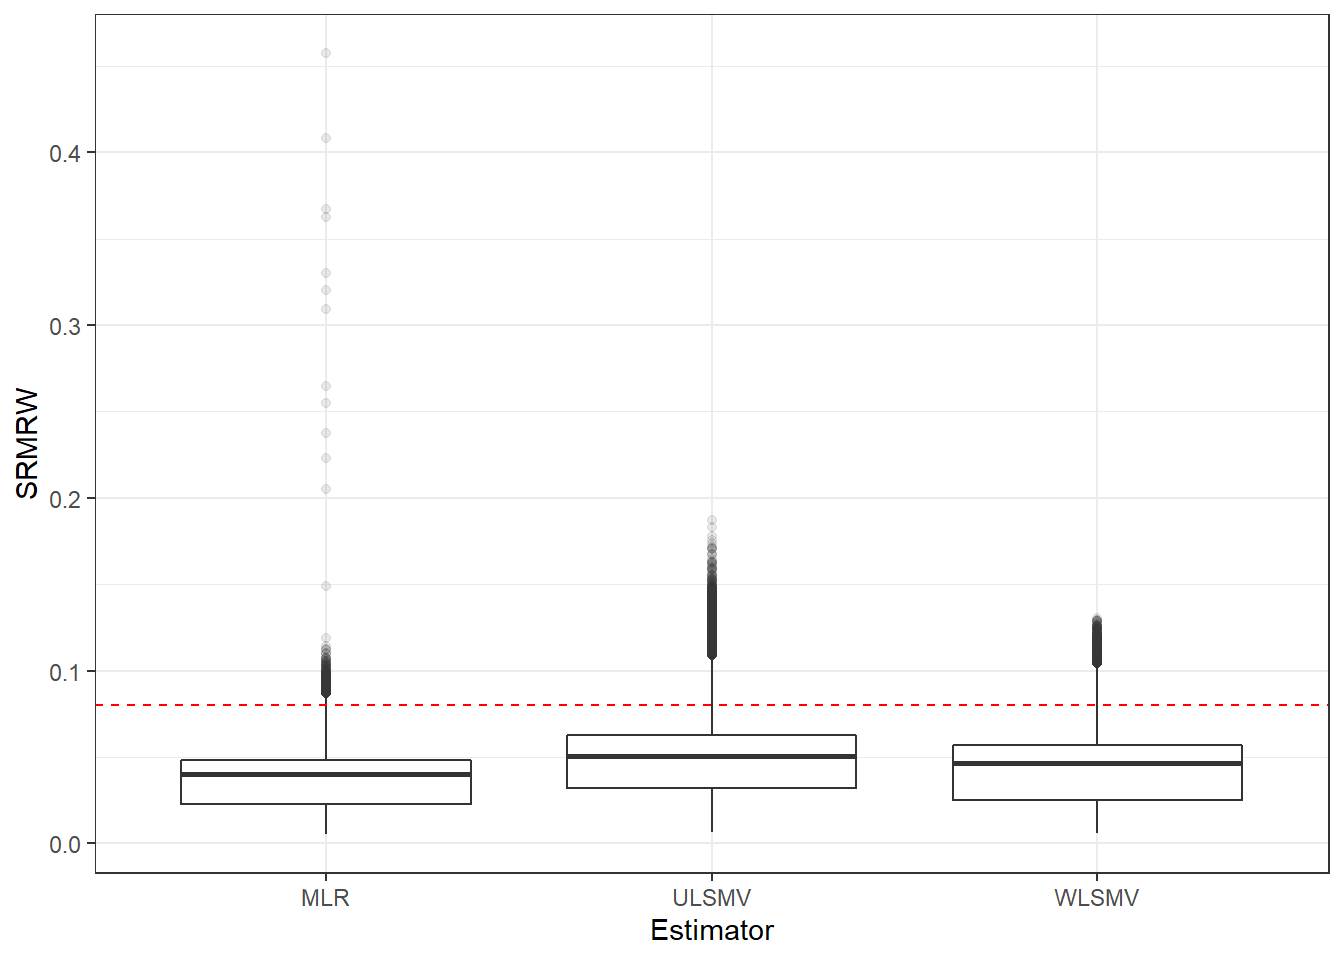
| Version | Author | Date |
|---|---|---|
| a1b0dc1 | noah-padgett | 2019-05-08 |
if(save.fig == T) ggsave("srmrw_marginal_estimator.pdf",plot = p, width=6, height=4, units='in')


p <- ggplot(mydata, aes(x=ss_l1, y=SRMRW))+
    geom_boxplot(outlier.alpha = .1)+
    geom_abline(intercept = .08, slope=0,
                linetype='dashed', color = 'red')
p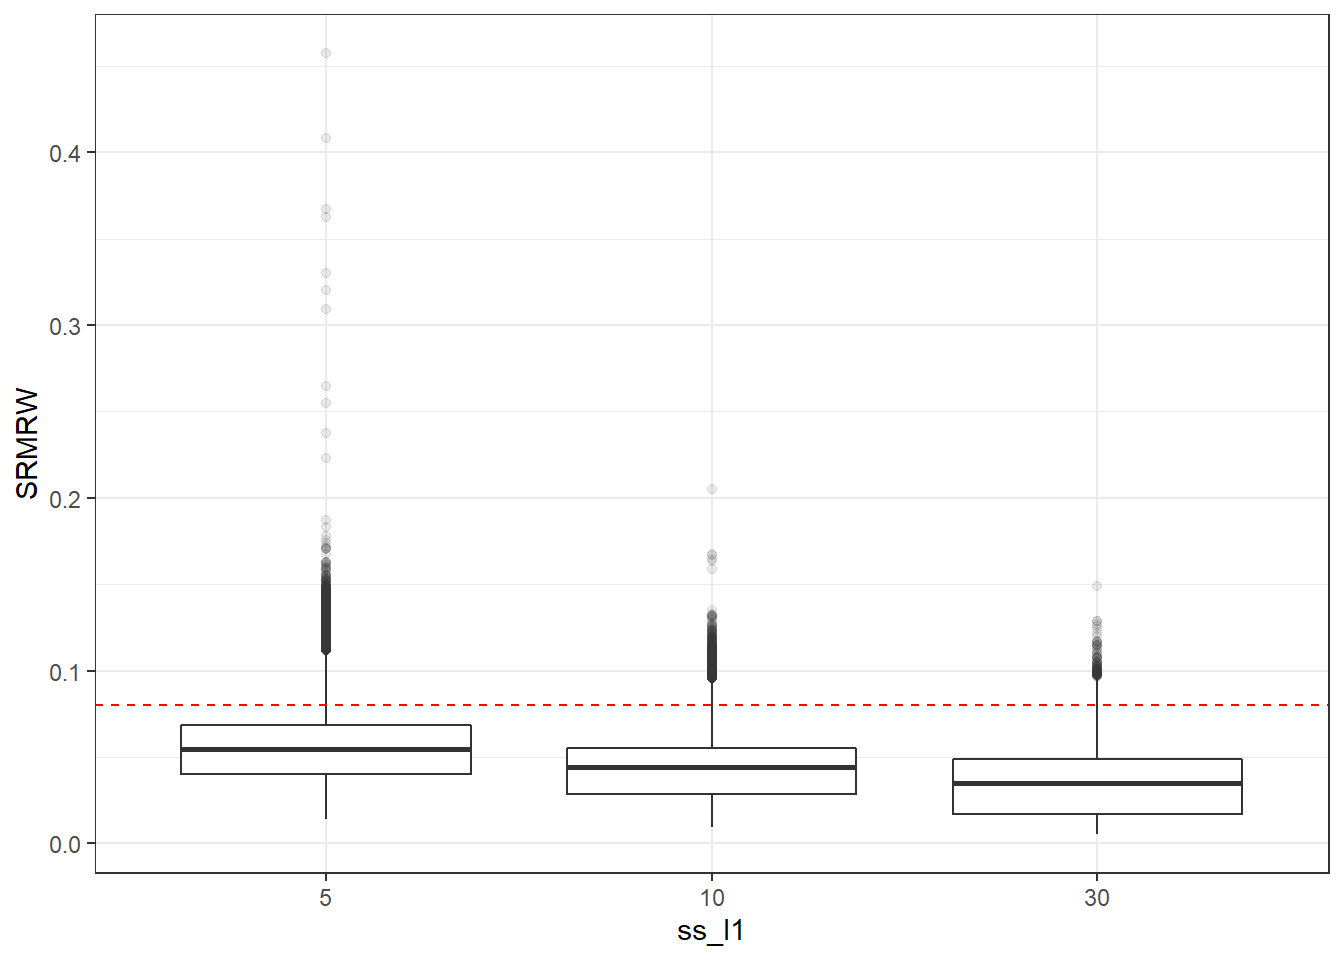
| Version | Author | Date |
|---|---|---|
| a1b0dc1 | noah-padgett | 2019-05-08 |
if(save.fig == T) ggsave("srmrw_marginal_ss_l1.pdf",plot = p, width=6, height=4, units='in')


p <- ggplot(mydata, aes(x=ss_l2,  y=SRMRW))+
    geom_boxplot(outlier.alpha = .1)+
    geom_abline(intercept = .08, slope=0,
                linetype='dashed', color = 'red')
p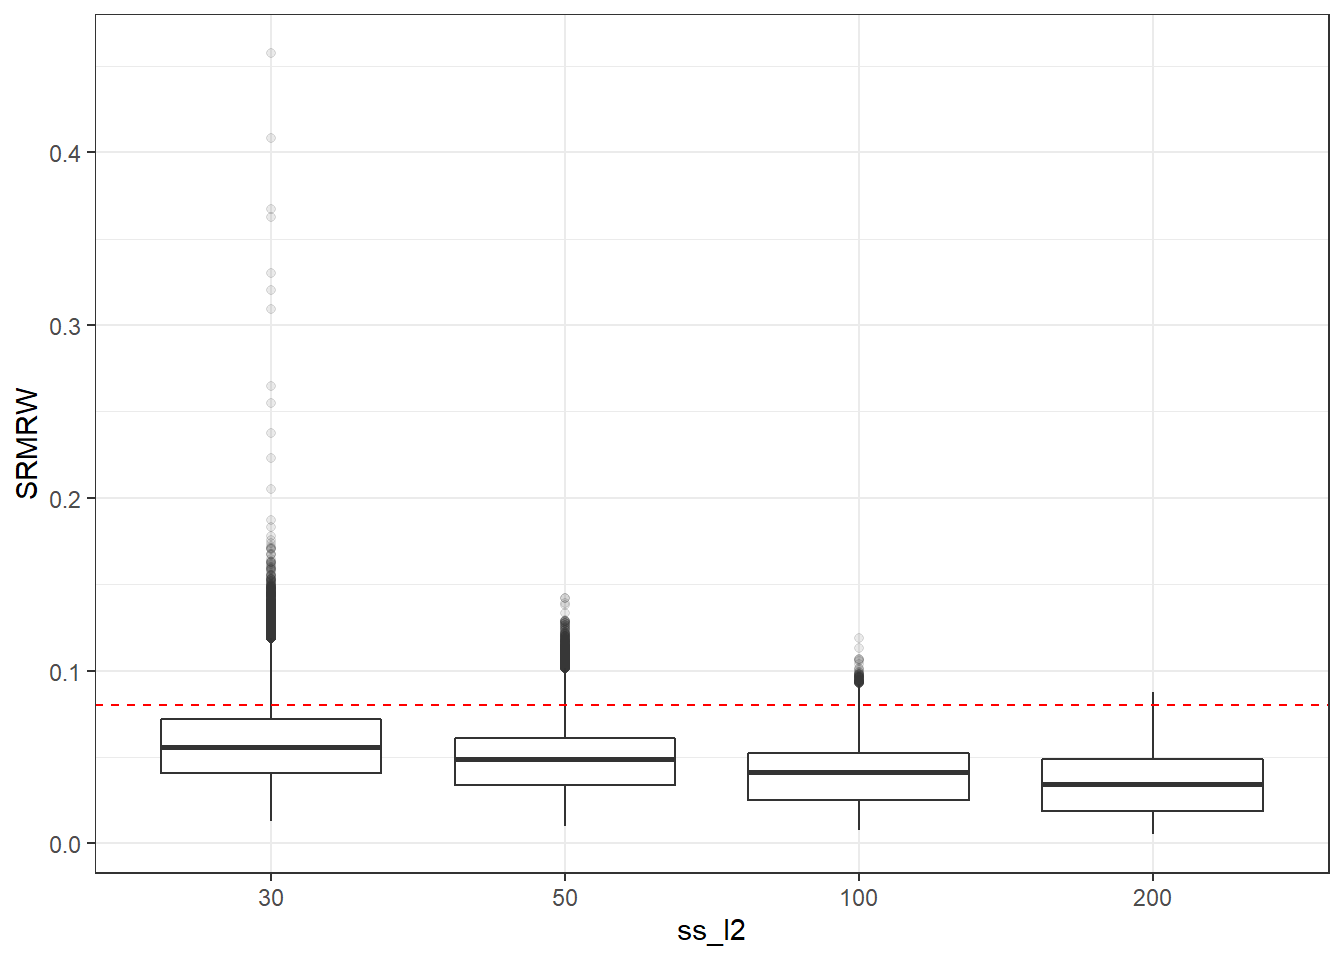
| Version | Author | Date |
|---|---|---|
| a1b0dc1 | noah-padgett | 2019-05-08 |
if(save.fig == T) ggsave("srmrw_marginal_ss_l2.pdf",plot = p, width=6, height=4, units='in')


p <- ggplot(mydata, aes(x=icc_ov,  y=SRMRW))+
    geom_boxplot(outlier.alpha = .1)+
    geom_abline(intercept = .08, slope=0,
                linetype='dashed', color = 'red') +
    labs(title = 'SRMRW by Obs. Var. ICC')
p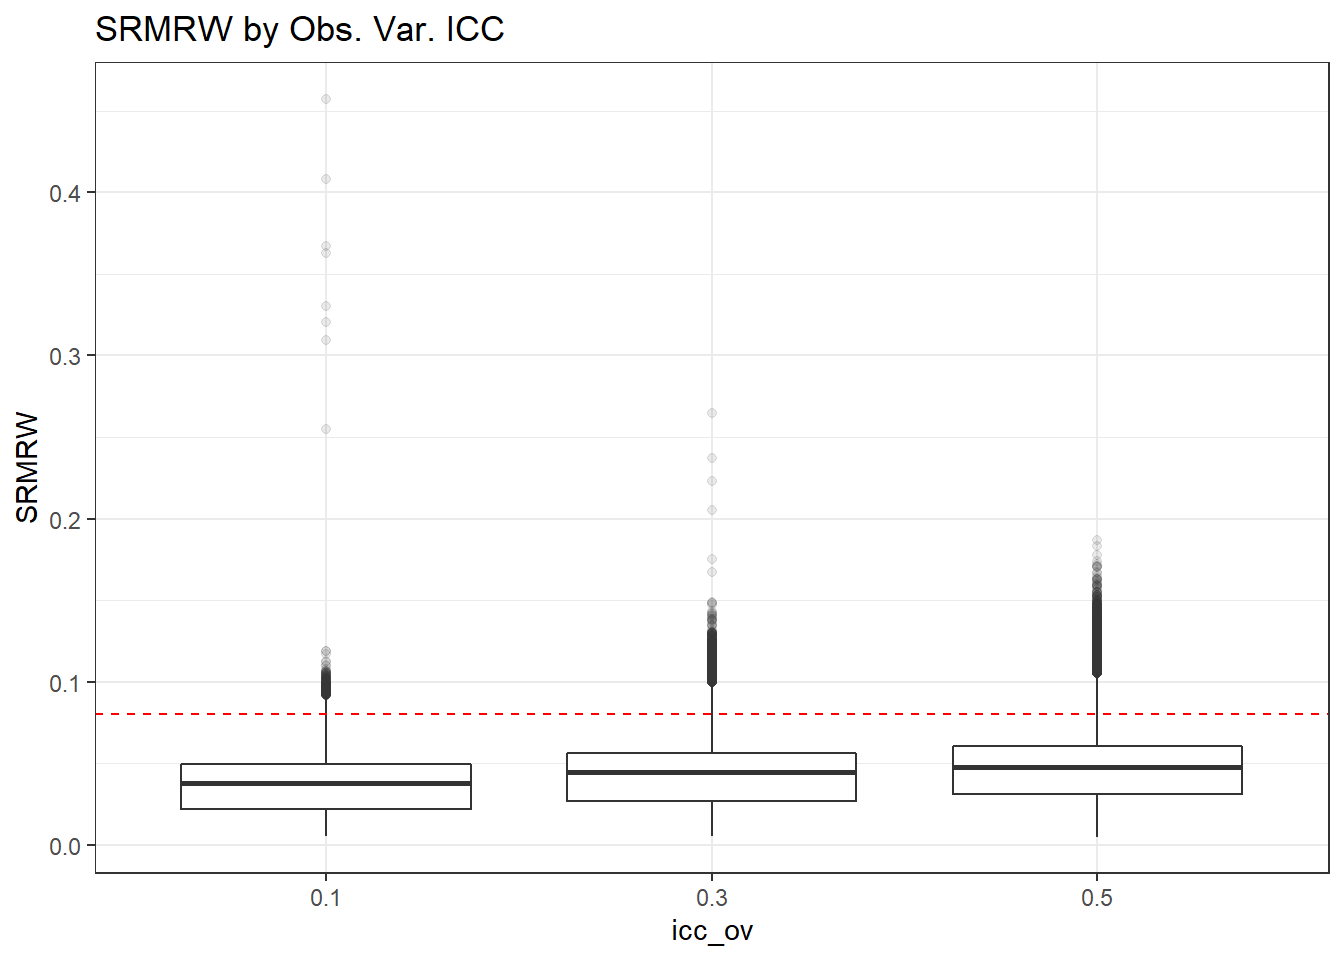
| Version | Author | Date |
|---|---|---|
| a1b0dc1 | noah-padgett | 2019-05-08 |
if(save.fig == T) ggsave("srmrw_marginal_icc_ov.pdf",plot = p, width=6, height=4, units='in')


p <- ggplot(mydata, aes(x=icc_lv, y=SRMRW))+
    geom_boxplot(outlier.alpha = .1)+
    geom_abline(intercept = .08, slope=0,
                linetype='dashed', color = 'red')
p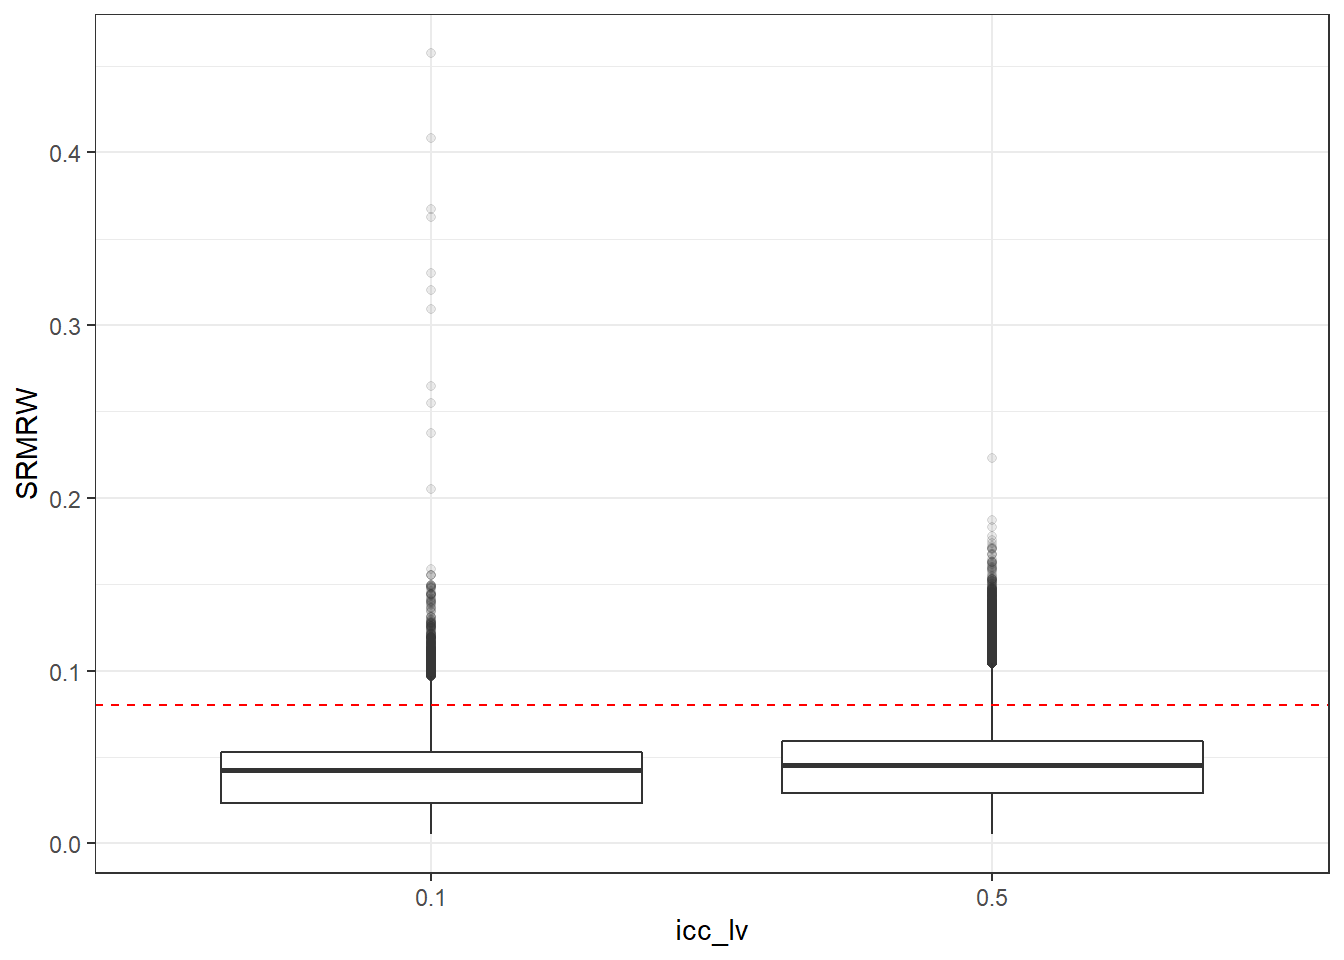
| Version | Author | Date |
|---|---|---|
| a1b0dc1 | noah-padgett | 2019-05-08 |
if(save.fig == T) ggsave("srmrw_marginal_icc_lv.pdf",plot = p, width=6, height=4, units='in')SRMRB
p <- ggplot(mydata, aes(x=Model, y=SRMRB))+
    geom_boxplot(outlier.alpha = .1)+
    geom_abline(intercept = .08, slope=0,
                linetype='dashed', color = 'red')+
    lims(y=c(0,1))
p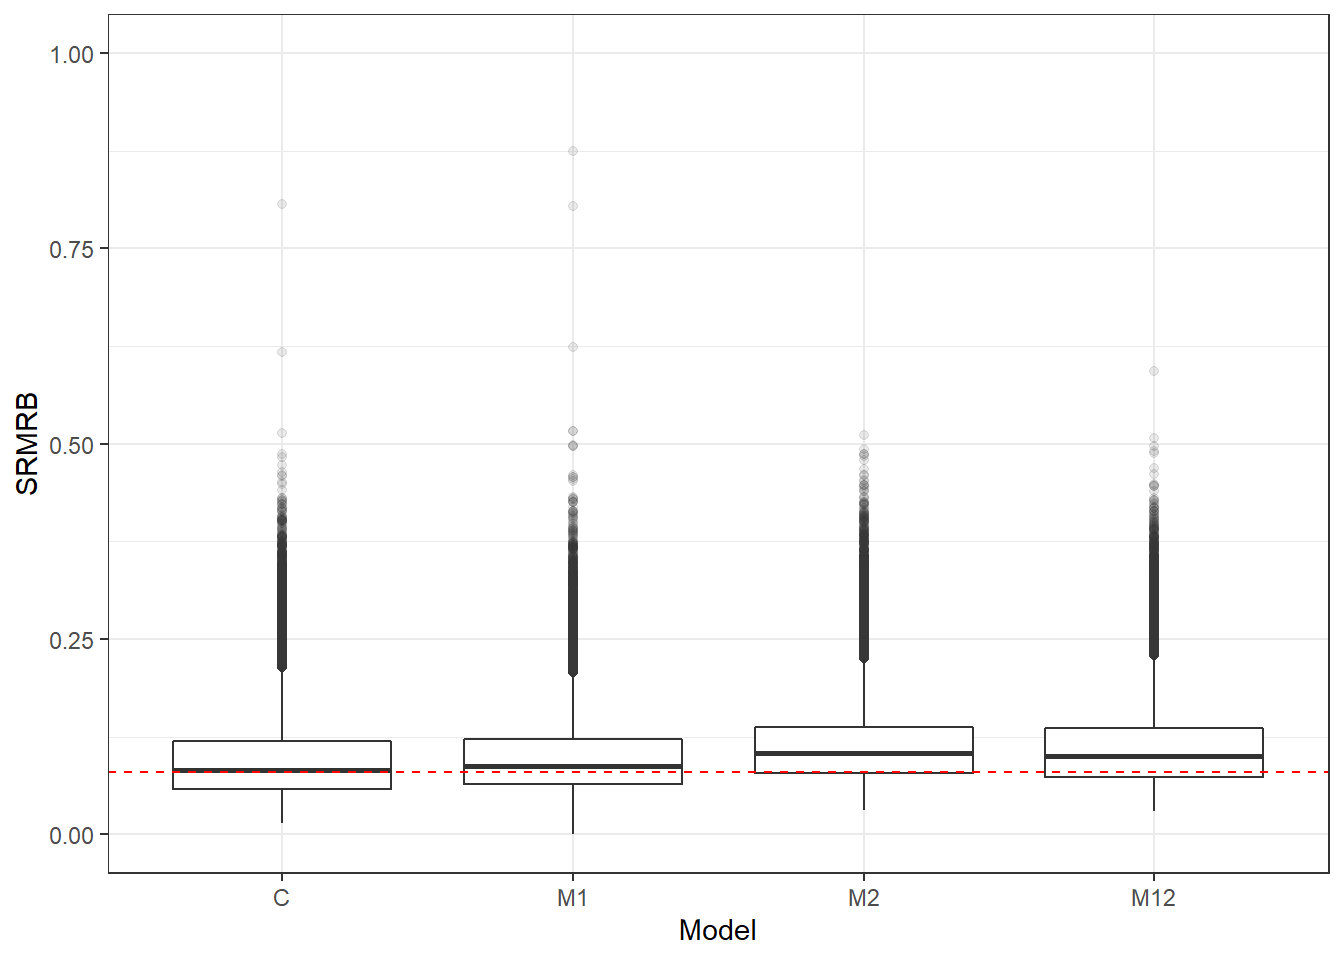
| Version | Author | Date |
|---|---|---|
| a1b0dc1 | noah-padgett | 2019-05-08 |
if(save.fig == T) ggsave("srmrb_marginal_model.pdf",plot = p, width=6, height=4, units='in')

p <- ggplot(mydata, aes(x=Estimator, y=SRMRB))+
    geom_boxplot(outlier.alpha = .1)+
    geom_abline(intercept = .08, slope=0,
                linetype='dashed', color = 'red')+
    lims(y=c(0,1))
p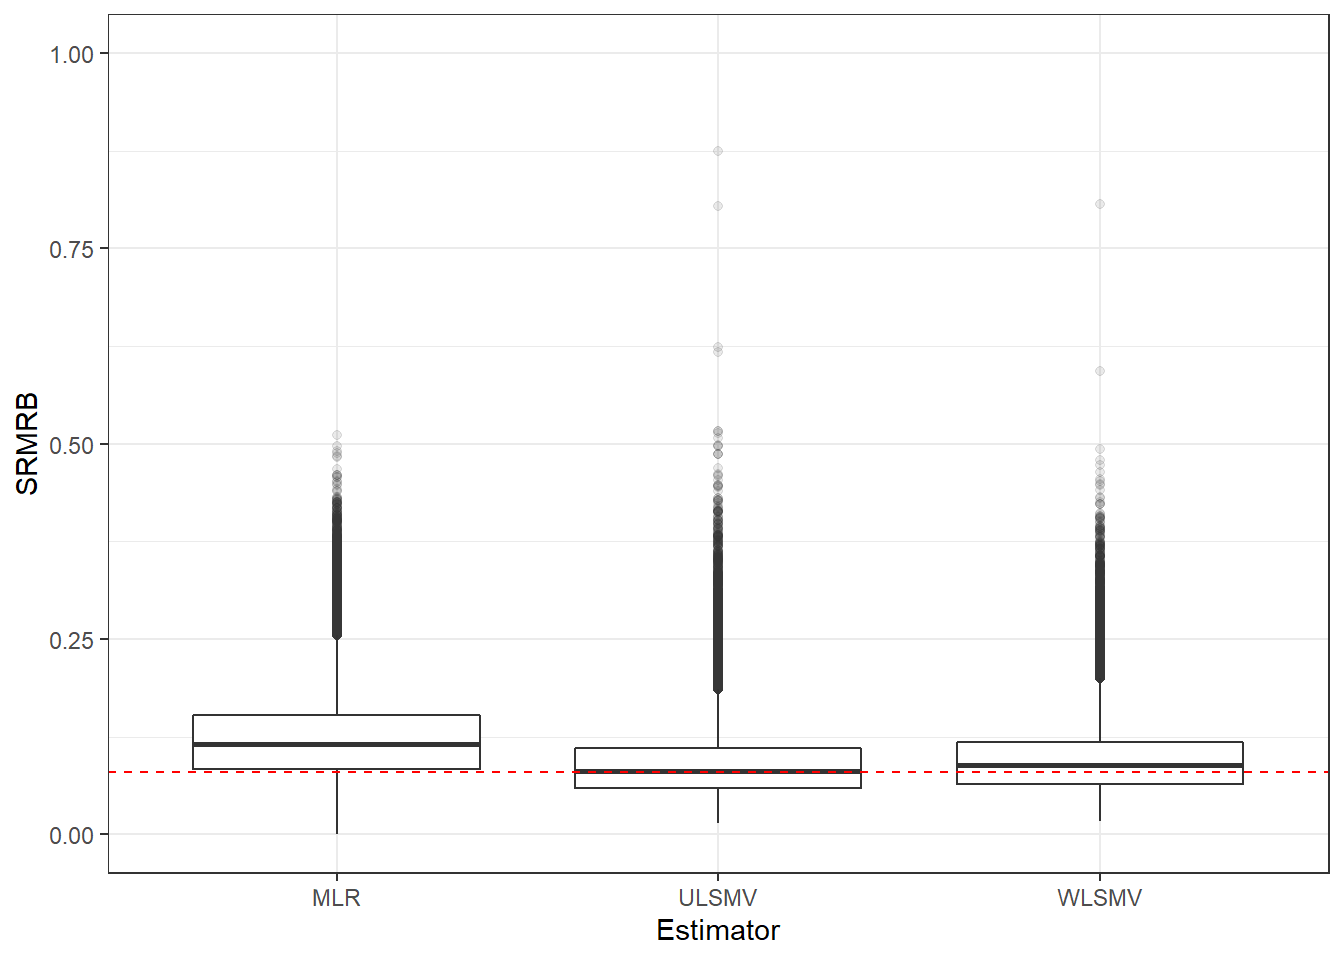
| Version | Author | Date |
|---|---|---|
| a1b0dc1 | noah-padgett | 2019-05-08 |
if(save.fig == T) ggsave("srmrb_marginal_estimator.pdf",plot = p, width=6, height=4, units='in')


p <- ggplot(mydata, aes(x=ss_l1, y=SRMRB))+
    geom_boxplot(outlier.alpha = .1)+
    geom_abline(intercept = .08, slope=0,
                linetype='dashed', color = 'red') +
    lims(y=c(0,1))
p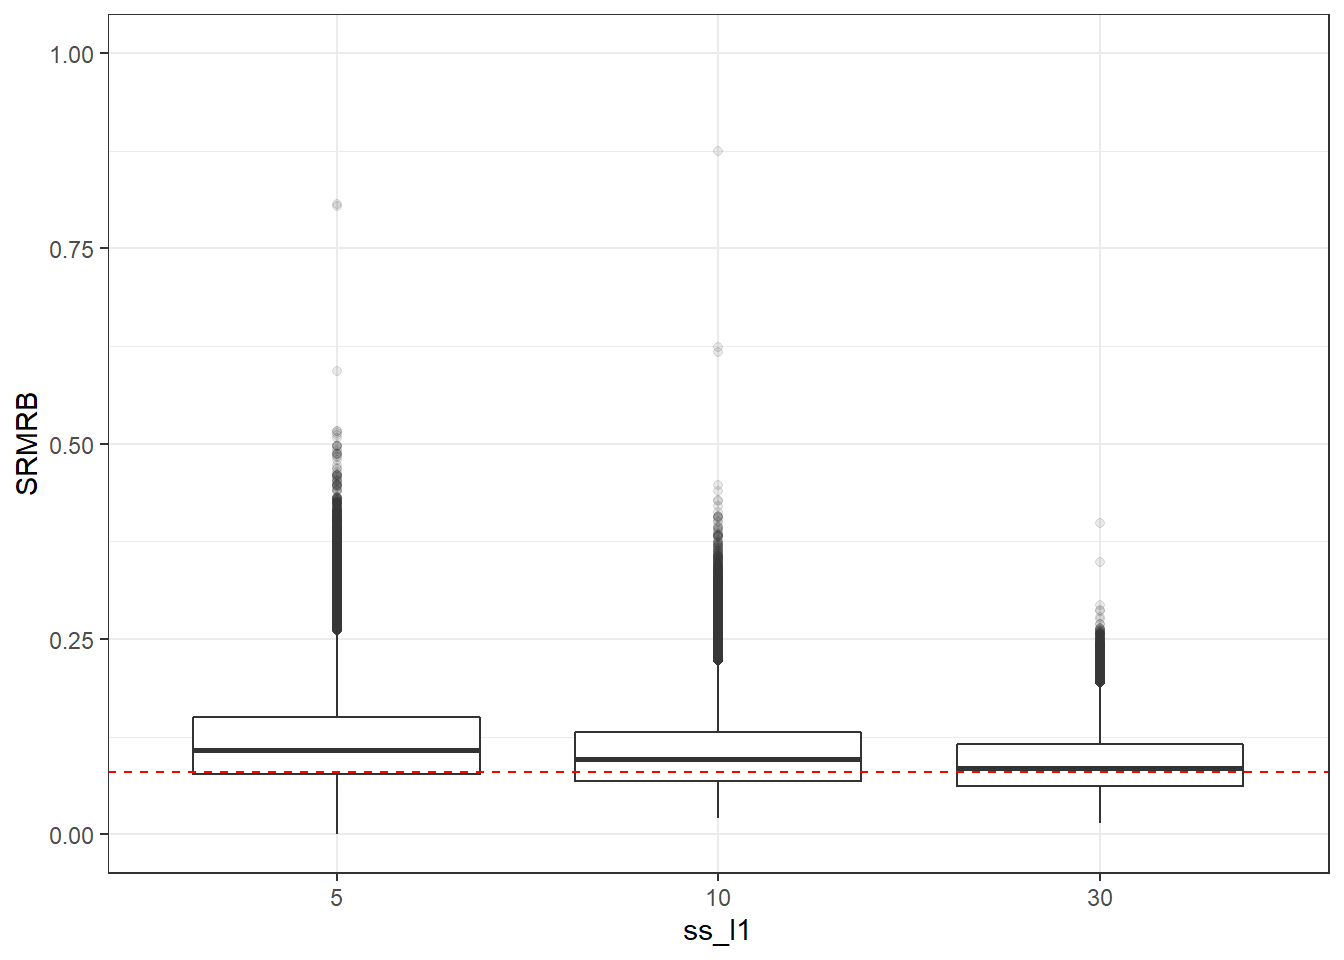
| Version | Author | Date |
|---|---|---|
| a1b0dc1 | noah-padgett | 2019-05-08 |
if(save.fig == T) ggsave("srmrb_marginal_ss_l1.pdf",plot = p, width=6, height=4, units='in')


p <- ggplot(mydata, aes(x=ss_l2,  y=SRMRB))+
    geom_boxplot(outlier.alpha = .1)+
    geom_abline(intercept = .08, slope=0,
                linetype='dashed', color = 'red') +
    labs(title = 'SRMRB by Level-2 Sample Size') +
    lims(y=c(0,1))
p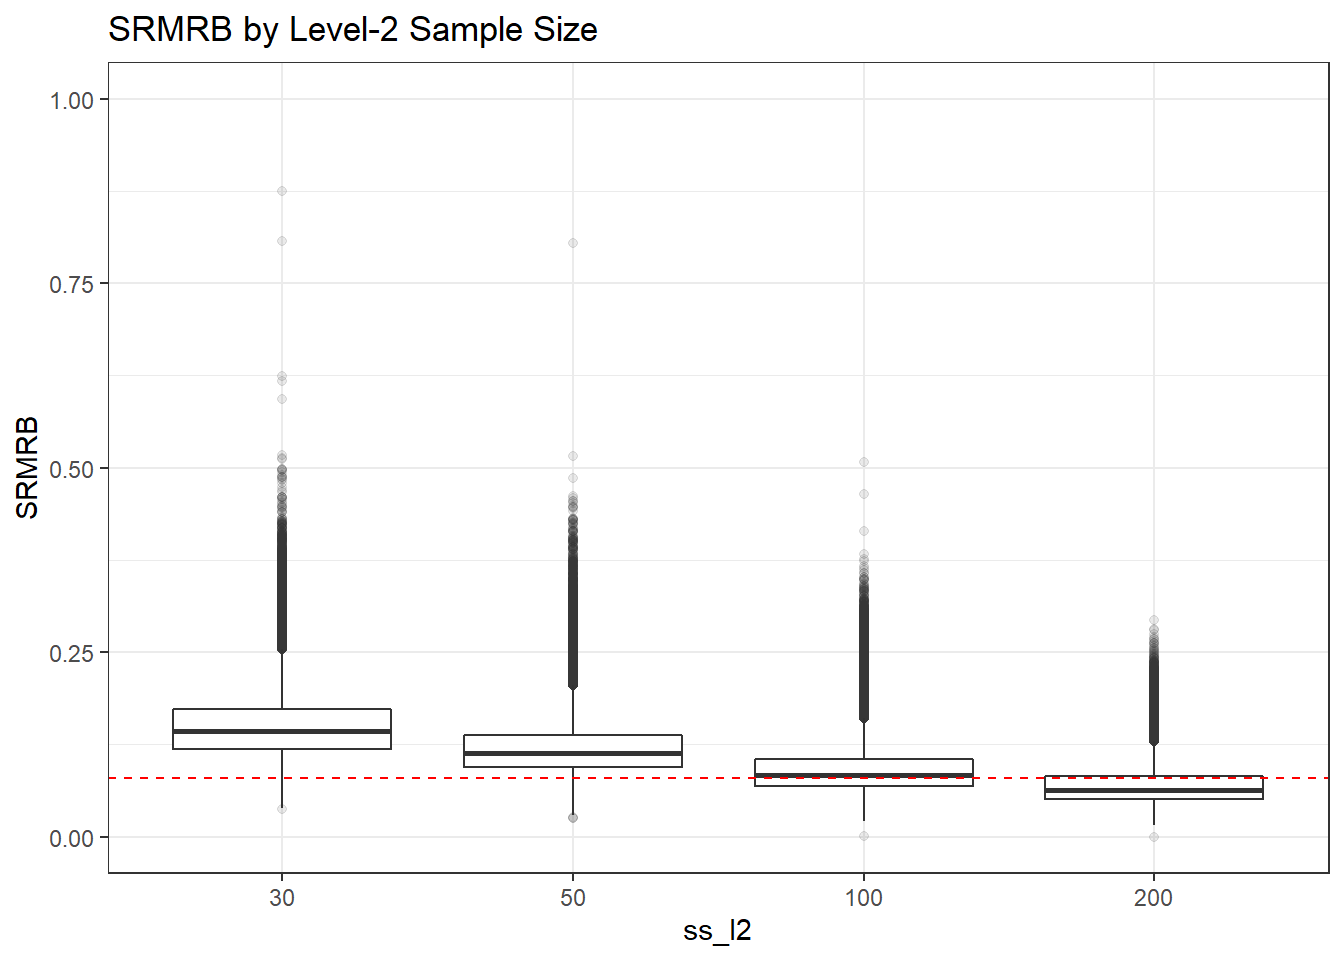
| Version | Author | Date |
|---|---|---|
| a1b0dc1 | noah-padgett | 2019-05-08 |
if(save.fig == T) ggsave("srmrb_marginal_ss_l2.pdf",plot = p, width=6, height=4, units='in')

p <- ggplot(mydata, aes(x=icc_ov,  y=SRMRB))+
    geom_boxplot(outlier.alpha = .1)+
    geom_abline(intercept = .08, slope=0,
                linetype='dashed', color = 'red') +
    lims(y=c(0,1))
p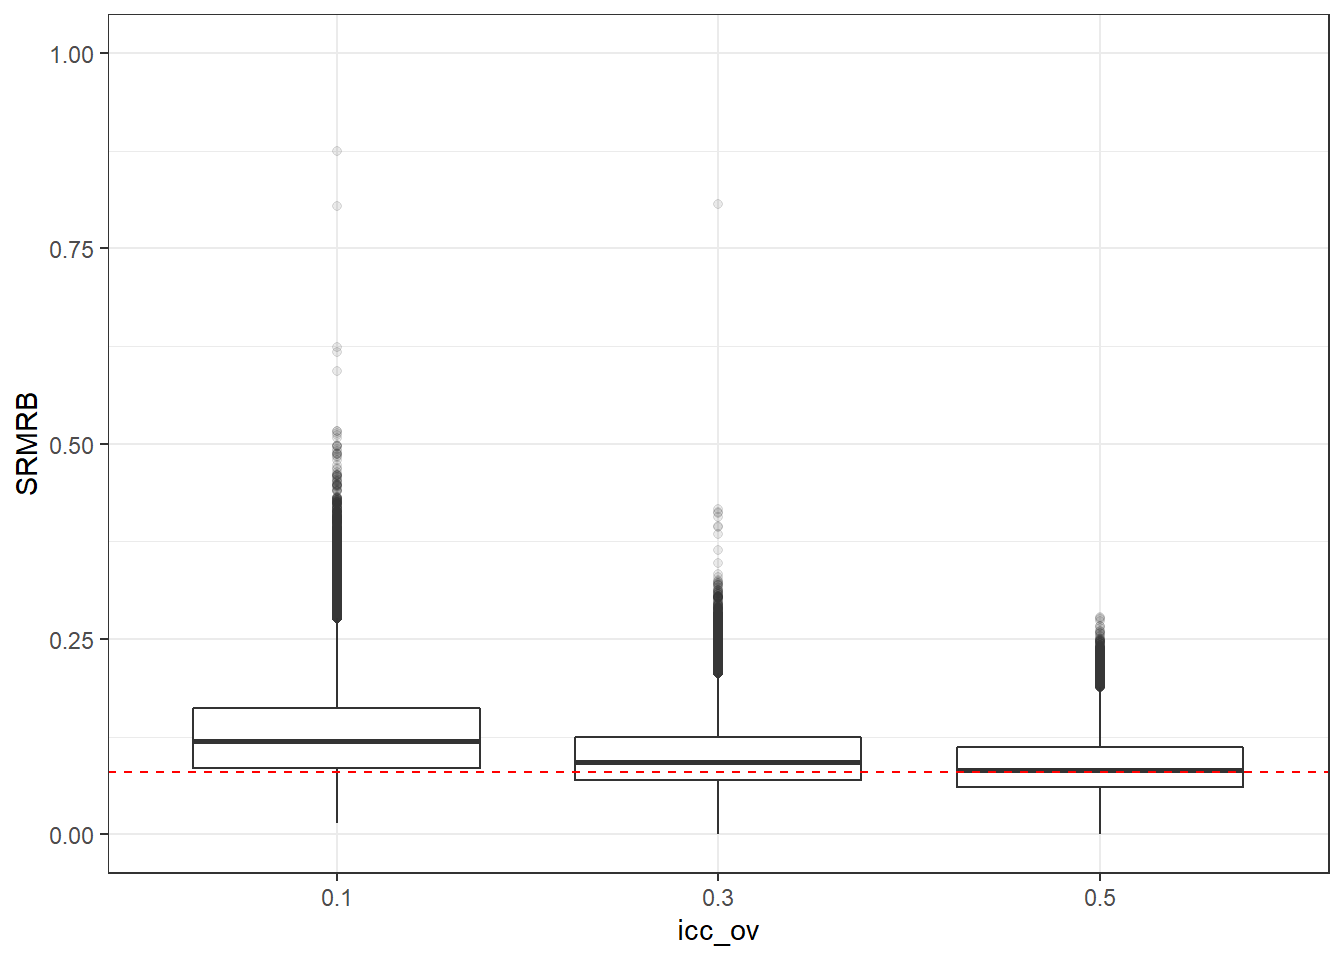
| Version | Author | Date |
|---|---|---|
| a1b0dc1 | noah-padgett | 2019-05-08 |
if(save.fig == T) ggsave("srmrb_marginal_icc_ov.pdf",plot = p, width=6, height=4, units='in')

p <- ggplot(mydata, aes(x=icc_lv, y=SRMRB))+
    geom_boxplot(outlier.alpha = .1)+
    geom_abline(intercept = .08, slope=0,
                linetype='dashed', color = 'red') +
    lims(y=c(0,1))
p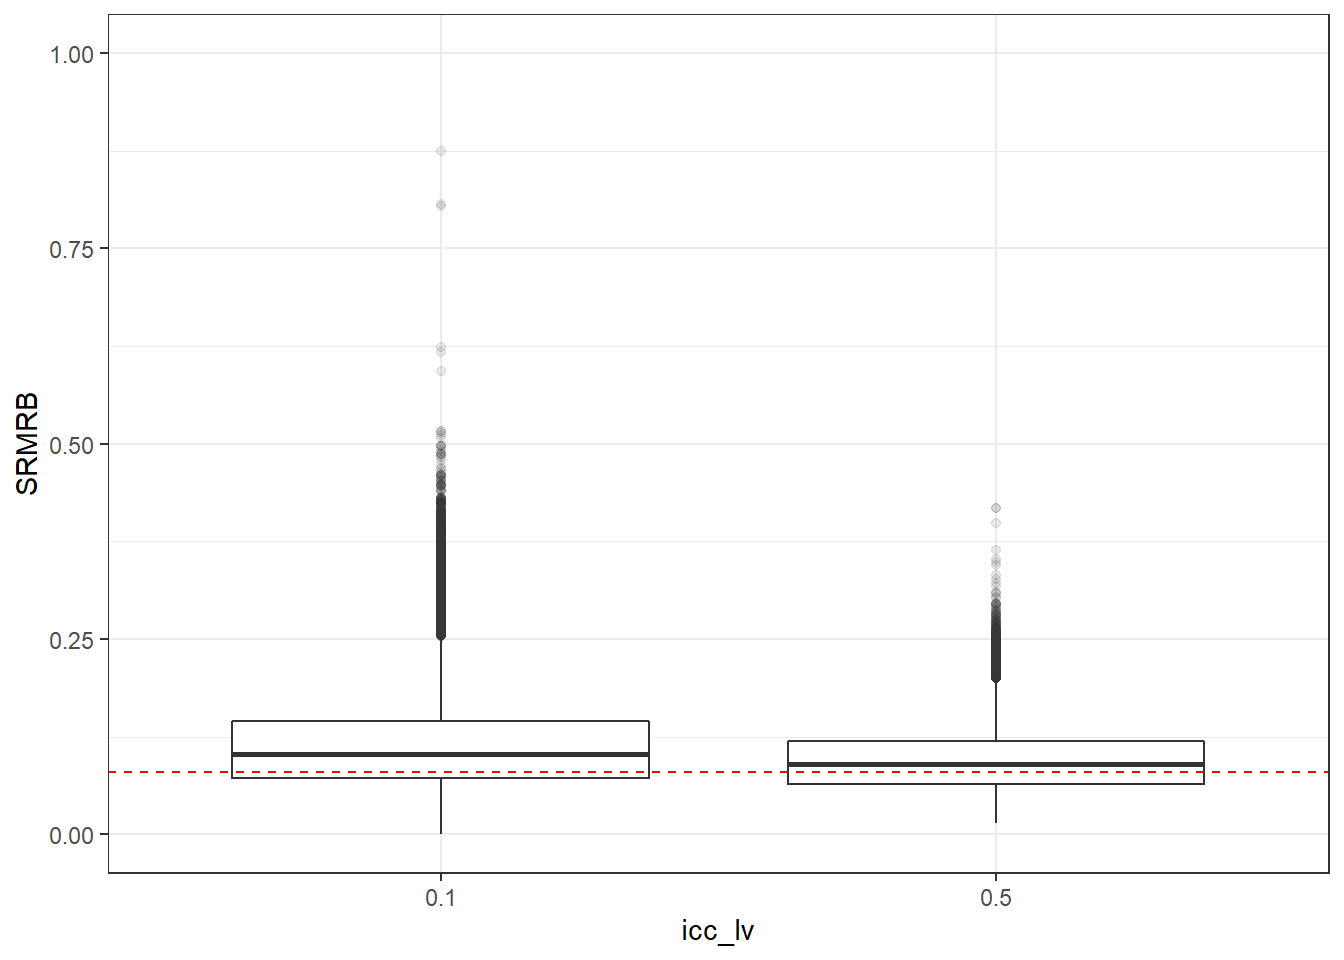
| Version | Author | Date |
|---|---|---|
| a1b0dc1 | noah-padgett | 2019-05-08 |
if(save.fig == T) ggsave("srmrb_marginal_icc_lv.pdf",plot = p, width=6, height=4, units='in')Facetted Boxplots
For the facetted boxplots, these will also be created in multiple sets.
- Full Results by conditions faetted by Model and estimator
- Marginal Plots of Condition (ss_l1, ss_l2, icc_ov, icc_lv) Facetted by Est.
- Marginal Plots of Condition (ss_l1, ss_l2, icc_ov, icc_lv) Facetted by Model
- Marginal Plots of Condition (ss_l1, ss_l2, icc_ov, icc_lv) Facetted by Est. and Model
So, that is a lot of plots and onyl a select few will make it into the final document and publication manuscript.
Faceted Coarse Boxplots
## Set 1: Large boxplot figures faceted by Model and Estimator
p <- ggplot(mydata, aes(x=Condition, y=CFI))+
    geom_boxplot(outlier.alpha = .1)+
    geom_abline(intercept = .95, slope=0,
                linetype='dashed', color = 'red') +
    facet_grid(Model~Estimator)
p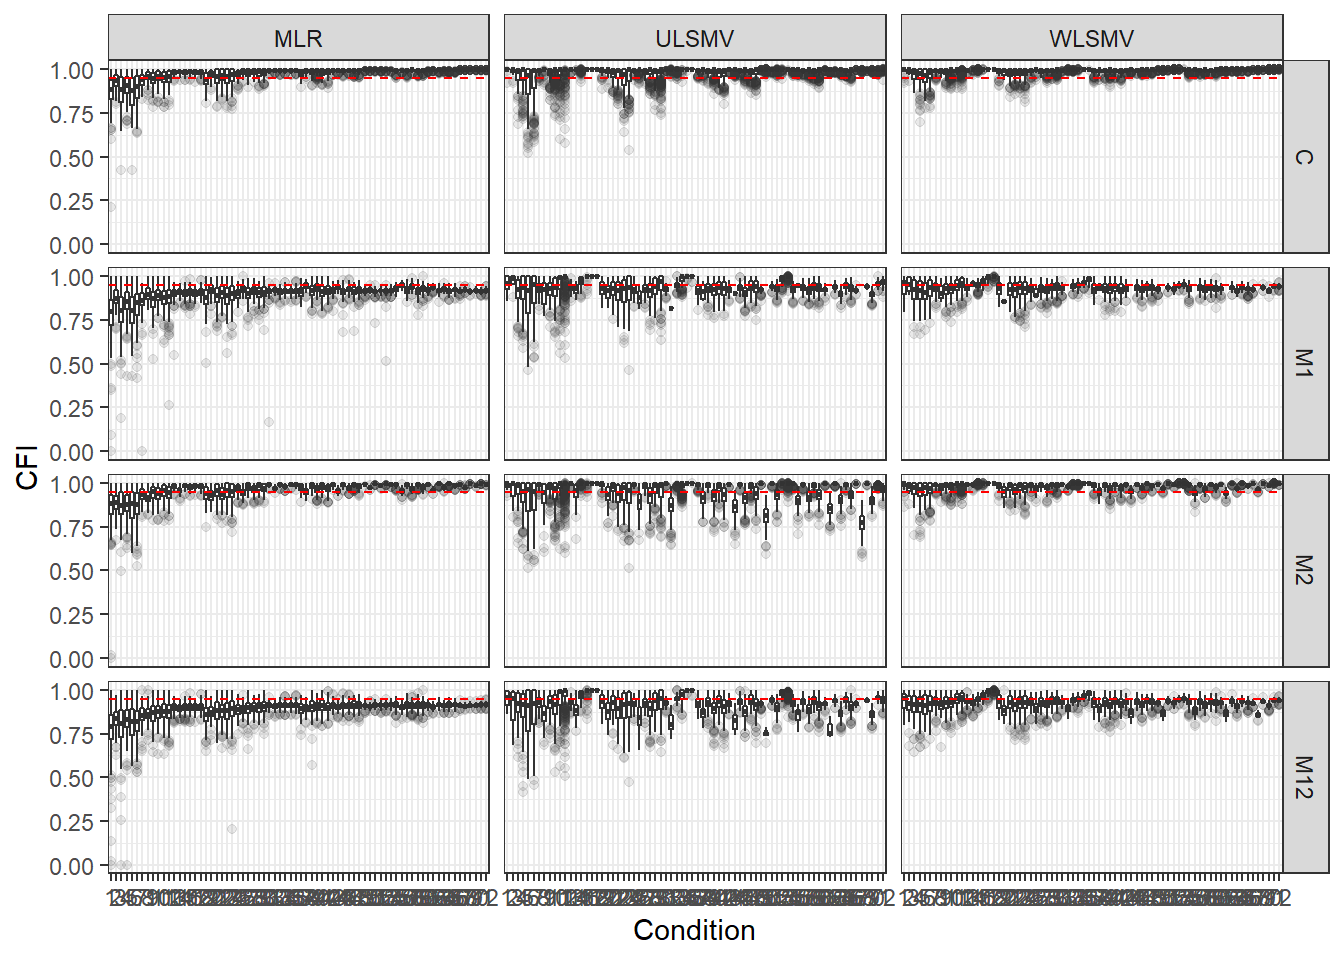
| Version | Author | Date |
|---|---|---|
| a1b0dc1 | noah-padgett | 2019-05-08 |
if(save.fig == T) ggsave("cfi_all_condition_facet.pdf",plot = p, width=16, height=12, units='in')

p <- ggplot(mydata, aes(x=Condition, y=TLI))+
    geom_boxplot(outlier.alpha = .1)+
    geom_abline(intercept = .95, slope=0,
                linetype='dashed', color = 'red') +
    facet_grid(Model~Estimator)
p
| Version | Author | Date |
|---|---|---|
| a1b0dc1 | noah-padgett | 2019-05-08 |
if(save.fig == T) ggsave("tli_all_condition_facet.pdf",plot = p, width=16, height=12, units='in')

p <- ggplot(mydata, aes(x=Condition, y=RMSEA))+
    geom_boxplot(outlier.alpha = .1)+
    geom_abline(intercept = .06, slope=0,
                linetype='dashed', color = 'red') +
    facet_grid(Model~Estimator)
p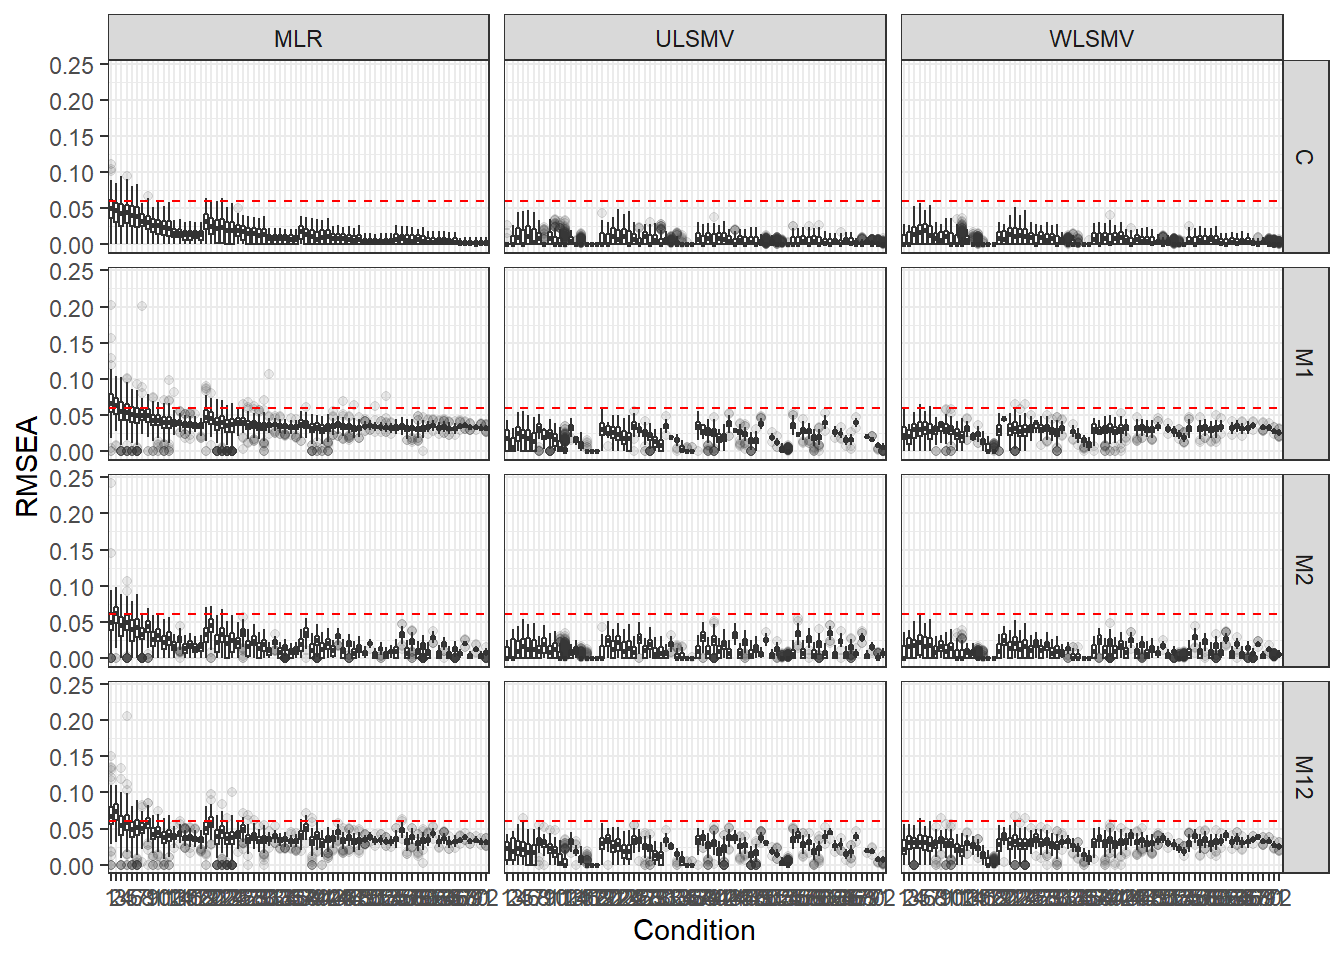
| Version | Author | Date |
|---|---|---|
| a1b0dc1 | noah-padgett | 2019-05-08 |
if(save.fig == T) ggsave("rmsea_all_condition_facet.pdf",plot = p, width=16, height=12, units='in')


p <- ggplot(mydata, aes(x=Condition, y=SRMRW))+
    geom_boxplot(outlier.alpha = .1)+
    geom_abline(intercept = .08, slope=0,
                linetype='dashed', color = 'red') +
    facet_grid(Model~Estimator)
p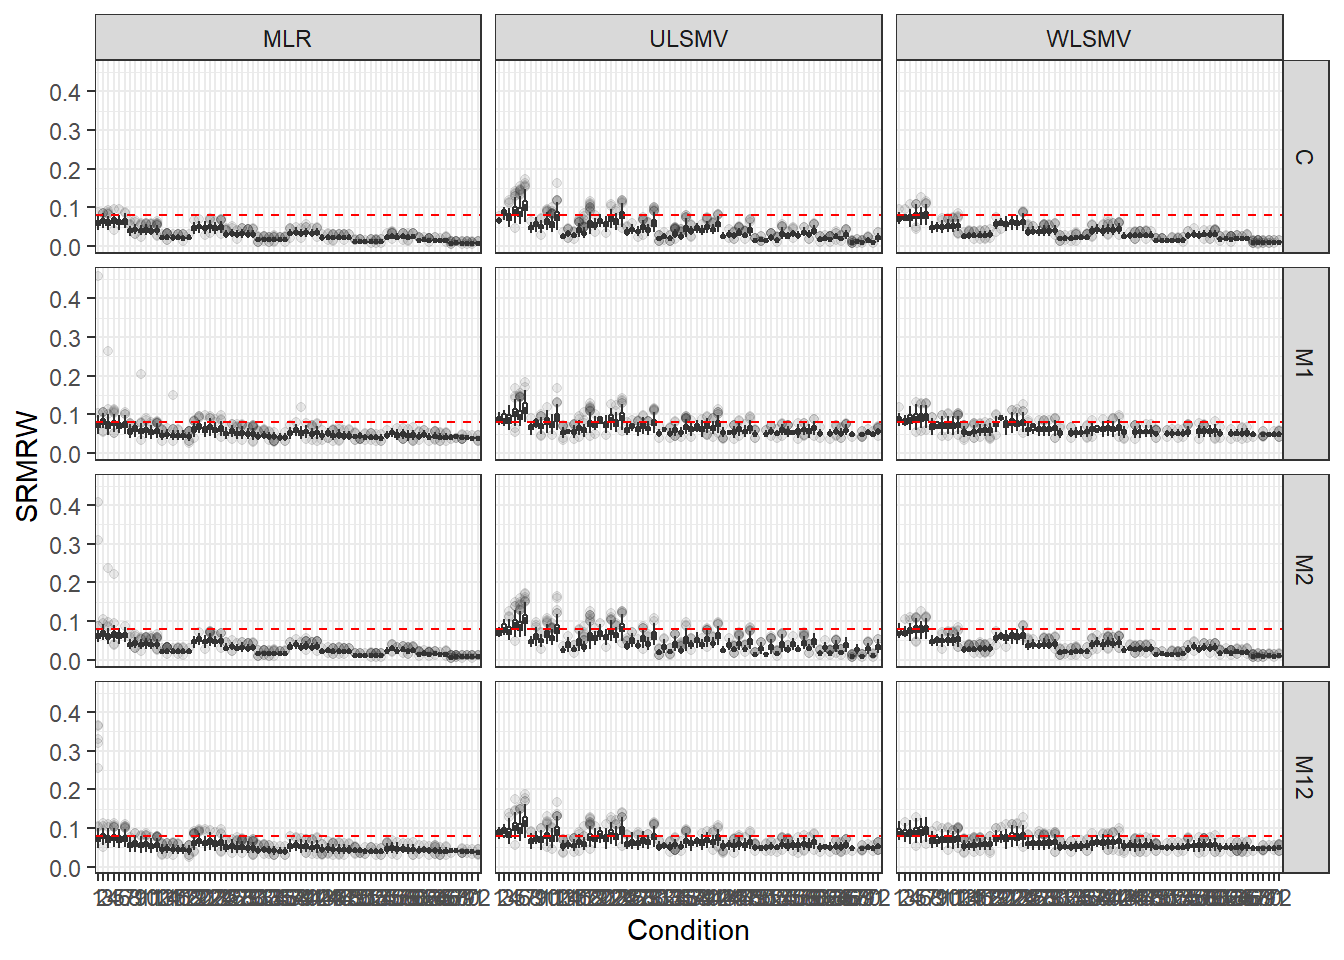
| Version | Author | Date |
|---|---|---|
| a1b0dc1 | noah-padgett | 2019-05-08 |
if(save.fig == T) ggsave("srmrw_all_condition_facet.pdf",plot = p, width=16, height=12, units='in')

p <- ggplot(mydata, aes(x=Condition, y=SRMRB))+
    geom_boxplot(outlier.alpha = .1)+
    geom_abline(intercept = .08, slope=0,
                linetype='dashed', color = 'red') +
    facet_grid(Model~Estimator) +
    lims(y=c(0,1))
p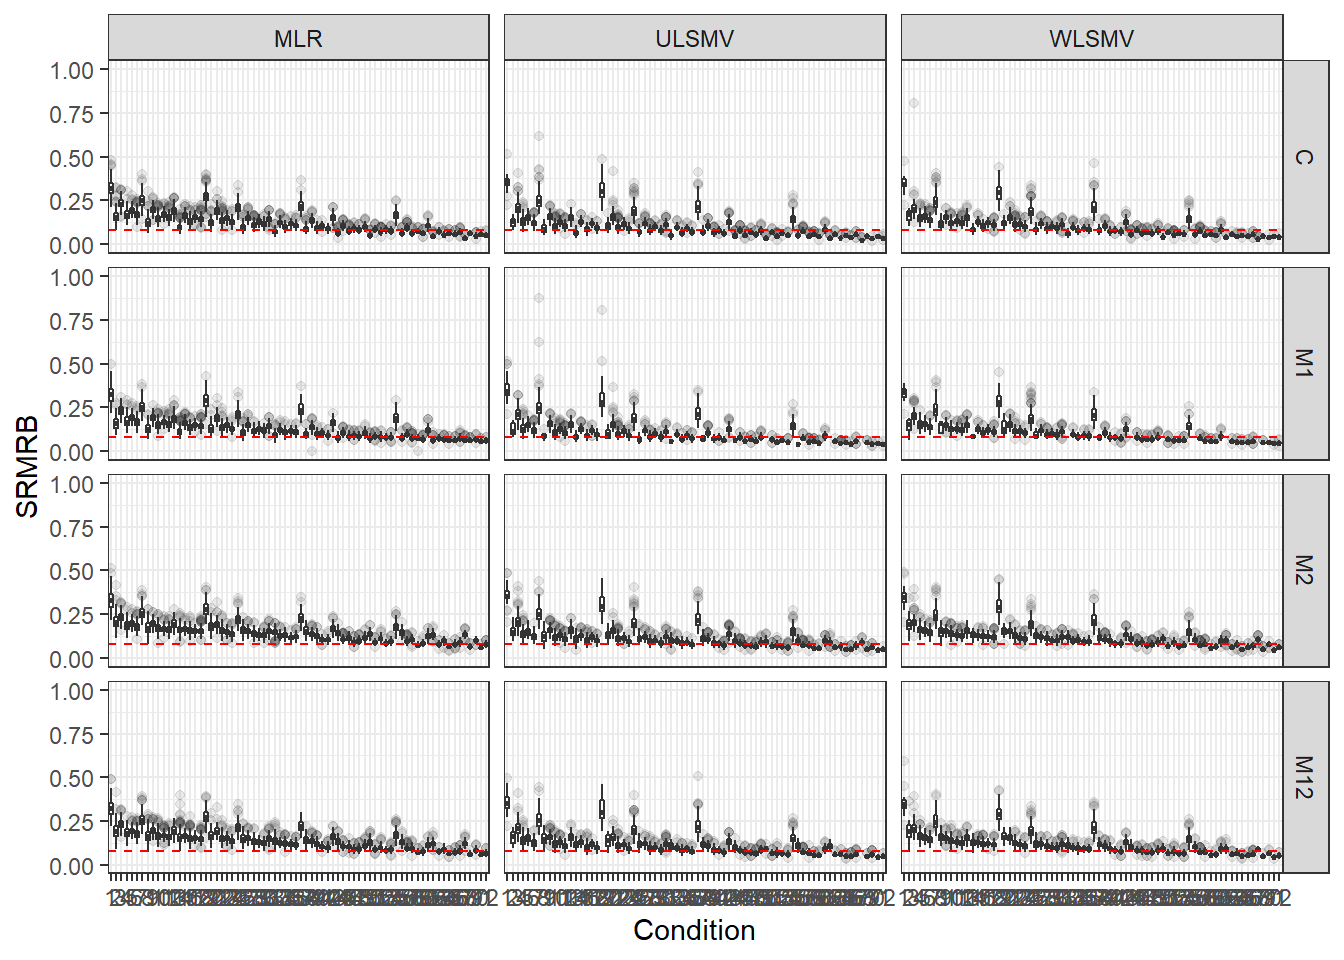
| Version | Author | Date |
|---|---|---|
| a1b0dc1 | noah-padgett | 2019-05-08 |
if(save.fig == T) ggsave("srmrb_all_condition_facet.pdf",plot = p, width=16, height=12, units='in')Marginal Plots of Conditions Facetted by Estimator
CFI
p <- ggplot(mydata, aes(x=ss_l1, y=CFI))+
    geom_boxplot(outlier.alpha = .1)+
    geom_abline(intercept = .95, slope=0,
                linetype='dashed', color = 'red') +
    facet_grid(.~Estimator)
p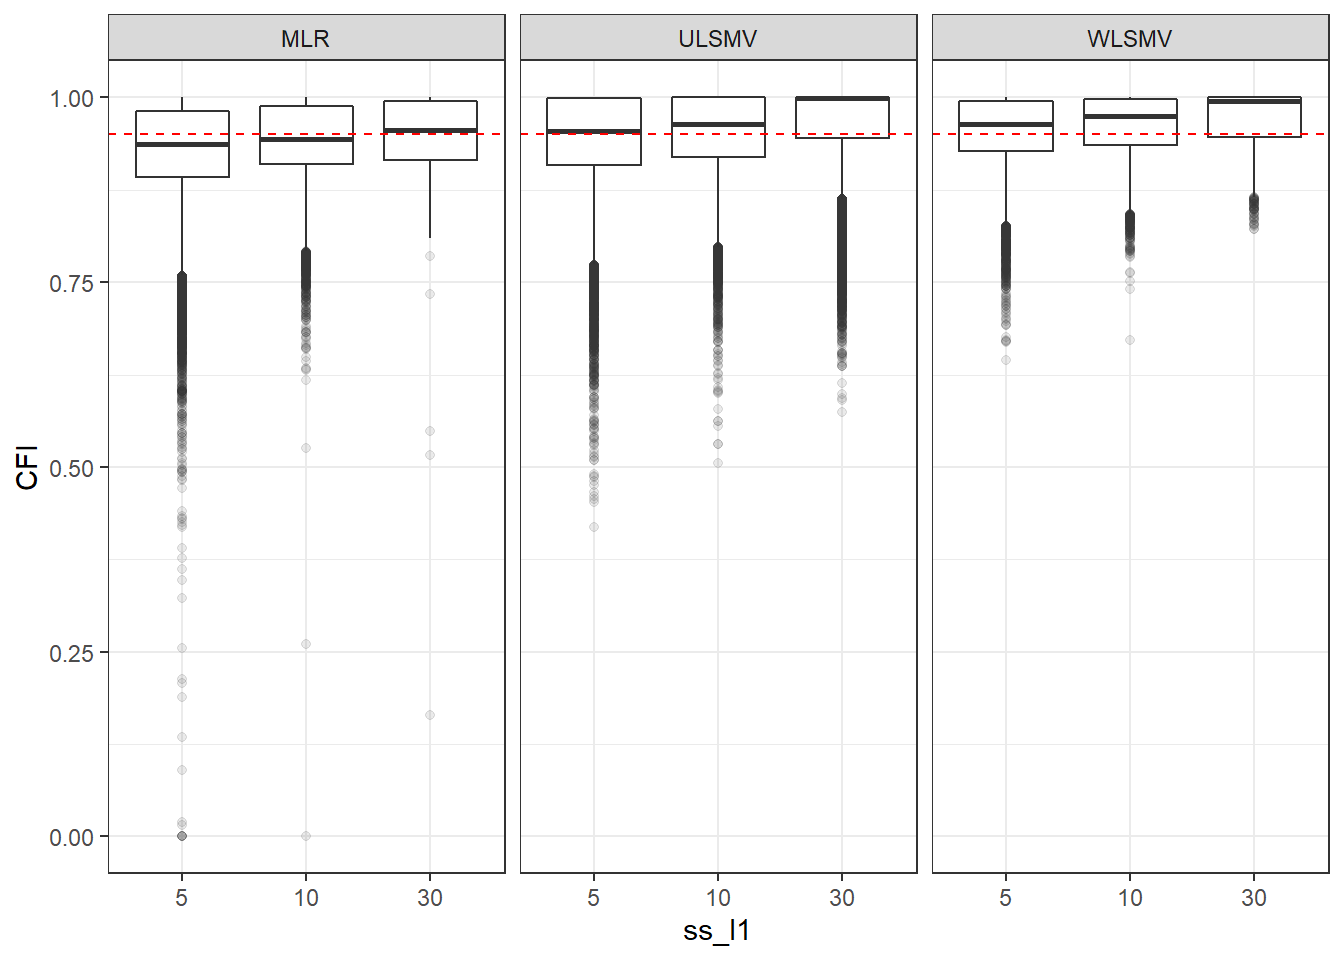
| Version | Author | Date |
|---|---|---|
| a1b0dc1 | noah-padgett | 2019-05-08 |
if(save.fig == T) ggsave("cfi_marginal_ssl1_facet_estimator.pdf",plot = p, width=6, height=4, units='in')


p <- ggplot(mydata, aes(x=ss_l2, y=CFI))+
    geom_boxplot(outlier.alpha = .1)+
    geom_abline(intercept = .95, slope=0,
                linetype='dashed', color = 'red') +
    facet_grid(.~Estimator)+
    labs(title = 'CFI by Level-2 Sample Size')
p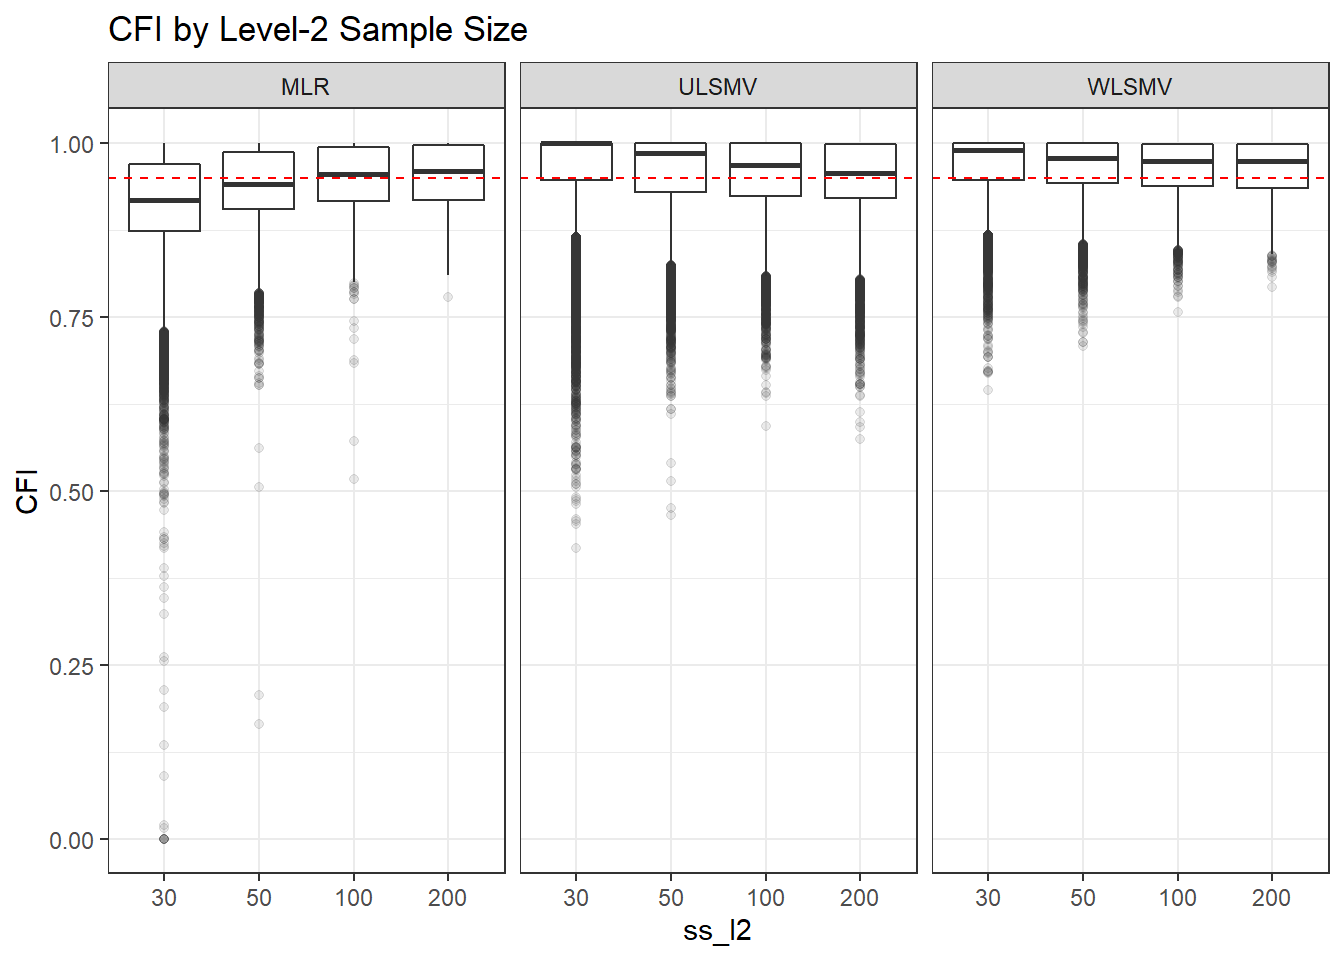
| Version | Author | Date |
|---|---|---|
| a1b0dc1 | noah-padgett | 2019-05-08 |
if(save.fig == T) ggsave("cfi_marginal_ss_l2_facet_estimator.pdf",plot = p, width=6, height=4, units='in')


p <- ggplot(mydata, aes(x=icc_ov, y=CFI))+
    geom_boxplot(outlier.alpha = .1)+
    geom_abline(intercept = .95, slope=0,
                linetype='dashed', color = 'red') +
    facet_grid(.~Estimator)
p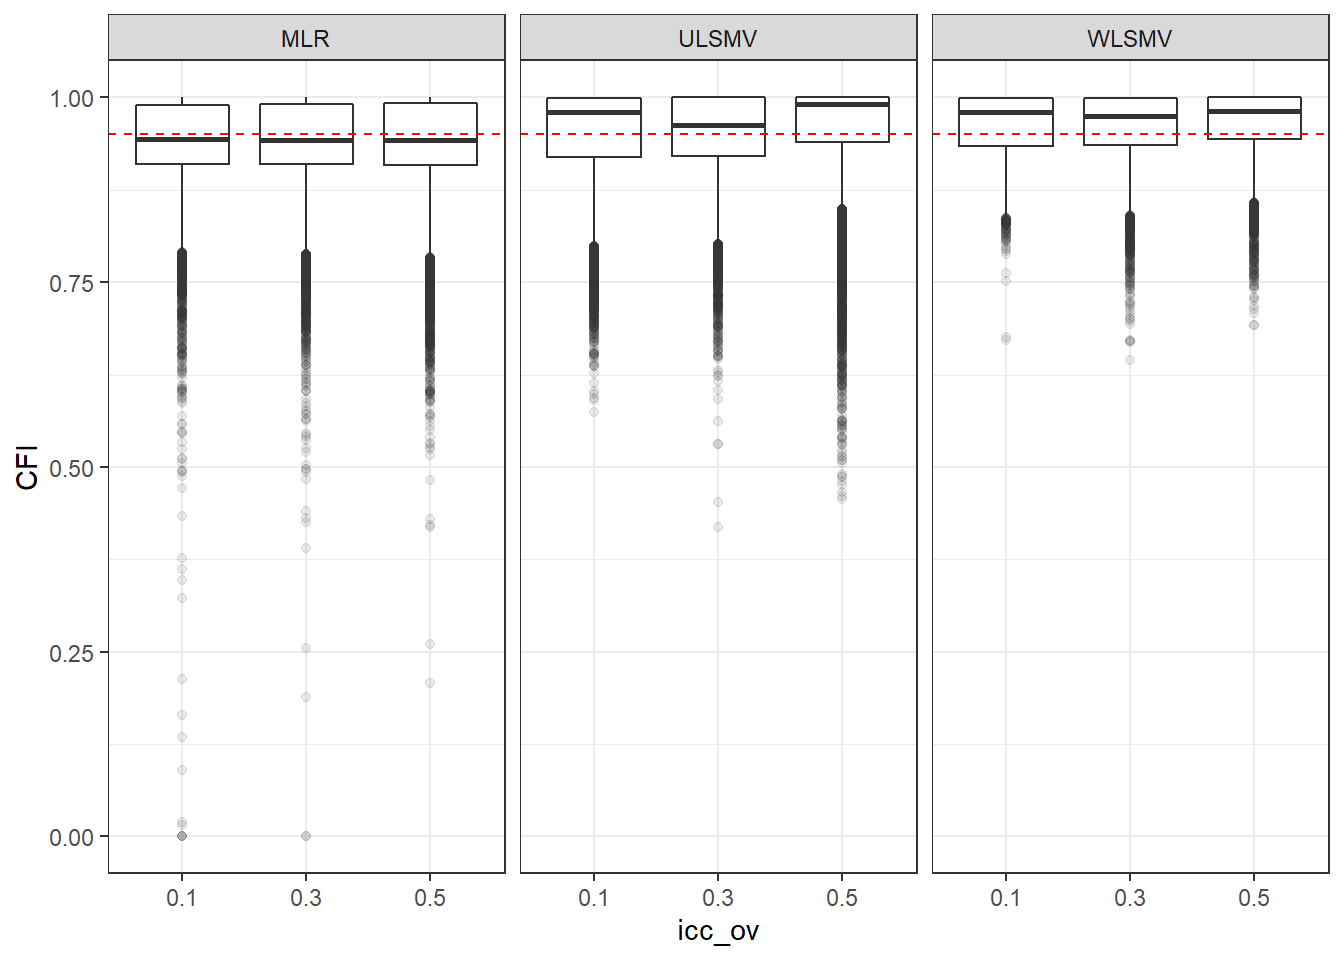
| Version | Author | Date |
|---|---|---|
| a1b0dc1 | noah-padgett | 2019-05-08 |
if(save.fig == T) ggsave("cfi_marginal_icc_ov_facet_estimator.pdf",plot = p, width=6, height=4, units='in')


p <- ggplot(mydata, aes(x=icc_lv, y=CFI))+
    geom_boxplot(outlier.alpha = .1)+
    geom_abline(intercept = .95, slope=0,
                linetype='dashed', color = 'red') +
    facet_grid(.~Estimator)
p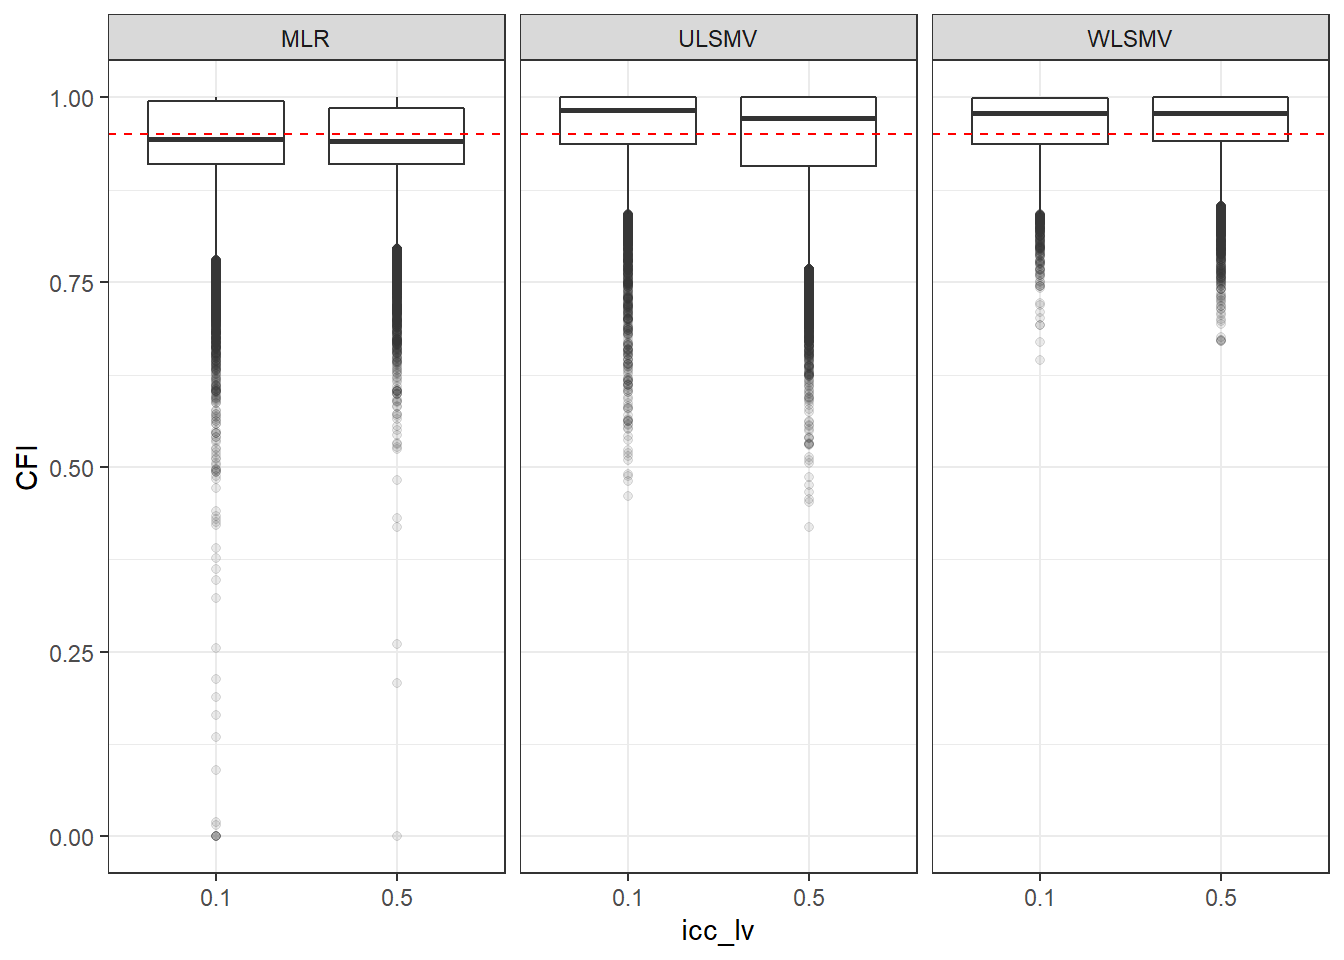
| Version | Author | Date |
|---|---|---|
| a1b0dc1 | noah-padgett | 2019-05-08 |
if(save.fig == T) ggsave("cfi_marginal_icc_lv_facet_estimator.pdf",plot = p, width=6, height=4, units='in')TLI
p <- ggplot(mydata, aes(x=ss_l1, y=TLI))+
    geom_boxplot(outlier.alpha = .1)+
    geom_abline(intercept = .95, slope=0,
                linetype='dashed', color = 'red') +
    facet_grid(.~Estimator)
p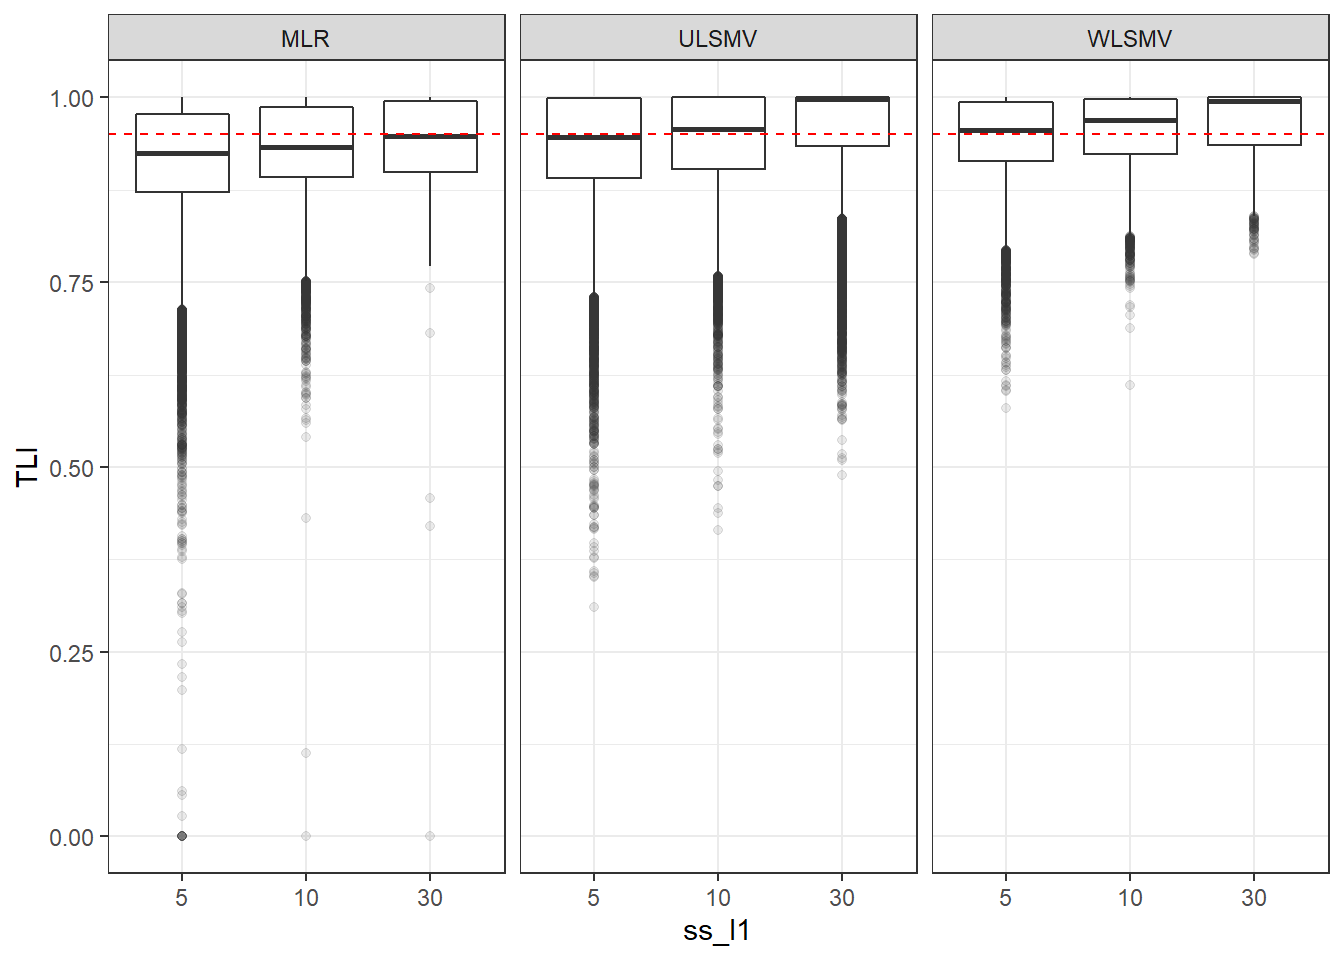
| Version | Author | Date |
|---|---|---|
| a1b0dc1 | noah-padgett | 2019-05-08 |
if(save.fig == T) ggsave("tli_marginal_ss_l1_facet_estimator.pdf",plot = p, width=6, height=4, units='in')


p <- ggplot(mydata, aes(x=ss_l2, y=TLI))+
    geom_boxplot(outlier.alpha = .1)+
    geom_abline(intercept = .95, slope=0,
                linetype='dashed', color = 'red') +
    facet_grid(.~Estimator)
p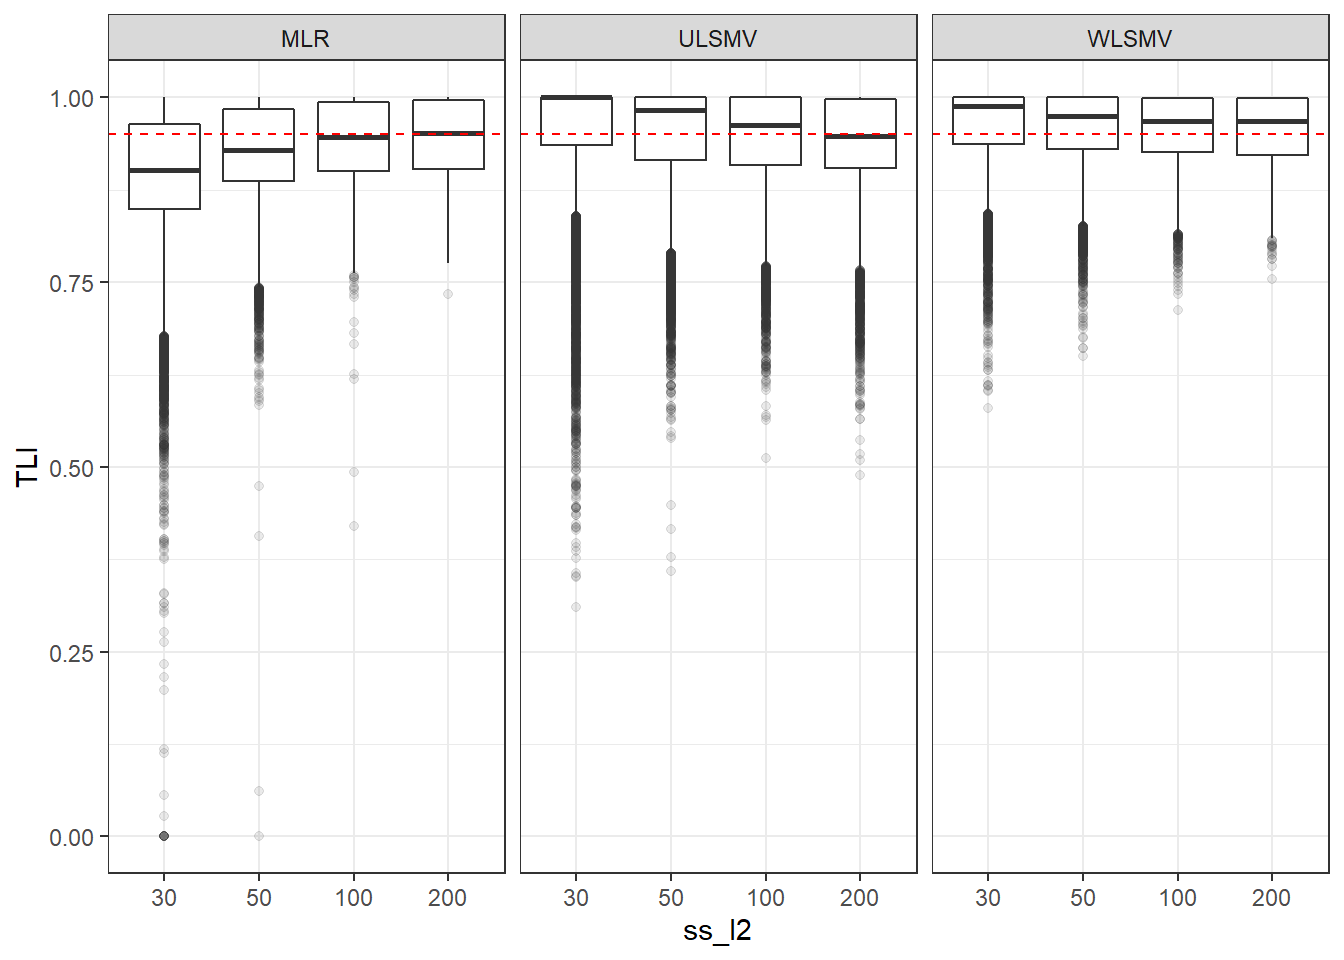
| Version | Author | Date |
|---|---|---|
| a1b0dc1 | noah-padgett | 2019-05-08 |
if(save.fig == T) ggsave("tli_marginal_ss_l2_facet_estimator.pdf",plot = p, width=6, height=4, units='in')

p <- ggplot(mydata, aes(x=icc_ov, y=TLI))+
    geom_boxplot(outlier.alpha = .1)+
    geom_abline(intercept = .95, slope=0,
                linetype='dashed', color = 'red') +
    facet_grid(.~Estimator)
p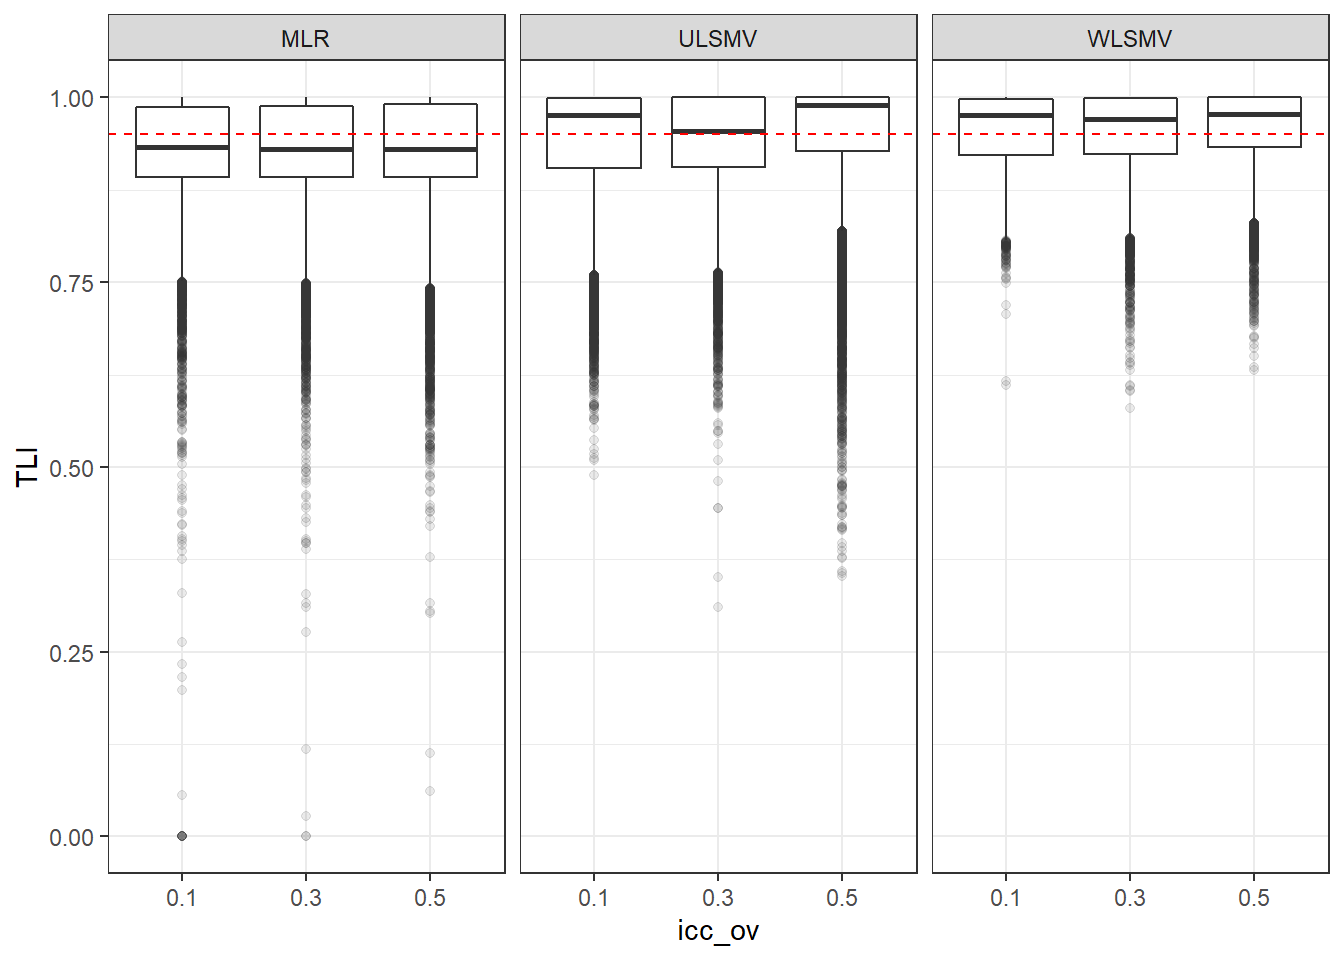
| Version | Author | Date |
|---|---|---|
| a1b0dc1 | noah-padgett | 2019-05-08 |
if(save.fig == T) ggsave("tli_marginal_icc_ov_facet_estimator.pdf",plot = p, scale=1)

p <- ggplot(mydata, aes(x=icc_lv, y=TLI))+
    geom_boxplot(outlier.alpha = .1)+
    geom_abline(intercept = .95, slope=0,
                linetype='dashed', color = 'red') +
    facet_grid(.~Estimator)
p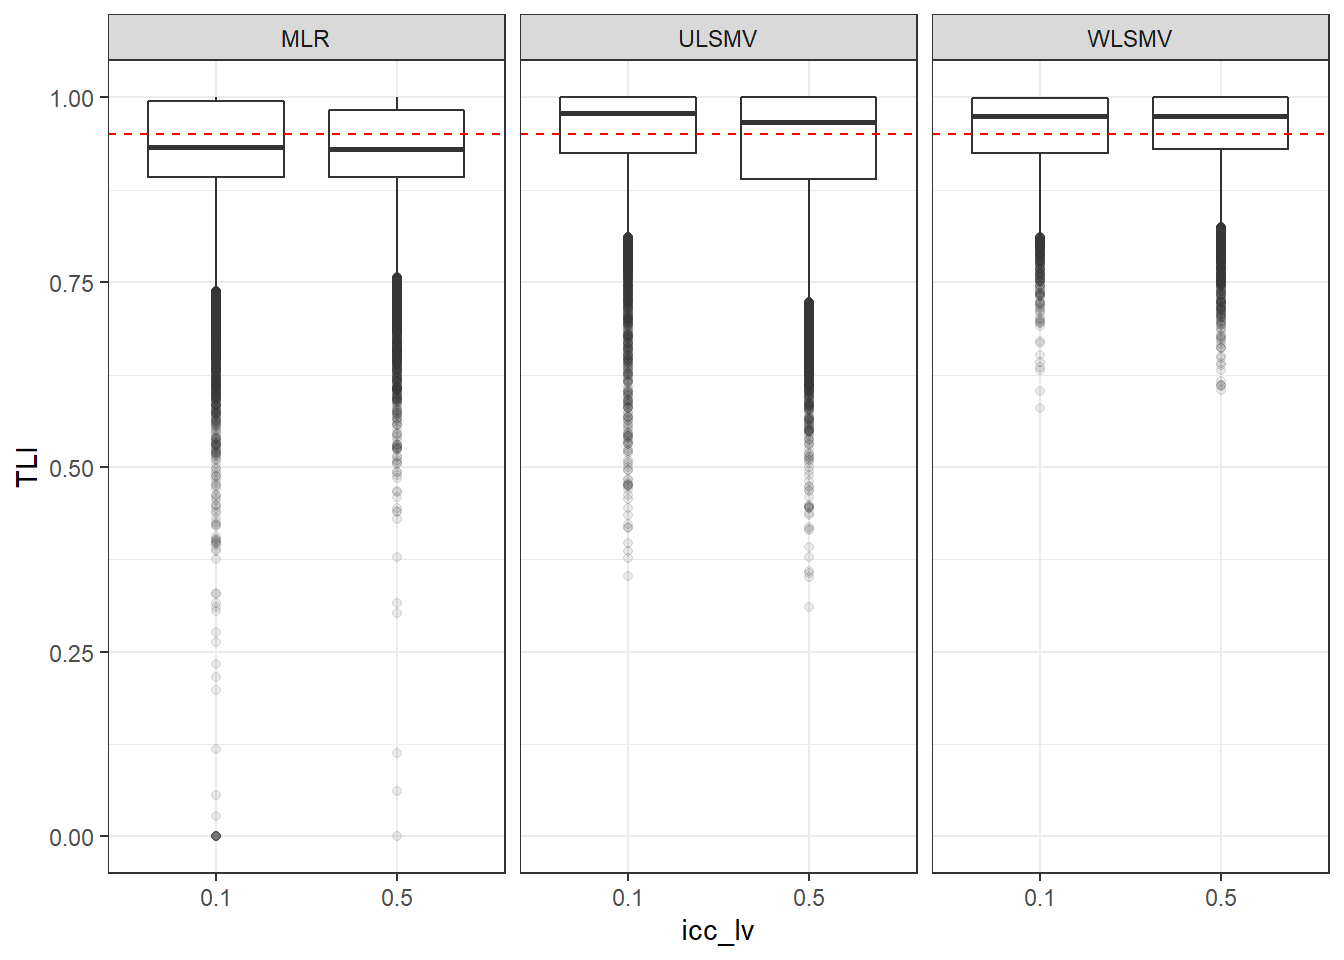
| Version | Author | Date |
|---|---|---|
| a1b0dc1 | noah-padgett | 2019-05-08 |
if(save.fig == T) ggsave("tli_marginal_icc_lv_facet_estimator.pdf",plot = p, width=6, height=4, units='in')RMSEA
p <- ggplot(mydata, aes(x=ss_l1, y=RMSEA))+
    geom_boxplot(outlier.alpha = .1)+
    geom_abline(intercept = .06, slope=0,
                linetype='dashed', color = 'red') +
    facet_grid(.~Estimator)
p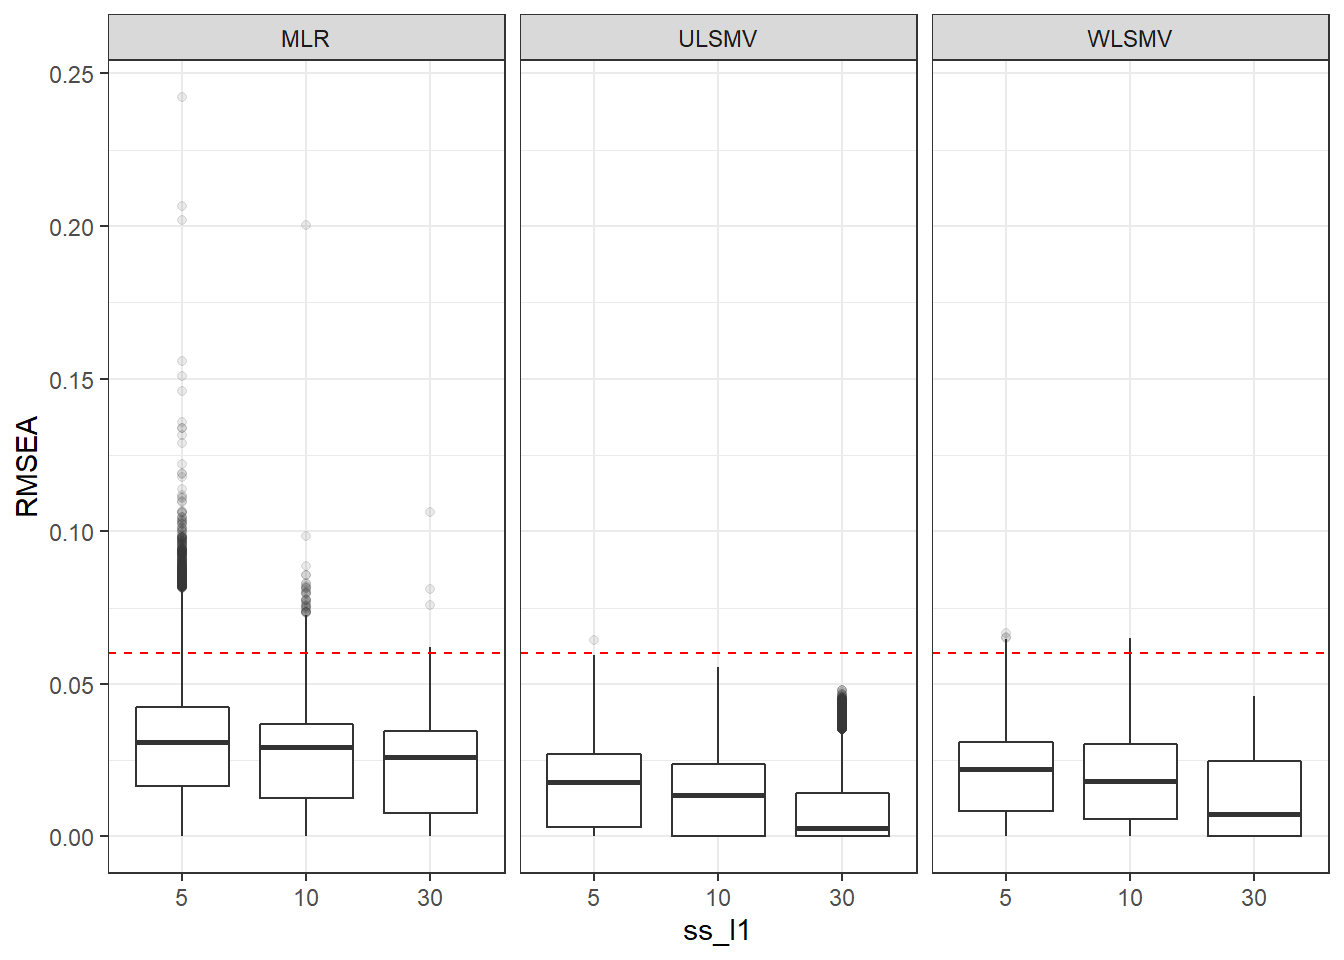
| Version | Author | Date |
|---|---|---|
| a1b0dc1 | noah-padgett | 2019-05-08 |
if(save.fig == T) ggsave("rmsea_marginal_ss_l1_facet_estimator.pdf",plot = p, width=6, height=4, units='in')


p <- ggplot(mydata, aes(x=ss_l2, y=RMSEA))+
    geom_boxplot(outlier.alpha = .1)+
    geom_abline(intercept = .06, slope=0,
                linetype='dashed', color = 'red') +
    facet_grid(.~Estimator)
p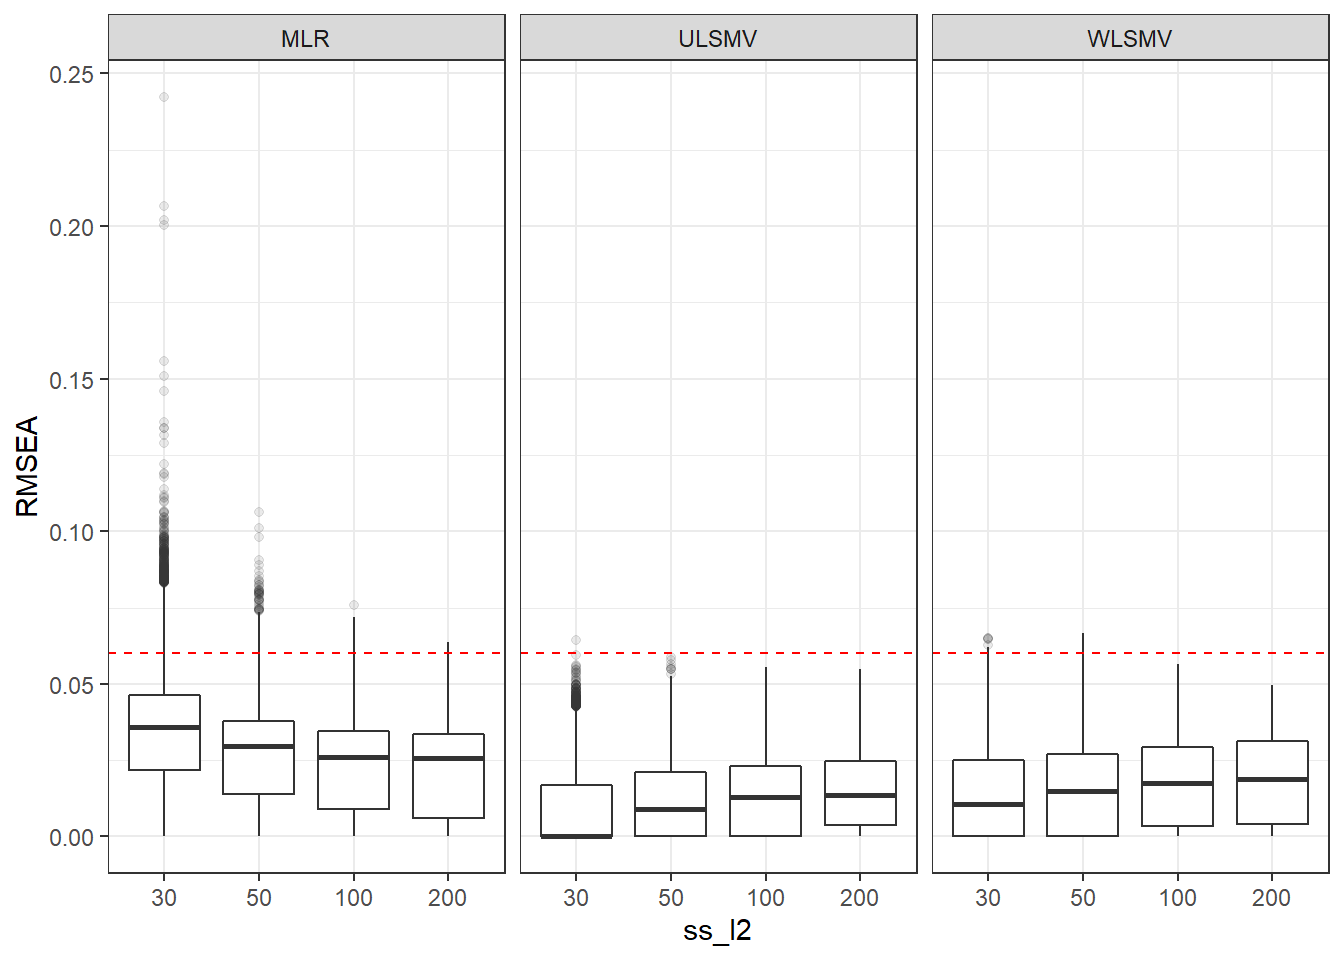
| Version | Author | Date |
|---|---|---|
| a1b0dc1 | noah-padgett | 2019-05-08 |
if(save.fig == T) ggsave("rmsea_marginal_ss_l2_facet_estimator.pdf",plot = p, width=6, height=4, units='in')

p <- ggplot(mydata, aes(x=icc_ov, y=RMSEA))+
    geom_boxplot(outlier.alpha = .1)+
    geom_abline(intercept = .06, slope=0,
                linetype='dashed', color = 'red') +
    facet_grid(.~Estimator)
p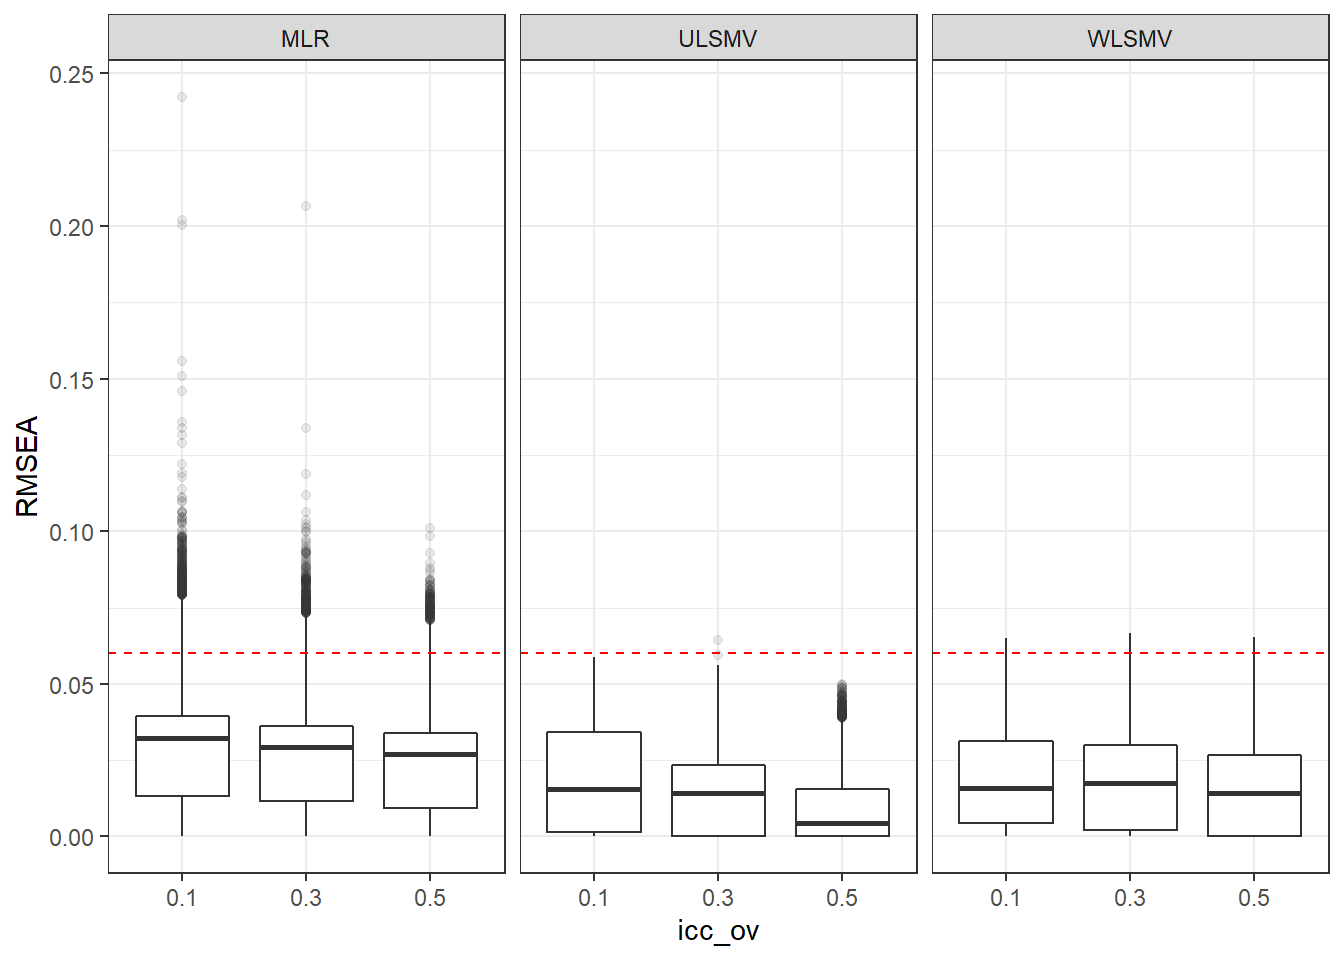
| Version | Author | Date |
|---|---|---|
| a1b0dc1 | noah-padgett | 2019-05-08 |
if(save.fig == T) ggsave("rmsea_marginal_icc_ov_facet_estimator.pdf",plot = p,width=6, height=4, units='in')


p <- ggplot(mydata, aes(x=icc_lv, y=RMSEA))+
    geom_boxplot(outlier.alpha = .1)+
    geom_abline(intercept = .06, slope=0,
                linetype='dashed', color = 'red') +
    facet_grid(.~Estimator)
p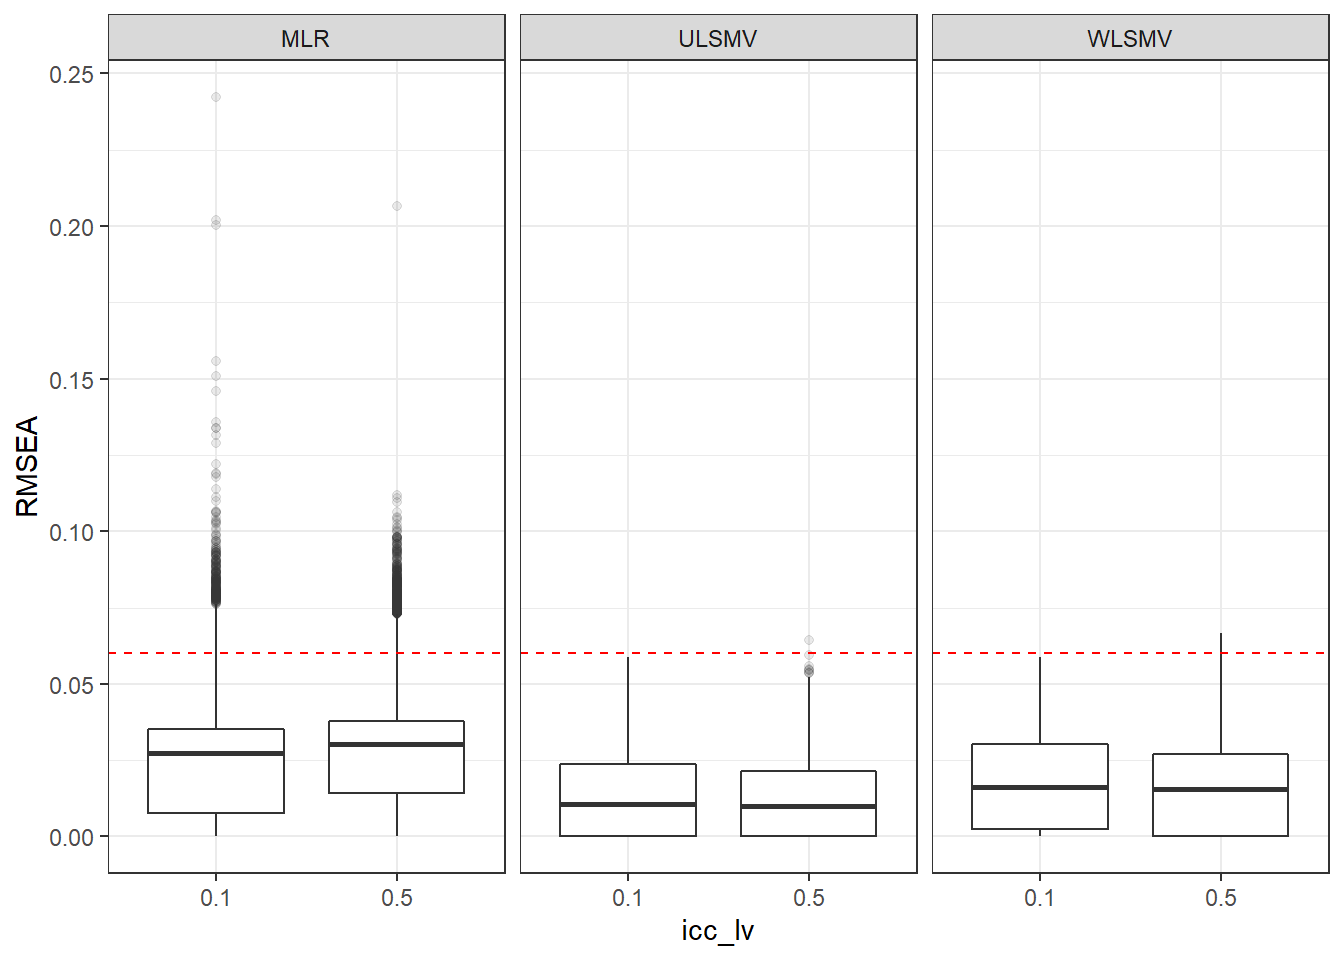
| Version | Author | Date |
|---|---|---|
| a1b0dc1 | noah-padgett | 2019-05-08 |
if(save.fig == T) ggsave("rmsea_marginal_icc_lv_facet_estimator.pdf",plot = p, width=6, height=4, units='in')SRMRW
p <- ggplot(mydata, aes(x=ss_l1, y=SRMRW))+
    geom_boxplot(outlier.alpha = .1)+
    geom_abline(intercept = .08, slope=0,
                linetype='dashed', color = 'red') +
    facet_grid(.~Estimator)
p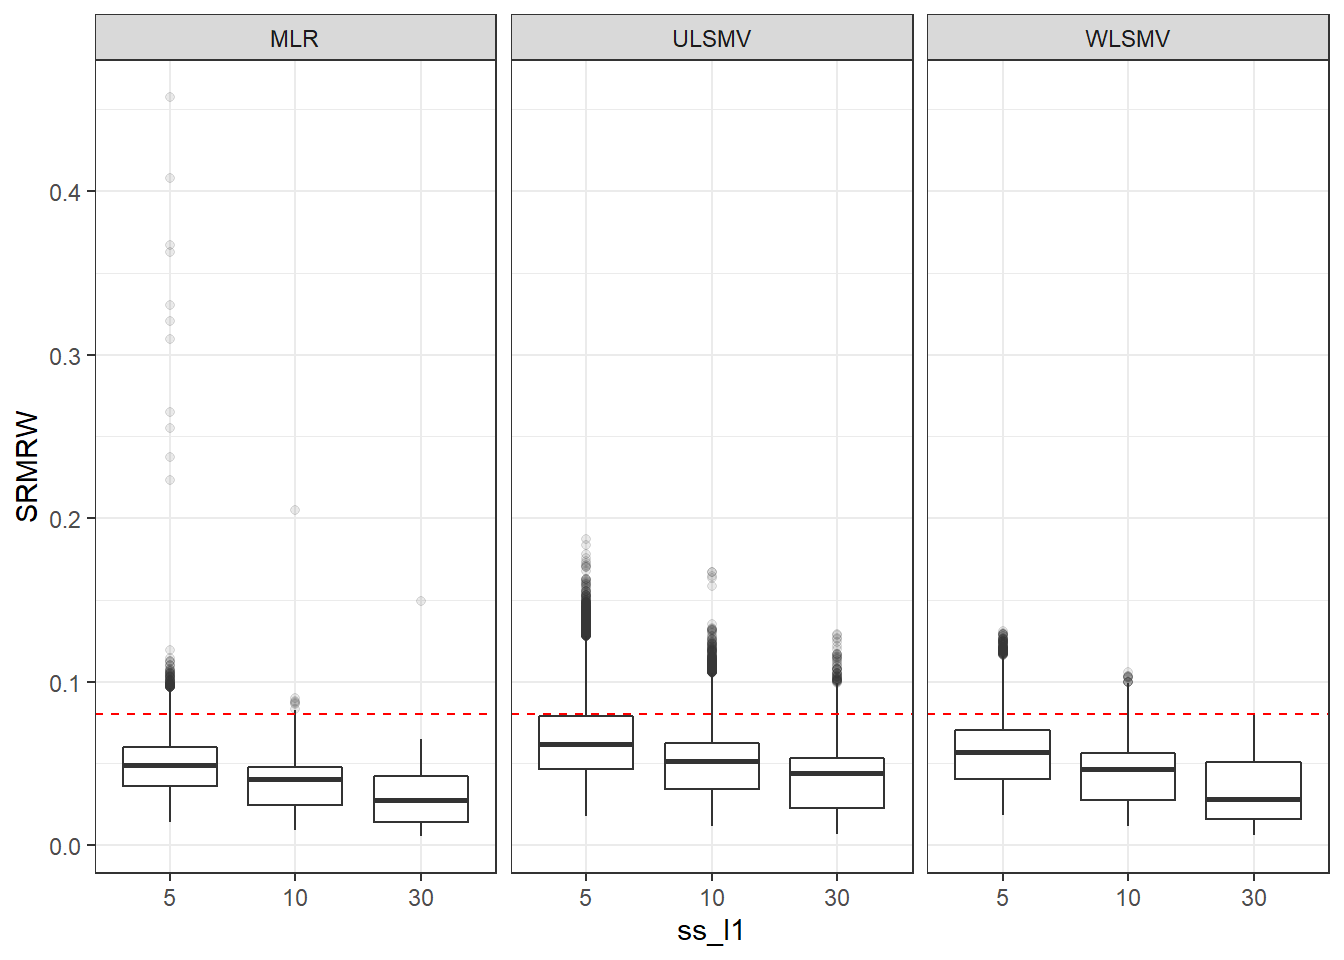
| Version | Author | Date |
|---|---|---|
| a1b0dc1 | noah-padgett | 2019-05-08 |
if(save.fig == T) ggsave("srmrw_marginal_ss_l1_facet_estimator.pdf",plot = p, width=6, height=4, units='in')


p <- ggplot(mydata, aes(x=ss_l2,  y=SRMRW))+
    geom_boxplot(outlier.alpha = .1)+
    geom_abline(intercept = .08, slope=0,
                linetype='dashed', color = 'red') +
    facet_grid(.~Estimator)
p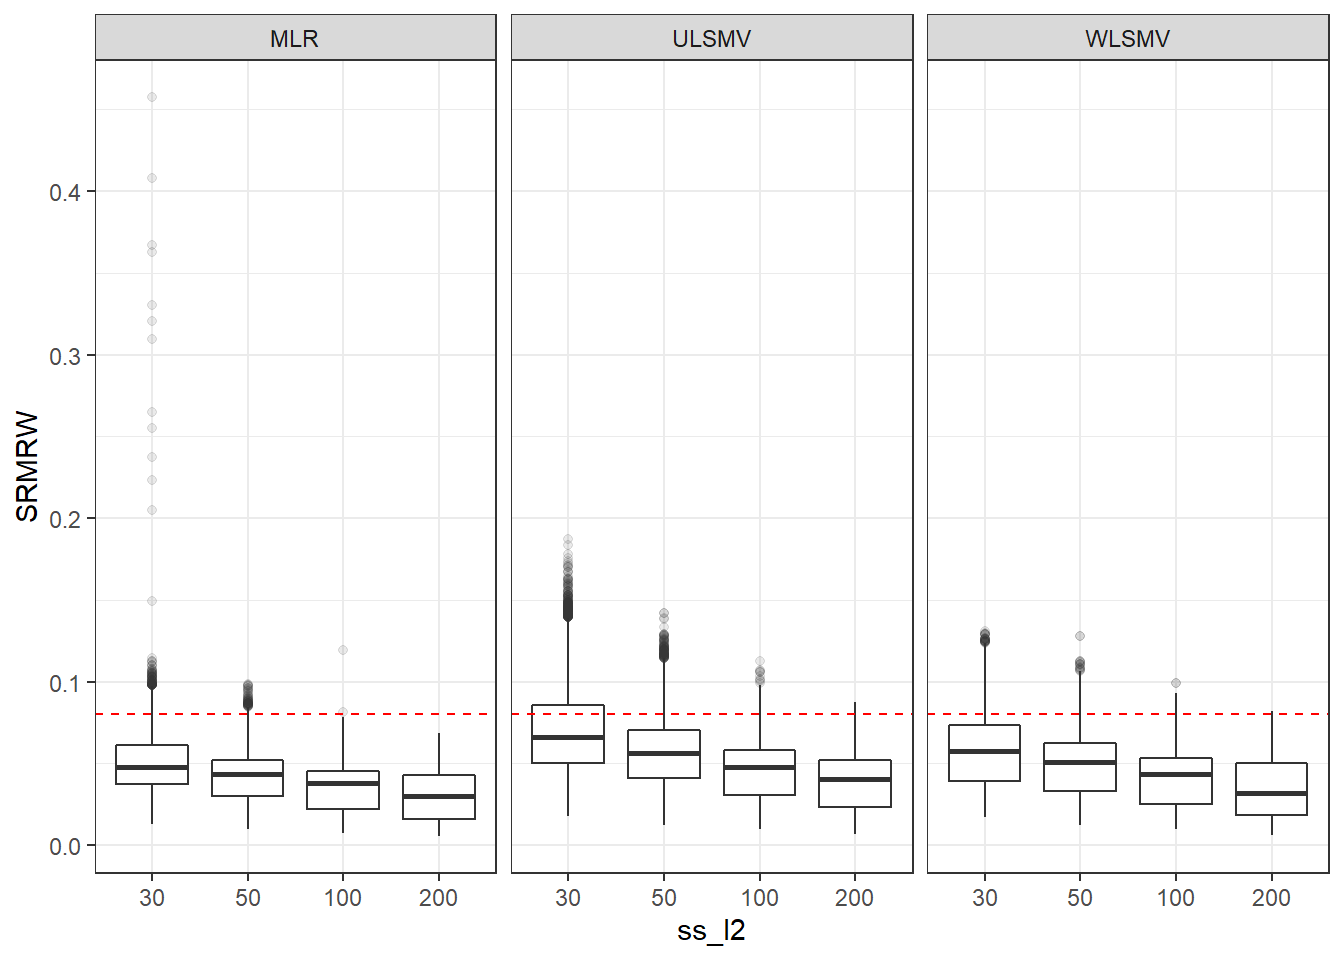
| Version | Author | Date |
|---|---|---|
| a1b0dc1 | noah-padgett | 2019-05-08 |
if(save.fig == T) ggsave("srmrw_marginal_ss_l2_facet_estimator.pdf",plot = p, width=6, height=4, units='in')


p <- ggplot(mydata, aes(x=icc_ov,  y=SRMRW))+
    geom_boxplot(outlier.alpha = .1)+
    geom_abline(intercept = .08, slope=0,
                linetype='dashed', color = 'red') +
    facet_grid(.~Estimator)
p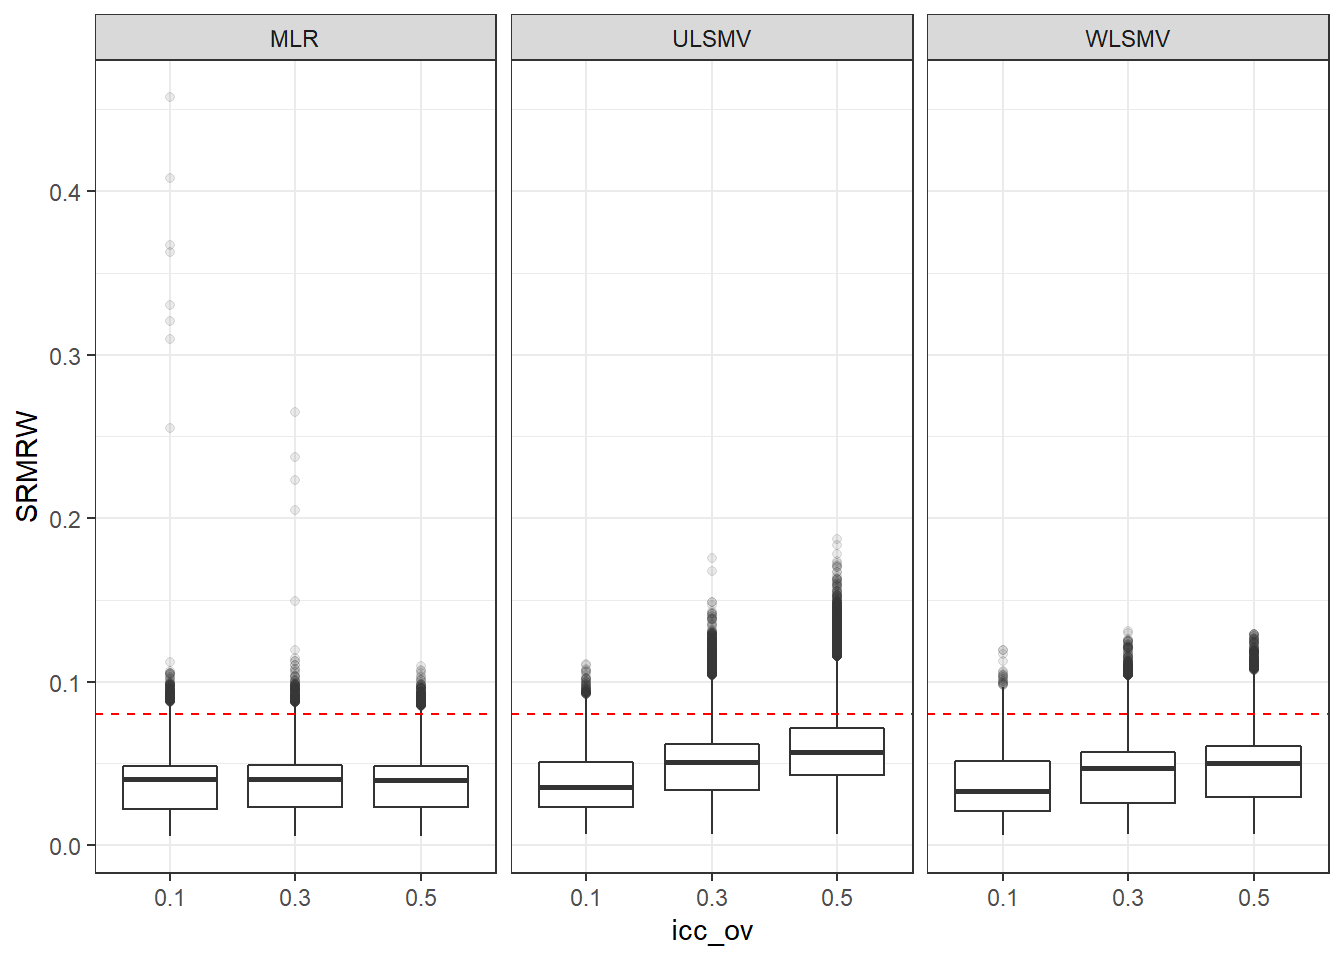
| Version | Author | Date |
|---|---|---|
| a1b0dc1 | noah-padgett | 2019-05-08 |
if(save.fig == T) ggsave("srmrw_marginal_icc_ov_facet_estimator.pdf",plot = p,width=6, height=4, units='in')


p <- ggplot(mydata, aes(x=icc_lv, y=SRMRW))+
    geom_boxplot(outlier.alpha = .1)+
    geom_abline(intercept = .08, slope=0,
                linetype='dashed', color = 'red') +
    facet_grid(.~Estimator)
p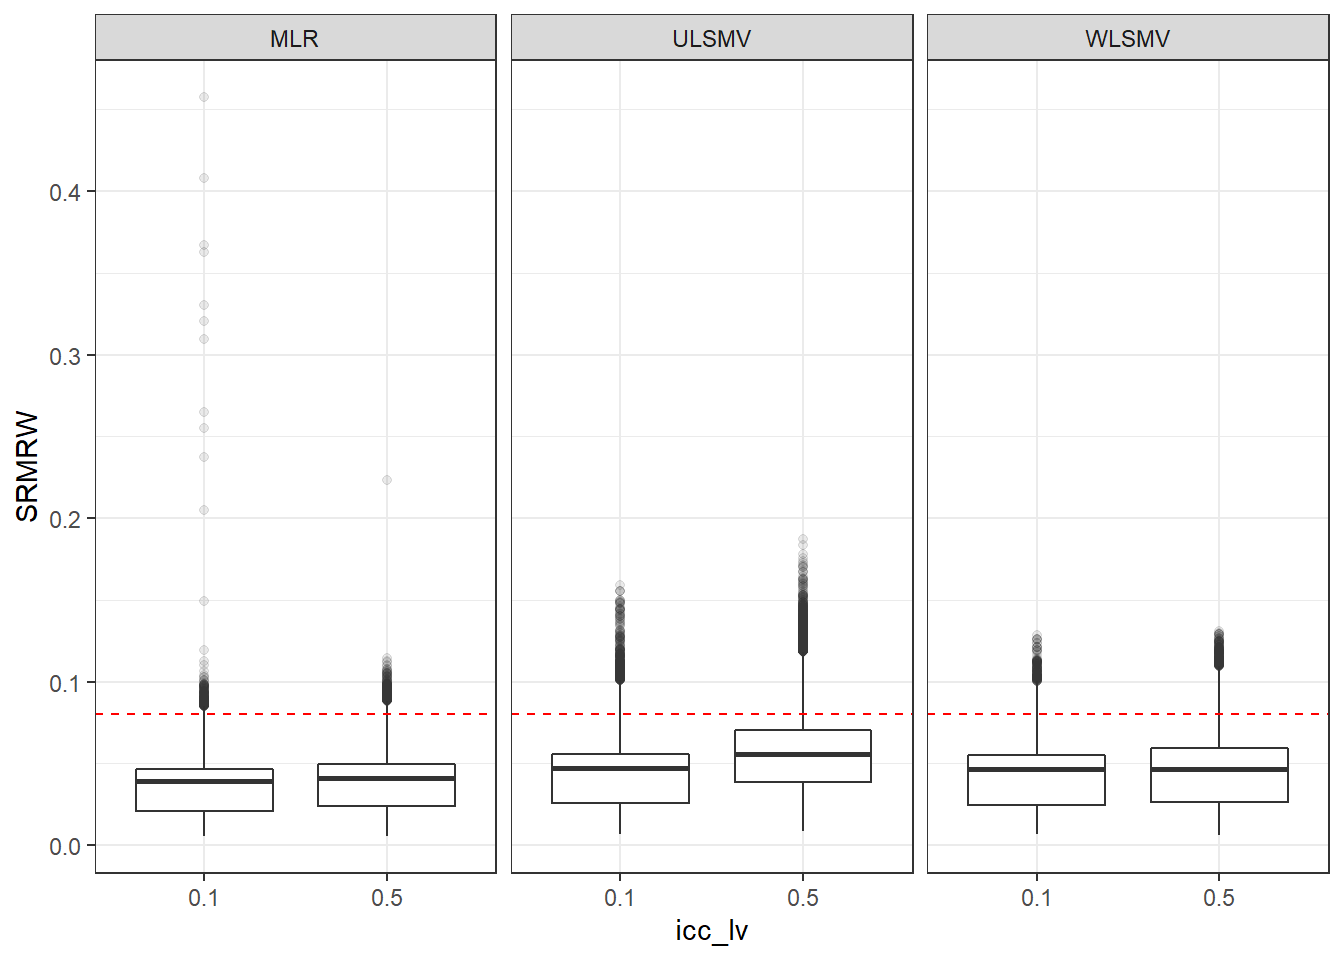
| Version | Author | Date |
|---|---|---|
| a1b0dc1 | noah-padgett | 2019-05-08 |
if(save.fig == T) ggsave("srmrw_marginal_icc_lv_facet_estimator.pdf",plot = p, width=6, height=4, units='in')SRMRB
p <- ggplot(mydata, aes(x=ss_l1, y=SRMRB))+
    geom_boxplot(outlier.alpha = .1)+
    geom_abline(intercept = .08, slope=0,
                linetype='dashed', color = 'red') +
    facet_grid(.~Estimator) +
    lims(y=c(0,1))
p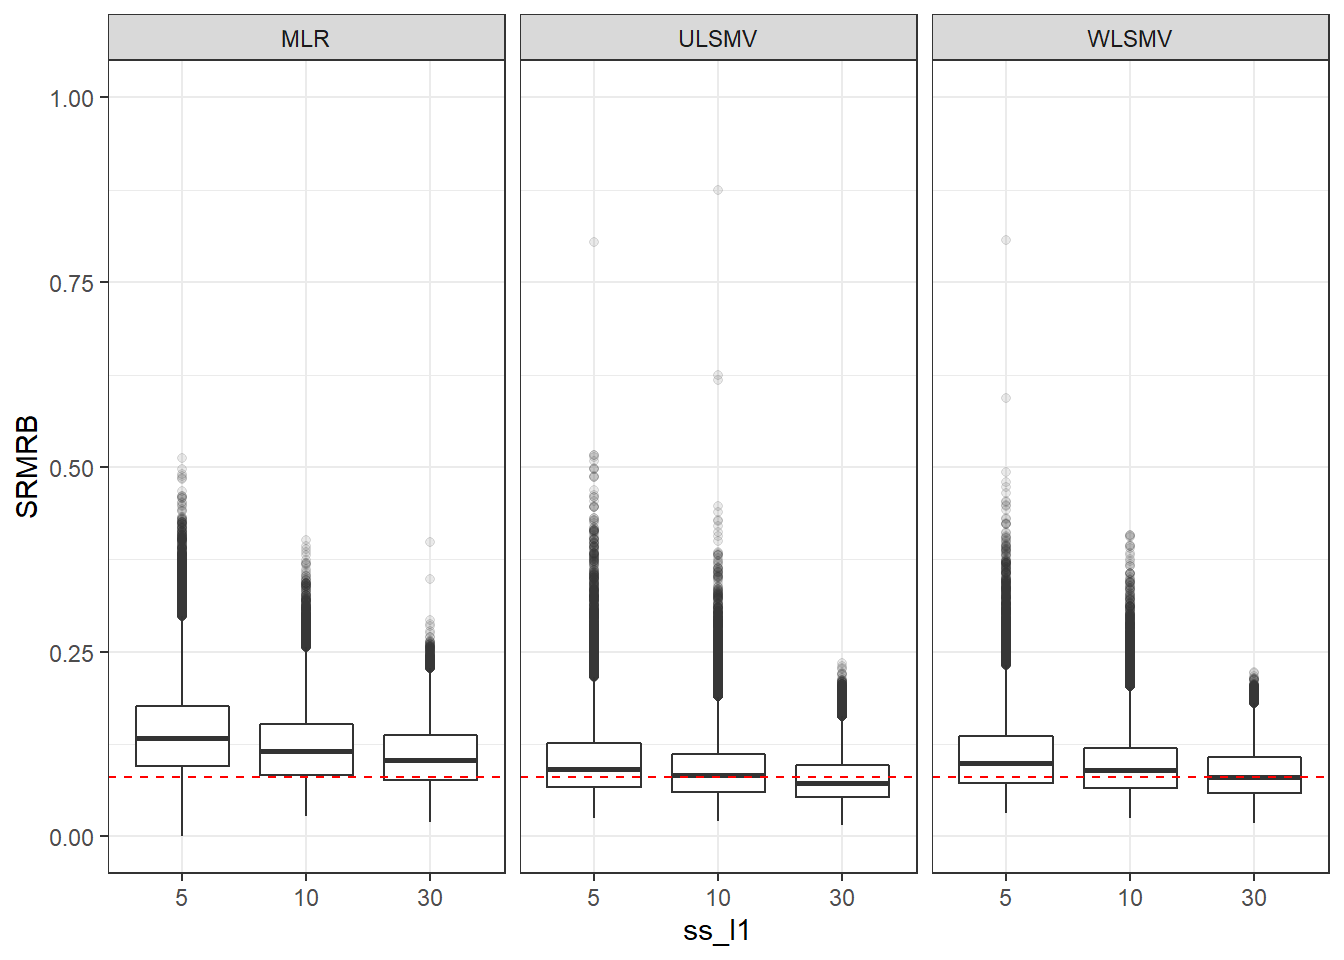
| Version | Author | Date |
|---|---|---|
| a1b0dc1 | noah-padgett | 2019-05-08 |
if(save.fig == T) ggsave("srmrb_marginal_ss_l1_facet_estimator.pdf",plot = p, width=6, height=4, units='in')


p <- ggplot(mydata, aes(x=ss_l2,  y=SRMRB))+
    geom_boxplot(outlier.alpha = .1)+
    geom_abline(intercept = .08, slope=0,
                linetype='dashed', color = 'red') +
    facet_grid(.~Estimator) +
    lims(y=c(0,1))
p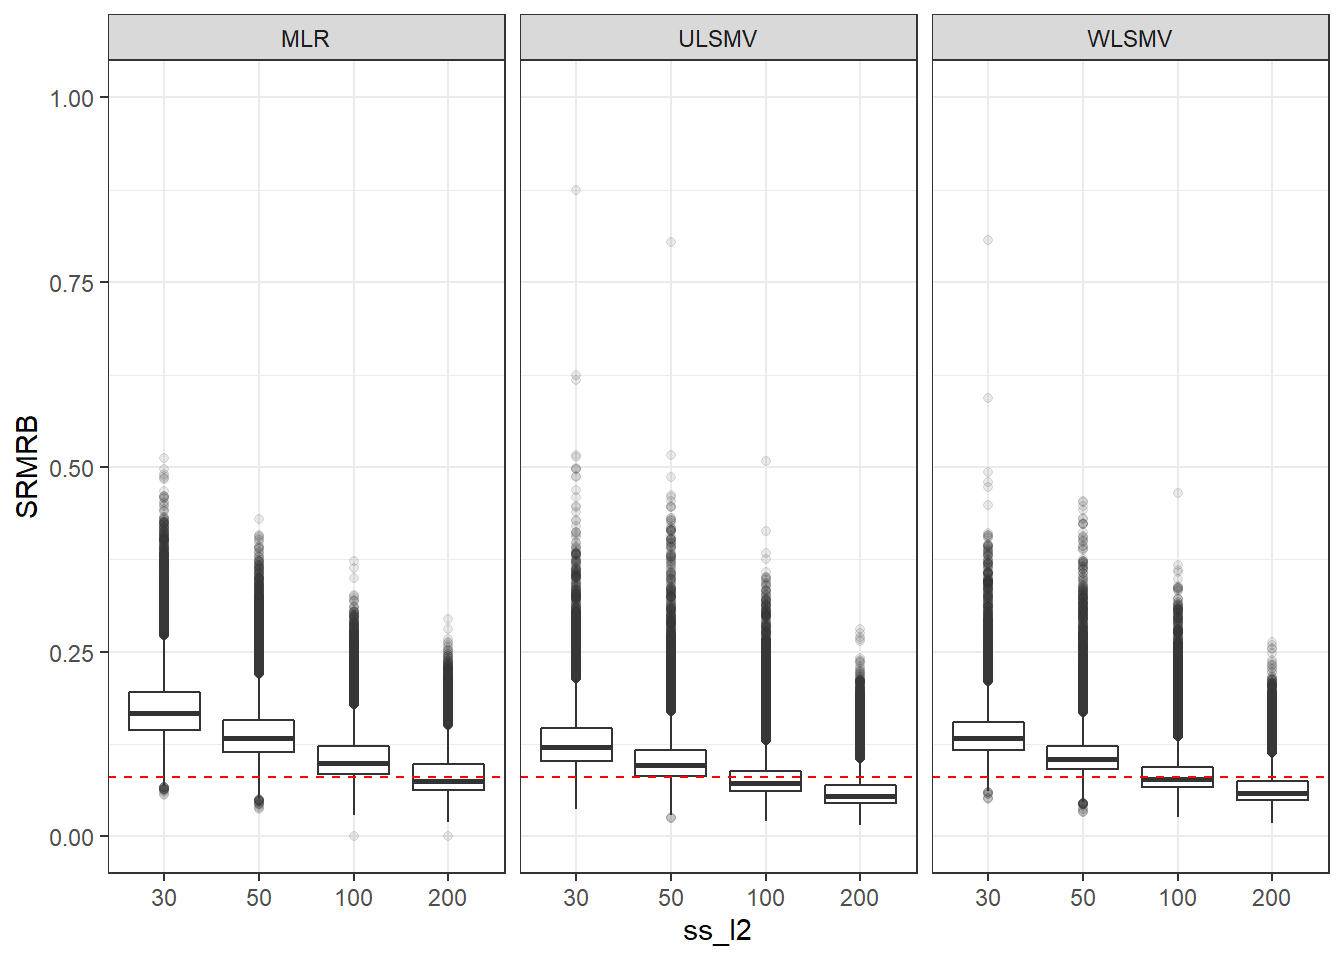
| Version | Author | Date |
|---|---|---|
| a1b0dc1 | noah-padgett | 2019-05-08 |
if(save.fig == T) ggsave("srmrb_marginal_ss_l2_facet_estimator.pdf",plot = p, width=6, height=4, units='in')

p <- ggplot(mydata, aes(x=icc_ov,  y=SRMRB))+
    geom_boxplot(outlier.alpha = .1)+
    geom_abline(intercept = .08, slope=0,
                linetype='dashed', color = 'red') +
    facet_grid(.~Estimator)+
    lims(y=c(0,1))
p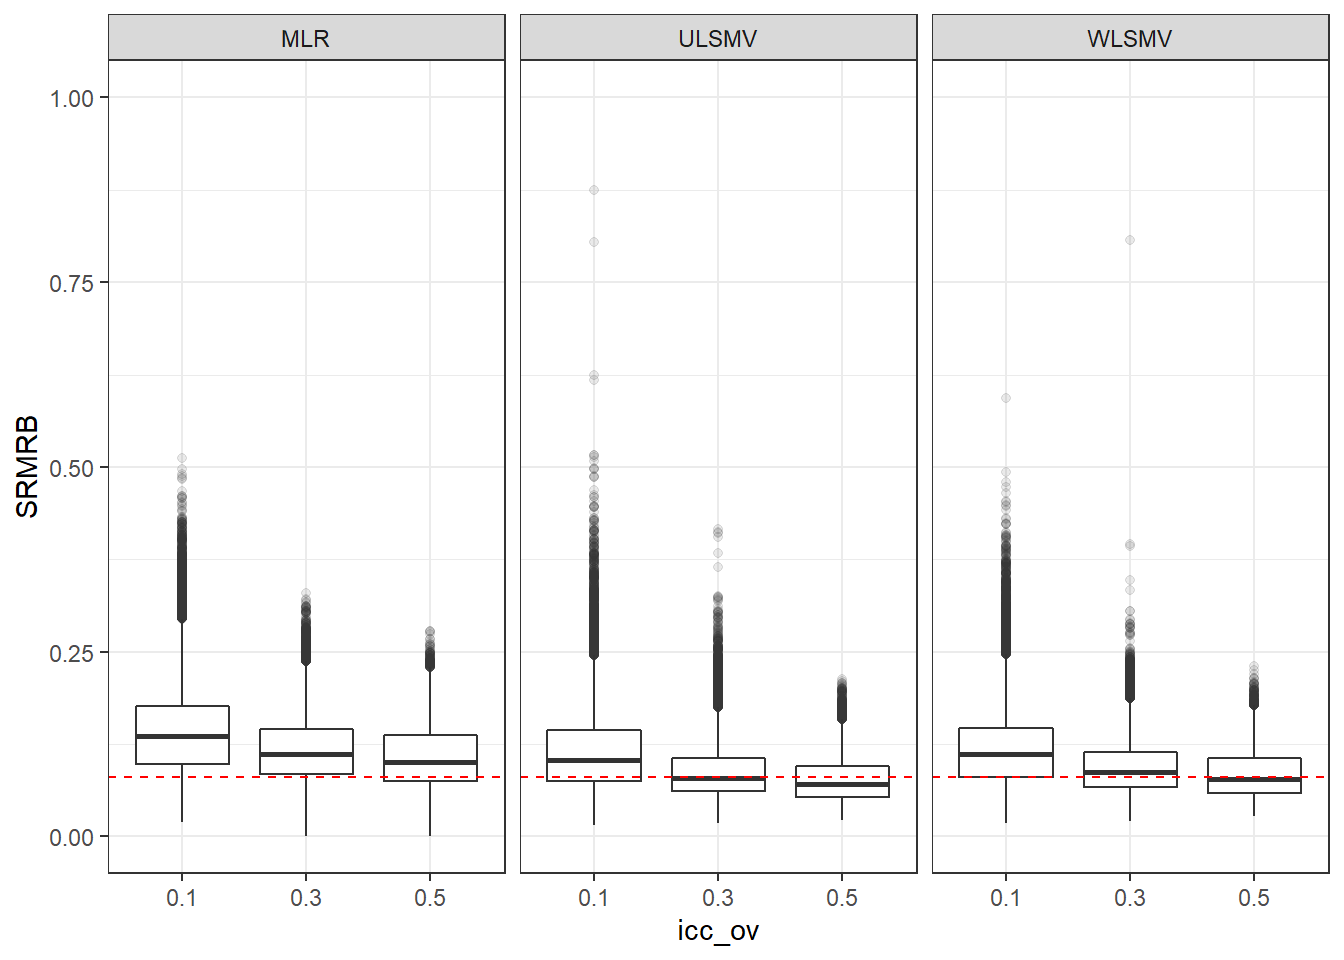
| Version | Author | Date |
|---|---|---|
| a1b0dc1 | noah-padgett | 2019-05-08 |
if(save.fig == T) ggsave("srmrb_marginal_icc_ov_facet_estimator.pdf",plot = p, width=6, height=4, units='in')

p <- ggplot(mydata, aes(x=icc_lv, y=SRMRB))+
    geom_boxplot(outlier.alpha = .1)+
    geom_abline(intercept = .08, slope=0,
                linetype='dashed', color = 'red') +
    facet_grid(.~Estimator)+
    lims(y=c(0,1))
p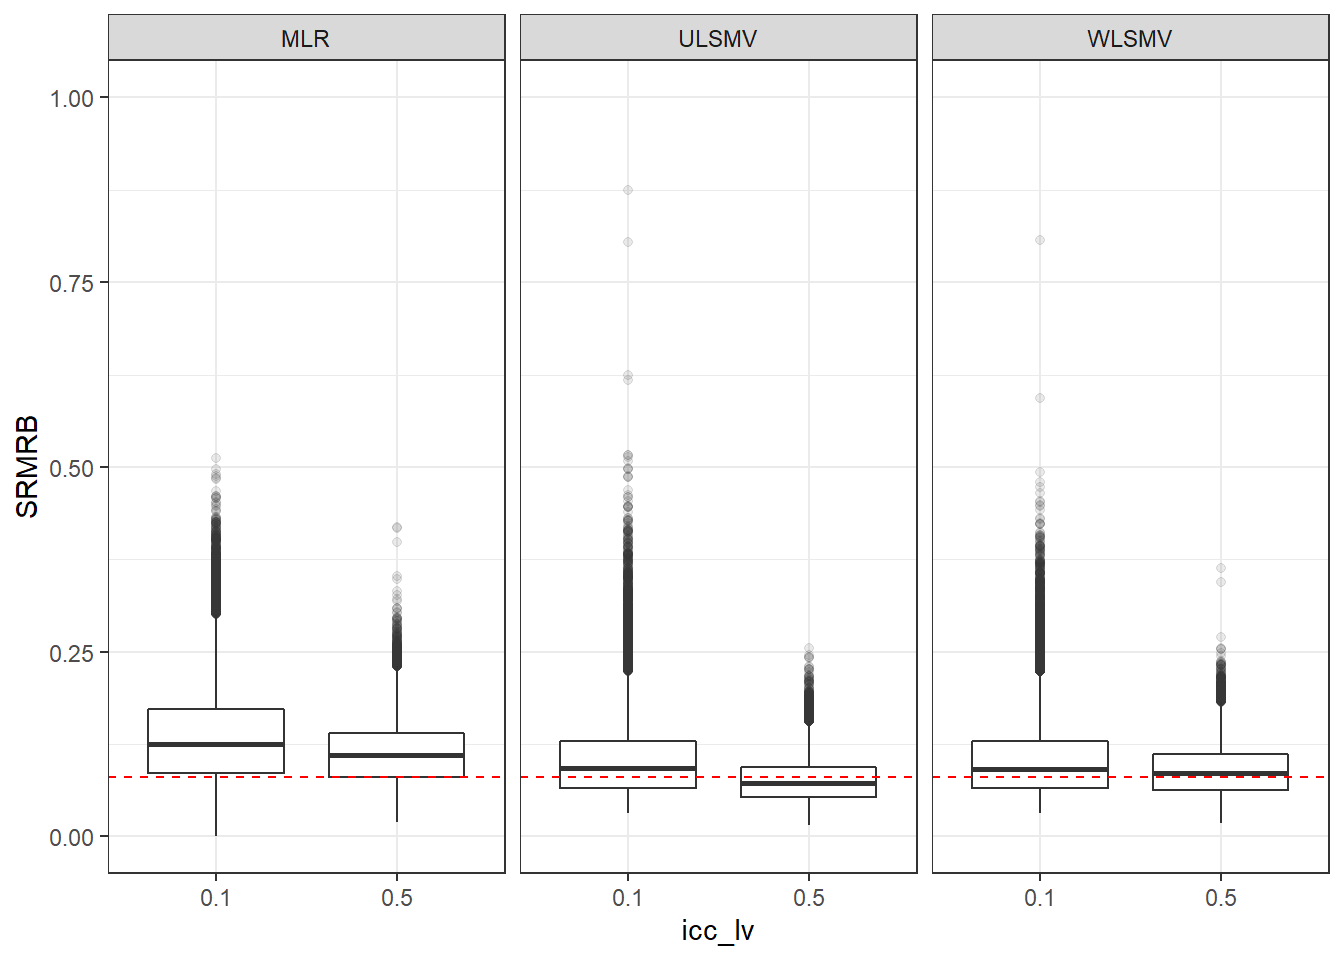
| Version | Author | Date |
|---|---|---|
| a1b0dc1 | noah-padgett | 2019-05-08 |
if(save.fig == T) ggsave("srmrb_marginal_icc_lv_facet_estimator.pdf",plot = p, width=6, height=4, units='in')Marginal Plots of Conditions Facetted by Model
CFI
p <- ggplot(mydata, aes(x=ss_l1, y=CFI))+
    geom_boxplot(outlier.alpha = .1)+
    geom_abline(intercept = .95, slope=0,
                linetype='dashed', color = 'red') +
    facet_grid(.~Model)
p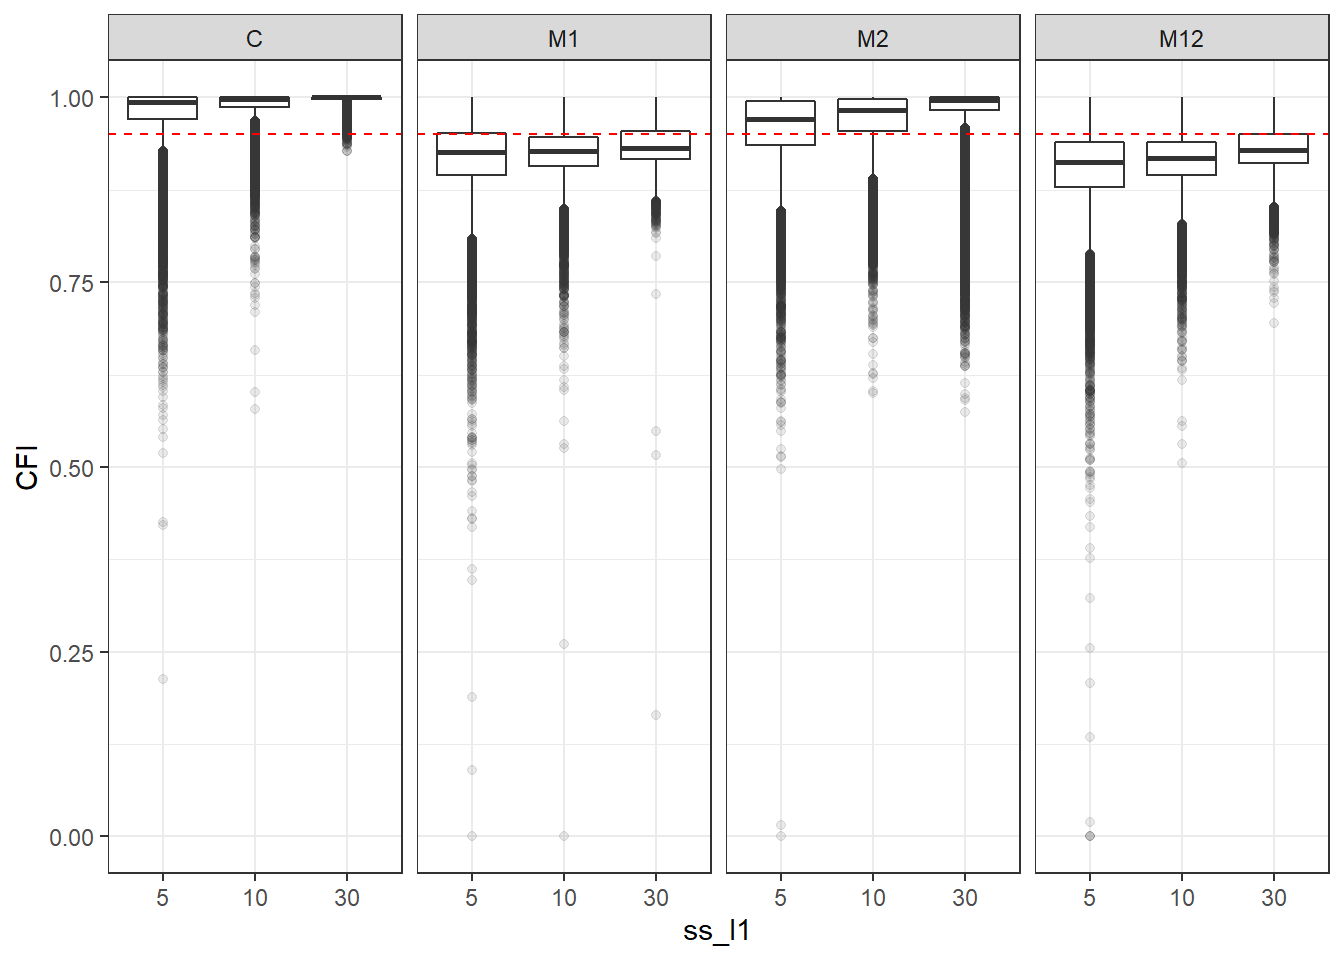
| Version | Author | Date |
|---|---|---|
| a1b0dc1 | noah-padgett | 2019-05-08 |
if(save.fig == T) ggsave("cfi_marginal_ssl1_facet_model.pdf",plot = p, width=6, height=4, units='in')


p <- ggplot(mydata, aes(x=ss_l2, y=CFI))+
    geom_boxplot(outlier.alpha = .1)+
    geom_abline(intercept = .95, slope=0,
                linetype='dashed', color = 'red') +
    facet_grid(.~Model)
p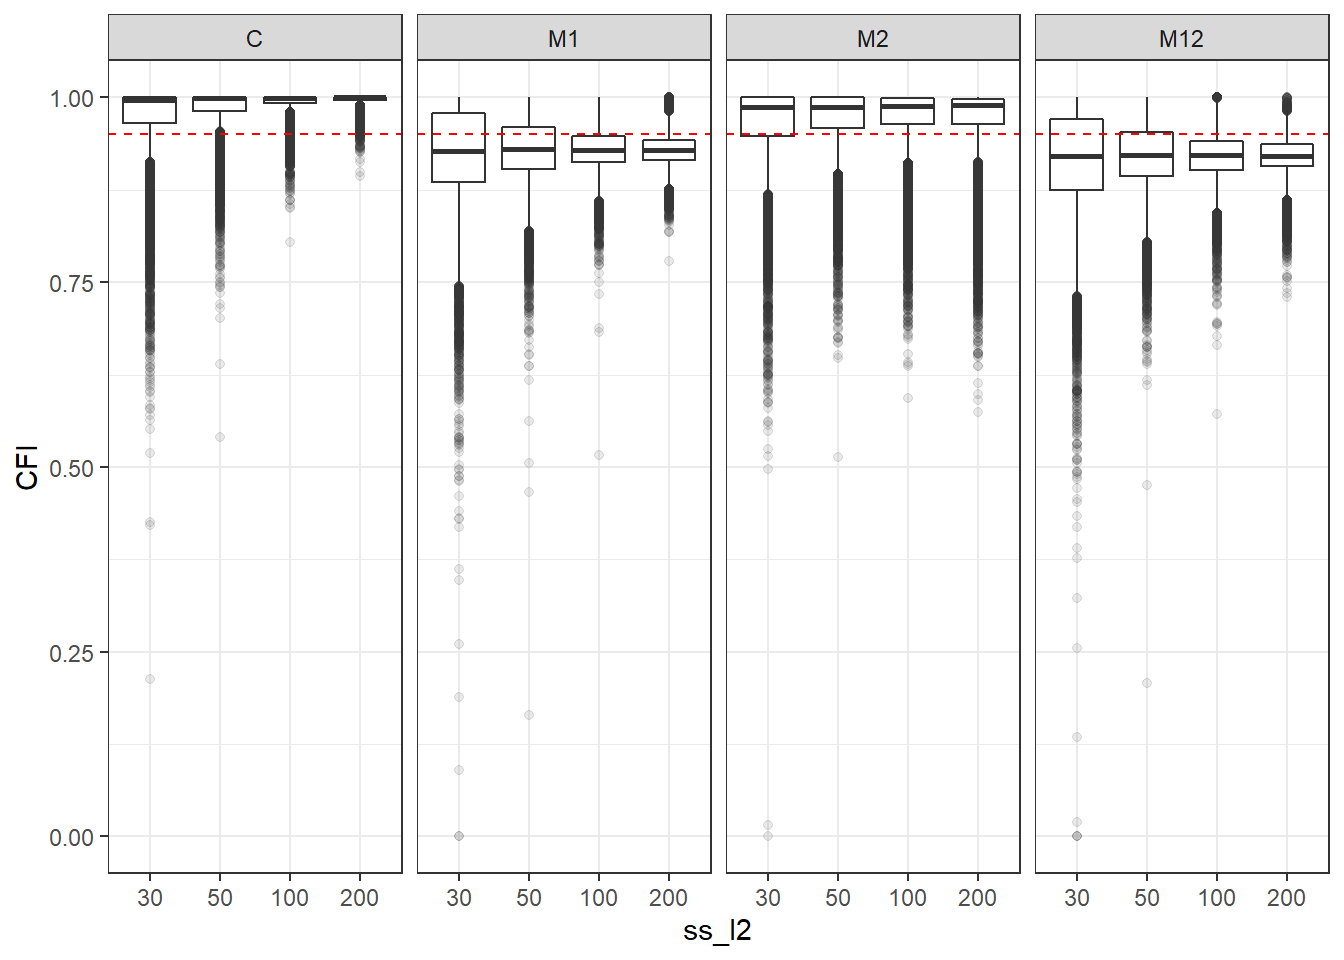
| Version | Author | Date |
|---|---|---|
| a1b0dc1 | noah-padgett | 2019-05-08 |
if(save.fig == T) ggsave("cfi_marginal_ss_l2_facet_model.pdf",plot = p,width=6, height=4, units='in')


p <- ggplot(mydata, aes(x=icc_ov, y=CFI))+
    geom_boxplot(outlier.alpha = .1)+
    geom_abline(intercept = .95, slope=0,
                linetype='dashed', color = 'red') +
    facet_grid(.~Model)
p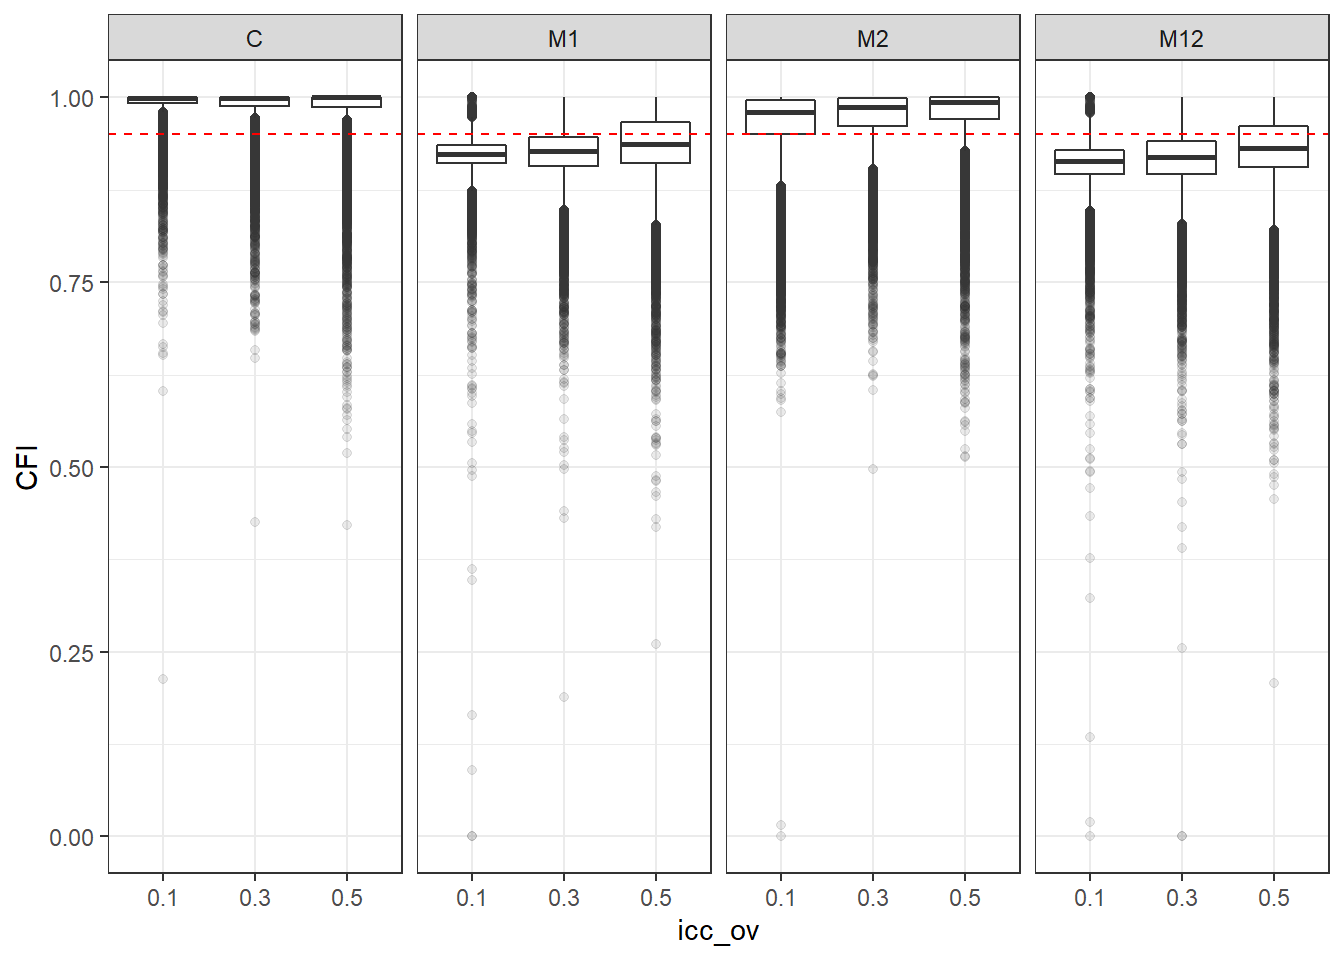
| Version | Author | Date |
|---|---|---|
| a1b0dc1 | noah-padgett | 2019-05-08 |
if(save.fig == T) ggsave("cfi_marginal_icc_ov_facet_model.pdf",plot = p, width=6, height=4, units='in')


p <- ggplot(mydata, aes(x=icc_lv, y=CFI))+
    geom_boxplot(outlier.alpha = .1)+
    geom_abline(intercept = .95, slope=0,
                linetype='dashed', color = 'red') +
    facet_grid(.~Model)
p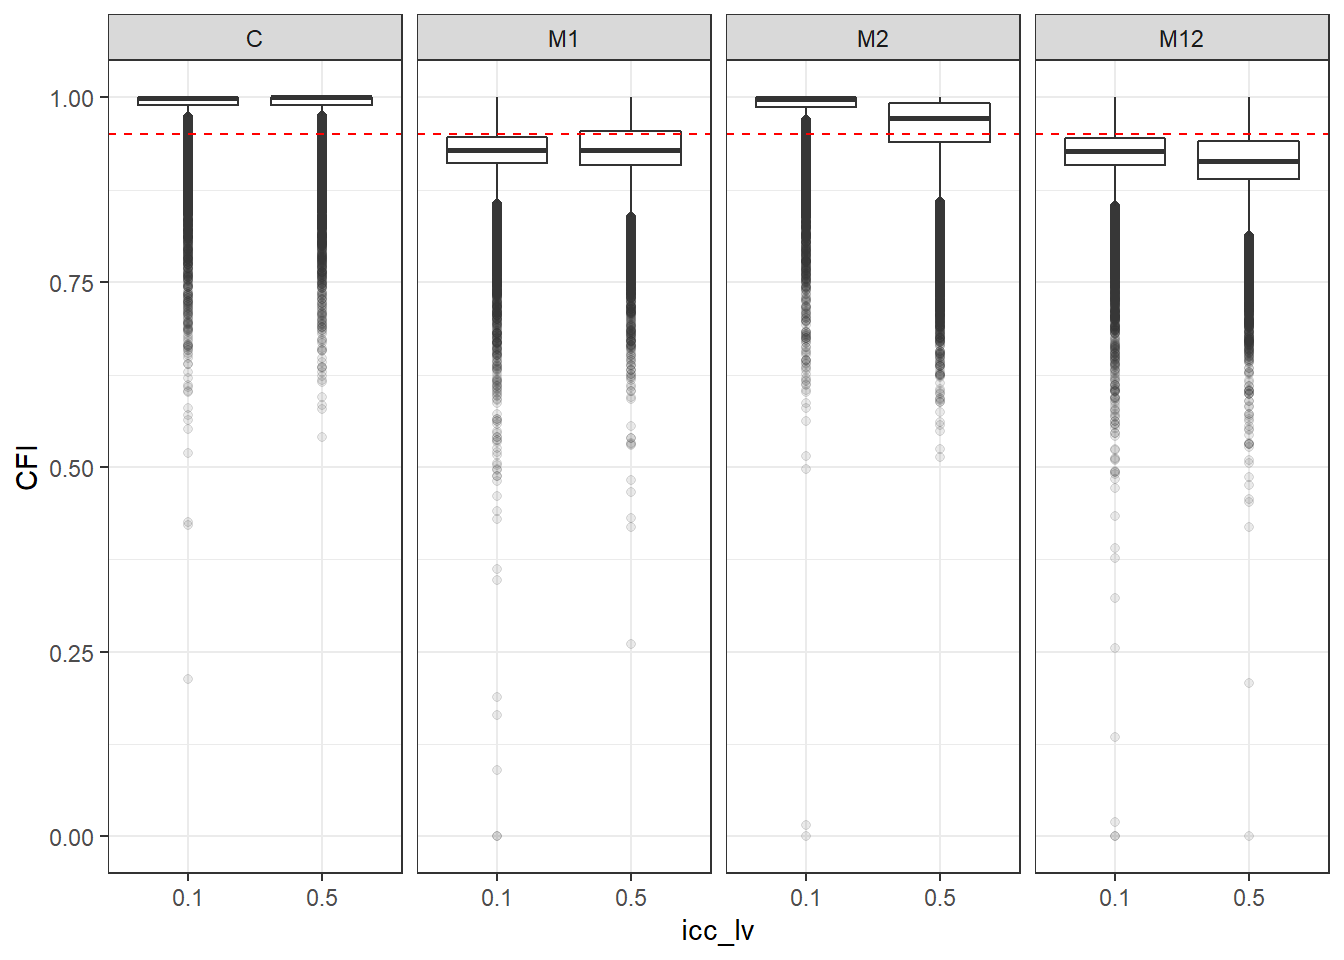
| Version | Author | Date |
|---|---|---|
| a1b0dc1 | noah-padgett | 2019-05-08 |
if(save.fig == T) ggsave("cfi_marginal_icc_lv_facet_model.pdf",plot = p, width=6, height=4, units='in')TLI
p <- ggplot(mydata, aes(x=ss_l1, y=TLI))+
    geom_boxplot(outlier.alpha = .1)+
    geom_abline(intercept = .95, slope=0,
                linetype='dashed', color = 'red') +
    facet_grid(.~Model)
p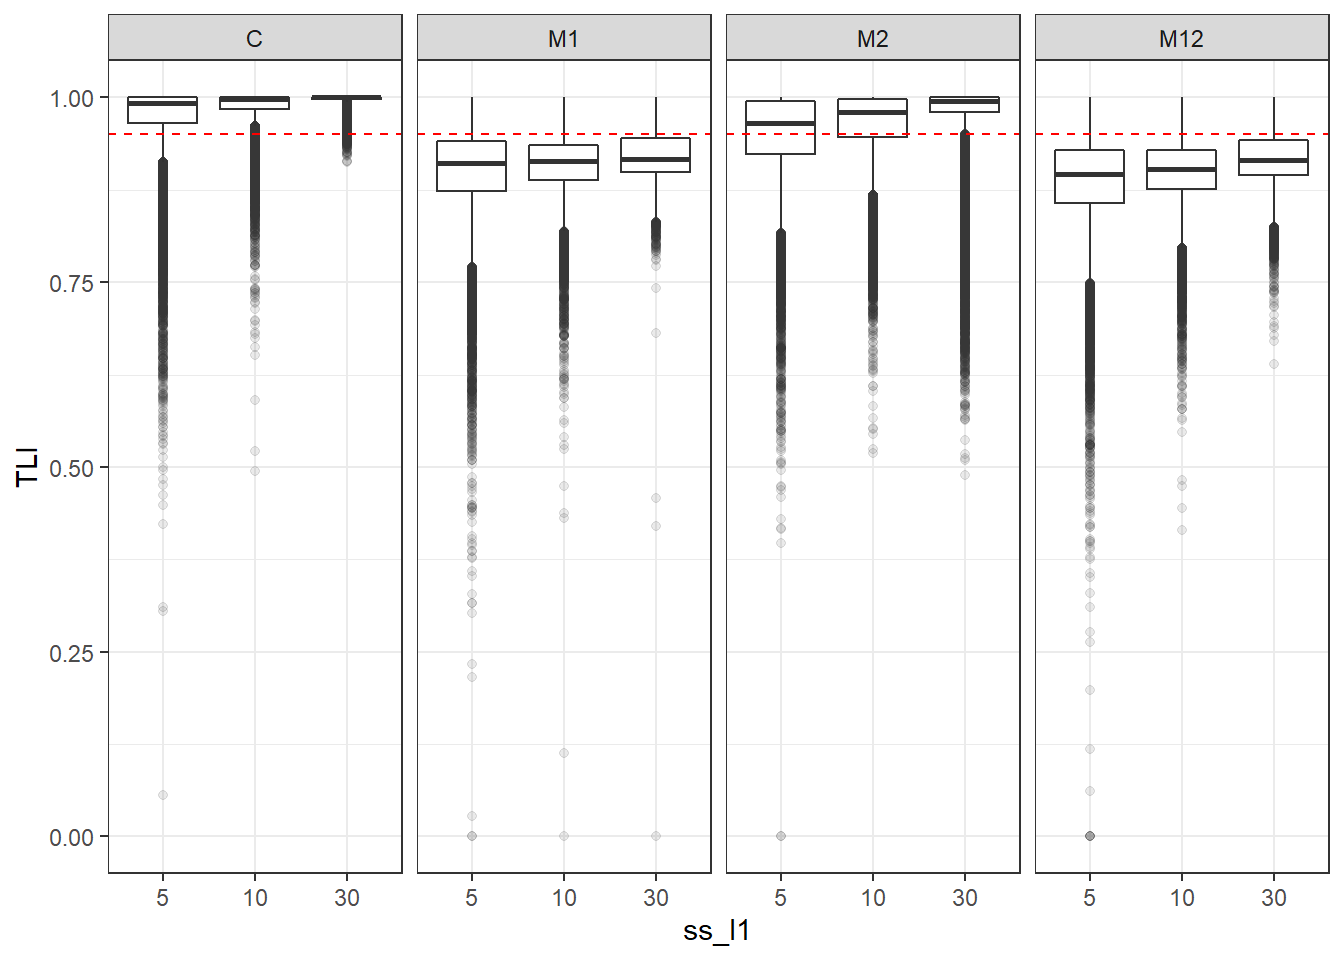
| Version | Author | Date |
|---|---|---|
| a1b0dc1 | noah-padgett | 2019-05-08 |
if(save.fig == T) ggsave("tli_marginal_ss_l1_facet_model.pdf",plot = p, width=6, height=4, units='in')


p <- ggplot(mydata, aes(x=ss_l2, y=TLI))+
    geom_boxplot(outlier.alpha = .1)+
    geom_abline(intercept = .95, slope=0,
                linetype='dashed', color = 'red') +
    facet_grid(.~Model)+
    labs(title = 'TLI by Level-2 Sample Size')
p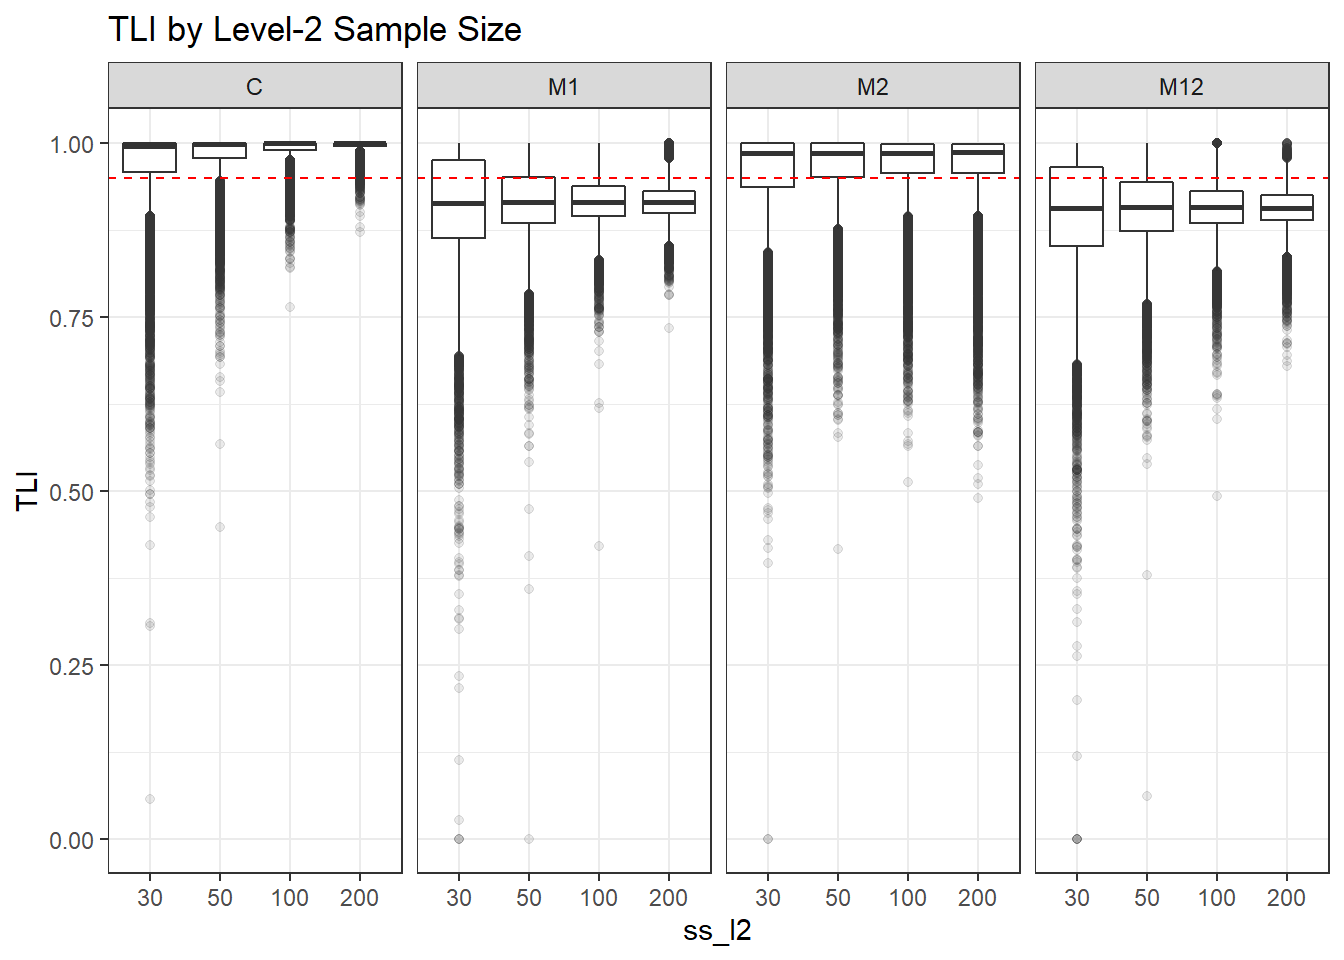
| Version | Author | Date |
|---|---|---|
| a1b0dc1 | noah-padgett | 2019-05-08 |
if(save.fig == T) ggsave("tli_marginal_ss_l2_facet_model.pdf",plot = p, width=6, height=4, units='in')

p <- ggplot(mydata, aes(x=icc_ov, y=TLI))+
    geom_boxplot(outlier.alpha = .1)+
    geom_abline(intercept = .95, slope=0,
                linetype='dashed', color = 'red') +
    facet_grid(.~Model)
p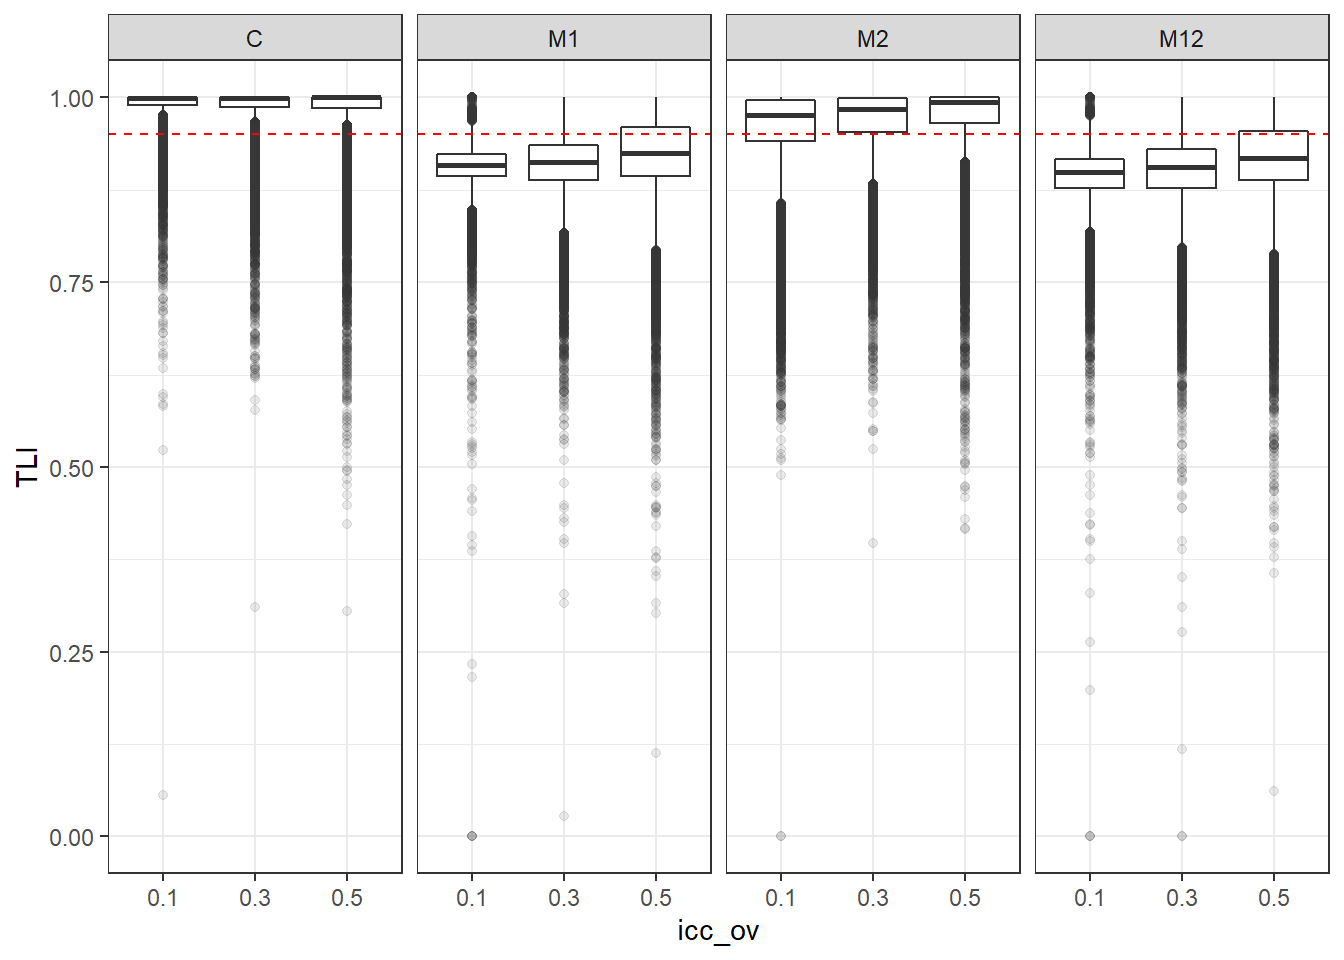
| Version | Author | Date |
|---|---|---|
| a1b0dc1 | noah-padgett | 2019-05-08 |
if(save.fig == T) ggsave("tli_marginal_icc_ov_facet_model.pdf",plot = p, width=6, height=4, units='in')

p <- ggplot(mydata, aes(x=icc_lv, y=TLI))+
    geom_boxplot(outlier.alpha = .1)+
    geom_abline(intercept = .95, slope=0,
                linetype='dashed', color = 'red') +
    facet_grid(.~Model)
p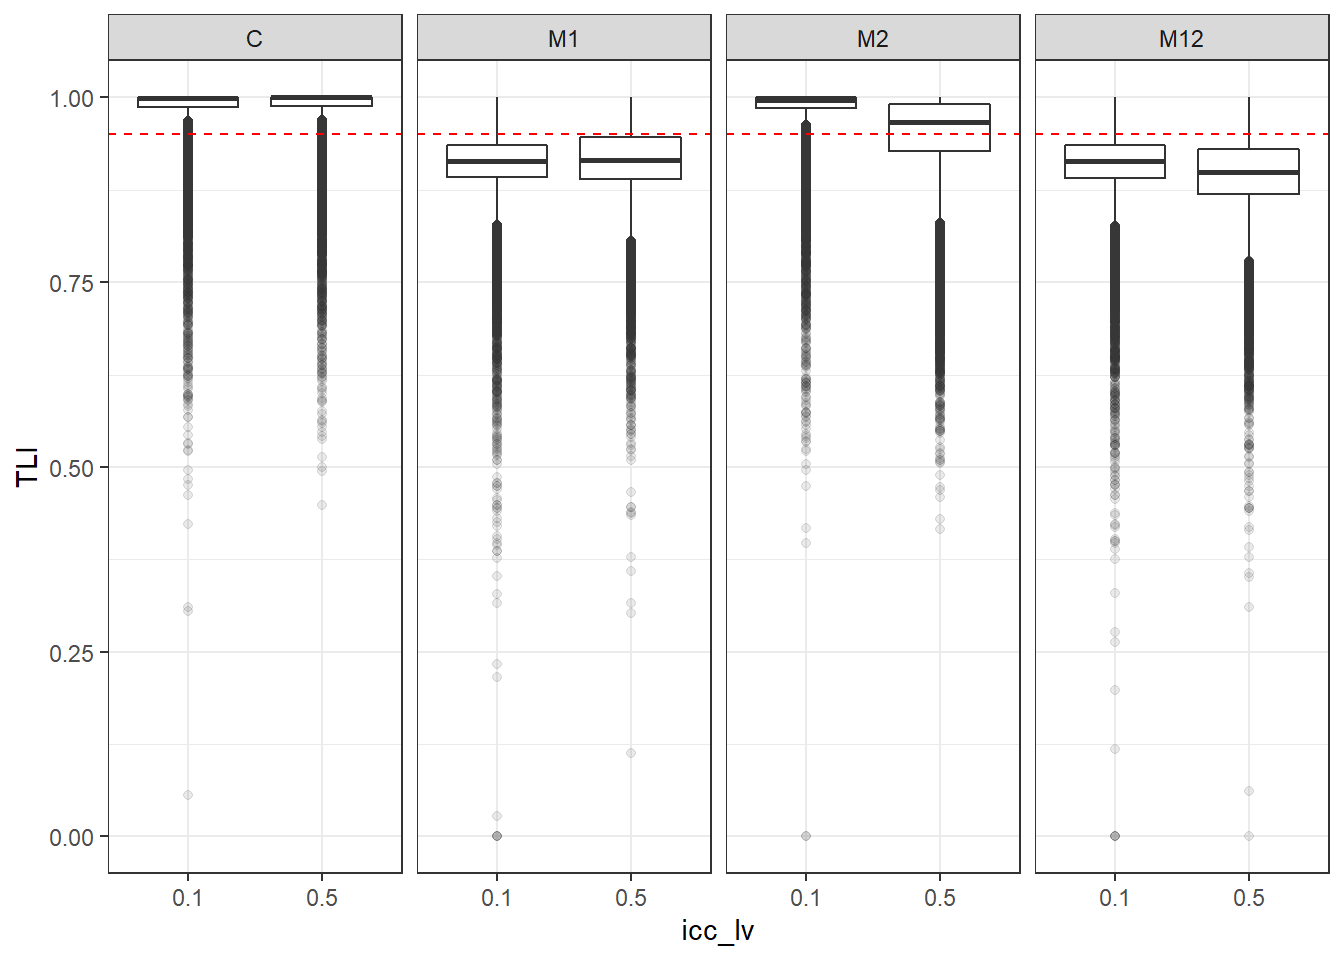
| Version | Author | Date |
|---|---|---|
| a1b0dc1 | noah-padgett | 2019-05-08 |
if(save.fig == T) ggsave("tli_marginal_icc_lv_facet_model.pdf",plot = p, width=6, height=4, units='in')RMSEA
p <- ggplot(mydata, aes(x=ss_l1, y=RMSEA))+
    geom_boxplot(outlier.alpha = .1)+
    geom_abline(intercept = .06, slope=0,
                linetype='dashed', color = 'red') +
    facet_grid(.~Model)
p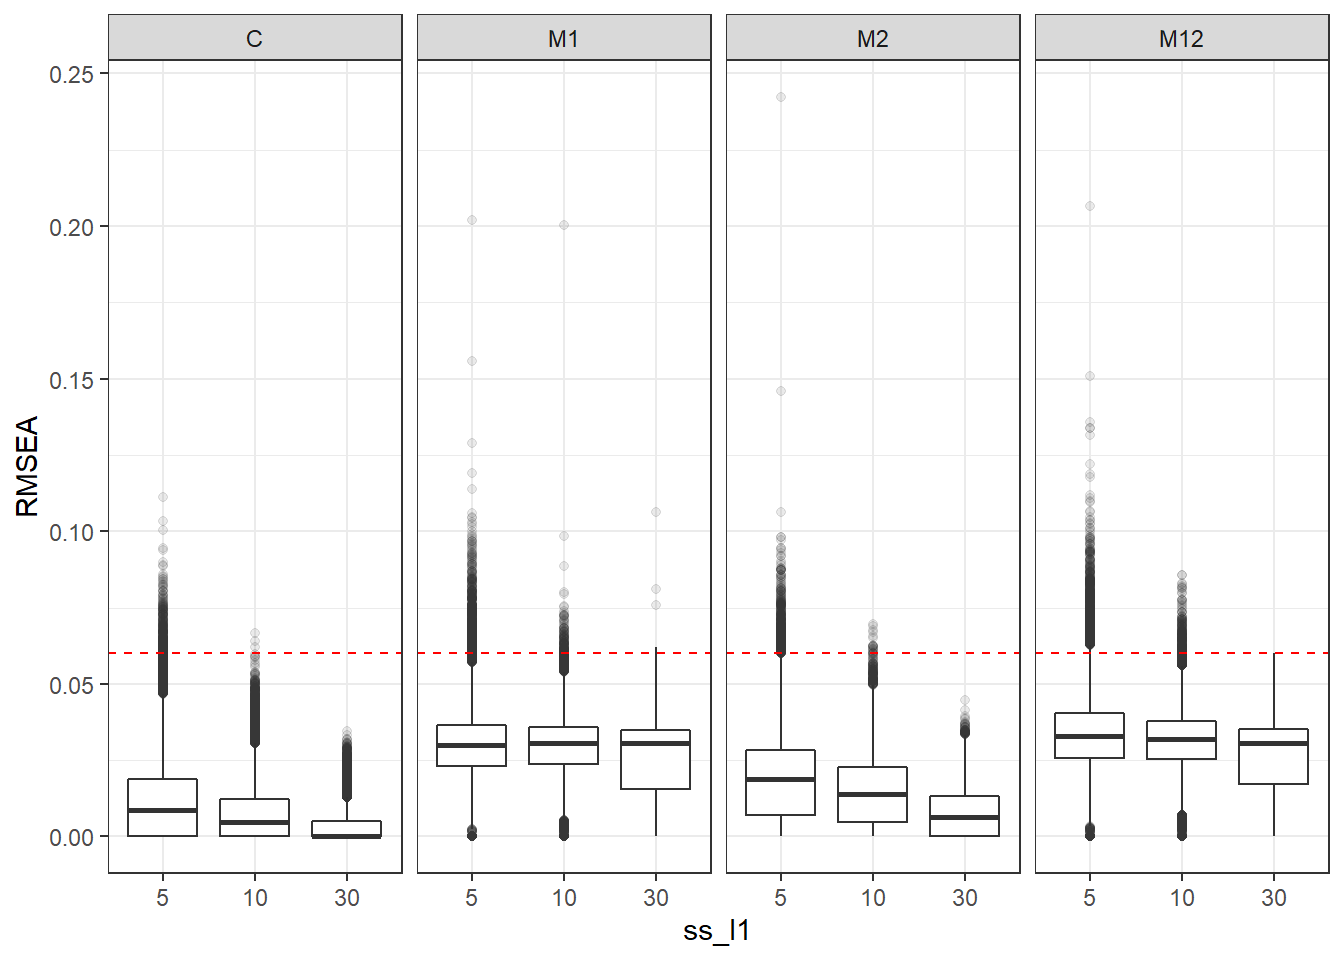
| Version | Author | Date |
|---|---|---|
| a1b0dc1 | noah-padgett | 2019-05-08 |
if(save.fig == T) ggsave("rmsea_marginal_ss_l1_facet_model.pdf",plot = p, width=6, height=4, units='in')


p <- ggplot(mydata, aes(x=ss_l2, y=RMSEA))+
    geom_boxplot(outlier.alpha = .1)+
    geom_abline(intercept = .06, slope=0,
                linetype='dashed', color = 'red') +
    facet_grid(.~Model)
p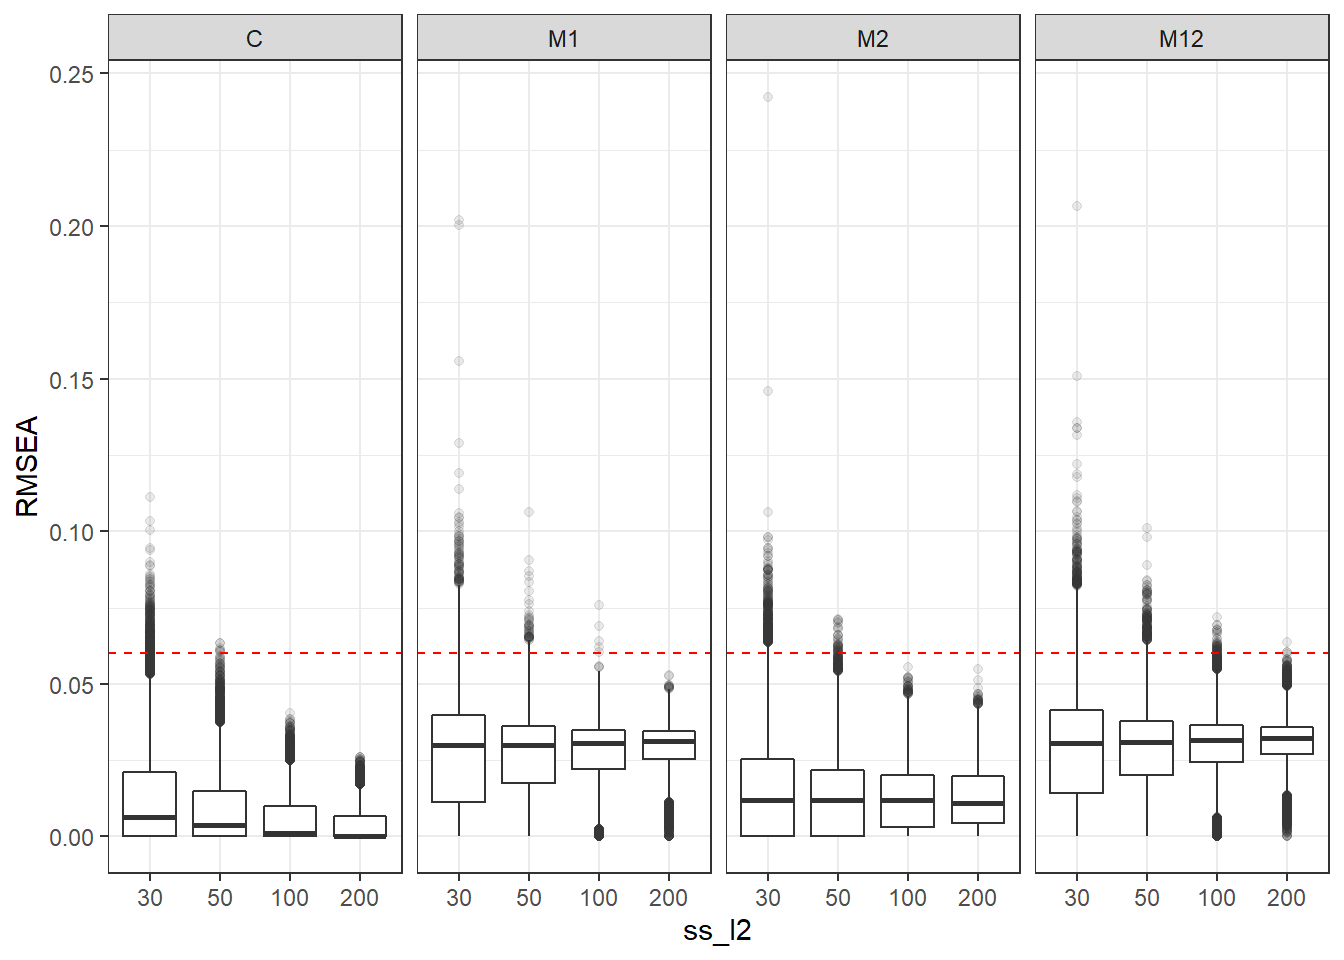
| Version | Author | Date |
|---|---|---|
| a1b0dc1 | noah-padgett | 2019-05-08 |
if(save.fig == T) ggsave("rmsea_marginal_ss_l2_facet_model.pdf",plot = p, width=6, height=4, units='in')

p <- ggplot(mydata, aes(x=icc_ov, y=RMSEA))+
    geom_boxplot(outlier.alpha = .1)+
    geom_abline(intercept = .06, slope=0,
                linetype='dashed', color = 'red') +
    facet_grid(.~Model)
p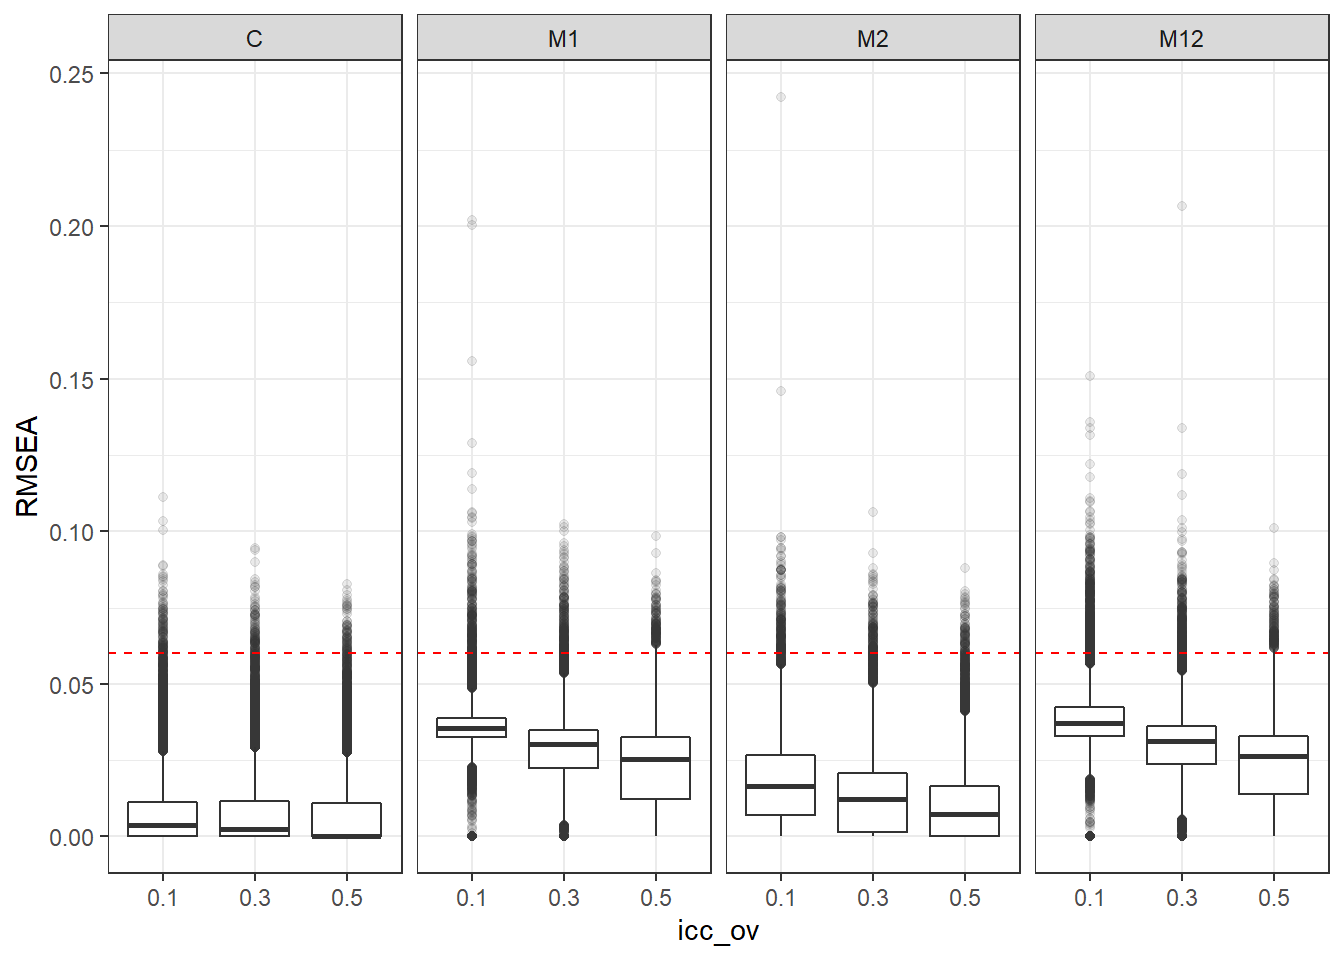
| Version | Author | Date |
|---|---|---|
| a1b0dc1 | noah-padgett | 2019-05-08 |
if(save.fig == T) ggsave("rmsea_marginal_icc_ov_facet_model.pdf",plot = p, width=6, height=4, units='in')


p <- ggplot(mydata, aes(x=icc_lv, y=RMSEA))+
    geom_boxplot(outlier.alpha = .1)+
    geom_abline(intercept = .06, slope=0,
                linetype='dashed', color = 'red') +
    facet_grid(.~Model)
p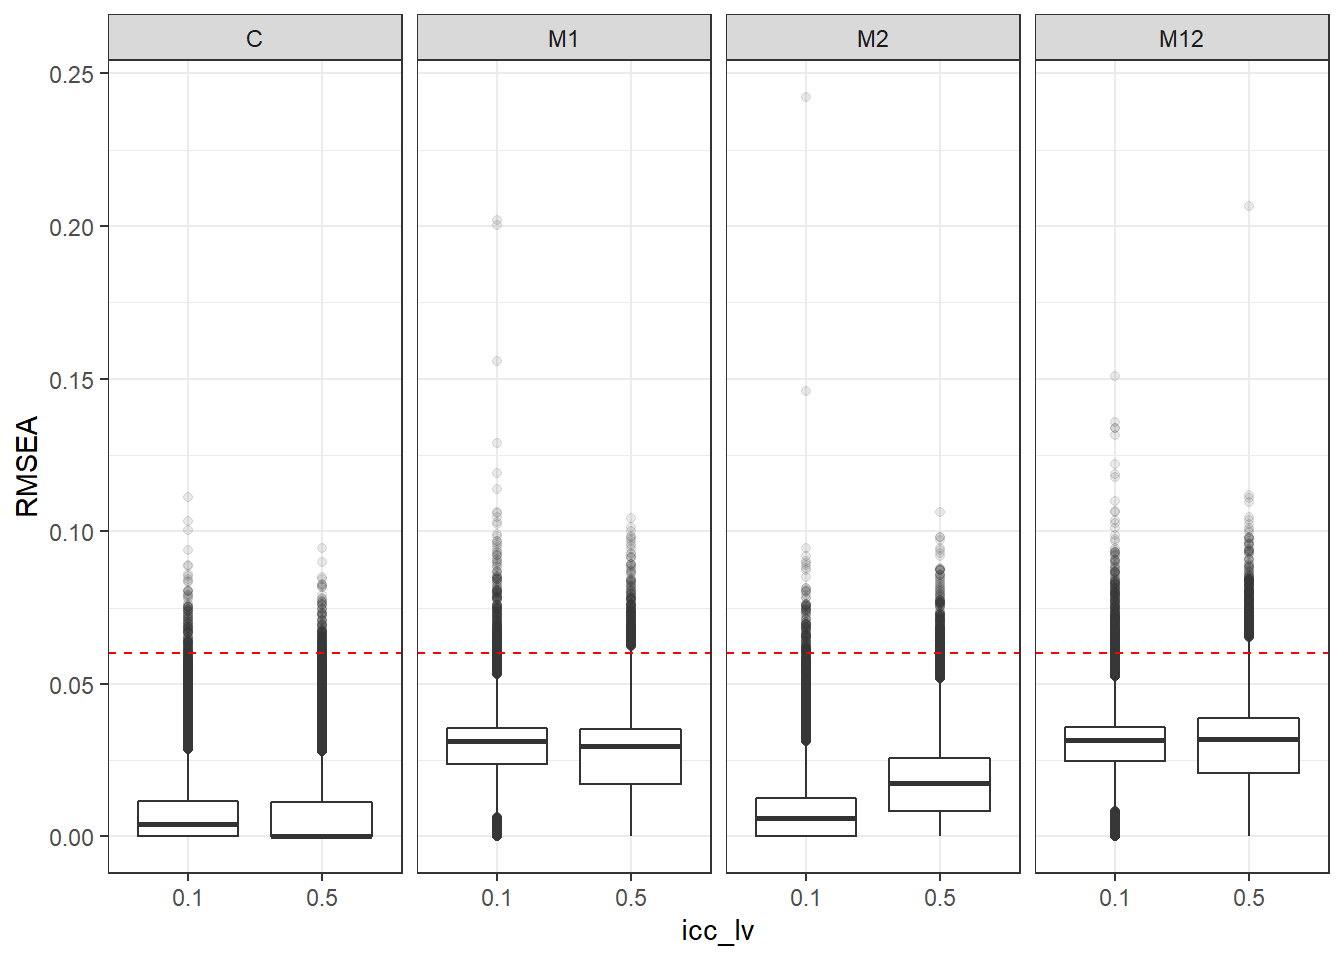
| Version | Author | Date |
|---|---|---|
| a1b0dc1 | noah-padgett | 2019-05-08 |
if(save.fig == T) ggsave("rmsea_marginal_icc_lv_facet_model.pdf",plot = p, width=6, height=4, units='in')SRMRW
p <- ggplot(mydata, aes(x=ss_l1, y=SRMRW))+
    geom_boxplot(outlier.alpha = .1)+
    geom_abline(intercept = .08, slope=0,
                linetype='dashed', color = 'red') +
    facet_grid(.~Model)
p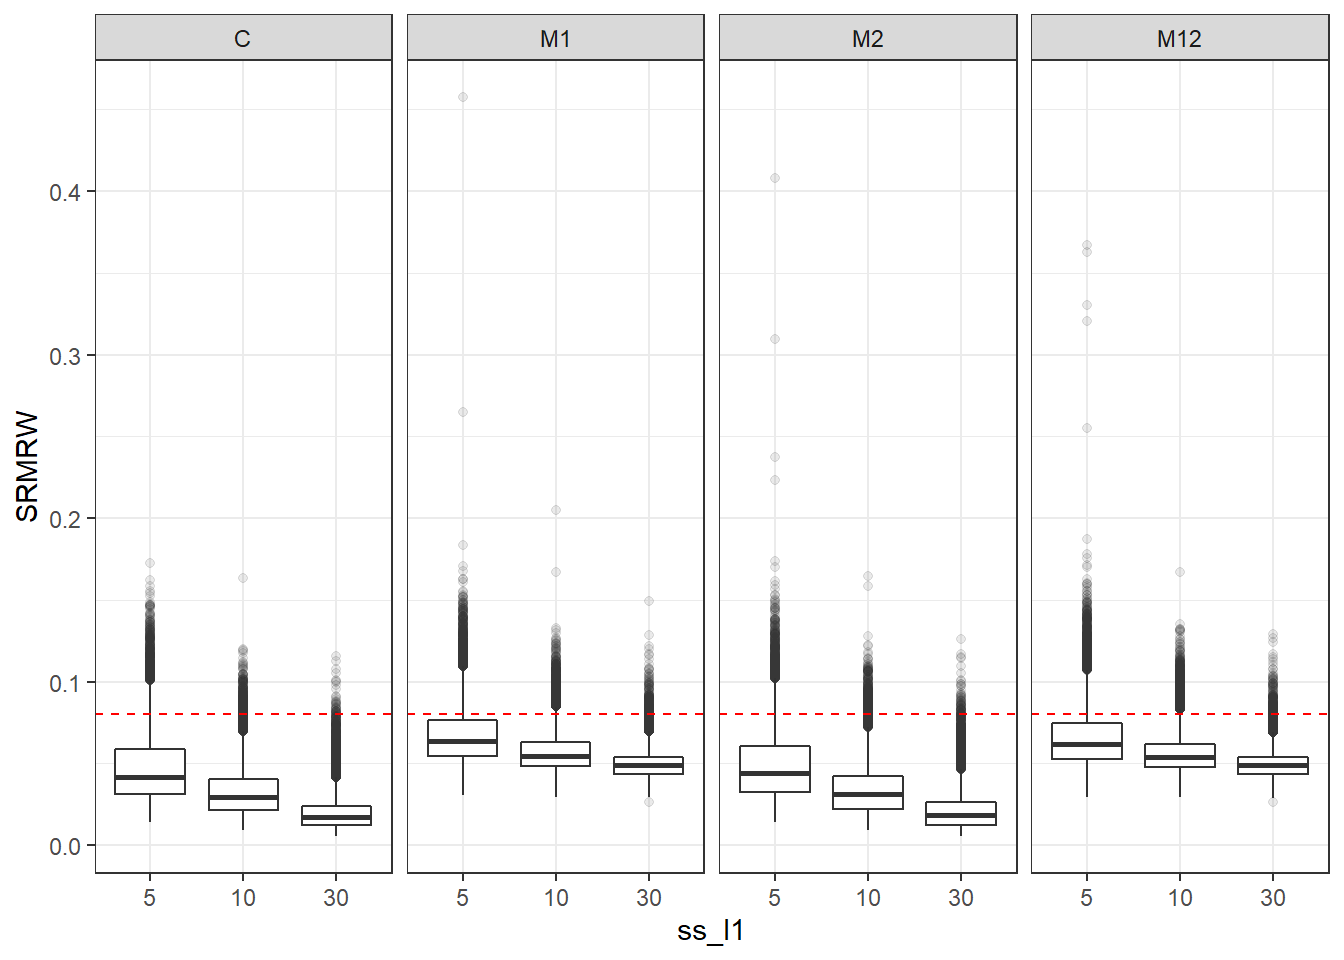
| Version | Author | Date |
|---|---|---|
| a1b0dc1 | noah-padgett | 2019-05-08 |
if(save.fig == T) ggsave("srmrw_marginal_ss_l1_facet_model.pdf",plot = p, width=6, height=4, units='in')


p <- ggplot(mydata, aes(x=ss_l2,  y=SRMRW))+
    geom_boxplot(outlier.alpha = .1)+
    geom_abline(intercept = .08, slope=0,
                linetype='dashed', color = 'red') +
    facet_grid(.~Model)
p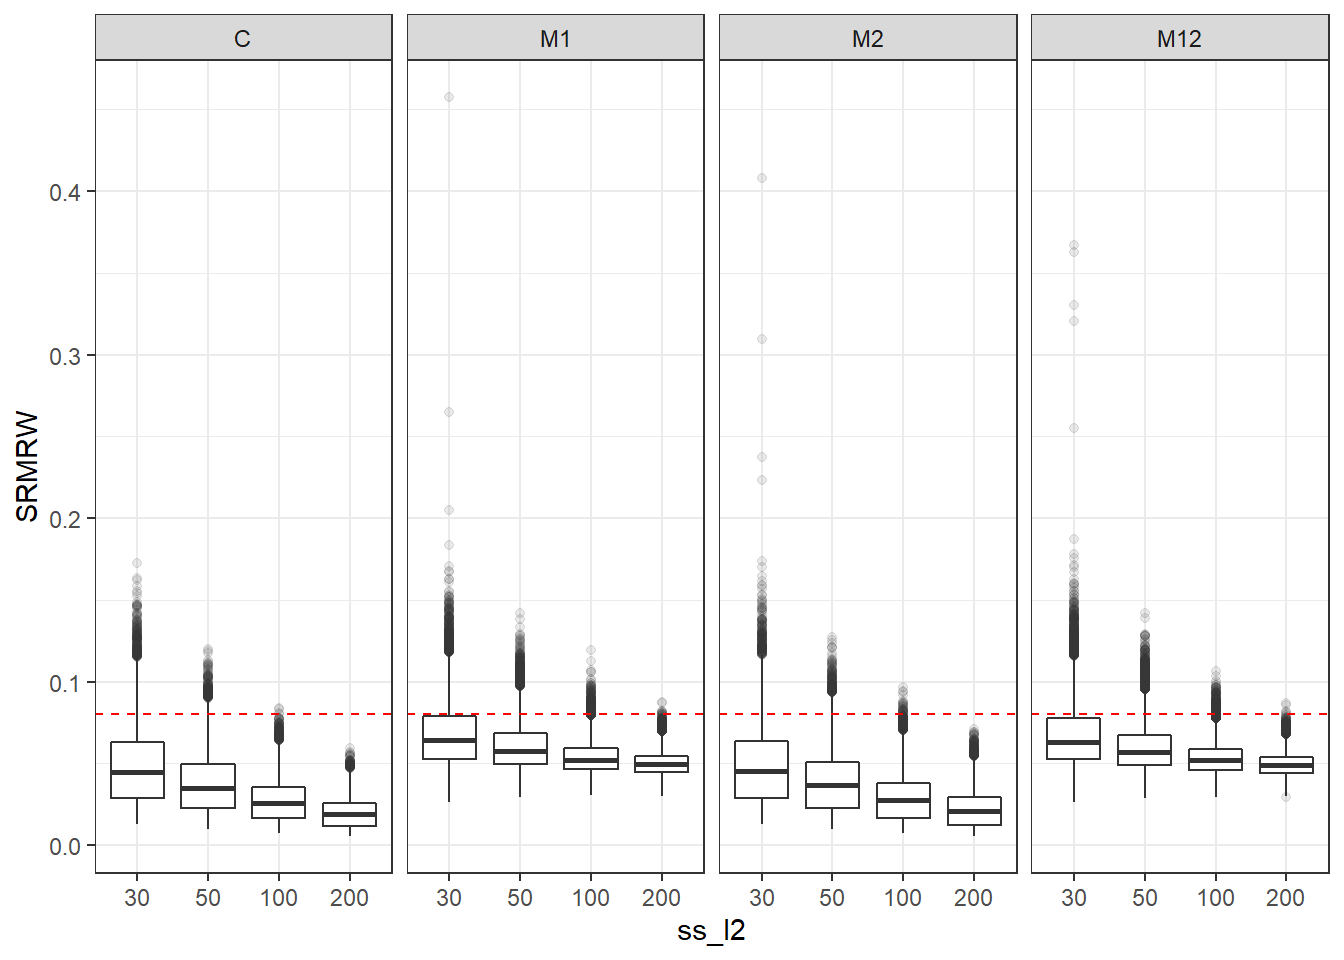
| Version | Author | Date |
|---|---|---|
| a1b0dc1 | noah-padgett | 2019-05-08 |
if(save.fig == T) ggsave("srmrw_marginal_ss_l2_facet_model.pdf",plot = p, scale=1)


p <- ggplot(mydata, aes(x=icc_ov,  y=SRMRW))+
    geom_boxplot(outlier.alpha = .1)+
    geom_abline(intercept = .08, slope=0,
                linetype='dashed', color = 'red') +
    facet_grid(.~Model)
p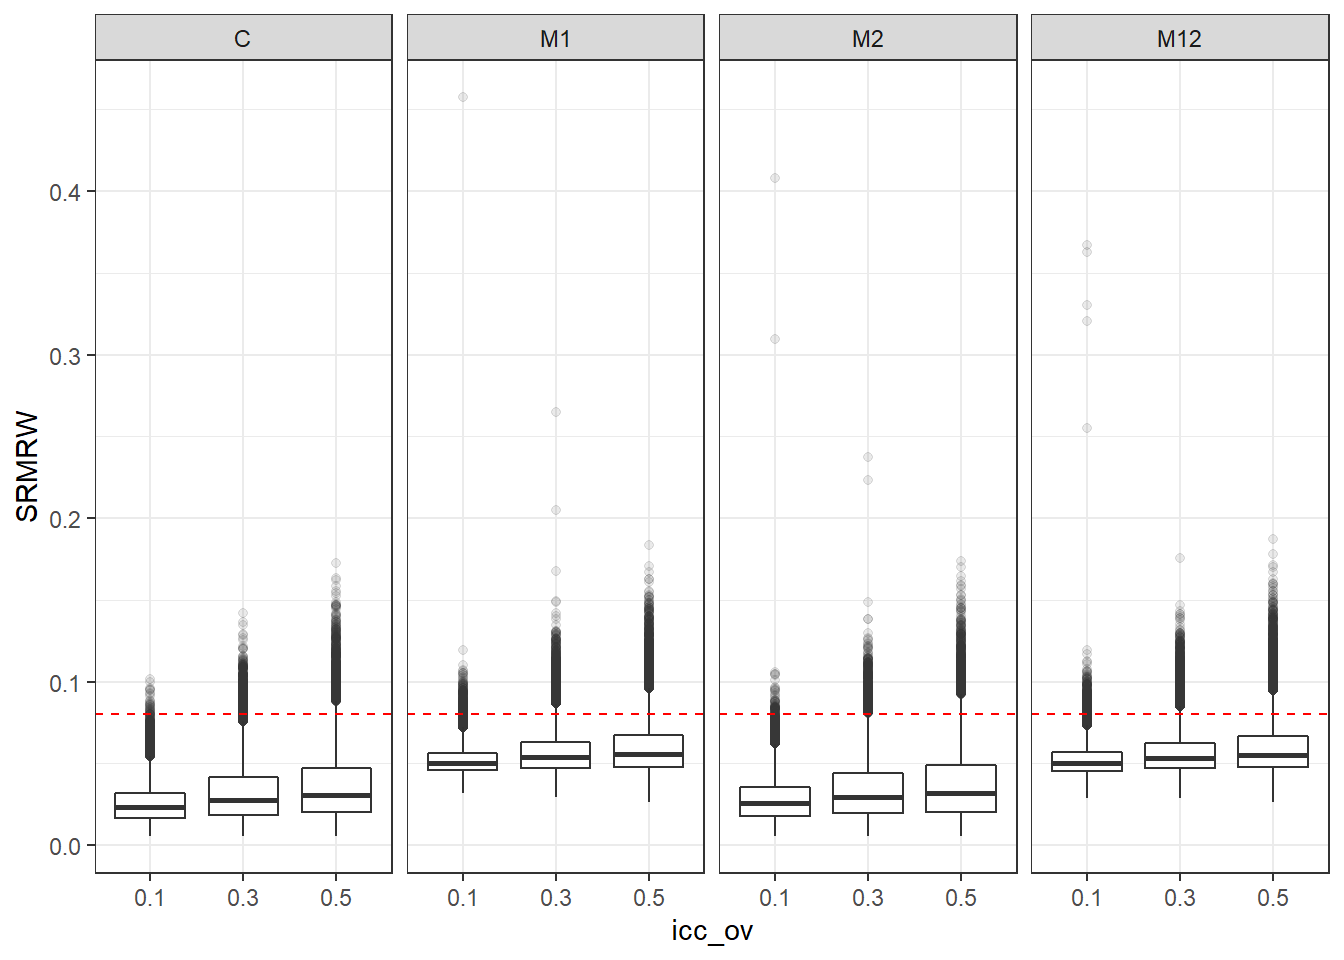
| Version | Author | Date |
|---|---|---|
| a1b0dc1 | noah-padgett | 2019-05-08 |
if(save.fig == T) ggsave("srmrw_marginal_icc_ov_facet_model.pdf",plot = p, width=6, height=4, units='in')


p <- ggplot(mydata, aes(x=icc_lv, y=SRMRW))+
    geom_boxplot(outlier.alpha = .1)+
    geom_abline(intercept = .08, slope=0,
                linetype='dashed', color = 'red') +
    facet_grid(.~Model)
p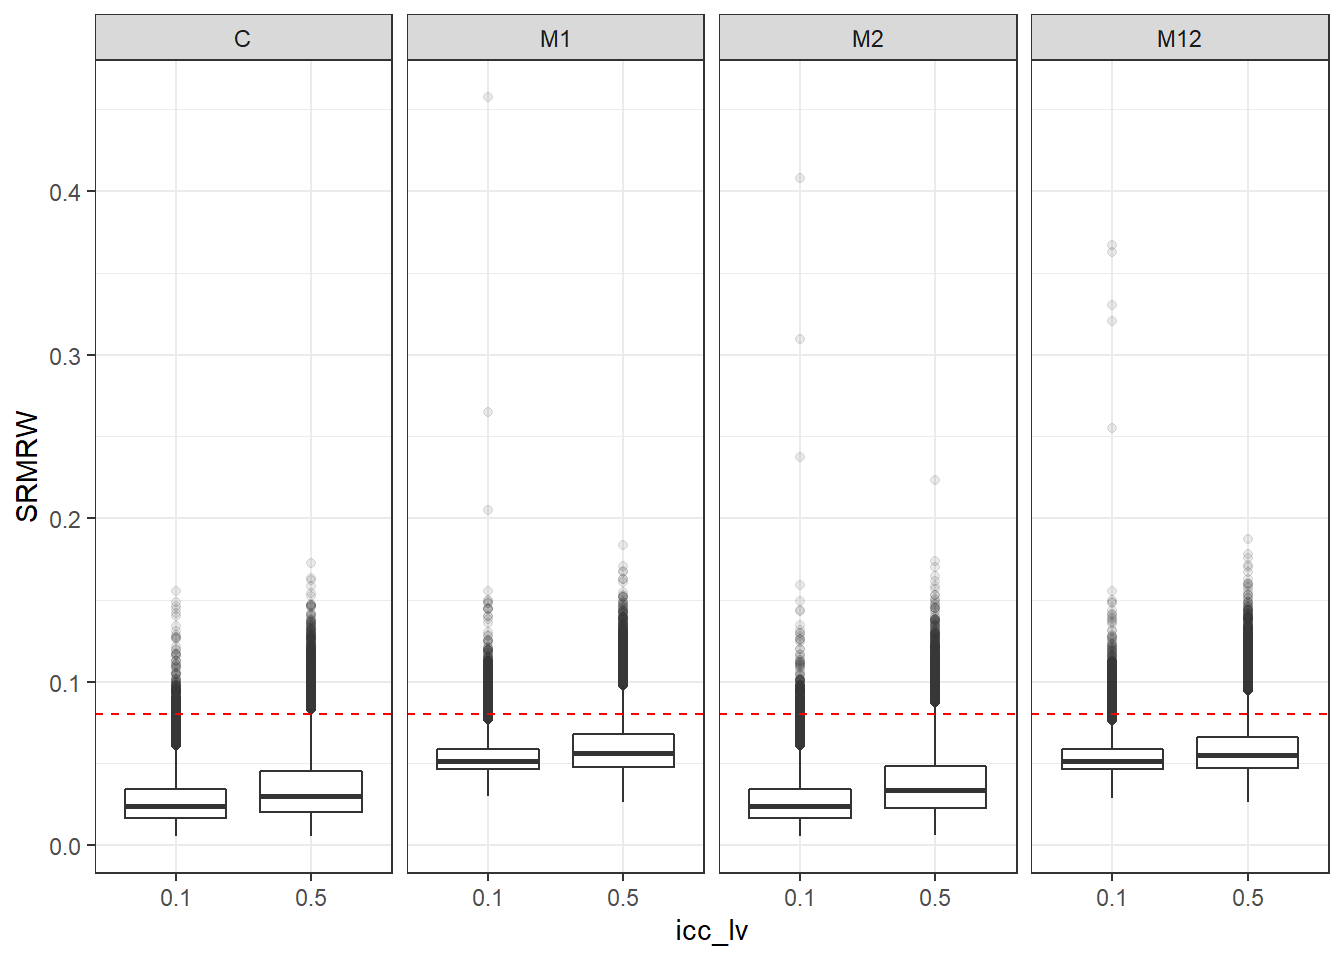
| Version | Author | Date |
|---|---|---|
| a1b0dc1 | noah-padgett | 2019-05-08 |
if(save.fig == T) ggsave("srmrw_marginal_icc_lv_facet_model.pdf",plot = p, width=6, height=4, units='in')SRMRB
p <- ggplot(mydata, aes(x=ss_l1, y=SRMRB))+
    geom_boxplot(outlier.alpha = .1)+
    geom_abline(intercept = .08, slope=0,
                linetype='dashed', color = 'red') +
    facet_grid(.~Model)+
    lims(y=c(0,1))
p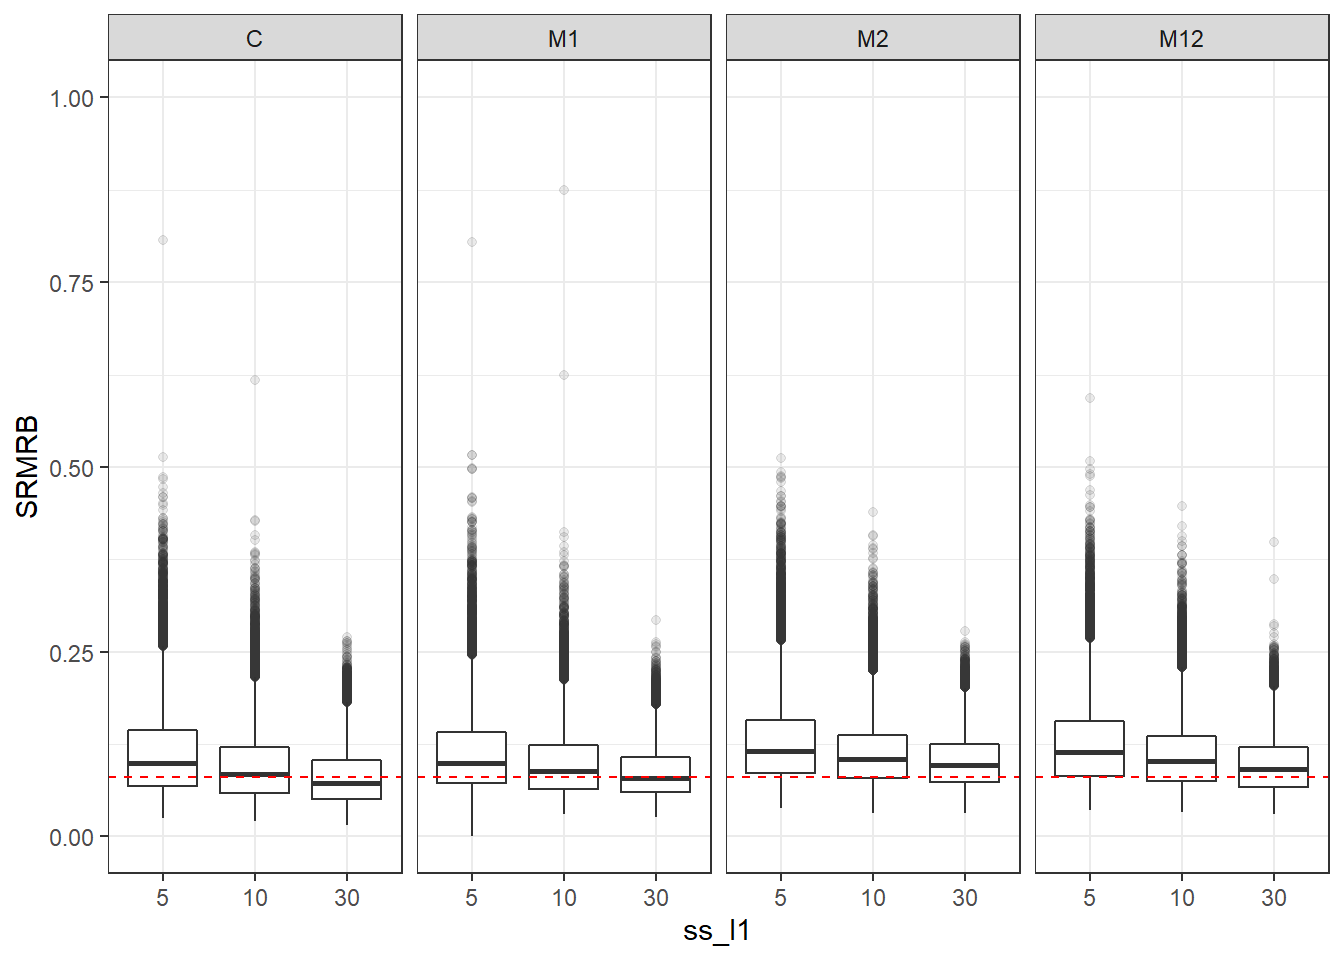
| Version | Author | Date |
|---|---|---|
| a1b0dc1 | noah-padgett | 2019-05-08 |
if(save.fig == T) ggsave("srmrb_marginal_ss_l1_facet_model.pdf",plot = p, width=6, height=4, units='in')


p <- ggplot(mydata, aes(x=ss_l2,  y=SRMRB))+
    geom_boxplot(outlier.alpha = .1)+
    geom_abline(intercept = .08, slope=0,
                linetype='dashed', color = 'red') +
    facet_grid(.~Model)+
    lims(y=c(0,1))
p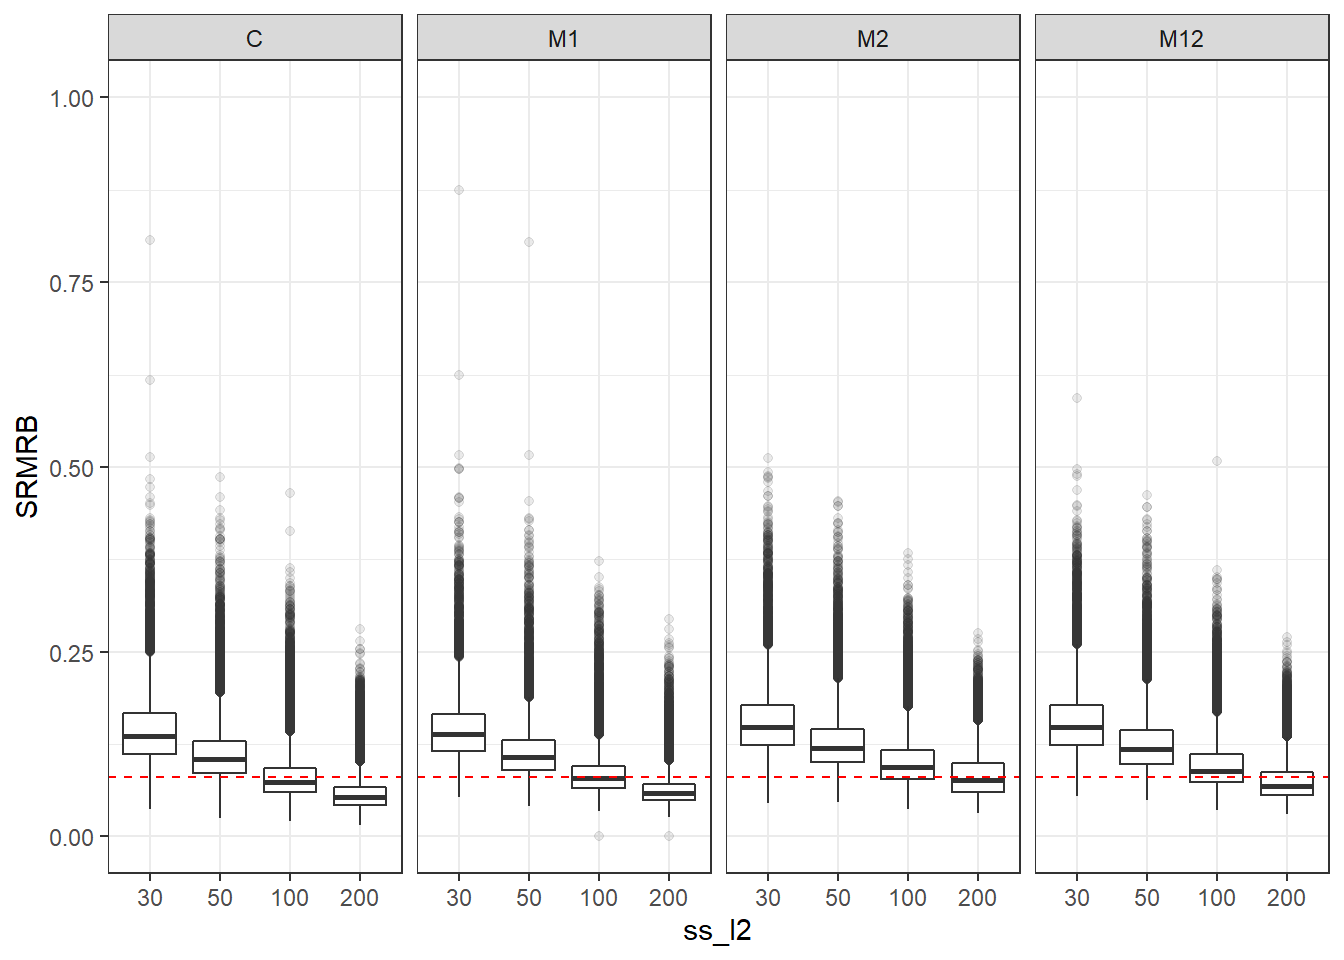
| Version | Author | Date |
|---|---|---|
| a1b0dc1 | noah-padgett | 2019-05-08 |
if(save.fig == T) ggsave("srmrb_marginal_ss_l2_facet_model.pdf",plot = p, width=6, height=4, units='in')

p <- ggplot(mydata, aes(x=icc_ov,  y=SRMRB))+
    geom_boxplot(outlier.alpha = .1)+
    geom_abline(intercept = .08, slope=0,
                linetype='dashed', color = 'red') +
    facet_grid(.~Model)+
    lims(y=c(0,1))
p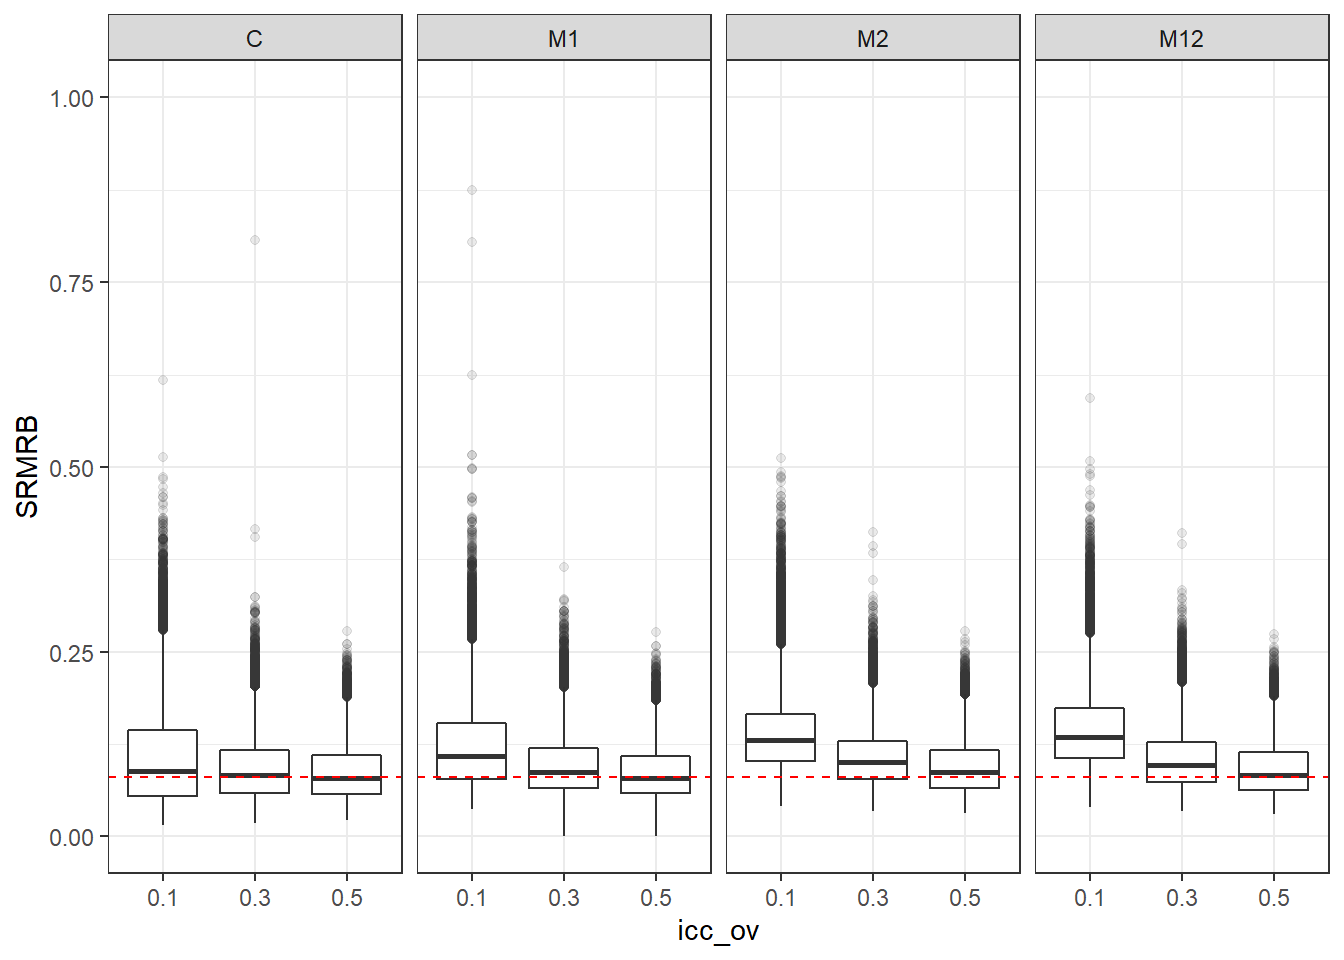
| Version | Author | Date |
|---|---|---|
| a1b0dc1 | noah-padgett | 2019-05-08 |
if(save.fig == T) ggsave("srmrb_marginal_icc_ov_facet_model.pdf",plot = p, width=6, height=4, units='in')

p <- ggplot(mydata, aes(x=icc_lv, y=SRMRB))+
    geom_boxplot(outlier.alpha = .1)+
    geom_abline(intercept = .08, slope=0,
                linetype='dashed', color = 'red') +
    facet_grid(.~Model)+
    lims(y=c(0,1))
p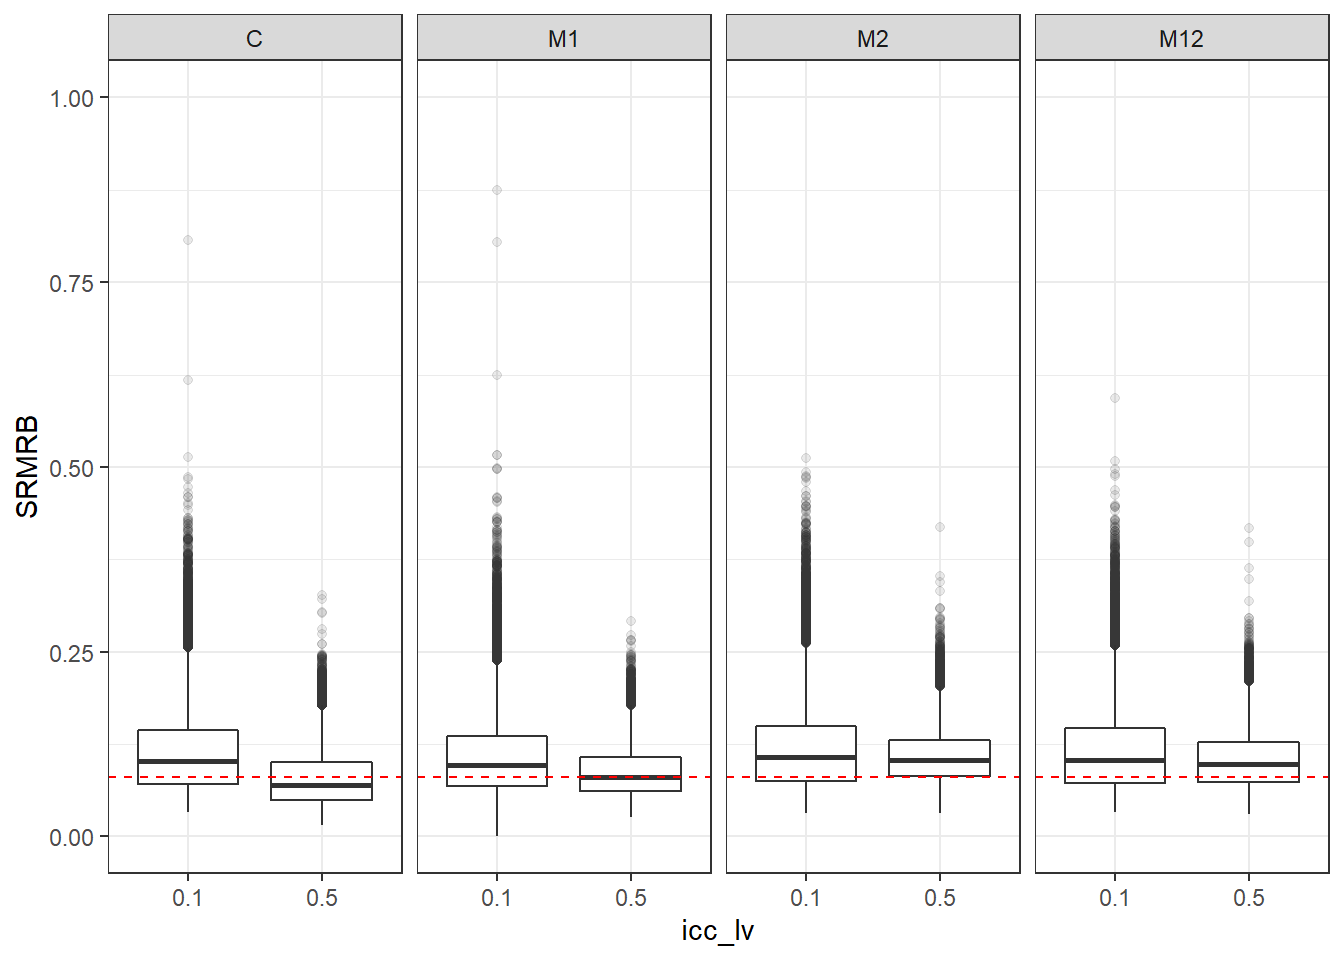
| Version | Author | Date |
|---|---|---|
| a1b0dc1 | noah-padgett | 2019-05-08 |
if(save.fig == T) ggsave("srmrb_marginal_icc_lv_facet_model.pdf",plot = p, width=6, height=4, units='in')Marginal Plots of Conditions Facetted by Estimator and Model
CFI
p <- ggplot(mydata, aes(x=ss_l1, y=CFI))+
    geom_boxplot(outlier.alpha = .1)+
    geom_abline(intercept = .95, slope=0,
                linetype='dashed', color = 'red') +
    facet_grid(Model~Estimator)
p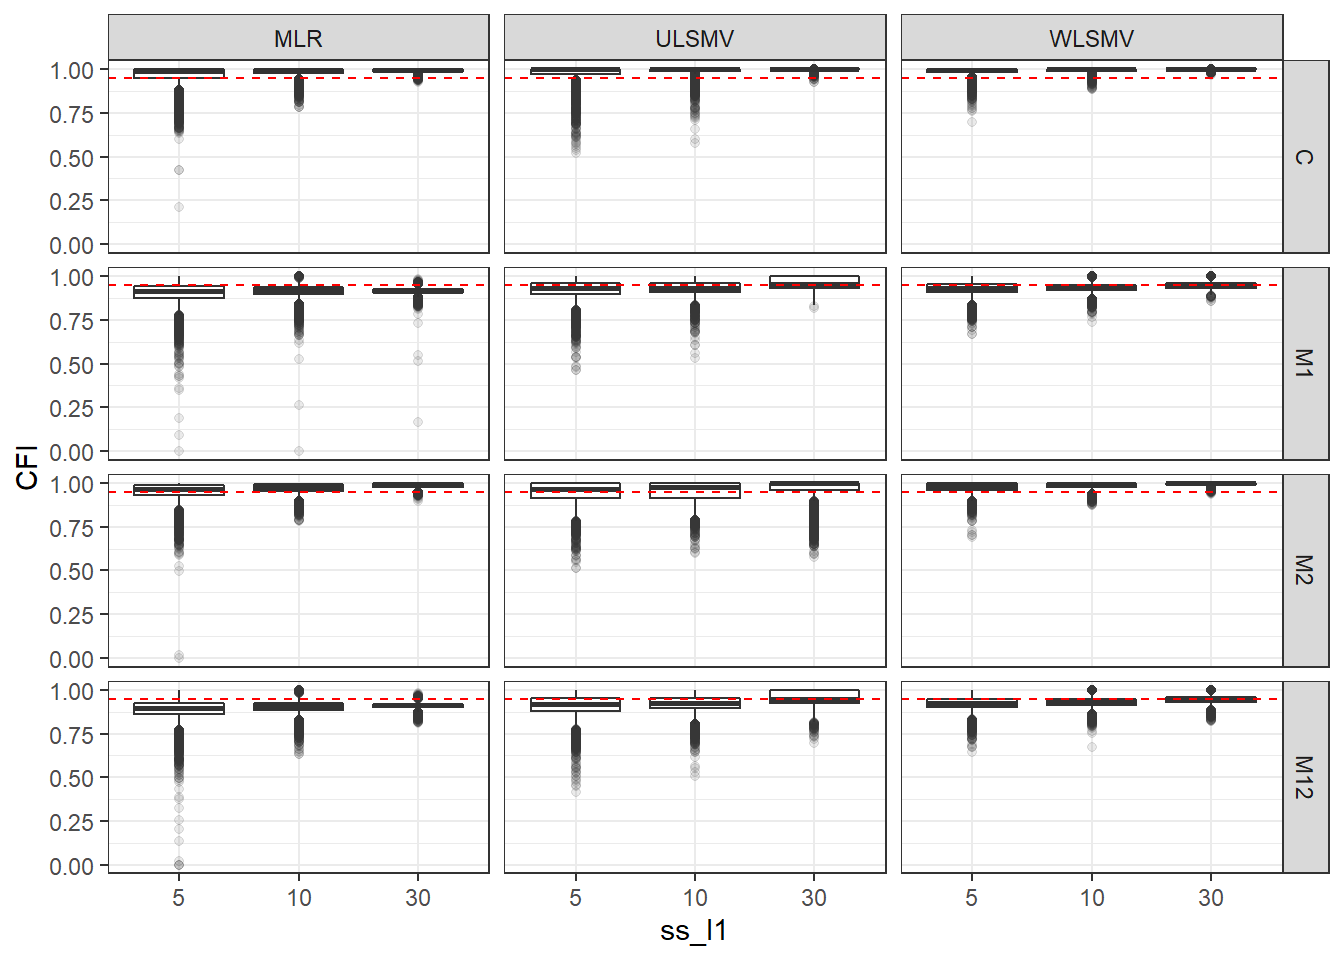
| Version | Author | Date |
|---|---|---|
| a1b0dc1 | noah-padgett | 2019-05-08 |
if(save.fig == T) ggsave("cfi_marginal_ssl1_facet_estimator_model.pdf",plot = p, width=9, height=6, units='in')


p <- ggplot(mydata, aes(x=ss_l2, y=CFI))+
    geom_boxplot(outlier.alpha = .1)+
    geom_abline(intercept = .95, slope=0,
                linetype='dashed', color = 'red') +
    facet_grid(Model~Estimator)
p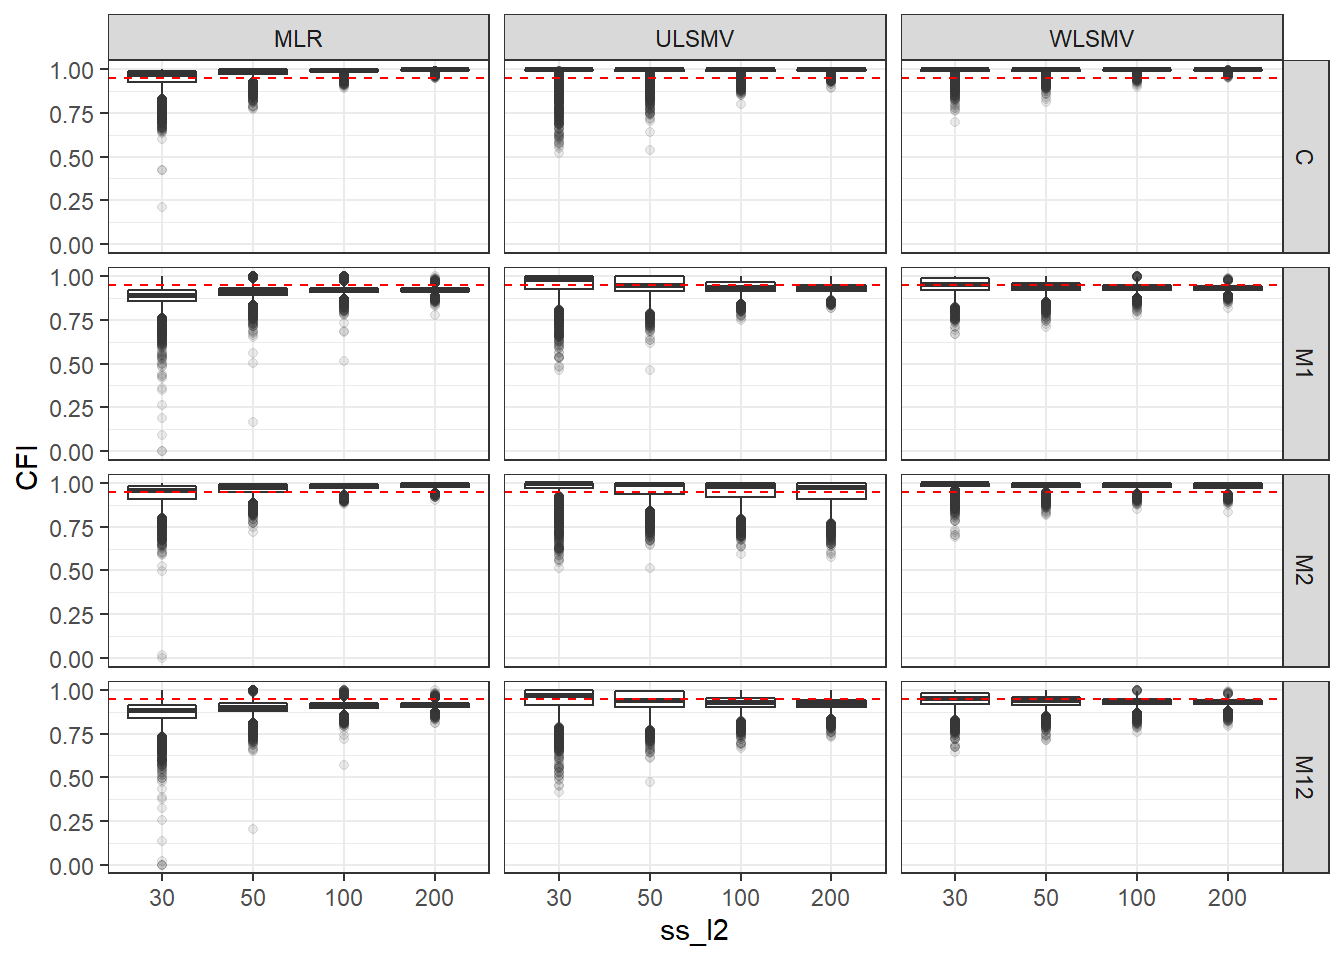
| Version | Author | Date |
|---|---|---|
| a1b0dc1 | noah-padgett | 2019-05-08 |
if(save.fig == T) ggsave("cfi_marginal_ss_l2_facet_estimator_model.pdf",plot = p, width=9, height=6, units='in')


p <- ggplot(mydata, aes(x=icc_ov, y=CFI))+
    geom_boxplot(outlier.alpha = .1)+
    geom_abline(intercept = .95, slope=0,
                linetype='dashed', color = 'red') +
    facet_grid(Model~Estimator)
p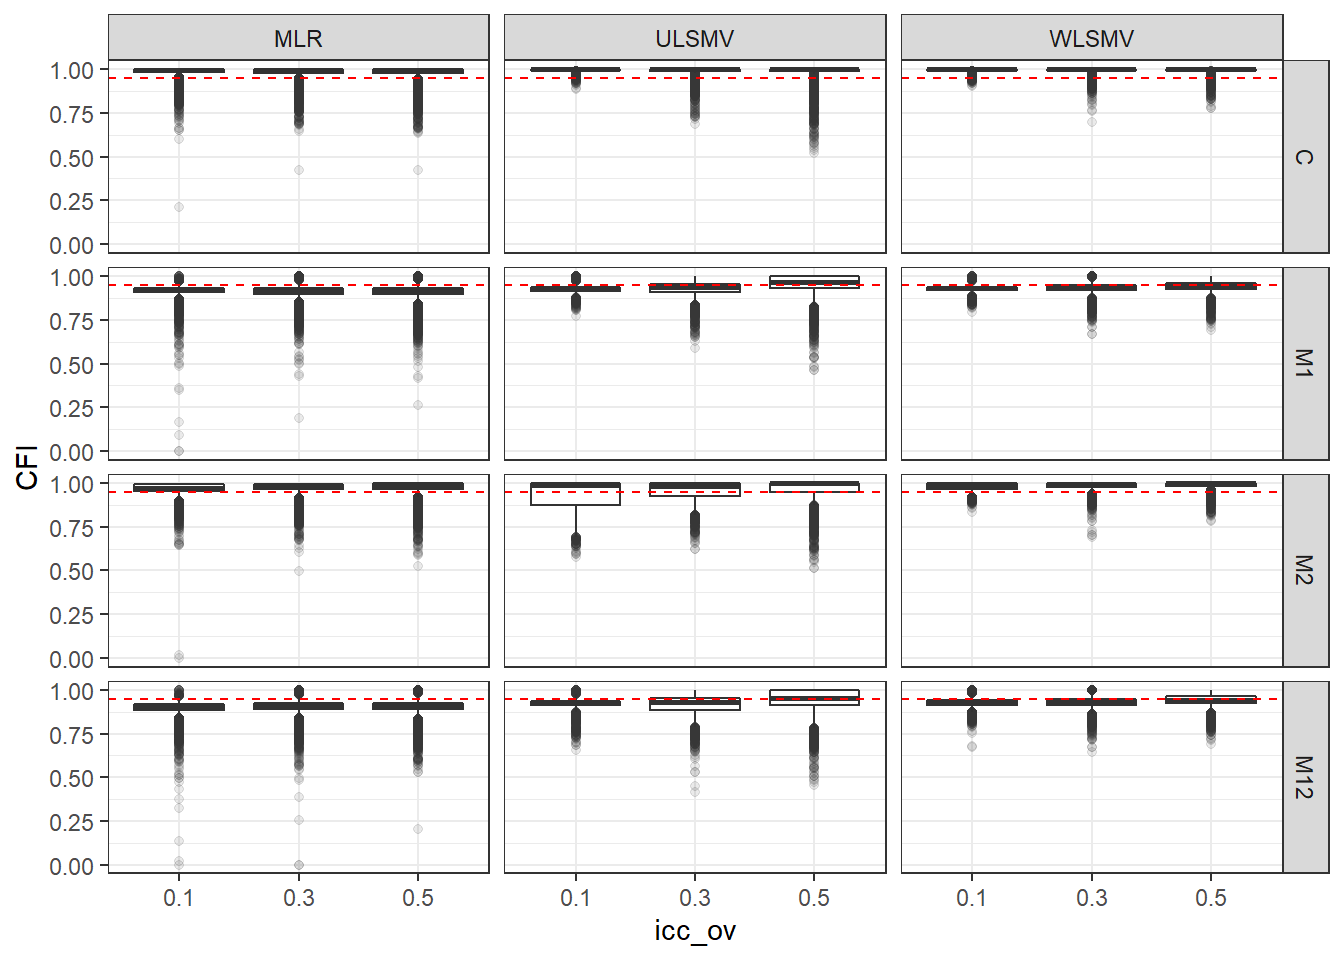
| Version | Author | Date |
|---|---|---|
| a1b0dc1 | noah-padgett | 2019-05-08 |
if(save.fig == T) ggsave("cfi_marginal_icc_ov_facet_estimator_model.pdf",plot = p, width=9, height=6, units='in')


p <- ggplot(mydata, aes(x=icc_lv, y=CFI))+
    geom_boxplot(outlier.alpha = .1)+
    geom_abline(intercept = .95, slope=0,
                linetype='dashed', color = 'red') +
    facet_grid(Model~Estimator)
p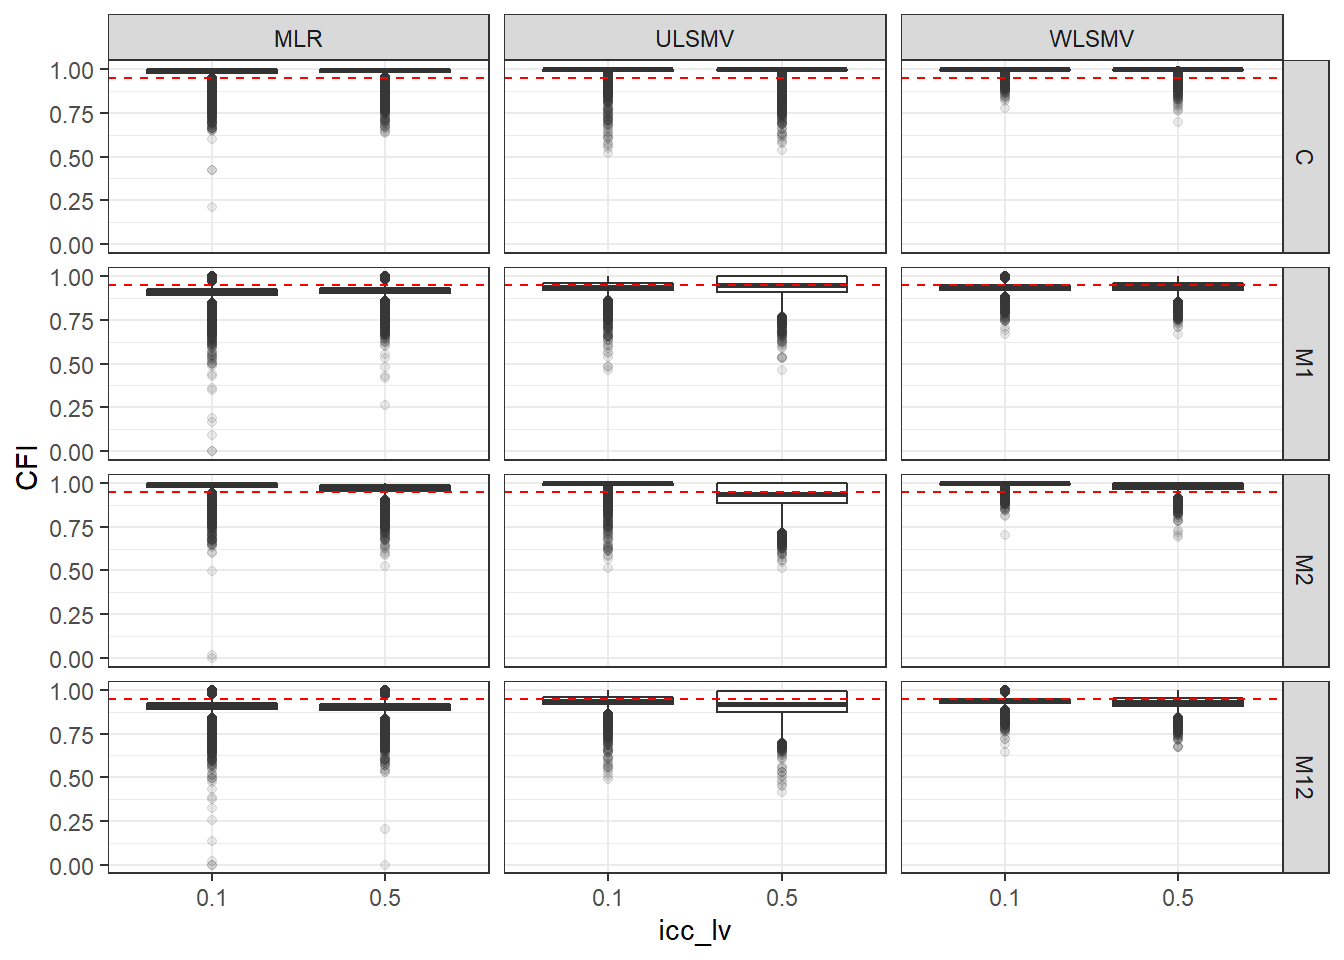
| Version | Author | Date |
|---|---|---|
| a1b0dc1 | noah-padgett | 2019-05-08 |
if(save.fig == T) ggsave("cfi_marginal_icc_lv_facet_estimator_model.pdf",plot = p, width=9, height=6, units='in')TLI
p <- ggplot(mydata, aes(x=ss_l1, y=TLI))+
    geom_boxplot(outlier.alpha = .1)+
    geom_abline(intercept = .95, slope=0,
                linetype='dashed', color = 'red') +
    facet_grid(Model~Estimator)
p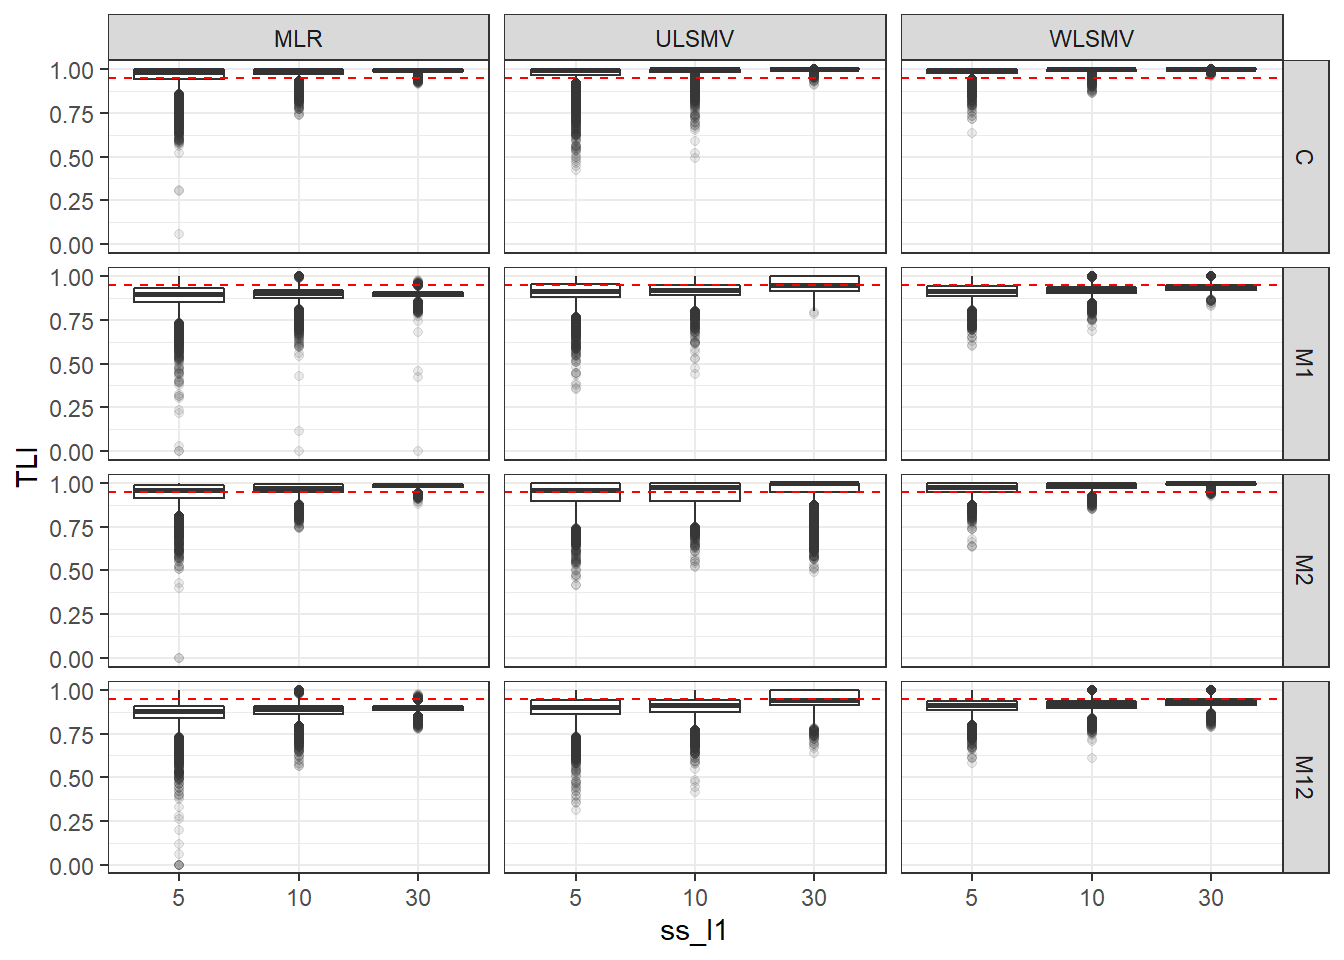
| Version | Author | Date |
|---|---|---|
| a1b0dc1 | noah-padgett | 2019-05-08 |
if(save.fig == T) ggsave("tli_marginal_ss_l1_facet_estimator_model.pdf",plot = p, width=9, height=6, units='in')


p <- ggplot(mydata, aes(x=ss_l2, y=TLI))+
    geom_boxplot(outlier.alpha = .1)+
    geom_abline(intercept = .95, slope=0,
                linetype='dashed', color = 'red') +
    facet_grid(Model~Estimator)
p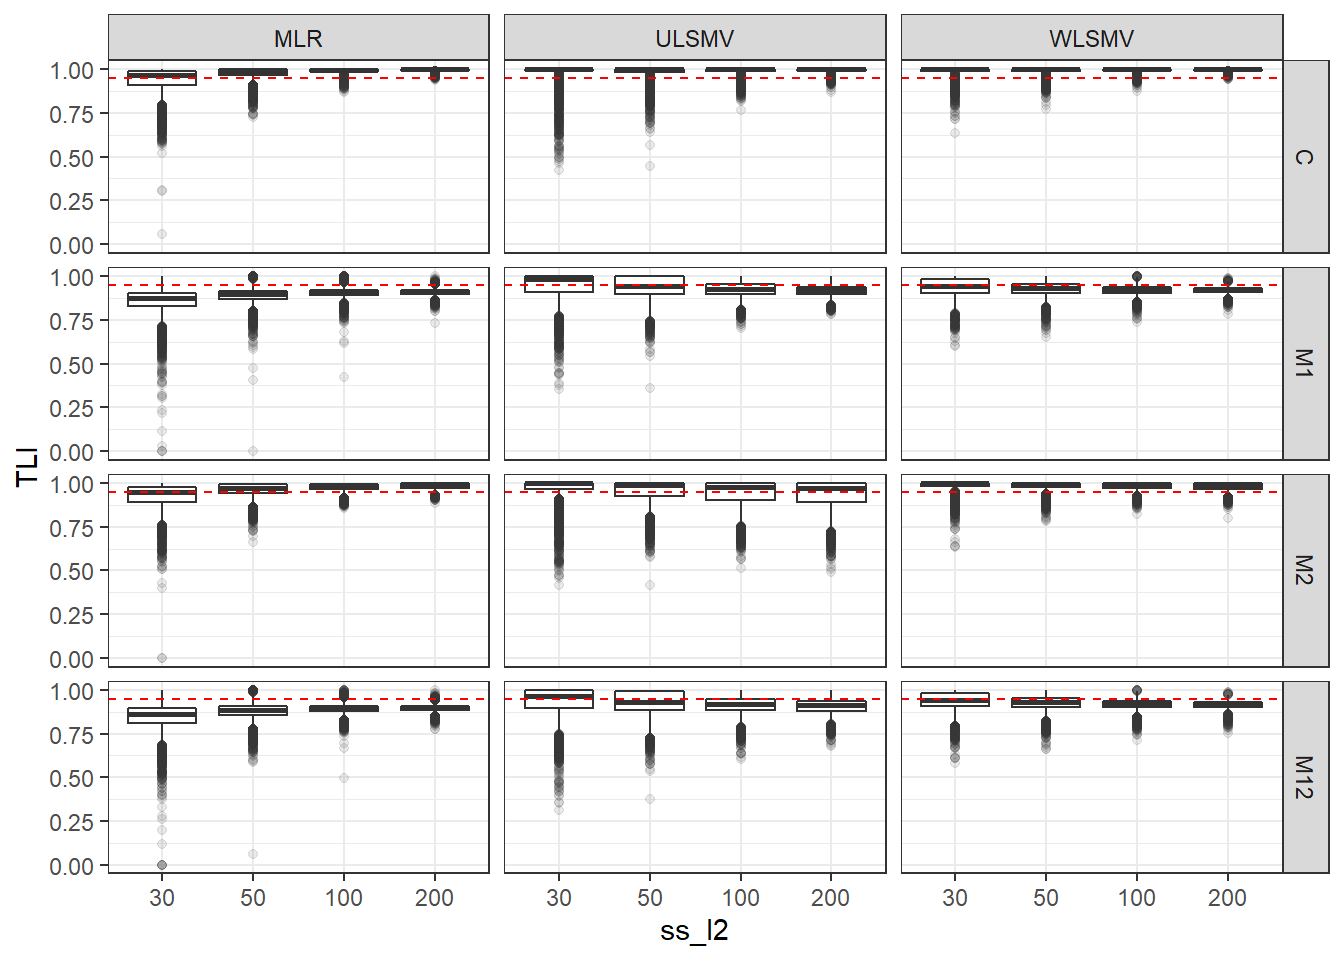
| Version | Author | Date |
|---|---|---|
| a1b0dc1 | noah-padgett | 2019-05-08 |
if(save.fig == T) ggsave("tli_marginal_ss_l2_facet_estimator_model.pdf",plot = p, width=9, height=6, units='in')

p <- ggplot(mydata, aes(x=icc_ov, y=TLI))+
    geom_boxplot(outlier.alpha = .1)+
    geom_abline(intercept = .95, slope=0,
                linetype='dashed', color = 'red') +
    facet_grid(Model~Estimator)
p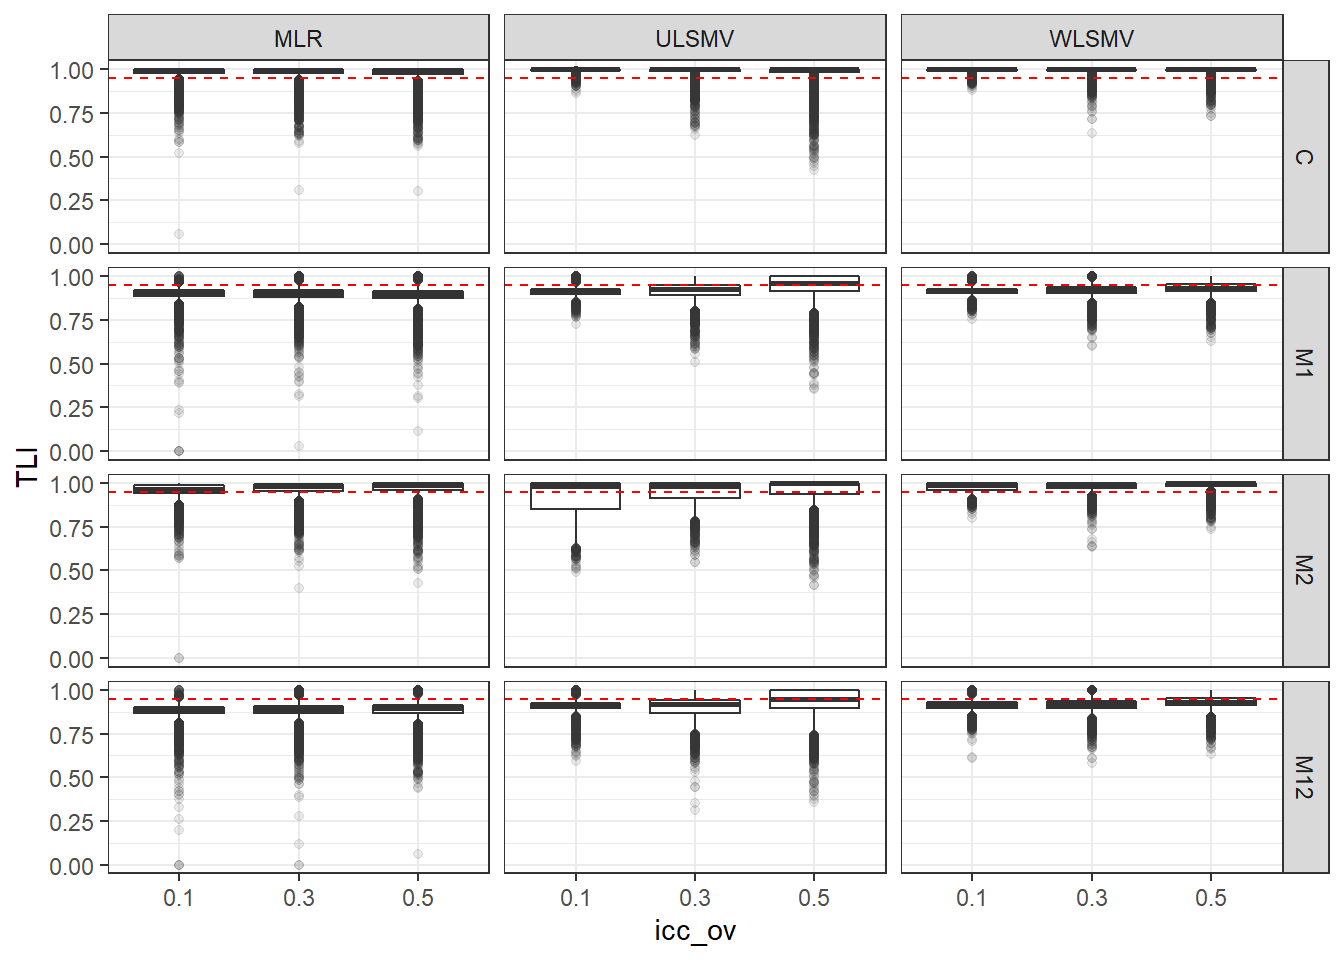
| Version | Author | Date |
|---|---|---|
| a1b0dc1 | noah-padgett | 2019-05-08 |
if(save.fig == T) ggsave("tli_marginal_icc_ov_facet_estimator_model.pdf",plot = p, width=9, height=6, units='in')

p <- ggplot(mydata, aes(x=icc_lv, y=TLI))+
    geom_boxplot(outlier.alpha = .1)+
    geom_abline(intercept = .95, slope=0,
                linetype='dashed', color = 'red') +
    facet_grid(Model~Estimator)
p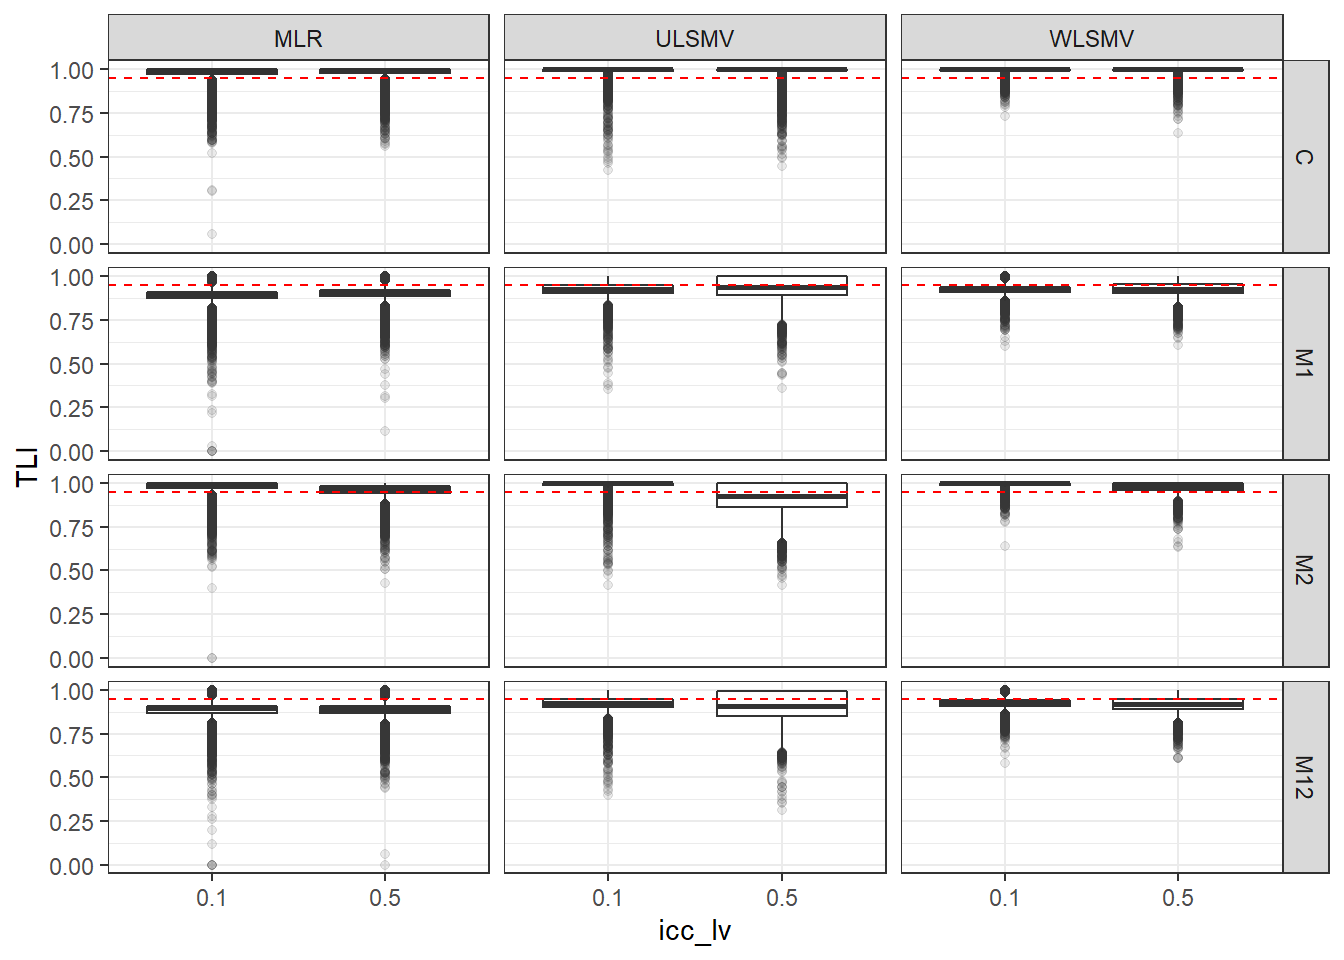
| Version | Author | Date |
|---|---|---|
| a1b0dc1 | noah-padgett | 2019-05-08 |
if(save.fig == T) ggsave("tli_marginal_icc_lv_facet_estimator_model.pdf",plot = p, width=9, height=6, units='in')RMSEA
p <- ggplot(mydata, aes(x=ss_l1, y=RMSEA))+
    geom_boxplot(outlier.alpha = .1)+
    geom_abline(intercept = .06, slope=0,
                linetype='dashed', color = 'red') +
    facet_grid(Model~Estimator)
p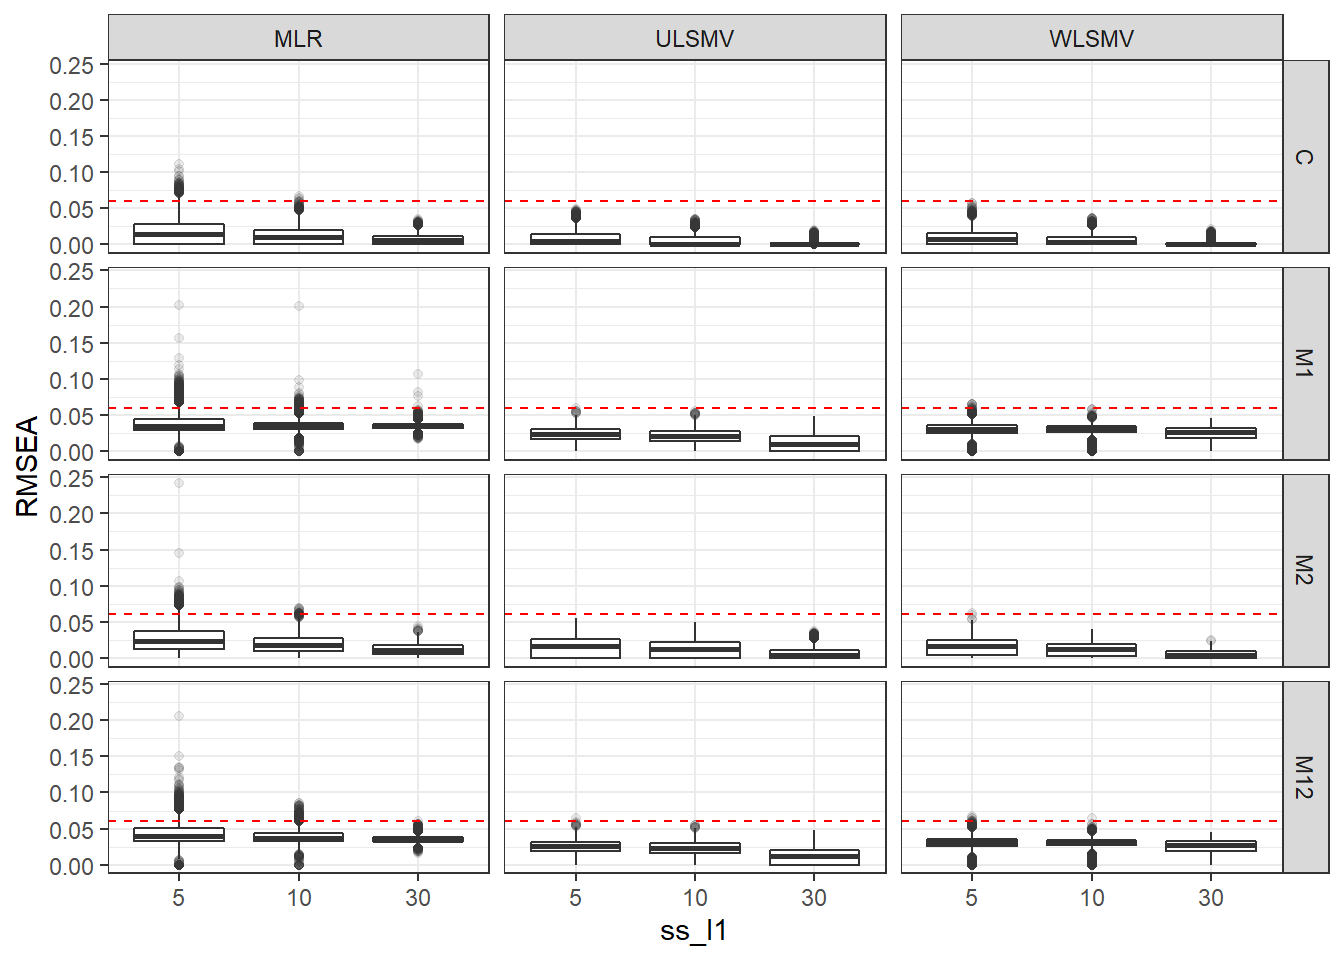
| Version | Author | Date |
|---|---|---|
| a1b0dc1 | noah-padgett | 2019-05-08 |
if(save.fig == T) ggsave("rmsea_marginal_ss_l1_facet_estimator_model.pdf",plot = p, width=9, height=6, units='in')


p <- ggplot(mydata, aes(x=ss_l2, y=RMSEA))+
    geom_boxplot(outlier.alpha = .1)+
    geom_abline(intercept = .06, slope=0,
                linetype='dashed', color = 'red') +
    facet_grid(Model~Estimator)
p
| Version | Author | Date |
|---|---|---|
| a1b0dc1 | noah-padgett | 2019-05-08 |
if(save.fig == T) ggsave("rmsea_marginal_ss_l2_facet_estimator_model.pdf",plot = p, width=9, height=6, units='in')

p <- ggplot(mydata, aes(x=icc_ov, y=RMSEA))+
    geom_boxplot(outlier.alpha = .1)+
    geom_abline(intercept = .06, slope=0,
                linetype='dashed', color = 'red') +
    facet_grid(Model~Estimator)
p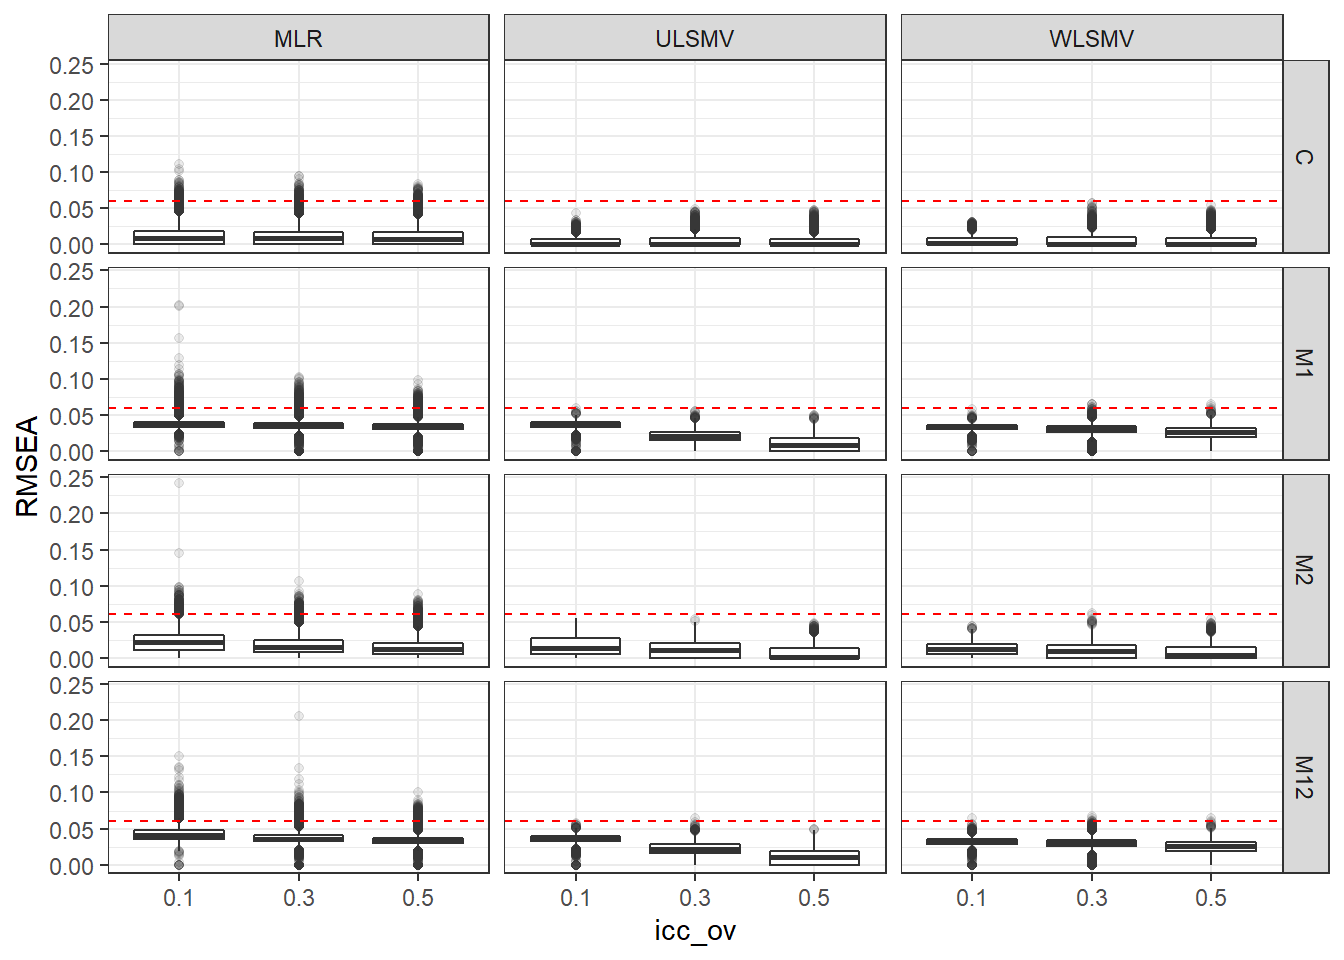
| Version | Author | Date |
|---|---|---|
| a1b0dc1 | noah-padgett | 2019-05-08 |
if(save.fig == T) ggsave("rmsea_marginal_icc_ov_facet_estimator_model.pdf",plot = p, width=9, height=6, units='in')


p <- ggplot(mydata, aes(x=icc_lv, y=RMSEA))+
    geom_boxplot(outlier.alpha = .1)+
    geom_abline(intercept = .06, slope=0,
                linetype='dashed', color = 'red') +
    facet_grid(Model~Estimator)
p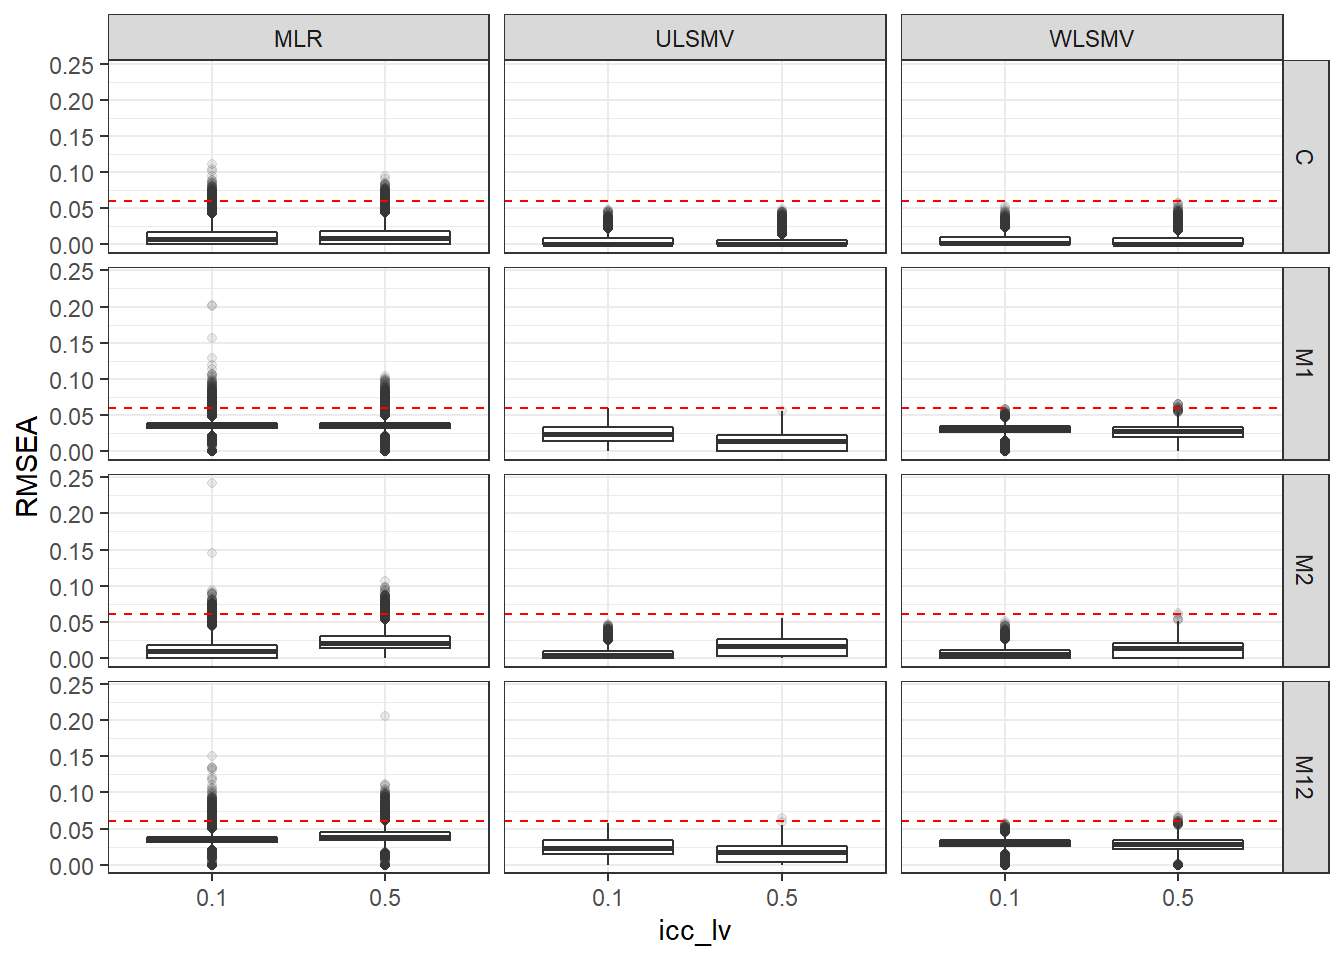
| Version | Author | Date |
|---|---|---|
| a1b0dc1 | noah-padgett | 2019-05-08 |
if(save.fig == T) ggsave("rmsea_marginal_icc_lv_facet_estimator_model.pdf",plot = p, width=9, height=6, units='in')SRMRW
p <- ggplot(mydata, aes(x=ss_l1, y=SRMRW))+
    geom_boxplot(outlier.alpha = .1)+
    geom_abline(intercept = .08, slope=0,
                linetype='dashed', color = 'red') +
    facet_grid(Model~Estimator)
p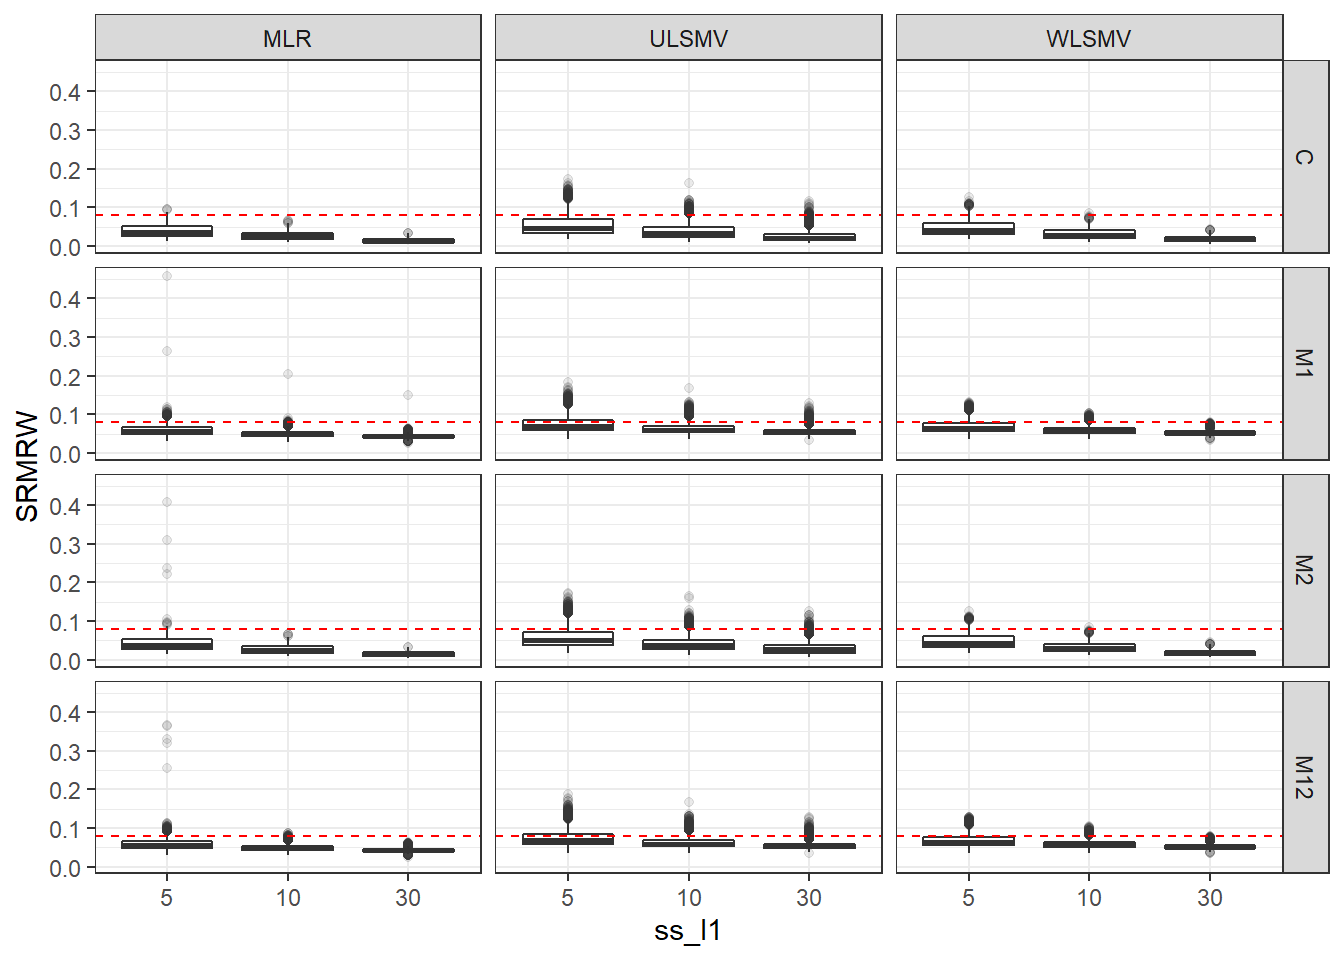
| Version | Author | Date |
|---|---|---|
| a1b0dc1 | noah-padgett | 2019-05-08 |
if(save.fig == T) ggsave("srmrw_marginal_ss_l1_facet_estimator_model.pdf",plot = p, width=9, height=6, units='in')


p <- ggplot(mydata, aes(x=ss_l2,  y=SRMRW))+
    geom_boxplot(outlier.alpha = .1)+
    geom_abline(intercept = .08, slope=0,
                linetype='dashed', color = 'red') +
    facet_grid(Model~Estimator)
p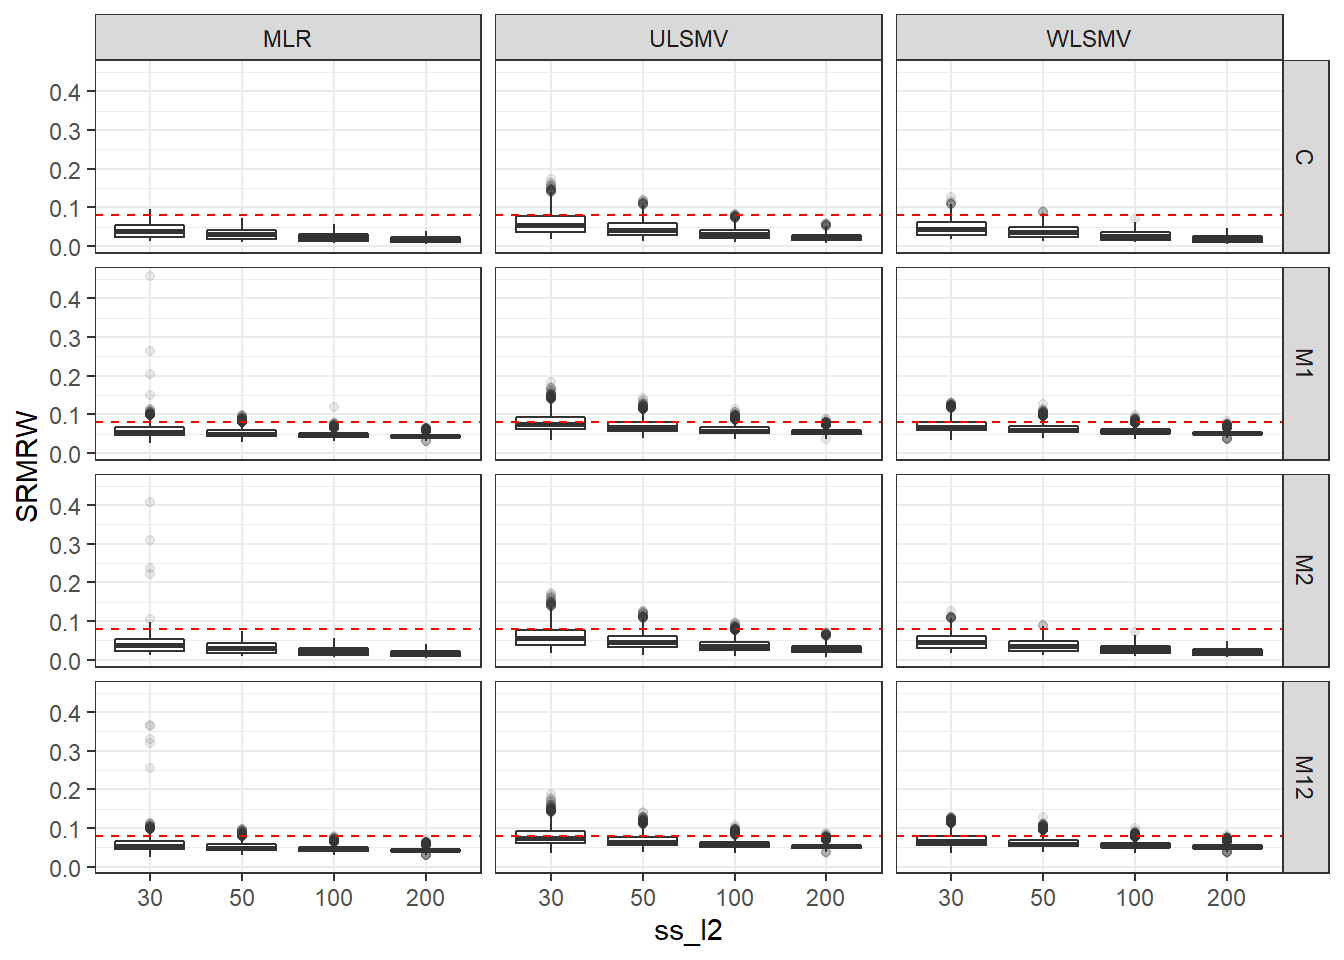
| Version | Author | Date |
|---|---|---|
| a1b0dc1 | noah-padgett | 2019-05-08 |
if(save.fig == T) ggsave("srmrw_marginal_ss_l2_facet_estimator_model.pdf",plot = p, width=9, height=6, units='in')


p <- ggplot(mydata, aes(x=icc_ov,  y=SRMRW))+
    geom_boxplot(outlier.alpha = .1)+
    geom_abline(intercept = .08, slope=0,
                linetype='dashed', color = 'red') +
    facet_grid(Model~Estimator)
p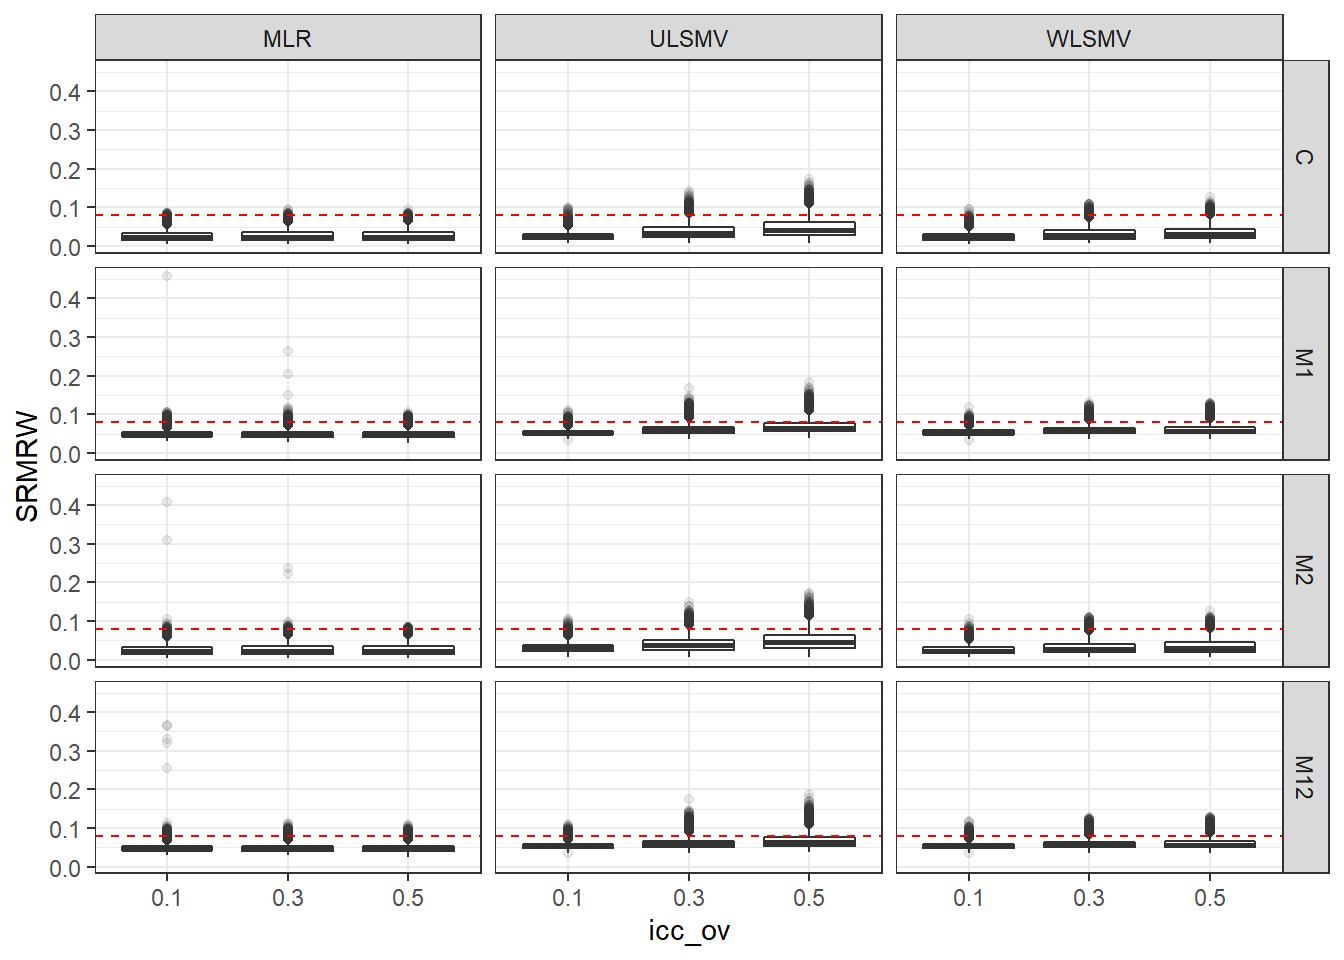
| Version | Author | Date |
|---|---|---|
| a1b0dc1 | noah-padgett | 2019-05-08 |
if(save.fig == T) ggsave("srmrw_marginal_icc_ov_facet_estimator_model.pdf",plot = p, width=9, height=6, units='in')


p <- ggplot(mydata, aes(x=icc_lv, y=SRMRW))+
    geom_boxplot(outlier.alpha = .1)+
    geom_abline(intercept = .08, slope=0,
                linetype='dashed', color = 'red') +
    facet_grid(Model~Estimator)
p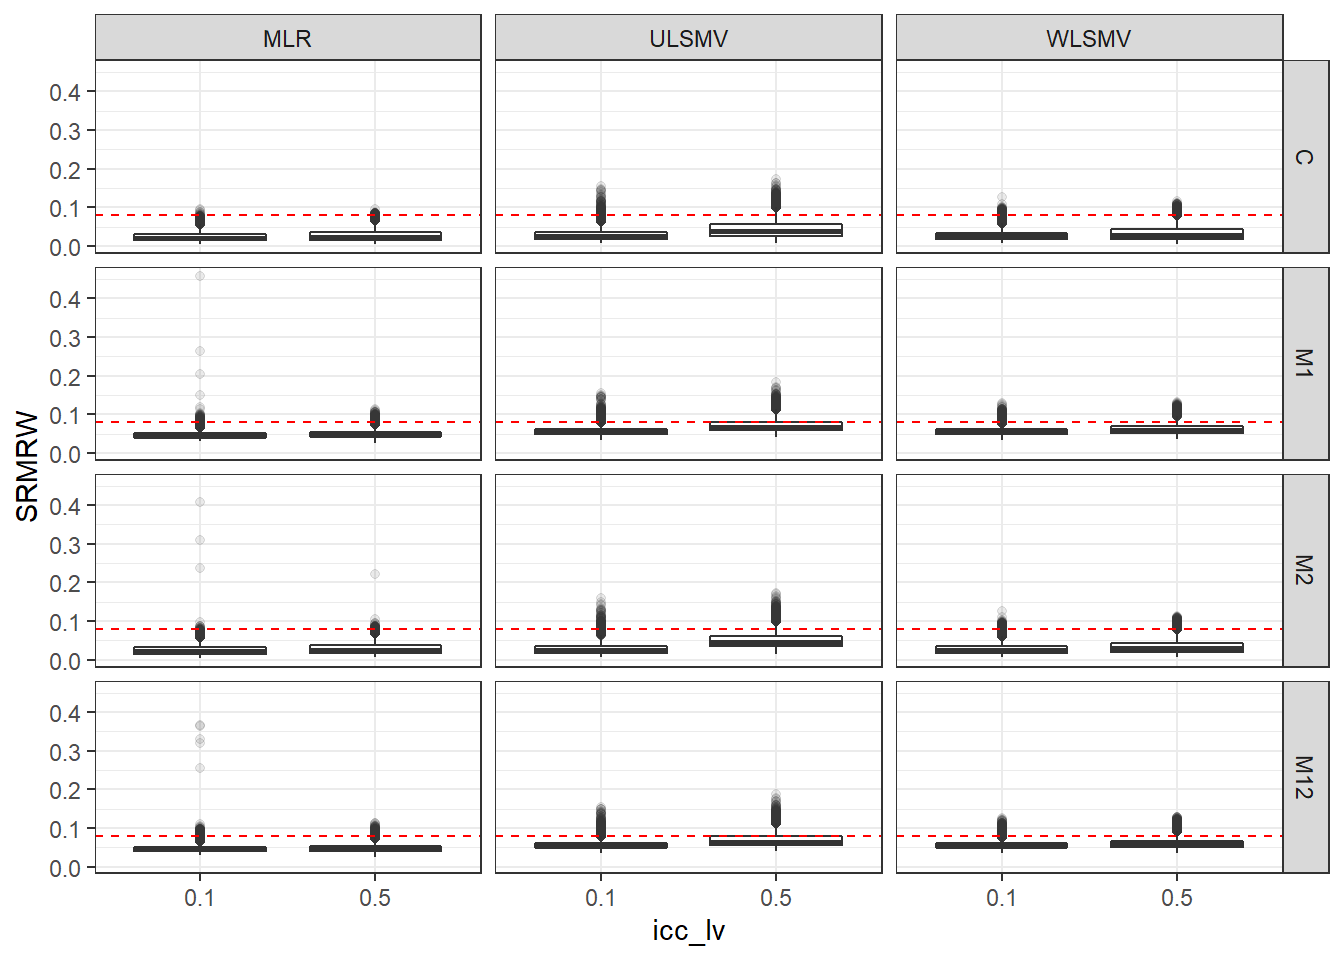
| Version | Author | Date |
|---|---|---|
| a1b0dc1 | noah-padgett | 2019-05-08 |
if(save.fig == T) ggsave("srmrw_marginal_icc_lv_facet_estimator_model.pdf",plot = p, width=9, height=6, units='in')SRMRB
p <- ggplot(mydata, aes(x=ss_l1, y=SRMRB))+
    geom_boxplot(outlier.alpha = .1)+
    geom_abline(intercept = .08, slope=0,
                linetype='dashed', color = 'red') +
    facet_grid(Model~Estimator)+
    lims(y=c(0,1))
p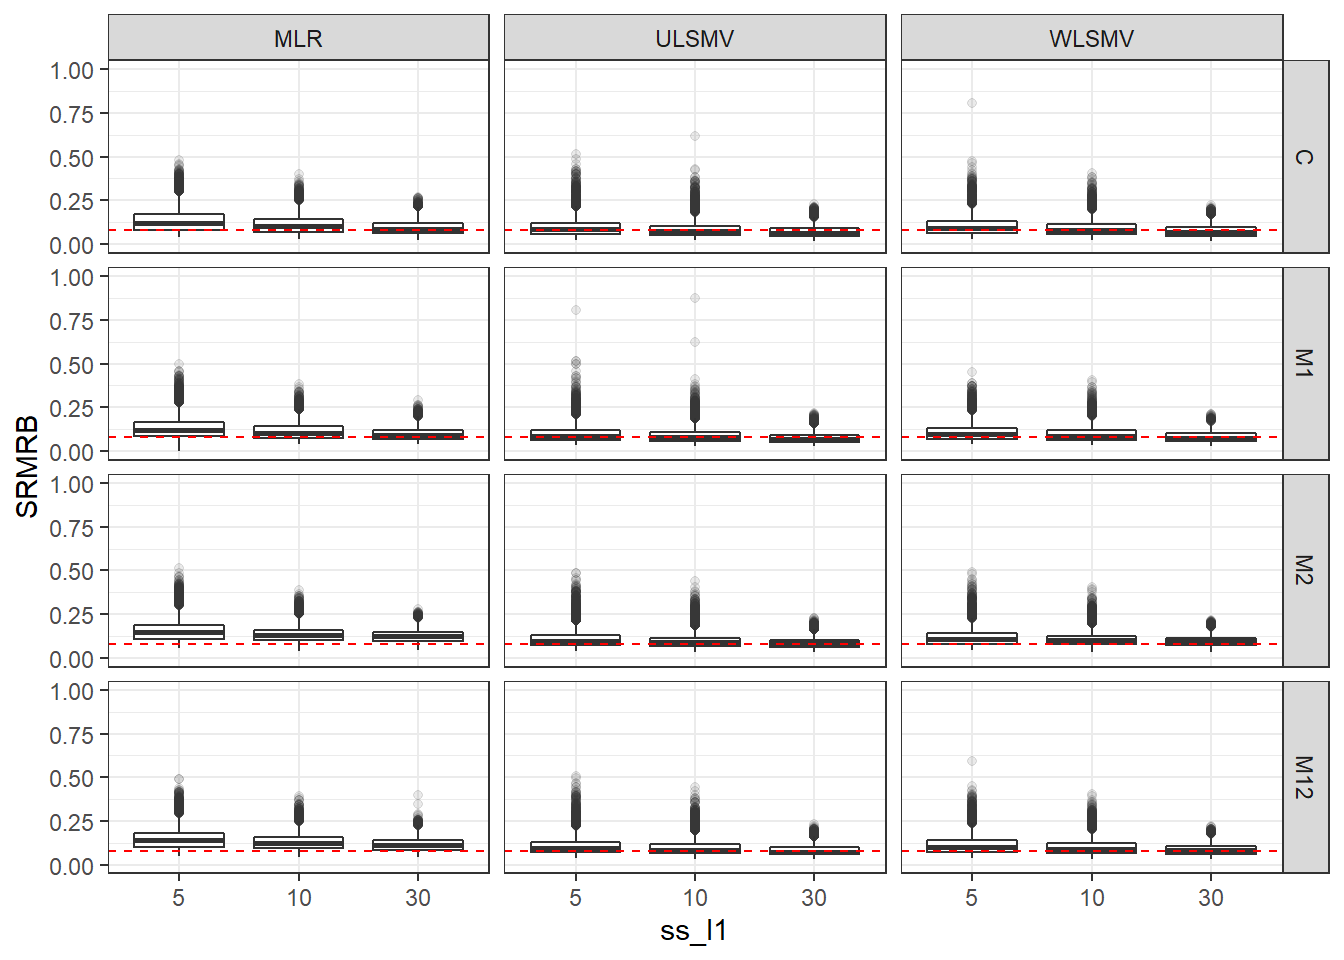
| Version | Author | Date |
|---|---|---|
| a1b0dc1 | noah-padgett | 2019-05-08 |
if(save.fig == T) ggsave("srmrb_marginal_ss_l1_facet_estimator_model.pdf",plot = p, width=9, height=6, units='in')


p <- ggplot(mydata, aes(x=ss_l2,  y=SRMRB))+
    geom_boxplot(outlier.alpha = .1)+
    geom_abline(intercept = .08, slope=0,
                linetype='dashed', color = 'red') +
    facet_grid(Model~Estimator)+
    lims(y=c(0,1))
p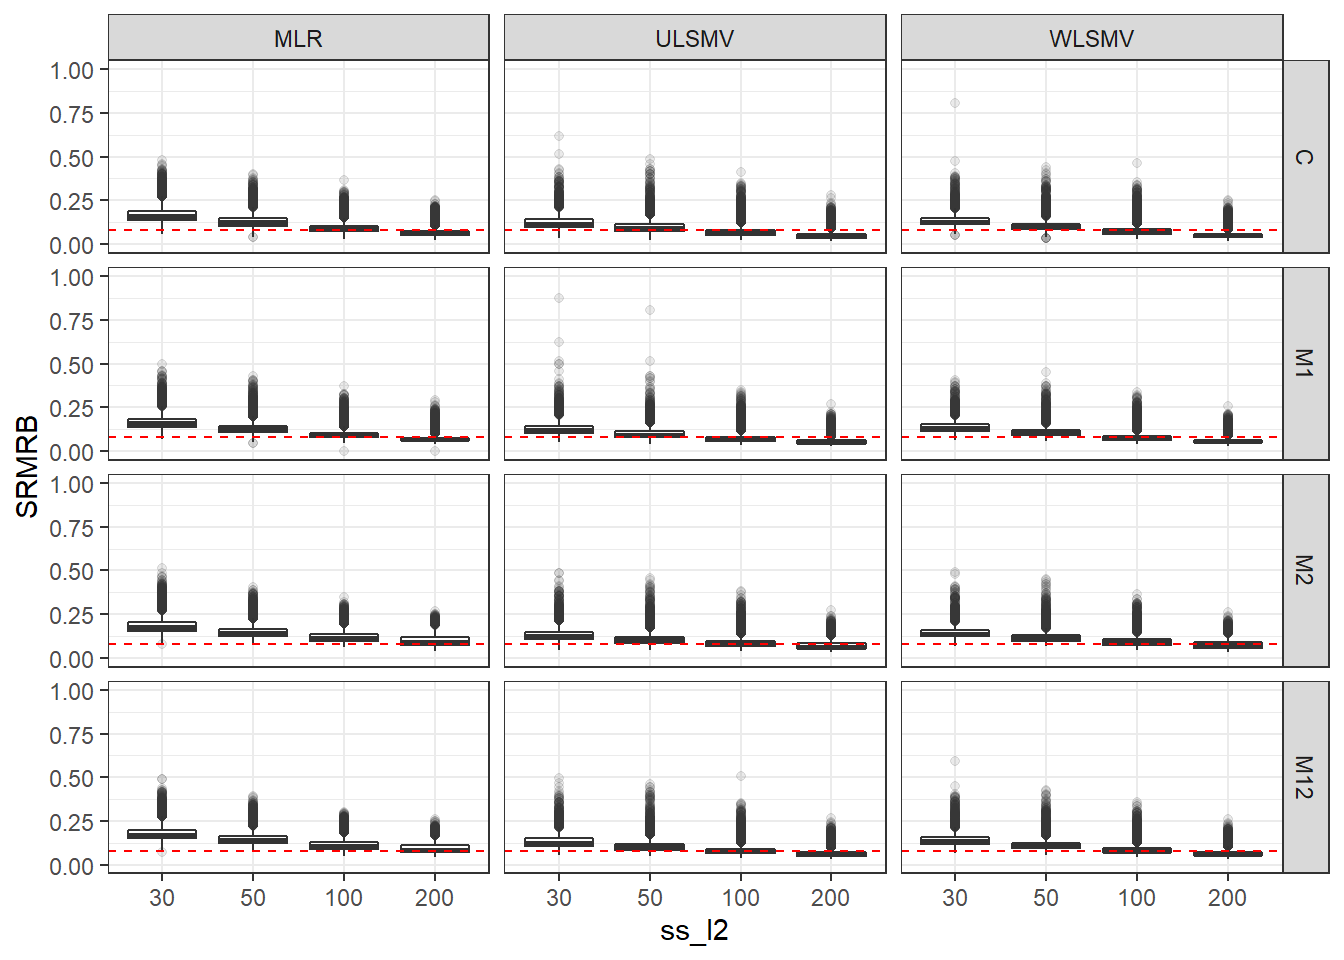
| Version | Author | Date |
|---|---|---|
| a1b0dc1 | noah-padgett | 2019-05-08 |
if(save.fig == T) ggsave("srmrb_marginal_ss_l2_facet_estimator_model.pdf",plot = p, width=9, height=6, units='in')

p <- ggplot(mydata, aes(x=icc_ov,  y=SRMRB))+
    geom_boxplot(outlier.alpha = .1)+
    geom_abline(intercept = .08, slope=0,
                linetype='dashed', color = 'red') +
    facet_grid(Model~Estimator)+
    labs(title = 'SRMRB by Obs. Var. ICC')+
    lims(y=c(0,1))
p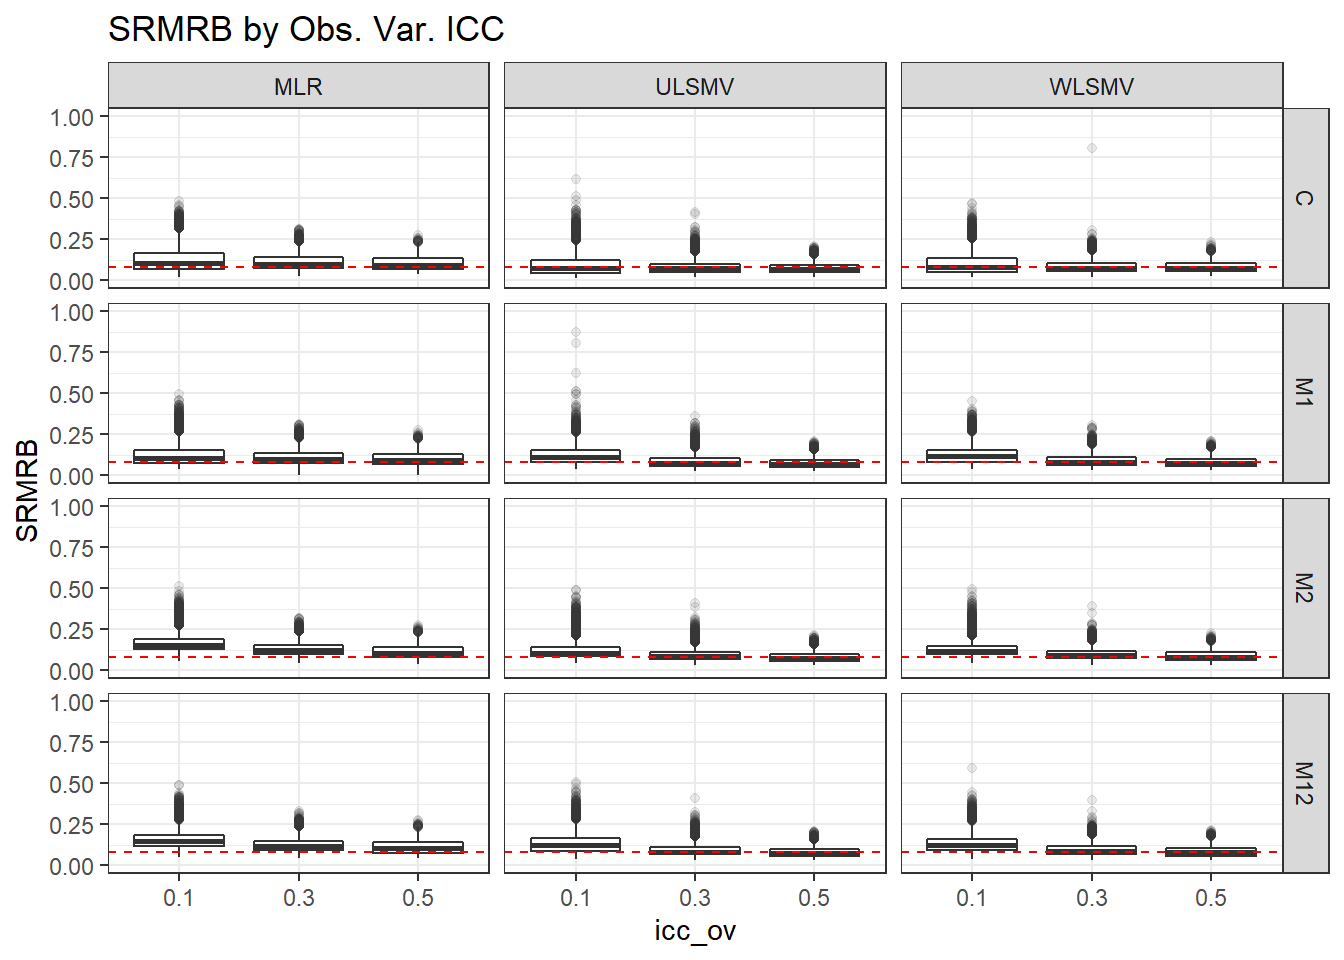
| Version | Author | Date |
|---|---|---|
| a1b0dc1 | noah-padgett | 2019-05-08 |
if(save.fig == T) ggsave("srmrb_marginal_icc_ov_facet_estimator_model.pdf",plot = p, width=9, height=6, units='in')

p <- ggplot(mydata, aes(x=icc_lv, y=SRMRB))+
    geom_boxplot(outlier.alpha = .1)+
    geom_abline(intercept = .08, slope=0,
                linetype='dashed', color = 'red') +
    facet_grid(Model~Estimator)+
    lims(y=c(0,1))
p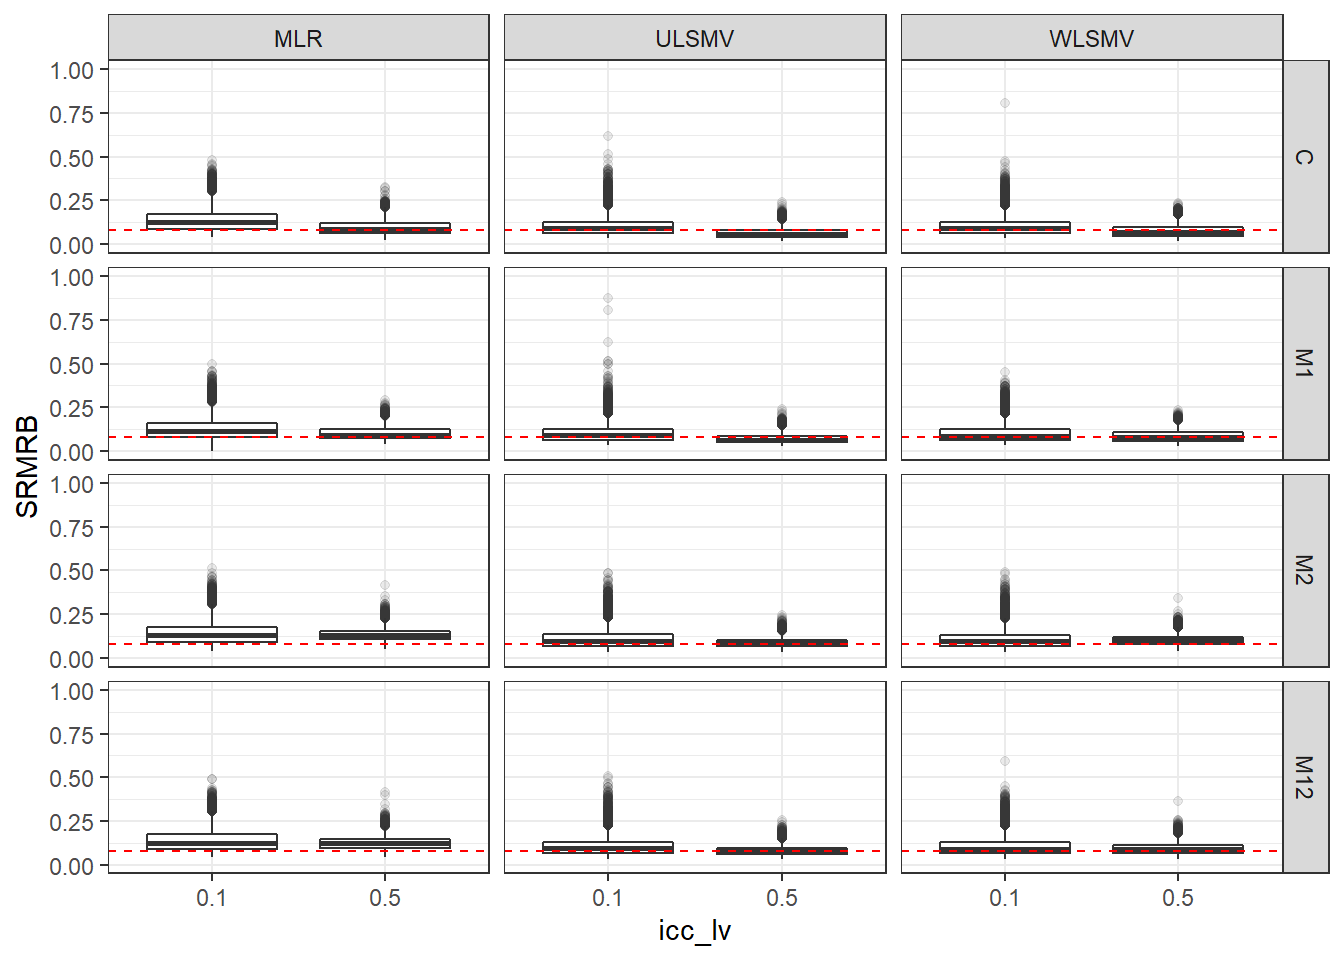
| Version | Author | Date |
|---|---|---|
| a1b0dc1 | noah-padgett | 2019-05-08 |
if(save.fig == T) ggsave("srmrb_marginal_icc_lv_facet_estimator_model.pdf",plot = p,width=9, height=6, units='in')Fit distribution by Model and Estimation method only
p <- ggplot(mydata, aes(x=Model, y=CFI))+
    geom_boxplot(outlier.alpha = .1)+
    facet_grid(.~Estimator) +
    geom_abline(intercept = .95, slope=0,
                linetype='dashed', color = 'red')
p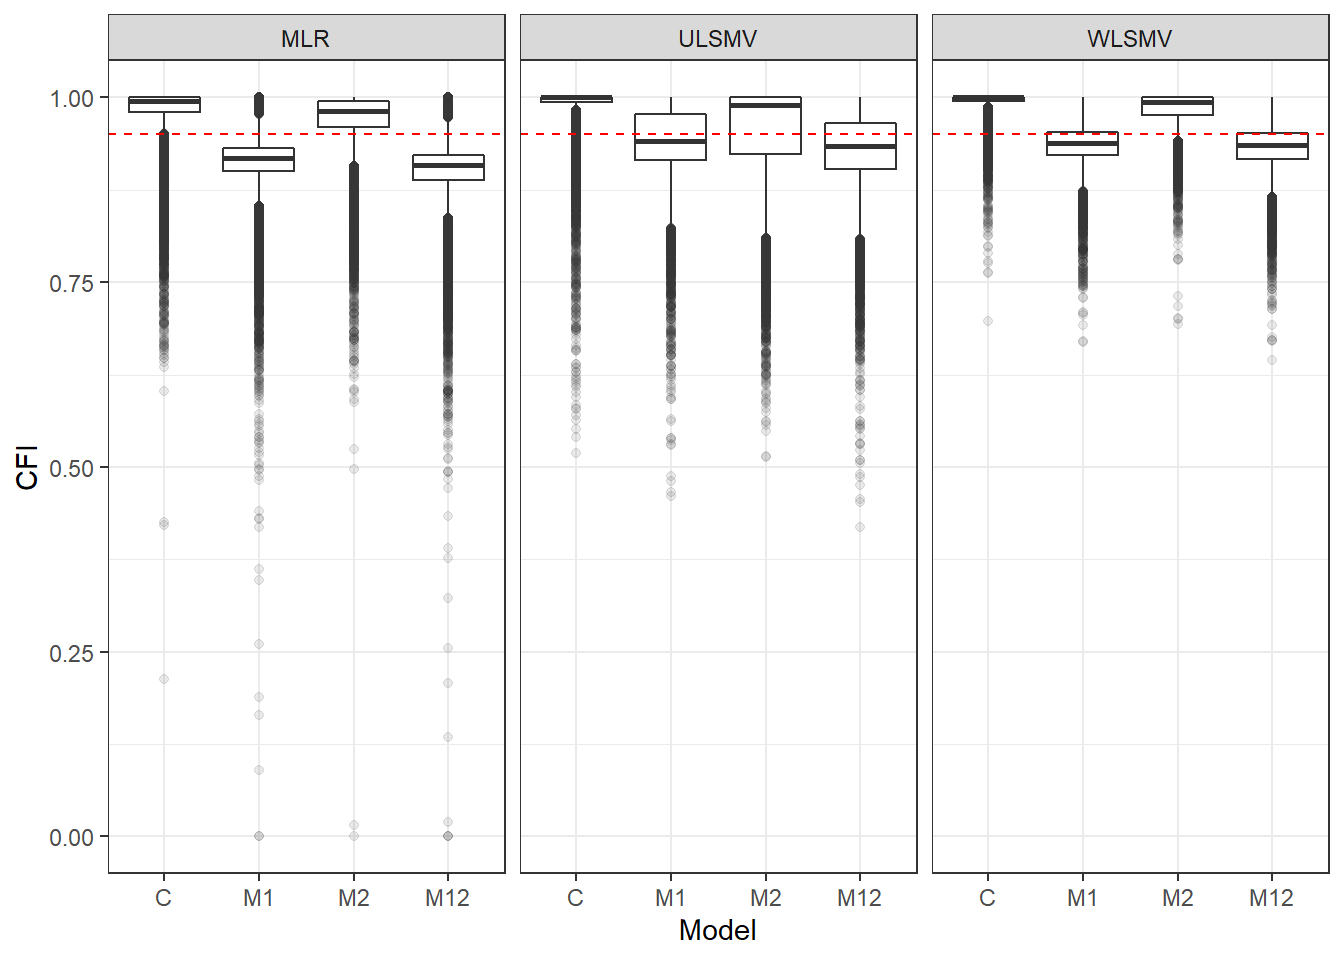
| Version | Author | Date |
|---|---|---|
| a1b0dc1 | noah-padgett | 2019-05-08 |
if(save.fig == T) ggsave("cfi_marginal_model_estimator.pdf",plot = p, width=6, height=4, units='in')


p <- ggplot(mydata, aes(x=Model, y=TLI))+
    geom_boxplot(outlier.alpha = .1)+
    facet_grid(.~Estimator) +
    geom_abline(intercept = .95, slope=0,
                linetype='dashed', color = 'red')
p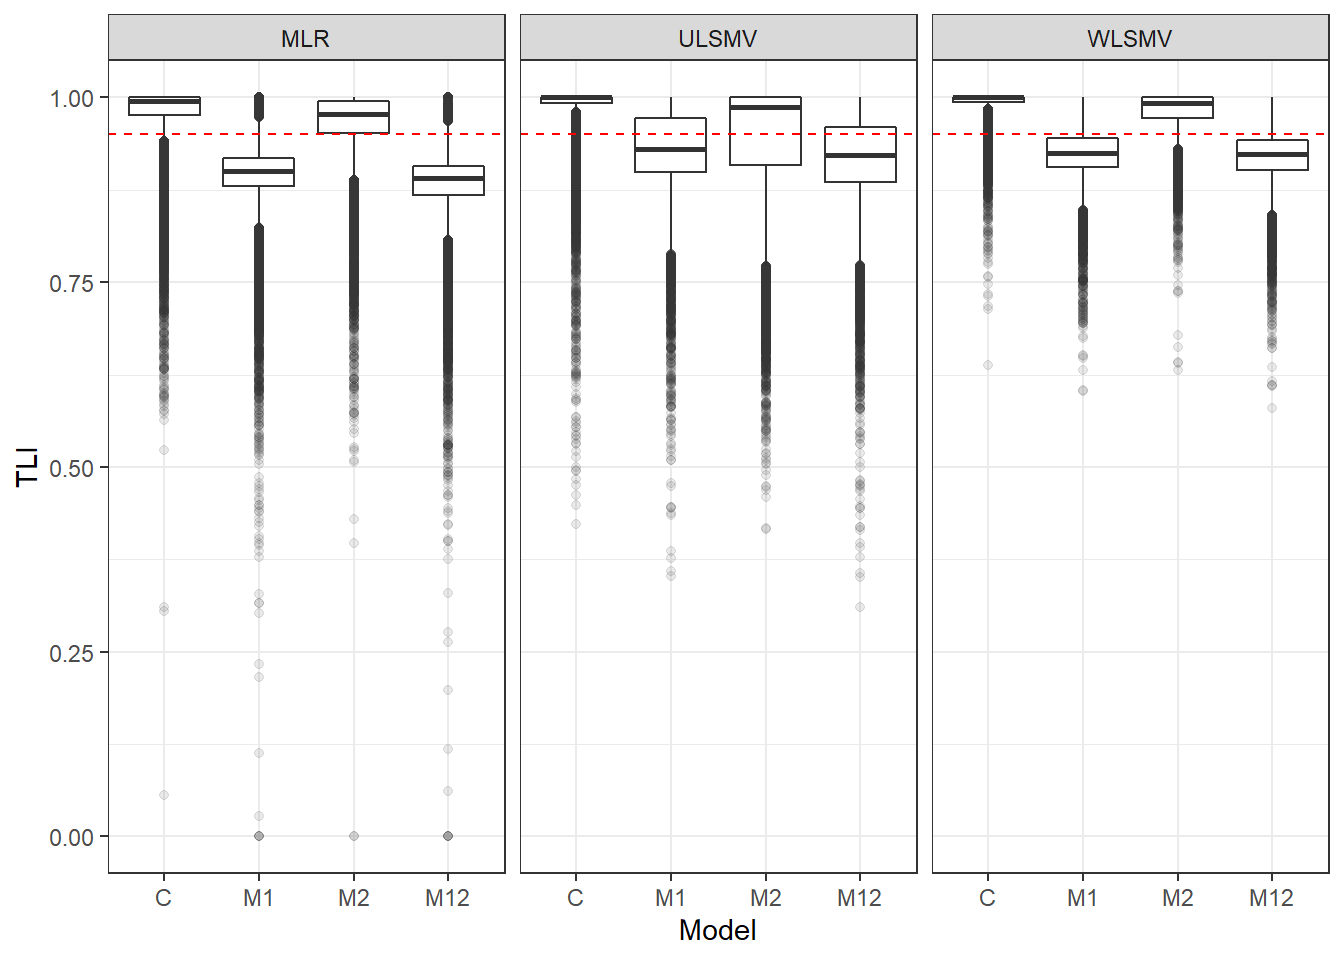
| Version | Author | Date |
|---|---|---|
| a1b0dc1 | noah-padgett | 2019-05-08 |
if(save.fig == T) ggsave("tli_marginal_model_estimator.pdf",plot = p, width=6, height=4, units='in')


p <- ggplot(mydata, aes(x=Model, y=RMSEA))+
    geom_boxplot(outlier.alpha = .1)+
    facet_grid(.~Estimator) +
    geom_abline(intercept = .06, slope=0,
                linetype='dashed', color = 'red')
p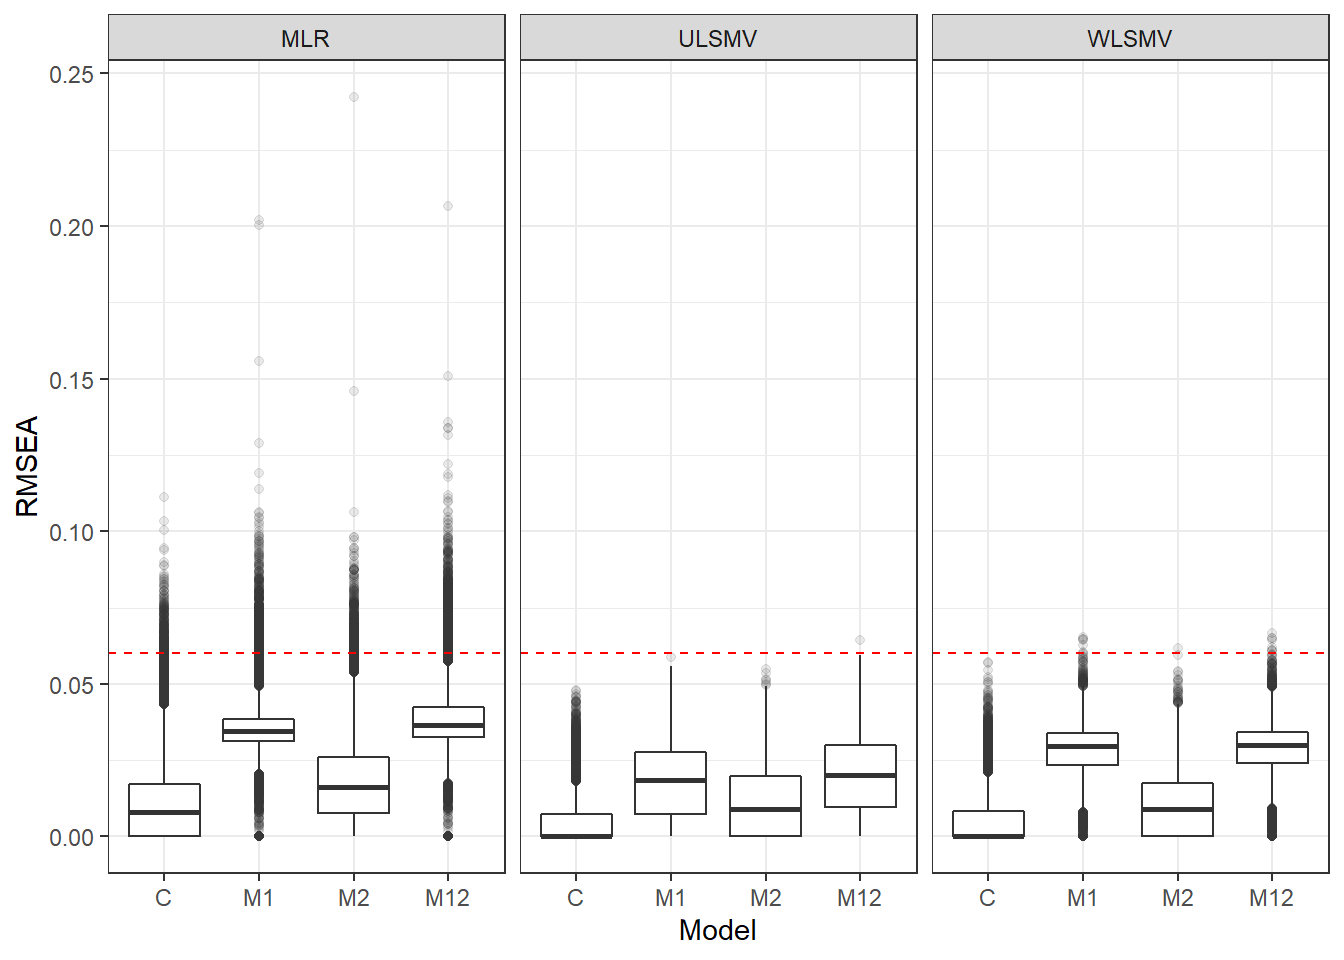
| Version | Author | Date |
|---|---|---|
| a1b0dc1 | noah-padgett | 2019-05-08 |
if(save.fig == T) ggsave("rmsea_marginal_model_estimator.pdf",plot = p, width=6, height=4, units='in')


p <- ggplot(mydata, aes(x=Model, y=SRMRW))+
    geom_boxplot(outlier.alpha = .1)+
    facet_grid(.~Estimator) +
    geom_abline(intercept = .08, slope=0,
                linetype='dashed', color = 'red')
p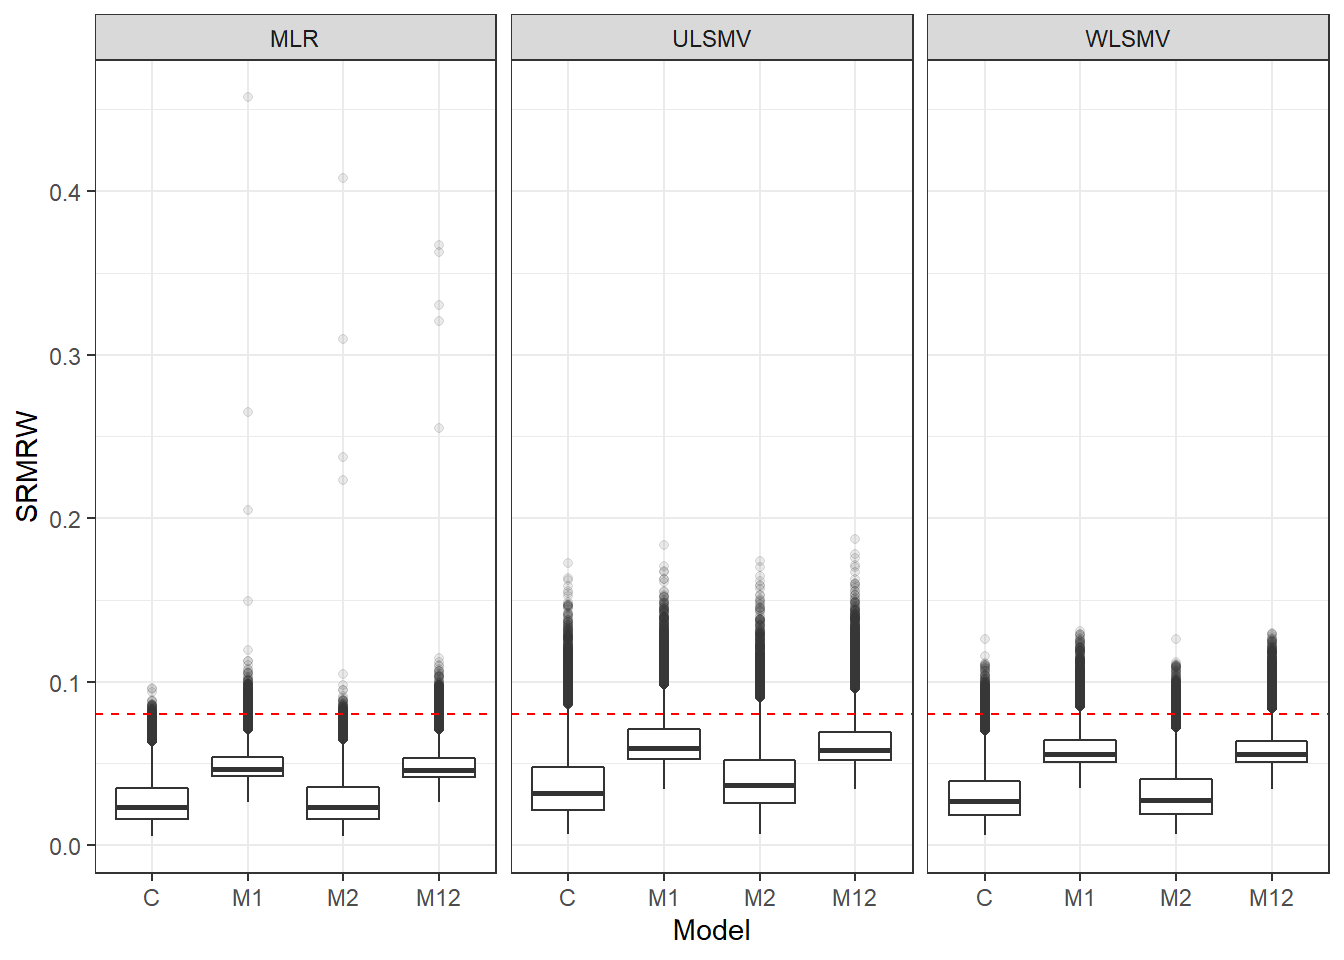
| Version | Author | Date |
|---|---|---|
| a1b0dc1 | noah-padgett | 2019-05-08 |
if(save.fig == T) ggsave("srmrw_marginal_model_estimator.pdf",plot = p, width=6, height=4, units='in')


p <- ggplot(mydata, aes(x=Model, y=SRMRB))+
    geom_boxplot(outlier.alpha = .1)+
    geom_abline(intercept = .08, slope=0,
                linetype='dashed', color = 'red')+
    facet_grid(.~Estimator) +
    lims(y=c(0,1))
p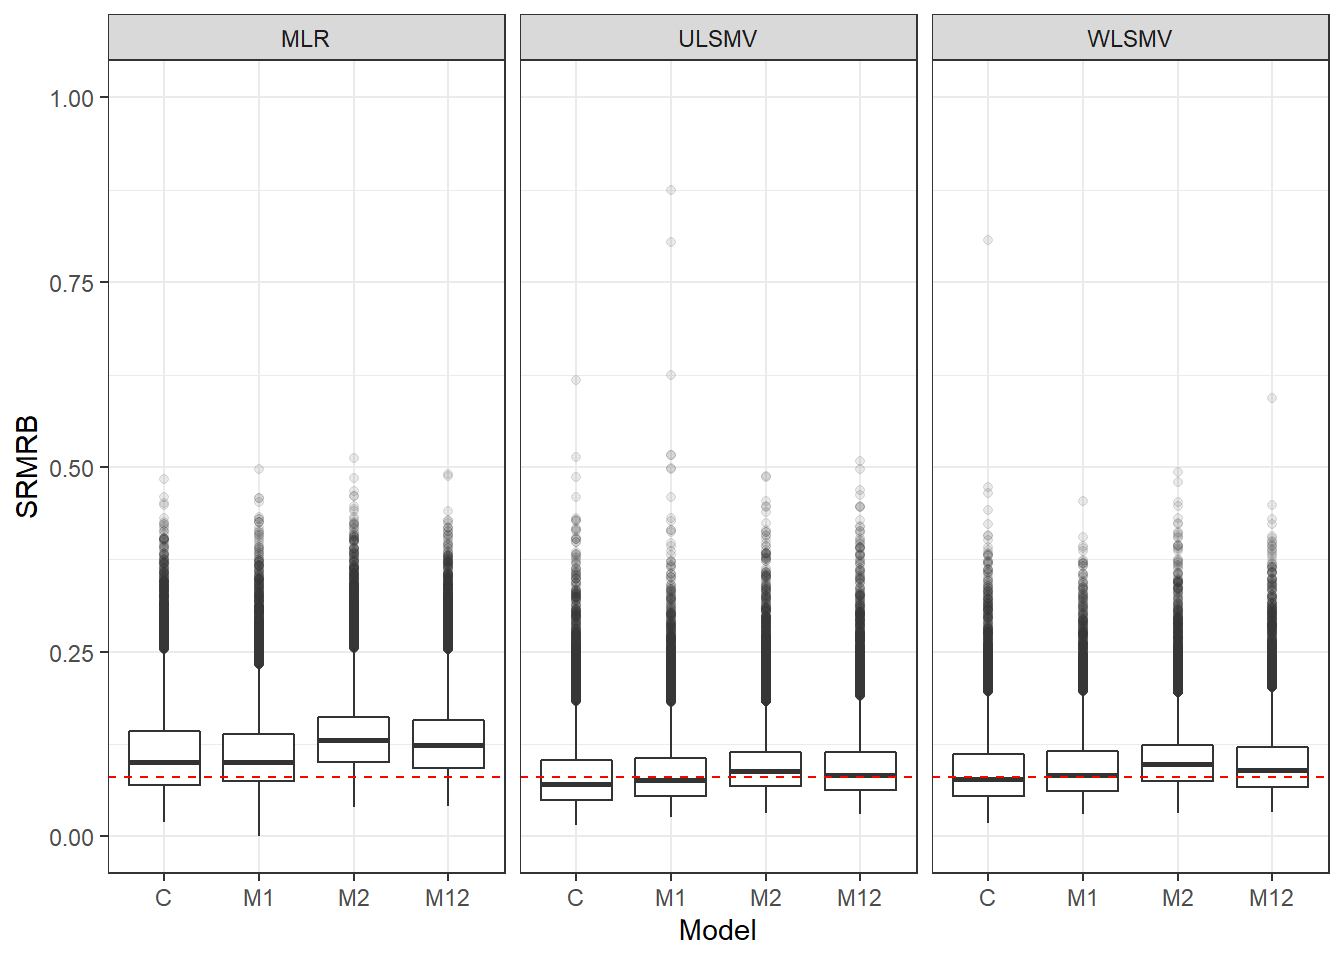
| Version | Author | Date |
|---|---|---|
| a1b0dc1 | noah-padgett | 2019-05-08 |
if(save.fig == T) ggsave("srmrb_marginal_model_estimator.pdf",plot = p, width=6, height=4, units='in')Interaction between Estimation method and number of groups
p <- ggplot(mydata, aes(x=ss_l2, y=RMSEA))+
    geom_boxplot()+
    facet_grid(.~Estimator)
p
Warning: Removed 111 rows containing non-finite values (stat_boxplot).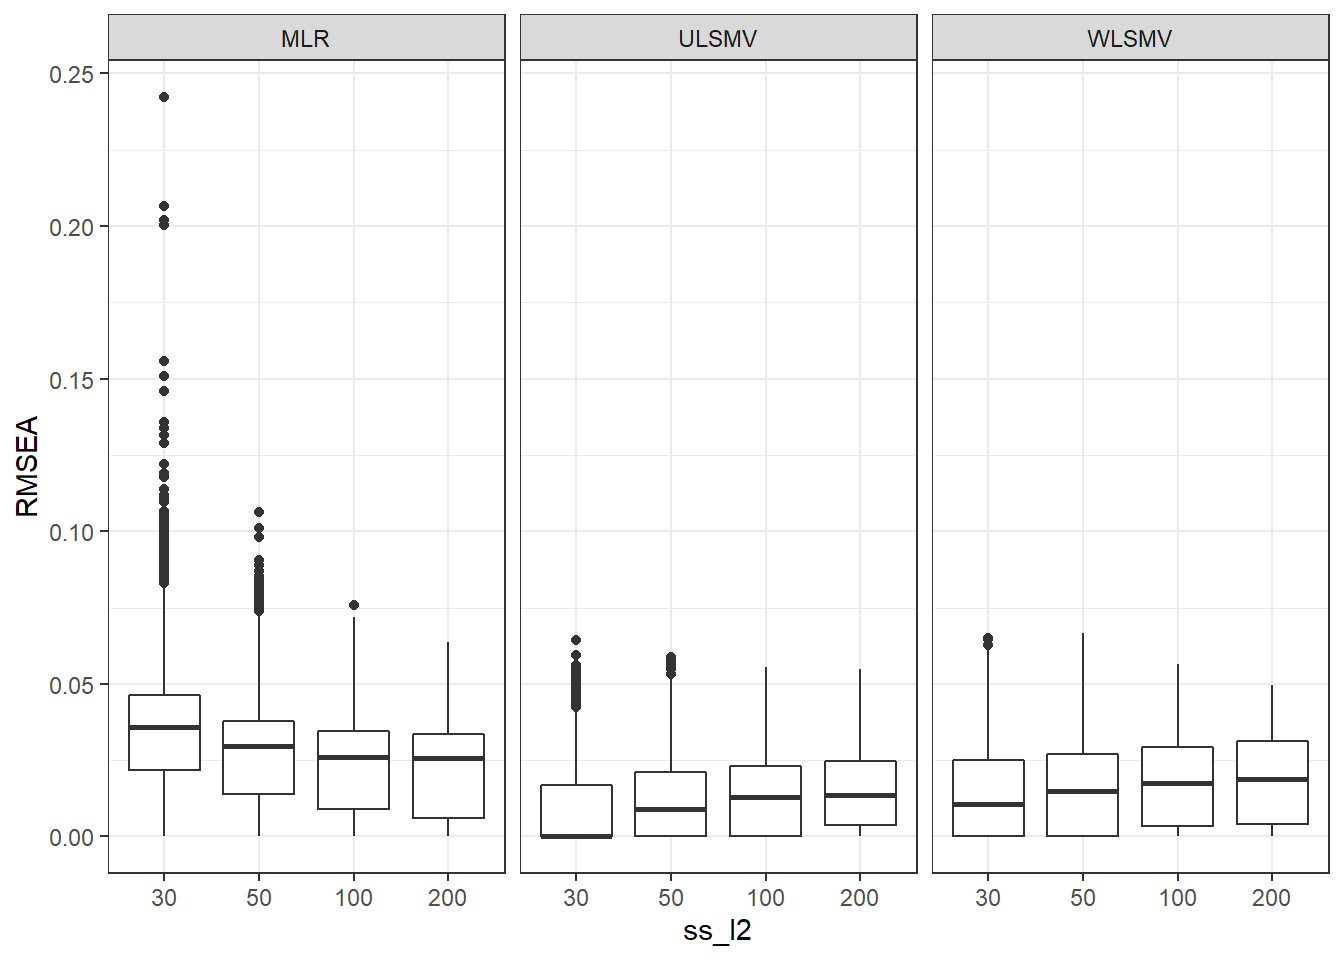
| Version | Author | Date |
|---|---|---|
| a1b0dc1 | noah-padgett | 2019-05-08 |
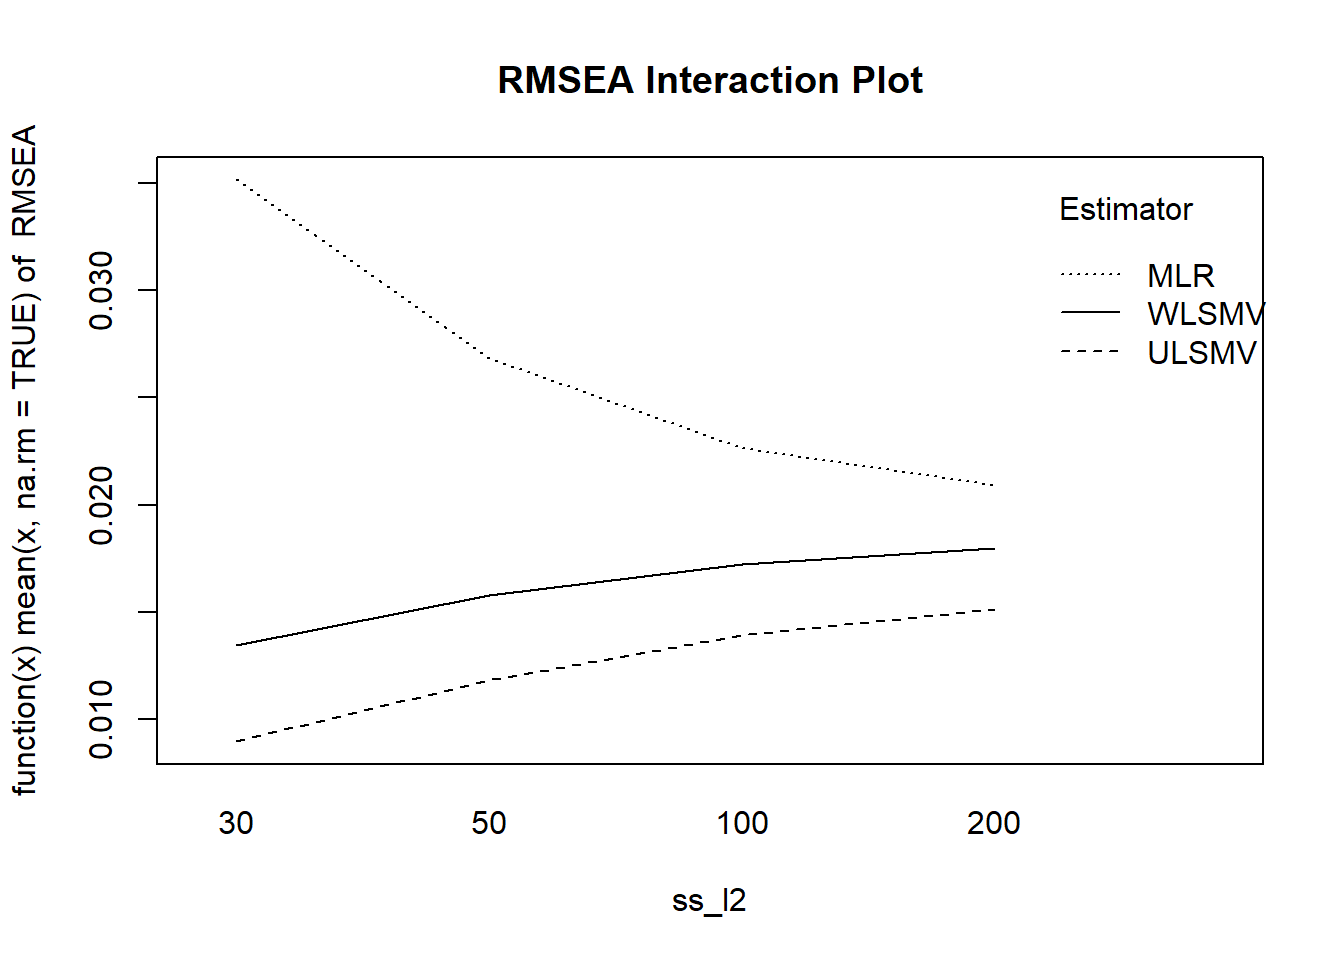
with(mydata, {
  interaction.plot(ss_l2, Estimator, RMSEA,
                   fun = function(x) mean(x, na.rm = TRUE),
                   main = "RMSEA Interaction Plot")
})
| Version | Author | Date |
|---|---|---|
| a1b0dc1 | noah-padgett | 2019-05-08 |
Interaction between Estimator and Latent ICC for SRMRW
p <- ggplot(mydata, aes(x=Estimator, y=SRMRW))+
    geom_boxplot()+
    facet_grid(.~icc_lv)
p
Warning: Removed 111 rows containing non-finite values (stat_boxplot).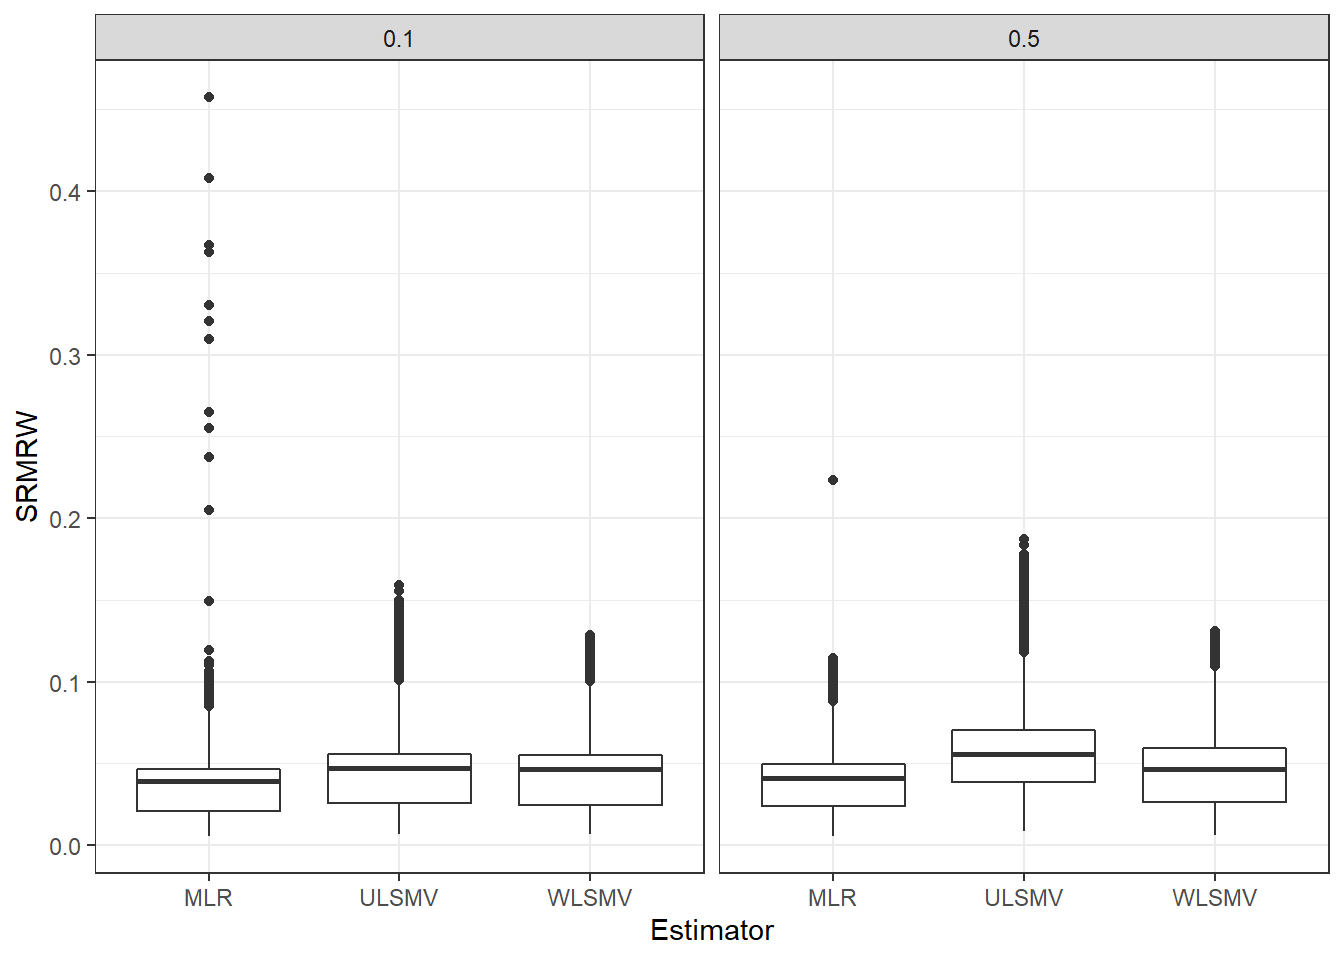
| Version | Author | Date |
|---|---|---|
| a1b0dc1 | noah-padgett | 2019-05-08 |
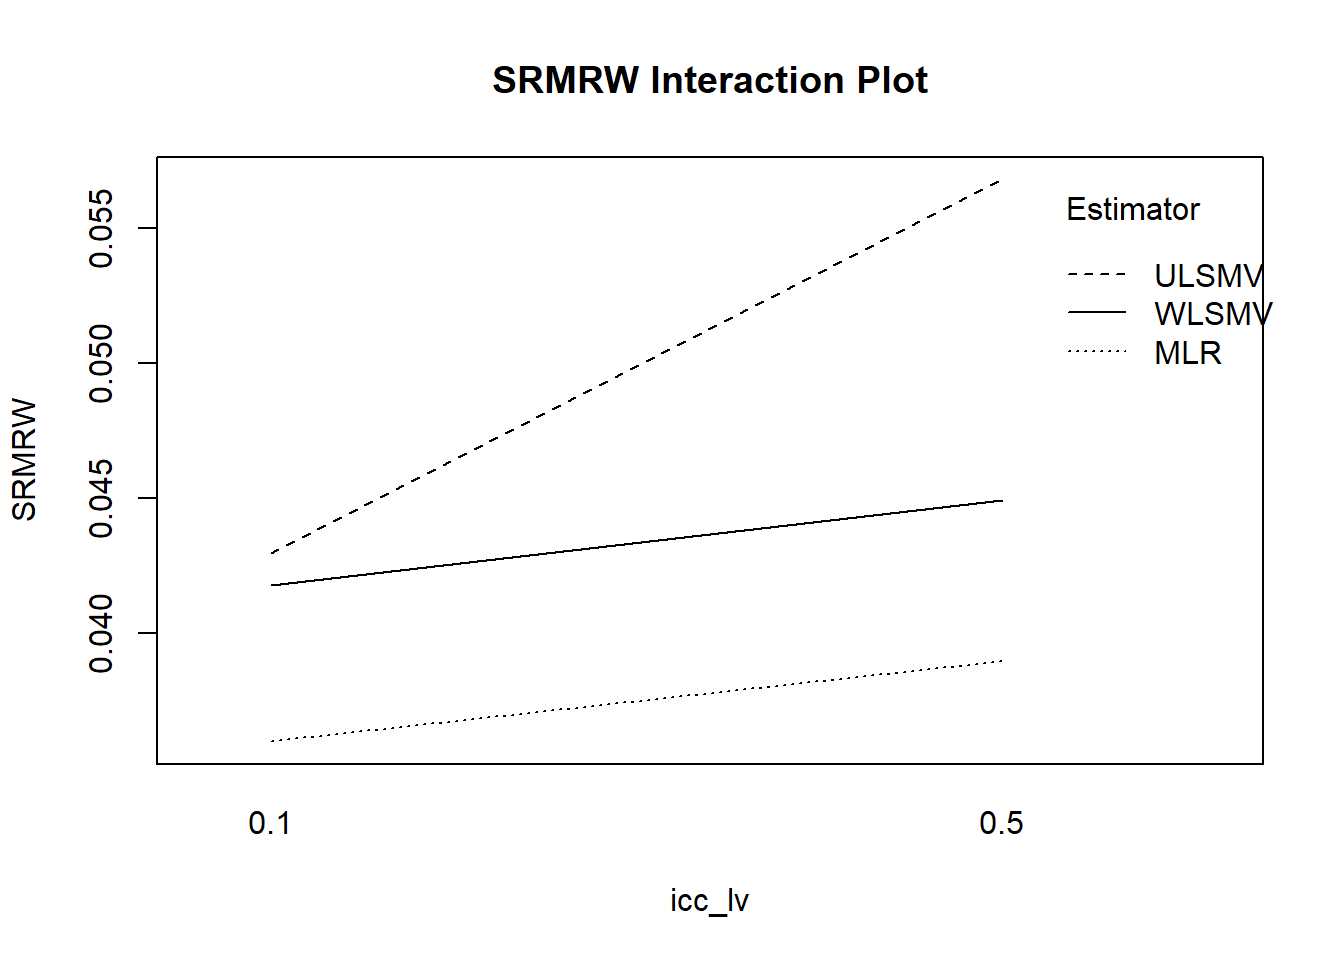
with(mydata, {
  interaction.plot(icc_lv, Estimator, SRMRW,
                   fun = function(x) mean(x, na.rm = TRUE),
                   main = "SRMRW Interaction Plot", ylab="SRMRW")
})
| Version | Author | Date |
|---|---|---|
| a1b0dc1 | noah-padgett | 2019-05-08 |
Publication Figures
p <- ggplot(mydata, aes(x=Model, y=CFI))+
    geom_boxplot(outlier.alpha = .1)+
    facet_grid(.~Estimator) +
    geom_abline(intercept = .95, slope=0,
                linetype='dashed', color = 'red') +
    lims(y=c(0.5,1))
p
Warning: Removed 159 rows containing non-finite values (stat_boxplot).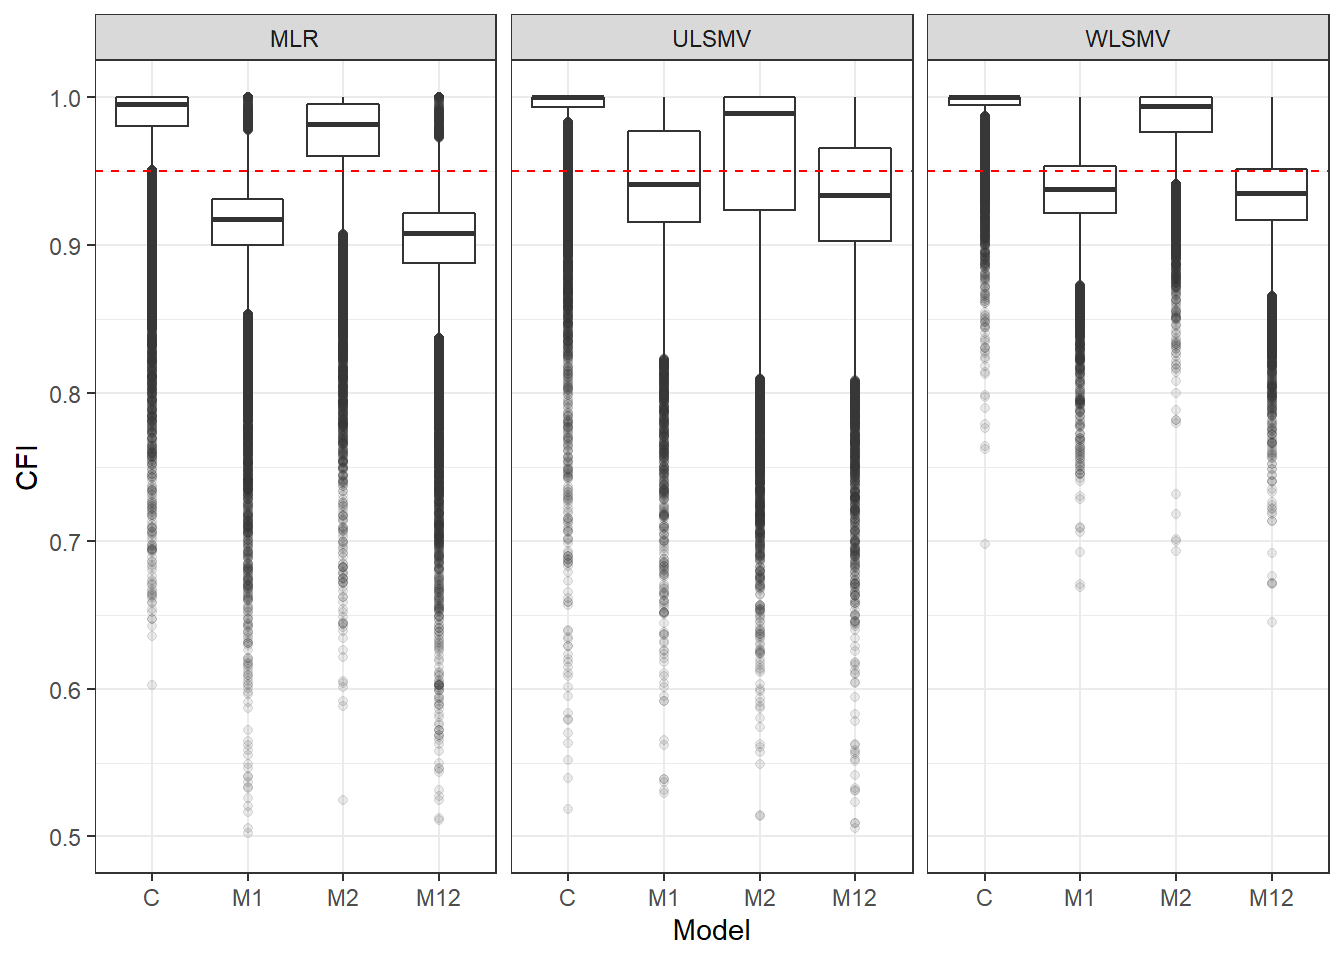
| Version | Author | Date |
|---|---|---|
| 982c8f1 | noah-padgett | 2019-05-18 |
if(save.fig == T) ggsave("pub_fig_cfi.pdf",plot = p, width=6, height=3.5, units='in')

p <- ggplot(mydata, aes(x=Model, y=TLI))+
    geom_boxplot(outlier.alpha = .1)+
    facet_grid(.~Estimator) +
    geom_abline(intercept = .95, slope=0,
                linetype='dashed', color = 'red')+
    lims(y=c(0.5,1))
p
Warning: Removed 234 rows containing non-finite values (stat_boxplot).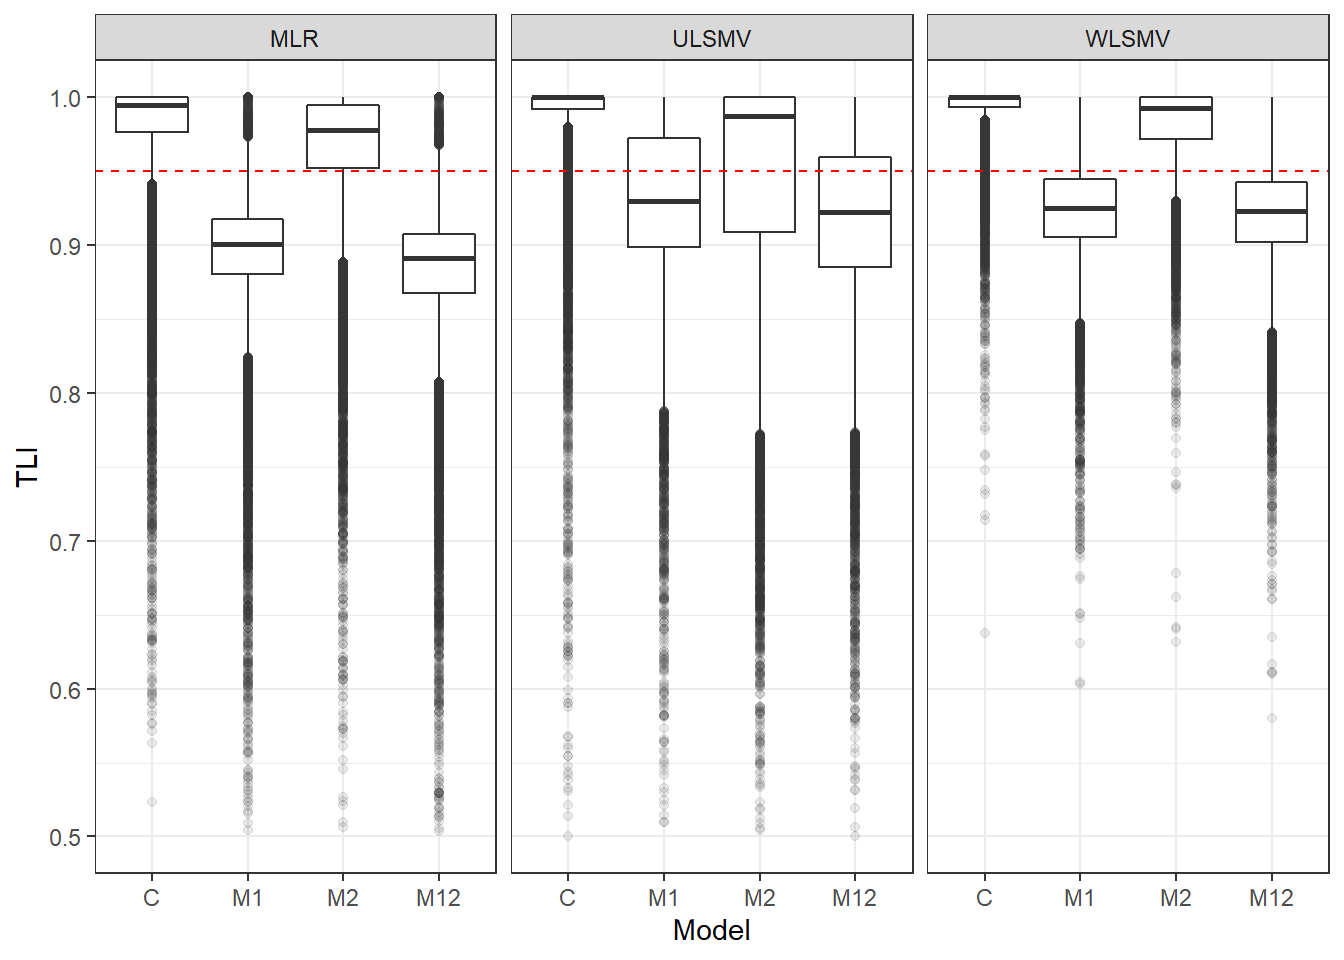
| Version | Author | Date |
|---|---|---|
| 982c8f1 | noah-padgett | 2019-05-18 |
if(save.fig == T) ggsave("pub_fig_tli.pdf",plot = p, width=6, height=3.5, units='in')


p <- ggplot(mydata, aes(x=Model, y=RMSEA))+
    geom_boxplot(outlier.alpha = .1)+
    facet_grid(.~Estimator) +
    geom_abline(intercept = .06, slope=0,
                linetype='dashed', color = 'red')+
    lims(y=c(0,0.5))
p
Warning: Removed 111 rows containing non-finite values (stat_boxplot).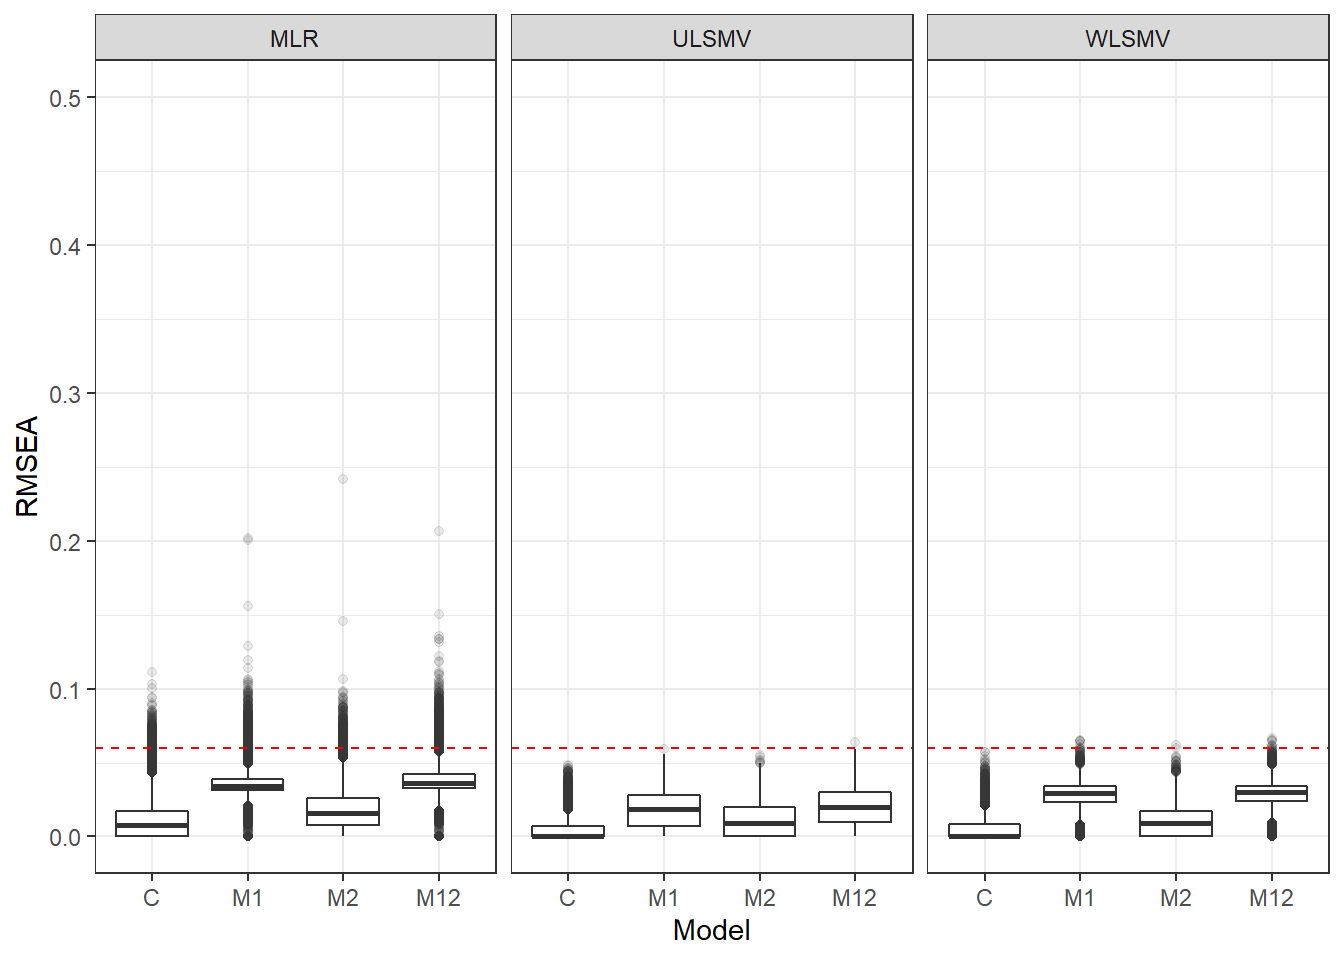
| Version | Author | Date |
|---|---|---|
| 982c8f1 | noah-padgett | 2019-05-18 |
if(save.fig == T) ggsave("pub_fig_rmsea.pdf",plot = p, width=6, height=3.5, units='in')


p <- ggplot(mydata, aes(x=Model, y=SRMRW))+
    geom_boxplot(outlier.alpha = .1)+
    facet_grid(.~Estimator) +
    geom_abline(intercept = .08, slope=0,
                linetype='dashed', color = 'red')+
    lims(y=c(0,0.5))
p
Warning: Removed 111 rows containing non-finite values (stat_boxplot).
if(save.fig == T) ggsave("pub_fig_srmrw.pdf", plot = p, width=6, height=3.5, units='in')SRMRB Figures
p <- ggplot(mydata, aes(x=Model, y=SRMRB))+
    geom_boxplot(outlier.alpha = .1)+
    geom_abline(intercept = .08, slope=0,
                linetype='dashed', color = 'red')+
    facet_grid(.~Estimator) +
    lims(y=c(0,0.5))
p
Warning: Removed 141 rows containing non-finite values (stat_boxplot).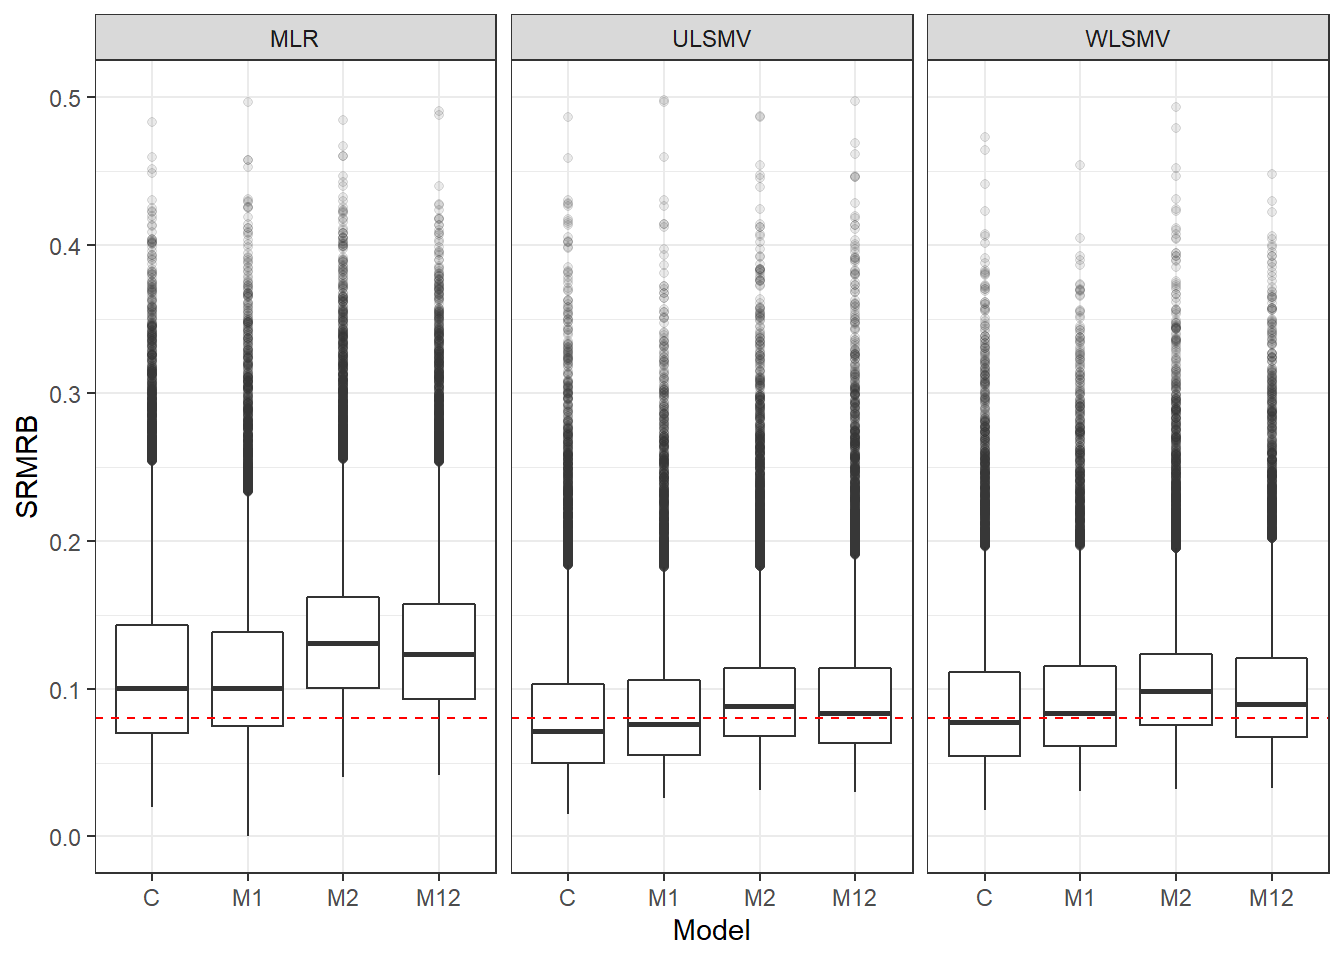
| Version | Author | Date |
|---|---|---|
| 982c8f1 | noah-padgett | 2019-05-18 |
if(save.fig == T) ggsave("pub_fig_srmrb_a.pdf",plot = p, width=6, height=3.5, units='in')


p <- ggplot(mydata, aes(x=Model,  y=SRMRB))+
    geom_boxplot(outlier.alpha = .1)+
    geom_abline(intercept = .08, slope=0,
                linetype='dashed', color = 'red') +
    facet_grid(.~ss_l2)+
    lims(y=c(0,0.5))
p
Warning: Removed 141 rows containing non-finite values (stat_boxplot).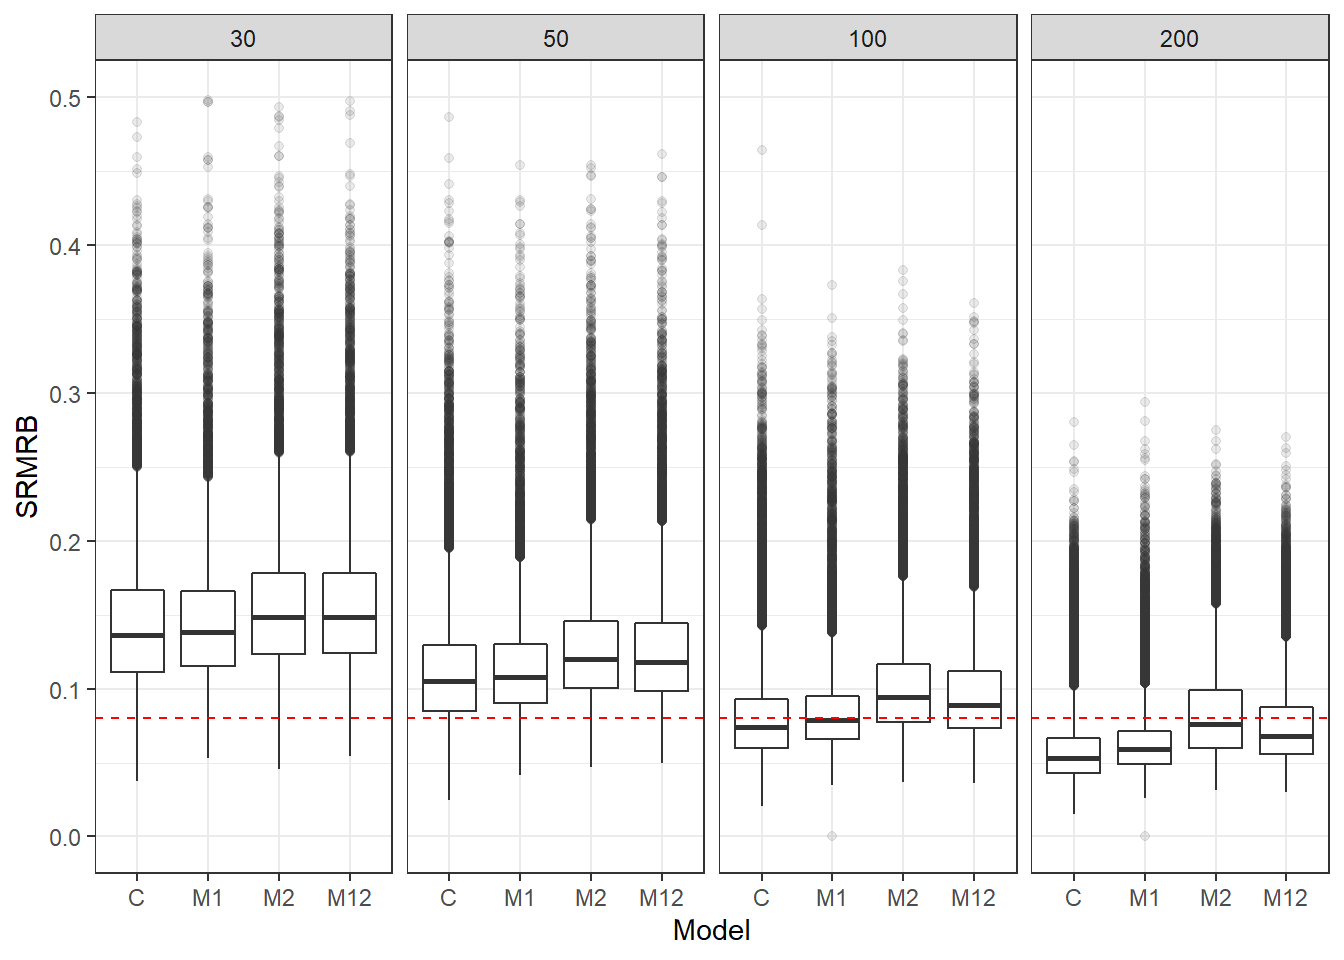
| Version | Author | Date |
|---|---|---|
| 982c8f1 | noah-padgett | 2019-05-18 |
if(save.fig == T) ggsave("pub_fig_srmrb_b.pdf",plot = p, width=6, height=3.5, units='in')
sessionInfo()R version 3.6.0 (2019-04-26)
Platform: x86_64-w64-mingw32/x64 (64-bit)
Running under: Windows 10 x64 (build 18362)
Matrix products: default
locale:
[1] LC_COLLATE=English_United States.1252
[2] LC_CTYPE=English_United States.1252
[3] LC_MONETARY=English_United States.1252
[4] LC_NUMERIC=C
[5] LC_TIME=English_United States.1252
attached base packages:
[1] stats graphics grDevices utils datasets methods base
other attached packages:
[1] xtable_1.8-4 kableExtra_1.1.0 forcats_0.4.0 stringr_1.4.0
[5] dplyr_0.8.1 purrr_0.3.2 readr_1.3.1 tidyr_0.8.3
[9] tibble_2.1.1 ggplot2_3.2.0 tidyverse_1.2.1
loaded via a namespace (and not attached):
[1] tidyselect_0.2.5 xfun_0.7 reshape2_1.4.3
[4] haven_2.1.0 lattice_0.20-38 colorspace_1.4-1
[7] generics_0.0.2 htmltools_0.3.6 viridisLite_0.3.0
[10] yaml_2.2.0 rlang_0.3.4 pillar_1.4.1
[13] glue_1.3.1 withr_2.1.2 modelr_0.1.4
[16] readxl_1.3.1 plyr_1.8.4 munsell_0.5.0
[19] gtable_0.3.0 workflowr_1.4.0 cellranger_1.1.0
[22] rvest_0.3.4 evaluate_0.14 labeling_0.3
[25] knitr_1.23 broom_0.5.2 Rcpp_1.0.1
[28] scales_1.0.0 backports_1.1.4 webshot_0.5.1
[31] jsonlite_1.6 fs_1.3.1 hms_0.4.2
[34] digest_0.6.19 stringi_1.4.3 grid_3.6.0
[37] rprojroot_1.3-2 cli_1.1.0 tools_3.6.0
[40] magrittr_1.5 lazyeval_0.2.2 crayon_1.3.4
[43] whisker_0.3-2 pkgconfig_2.0.2 xml2_1.2.0
[46] lubridate_1.7.4 assertthat_0.2.1 rmarkdown_1.13
[49] httr_1.4.0 rstudioapi_0.10 R6_2.4.0
[52] nlme_3.1-139 git2r_0.26.1 compiler_3.6.0