class: left, middle, inverse, title-slide .title[ # Logistic regression ] .subtitle[ ## Mabel Carabali ] .author[ ### Part 1 & Part 2 ] .institute[ ### EBOH, McGill University ] .date[ ### 2023/02/08 (updated: 2024-10-09) ] --- ## .red[Have you met Euler?] <img src="images/euler2.jpg" width="80%" style="display: block; margin: auto;" /> --- class:middle **Expected competencies** - Knows when logistic regression analysis is needed (Questions and type of data). - Can describe the logistic regression model, (assumptions & implications). - Knows the relationship between ORs and Logistic regression coefficients. - Knows how a statistical package is used to fit a logistic regression model to continuous and categorical predictors. - Interpret logistic regression model output, and assess model's fit. -- ### Objectives - To review core concepts of logistic regression - Provide tools to improve the inference when assessing binary outcomes - Illustrate advantages of Bayesian inference. --- class:middle ### .red[Have you met Euler?] .pull-left[ <img src="images/euler2.jpg" width="80%" style="display: block; margin: auto;" /> ] -- .pull-right[ <img src="images/euler1.png" width="80%" style="display: block; margin: auto;" /> ] -- .red[Eulers' number a.k.a.' _e_ ' is a numerical constant 2.7182818...] - Described under logarithm concepts & it's basically the base of the natural logarithm. - Mostly used to represent the non-linear increase or decrease of a function. - In `R` we use the expression `exp()` - `\(e^1\)` = exp(1) =2.7182818; `\(e^0\)` = exp(0) = 1 & `\(e^\infty\)` = 0 --- class:middle ##Basic math - review of logarithms **.red[Laws of Exponents: ]** `$$e{^\alpha} \cdot \, e{^\beta} = e{^{\alpha + \beta}}$$` `$$(e{^\alpha})^\beta = e{^{\alpha\beta}}$$` where `\(\alpha\)` and `\(\beta\)` can be any real numbers and be any positive real number **.red[Logarithms:]** `$$e{^x} = N$$` The value of x which solves this equation is written as: `$$x = log{_e}N$$` The right-hand side is expressed as “log to the base `\(e\)` of `\(N\)`” --- class:middle ### Basic math .red[Other manipulations] `$$log{_e}M + log{_e}N = log{_e}(MN)$$` `$$log{_e}M - log{_e}N = log{_e}(M/N)$$` `$$log{_e}(M^{N}) = N \cdot log{_e}(M)$$` The purpose of these early logarithmic tables was to take advantage of the law of exponents in order to avoid messy multiplications in the era before electronic calculators. -- - Any positive base is possible for logarithms. For example, the exponential equation `\(4^3 = 64\)` can be written in terms of a logarithm as `\(log_{4}(64) = 3\)` - In practice, the only bases that actually get used to any extent are 10 (“common logarithms”, written as `log10(x)` ) and e = 2.71828 ("natural logarithm", `log(x)`) <span style="color:red"> `\(\leftarrow\)` Euler's </span> `$$e=\sum \limits _{n=0}^{\infty }{\frac {1}{n!}}=1+{\frac {1}{1}}+{\frac {1}{1\cdot 2}}+{\frac {1}{1\cdot 2\cdot 3}}+\cdots$$` --- class: middle ## Predicting categorical outcome data <img src="images/lr_vs_logistic.jpg" width="80%" style="display: block; margin: auto;" /> --- ### Spam filters .pull-left[ - Data from 3921 emails and 21 variables on them contained in `openintro` package - **Outcome:** whether the email is spam or not - **Predictors:** number of characters, whether the email had "Re:" in the subject, time at which email was sent, number of times the word "inherit" shows up in the email, etc. Can use `glimpse(email)` or `srt(email) to see the dataset ] .pull-right[ .small[ <div id="fontnxdduh" style="padding-left:0px;padding-right:0px;padding-top:10px;padding-bottom:10px;overflow-x:auto;overflow-y:auto;width:auto;height:auto;"> <style>#fontnxdduh table { font-family: system-ui, 'Segoe UI', Roboto, Helvetica, Arial, sans-serif, 'Apple Color Emoji', 'Segoe UI Emoji', 'Segoe UI Symbol', 'Noto Color Emoji'; -webkit-font-smoothing: antialiased; -moz-osx-font-smoothing: grayscale; } #fontnxdduh thead, #fontnxdduh tbody, #fontnxdduh tfoot, #fontnxdduh tr, #fontnxdduh td, #fontnxdduh th { border-style: none; } #fontnxdduh p { margin: 0; padding: 0; } #fontnxdduh .gt_table { display: table; border-collapse: collapse; line-height: normal; margin-left: auto; margin-right: auto; color: #333333; font-size: 16px; font-weight: normal; font-style: normal; background-color: #FFFFFF; width: auto; border-top-style: solid; border-top-width: 2px; border-top-color: #A8A8A8; border-right-style: none; border-right-width: 2px; border-right-color: #D3D3D3; border-bottom-style: solid; border-bottom-width: 2px; border-bottom-color: #A8A8A8; border-left-style: none; border-left-width: 2px; border-left-color: #D3D3D3; } #fontnxdduh .gt_caption { padding-top: 4px; padding-bottom: 4px; } #fontnxdduh .gt_title { color: #333333; font-size: 125%; font-weight: initial; padding-top: 4px; padding-bottom: 4px; padding-left: 5px; padding-right: 5px; border-bottom-color: #FFFFFF; border-bottom-width: 0; } #fontnxdduh .gt_subtitle { color: #333333; font-size: 85%; font-weight: initial; padding-top: 3px; padding-bottom: 5px; padding-left: 5px; padding-right: 5px; border-top-color: #FFFFFF; border-top-width: 0; } #fontnxdduh .gt_heading { background-color: #FFFFFF; text-align: center; border-bottom-color: #FFFFFF; border-left-style: none; border-left-width: 1px; border-left-color: #D3D3D3; border-right-style: none; border-right-width: 1px; border-right-color: #D3D3D3; } #fontnxdduh .gt_bottom_border { border-bottom-style: solid; border-bottom-width: 2px; border-bottom-color: #D3D3D3; } #fontnxdduh .gt_col_headings { border-top-style: solid; border-top-width: 2px; border-top-color: #D3D3D3; border-bottom-style: solid; border-bottom-width: 2px; border-bottom-color: #D3D3D3; border-left-style: none; border-left-width: 1px; border-left-color: #D3D3D3; border-right-style: none; border-right-width: 1px; border-right-color: #D3D3D3; } #fontnxdduh .gt_col_heading { color: #333333; background-color: #FFFFFF; font-size: 100%; font-weight: normal; text-transform: inherit; border-left-style: none; border-left-width: 1px; border-left-color: #D3D3D3; border-right-style: none; border-right-width: 1px; border-right-color: #D3D3D3; vertical-align: bottom; padding-top: 5px; padding-bottom: 6px; padding-left: 5px; padding-right: 5px; overflow-x: hidden; } #fontnxdduh .gt_column_spanner_outer { color: #333333; background-color: #FFFFFF; font-size: 100%; font-weight: normal; text-transform: inherit; padding-top: 0; padding-bottom: 0; padding-left: 4px; padding-right: 4px; } #fontnxdduh .gt_column_spanner_outer:first-child { padding-left: 0; } #fontnxdduh .gt_column_spanner_outer:last-child { padding-right: 0; } #fontnxdduh .gt_column_spanner { border-bottom-style: solid; border-bottom-width: 2px; border-bottom-color: #D3D3D3; vertical-align: bottom; padding-top: 5px; padding-bottom: 5px; overflow-x: hidden; display: inline-block; width: 100%; } #fontnxdduh .gt_spanner_row { border-bottom-style: hidden; } #fontnxdduh .gt_group_heading { padding-top: 8px; padding-bottom: 8px; padding-left: 5px; padding-right: 5px; color: #333333; background-color: #FFFFFF; font-size: 100%; font-weight: initial; text-transform: inherit; border-top-style: solid; border-top-width: 2px; border-top-color: #D3D3D3; border-bottom-style: solid; border-bottom-width: 2px; border-bottom-color: #D3D3D3; border-left-style: none; border-left-width: 1px; border-left-color: #D3D3D3; border-right-style: none; border-right-width: 1px; border-right-color: #D3D3D3; vertical-align: middle; text-align: left; } #fontnxdduh .gt_empty_group_heading { padding: 0.5px; color: #333333; background-color: #FFFFFF; font-size: 100%; font-weight: initial; border-top-style: solid; border-top-width: 2px; border-top-color: #D3D3D3; border-bottom-style: solid; border-bottom-width: 2px; border-bottom-color: #D3D3D3; vertical-align: middle; } #fontnxdduh .gt_from_md > :first-child { margin-top: 0; } #fontnxdduh .gt_from_md > :last-child { margin-bottom: 0; } #fontnxdduh .gt_row { padding-top: 8px; padding-bottom: 8px; padding-left: 5px; padding-right: 5px; margin: 10px; border-top-style: solid; border-top-width: 1px; border-top-color: #D3D3D3; border-left-style: none; border-left-width: 1px; border-left-color: #D3D3D3; border-right-style: none; border-right-width: 1px; border-right-color: #D3D3D3; vertical-align: middle; overflow-x: hidden; } #fontnxdduh .gt_stub { color: #333333; background-color: #FFFFFF; font-size: 100%; font-weight: initial; text-transform: inherit; border-right-style: solid; border-right-width: 2px; border-right-color: #D3D3D3; padding-left: 5px; padding-right: 5px; } #fontnxdduh .gt_stub_row_group { color: #333333; background-color: #FFFFFF; font-size: 100%; font-weight: initial; text-transform: inherit; border-right-style: solid; border-right-width: 2px; border-right-color: #D3D3D3; padding-left: 5px; padding-right: 5px; vertical-align: top; } #fontnxdduh .gt_row_group_first td { border-top-width: 2px; } #fontnxdduh .gt_row_group_first th { border-top-width: 2px; } #fontnxdduh .gt_summary_row { color: #333333; background-color: #FFFFFF; text-transform: inherit; padding-top: 8px; padding-bottom: 8px; padding-left: 5px; padding-right: 5px; } #fontnxdduh .gt_first_summary_row { border-top-style: solid; border-top-color: #D3D3D3; } #fontnxdduh .gt_first_summary_row.thick { border-top-width: 2px; } #fontnxdduh .gt_last_summary_row { padding-top: 8px; padding-bottom: 8px; padding-left: 5px; padding-right: 5px; border-bottom-style: solid; border-bottom-width: 2px; border-bottom-color: #D3D3D3; } #fontnxdduh .gt_grand_summary_row { color: #333333; background-color: #FFFFFF; text-transform: inherit; padding-top: 8px; padding-bottom: 8px; padding-left: 5px; padding-right: 5px; } #fontnxdduh .gt_first_grand_summary_row { padding-top: 8px; padding-bottom: 8px; padding-left: 5px; padding-right: 5px; border-top-style: double; border-top-width: 6px; border-top-color: #D3D3D3; } #fontnxdduh .gt_last_grand_summary_row_top { padding-top: 8px; padding-bottom: 8px; padding-left: 5px; padding-right: 5px; border-bottom-style: double; border-bottom-width: 6px; border-bottom-color: #D3D3D3; } #fontnxdduh .gt_striped { background-color: rgba(128, 128, 128, 0.05); } #fontnxdduh .gt_table_body { border-top-style: solid; border-top-width: 2px; border-top-color: #D3D3D3; border-bottom-style: solid; border-bottom-width: 2px; border-bottom-color: #D3D3D3; } #fontnxdduh .gt_footnotes { color: #333333; background-color: #FFFFFF; border-bottom-style: none; border-bottom-width: 2px; border-bottom-color: #D3D3D3; border-left-style: none; border-left-width: 2px; border-left-color: #D3D3D3; border-right-style: none; border-right-width: 2px; border-right-color: #D3D3D3; } #fontnxdduh .gt_footnote { margin: 0px; font-size: 90%; padding-top: 4px; padding-bottom: 4px; padding-left: 5px; padding-right: 5px; } #fontnxdduh .gt_sourcenotes { color: #333333; background-color: #FFFFFF; border-bottom-style: none; border-bottom-width: 2px; border-bottom-color: #D3D3D3; border-left-style: none; border-left-width: 2px; border-left-color: #D3D3D3; border-right-style: none; border-right-width: 2px; border-right-color: #D3D3D3; } #fontnxdduh .gt_sourcenote { font-size: 90%; padding-top: 4px; padding-bottom: 4px; padding-left: 5px; padding-right: 5px; } #fontnxdduh .gt_left { text-align: left; } #fontnxdduh .gt_center { text-align: center; } #fontnxdduh .gt_right { text-align: right; font-variant-numeric: tabular-nums; } #fontnxdduh .gt_font_normal { font-weight: normal; } #fontnxdduh .gt_font_bold { font-weight: bold; } #fontnxdduh .gt_font_italic { font-style: italic; } #fontnxdduh .gt_super { font-size: 65%; } #fontnxdduh .gt_footnote_marks { font-size: 75%; vertical-align: 0.4em; position: initial; } #fontnxdduh .gt_asterisk { font-size: 100%; vertical-align: 0; } #fontnxdduh .gt_indent_1 { text-indent: 5px; } #fontnxdduh .gt_indent_2 { text-indent: 10px; } #fontnxdduh .gt_indent_3 { text-indent: 15px; } #fontnxdduh .gt_indent_4 { text-indent: 20px; } #fontnxdduh .gt_indent_5 { text-indent: 25px; } #fontnxdduh .katex-display { display: inline-flex !important; margin-bottom: 0.75em !important; } #fontnxdduh div.Reactable > div.rt-table > div.rt-thead > div.rt-tr.rt-tr-group-header > div.rt-th-group:after { height: 0px !important; } </style> <table class="gt_table" data-quarto-disable-processing="false" data-quarto-bootstrap="false"> <thead> <tr class="gt_col_headings"> <th class="gt_col_heading gt_columns_bottom_border gt_left" rowspan="1" colspan="1" scope="col" id="label"><span class='gt_from_md'><strong>Characteristic</strong></span></th> <th class="gt_col_heading gt_columns_bottom_border gt_center" rowspan="1" colspan="1" scope="col" id="stat_0"><span class='gt_from_md'><strong>N = 3,921</strong></span><span class="gt_footnote_marks" style="white-space:nowrap;font-style:italic;font-weight:normal;line-height:0;"><sup>1</sup></span></th> </tr> </thead> <tbody class="gt_table_body"> <tr><td headers="label" class="gt_row gt_left">spam</td> <td headers="stat_0" class="gt_row gt_center"><br /></td></tr> <tr><td headers="label" class="gt_row gt_left"> 0</td> <td headers="stat_0" class="gt_row gt_center">3,554 (91%)</td></tr> <tr><td headers="label" class="gt_row gt_left"> 1</td> <td headers="stat_0" class="gt_row gt_center">367 (9.4%)</td></tr> <tr><td headers="label" class="gt_row gt_left">num_char</td> <td headers="stat_0" class="gt_row gt_center">6 (1, 14)</td></tr> <tr><td headers="label" class="gt_row gt_left">re_subj</td> <td headers="stat_0" class="gt_row gt_center"><br /></td></tr> <tr><td headers="label" class="gt_row gt_left"> 0</td> <td headers="stat_0" class="gt_row gt_center">2,896 (74%)</td></tr> <tr><td headers="label" class="gt_row gt_left"> 1</td> <td headers="stat_0" class="gt_row gt_center">1,025 (26%)</td></tr> <tr><td headers="label" class="gt_row gt_left">to_multiple</td> <td headers="stat_0" class="gt_row gt_center"><br /></td></tr> <tr><td headers="label" class="gt_row gt_left"> 0</td> <td headers="stat_0" class="gt_row gt_center">3,301 (84%)</td></tr> <tr><td headers="label" class="gt_row gt_left"> 1</td> <td headers="stat_0" class="gt_row gt_center">620 (16%)</td></tr> <tr><td headers="label" class="gt_row gt_left">urgent_subj</td> <td headers="stat_0" class="gt_row gt_center"><br /></td></tr> <tr><td headers="label" class="gt_row gt_left"> 0</td> <td headers="stat_0" class="gt_row gt_center">3,914 (100%)</td></tr> <tr><td headers="label" class="gt_row gt_left"> 1</td> <td headers="stat_0" class="gt_row gt_center">7 (0.2%)</td></tr> <tr><td headers="label" class="gt_row gt_left">winner</td> <td headers="stat_0" class="gt_row gt_center">64 (1.6%)</td></tr> <tr><td headers="label" class="gt_row gt_left">attach</td> <td headers="stat_0" class="gt_row gt_center">0.00 (0.00, 0.00)</td></tr> <tr><td headers="label" class="gt_row gt_left">inherit</td> <td headers="stat_0" class="gt_row gt_center"><br /></td></tr> <tr><td headers="label" class="gt_row gt_left"> 0</td> <td headers="stat_0" class="gt_row gt_center">3,793 (97%)</td></tr> <tr><td headers="label" class="gt_row gt_left"> 1</td> <td headers="stat_0" class="gt_row gt_center">122 (3.1%)</td></tr> <tr><td headers="label" class="gt_row gt_left"> 2</td> <td headers="stat_0" class="gt_row gt_center">3 (<0.1%)</td></tr> <tr><td headers="label" class="gt_row gt_left"> 6</td> <td headers="stat_0" class="gt_row gt_center">2 (<0.1%)</td></tr> <tr><td headers="label" class="gt_row gt_left"> 9</td> <td headers="stat_0" class="gt_row gt_center">1 (<0.1%)</td></tr> </tbody> <tfoot class="gt_footnotes"> <tr> <td class="gt_footnote" colspan="2"><span class="gt_footnote_marks" style="white-space:nowrap;font-style:italic;font-weight:normal;line-height:0;"><sup>1</sup></span> <span class='gt_from_md'>n (%); Median (Q1, Q3)</span></td> </tr> </tfoot> </table> </div> ] ] --- class:middle ## Spam filters .question[ Would you expect longer or shorter emails to be spam? ] -- .pull-left[ ``` r plotspam<- email %>% ggplot(aes(x = num_char, y = spam, fill = spam, color = spam)) + geom_density_ridges2(alpha = 0.5) + labs(x = "Number of characters (in thousands)", y = "Spam", title = "Spam vs. number of characters") + guides(color = FALSE, fill = FALSE) + scale_fill_manual(values = c("#89CFF0", "#f1948a")) + scale_color_manual(values = c("#0096FF", "#b03a2e")) +theme_minimal() plotspam ``` <img src="L10_EPIB704_Logistic_v2_files/figure-html/unnamed-chunk-6-1.svg" width="90%" style="display: block; margin: auto;" /> ] -- .pull-right[ ``` r t<-email %>% group_by(spam) %>% summarise(mean_num_char = mean(num_char)) kable(t) ``` <table> <thead> <tr> <th style="text-align:left;"> spam </th> <th style="text-align:right;"> mean_num_char </th> </tr> </thead> <tbody> <tr> <td style="text-align:left;"> 0 </td> <td style="text-align:right;"> 11.250517 </td> </tr> <tr> <td style="text-align:left;"> 1 </td> <td style="text-align:right;"> 5.439204 </td> </tr> </tbody> </table> -- <img src="L10_EPIB704_Logistic_v2_files/figure-html/unnamed-chunk-8-1.svg" width="60%" style="display: block; margin: auto;" /> ] --- class:middle ## Modelling spam - Both number of characters and whether the message has "re:" in the subject might be related to whether the email is spam. **.red[How do we come up with a model that will let us explore this relationship?]** - For simplicity, we'll focus on the number of characters (`num_char`) as predictor, but the model we describe can be expanded to take multiple predictors as well. --- class:middle ## Modelling spam Let's first look at the data .pull-left[ ``` r means <- email %>% group_by(spam) %>% summarise(mean_num_char = mean(num_char)) %>% mutate(group = 1) g <- ggplot(email, aes(x = num_char, y = spam, color = spam)) + geom_jitter(alpha = 0.2) + geom_line(data = means, aes(x = mean_num_char, y = spam, group = group), color = "green", size = 1.5) + labs(x = "Number of characters (in thousands)", y = "Spam") + scale_color_manual(values = c("#0096FF", "#b03a2e")) + #guides(color = FALSE)+ theme_bw() ``` ] .pull-right[ <img src="L10_EPIB704_Logistic_v2_files/figure-html/unnamed-chunk-10-1.svg" width="100%" style="display: block; margin: auto;" /> This isn't something we can reasonably fit a linear model to, .red[we need something different!] ] --- class:middle ### Framing the problem - We can treat each outcome (spam and not) as successes and failures arising from separate _Bernoulli_ trials - **Bernoulli trial**: a random experiment with exactly two possible outcomes, "success" and "failure", in which Pr(success) is the same every time the experiment is conducted -- - Each Bernoulli trial can have a separate probability of success $$ y_i ∼ Bern(p_i) $$ - We can then use the predictor variables to model that probability of success, `\(p_i\)` - We can't just use a linear model for `\(p_i\)` (since `\(p_i\)` must be between 0 and 1) but we can transform the linear model to have the appropriate range --- class: middle ## Example: How many heads from 20 flips of a fair coin ** rbinom(20,1,.5)** for reproducibility need `set.seed (704)` ``` r set.seed(704) sample1 <- rbinom(20,1,.5) #<< 20 = n0 tries, 1 = sample size (Bernoulli), 0.5 probability event sample1 ``` ``` ## [1] 1 0 1 1 1 0 0 0 1 1 1 1 1 0 0 1 1 0 1 1 ``` --- class: middle ### Sequential learning Here is the sequence of data outcomes (0/1) of 20 trials with p = 0.5 -- Graphically our sequential learning process <img src="L10_EPIB704_Logistic_v2_files/figure-html/unnamed-chunk-13-1.svg" width="80%" style="display: block; margin: auto;" /> --- ## Generalized linear models - This is a very general way of addressing many problems in regression and the resulting models are called **generalized linear models (GLMs)** - Logistic regression is just one example - Other examples 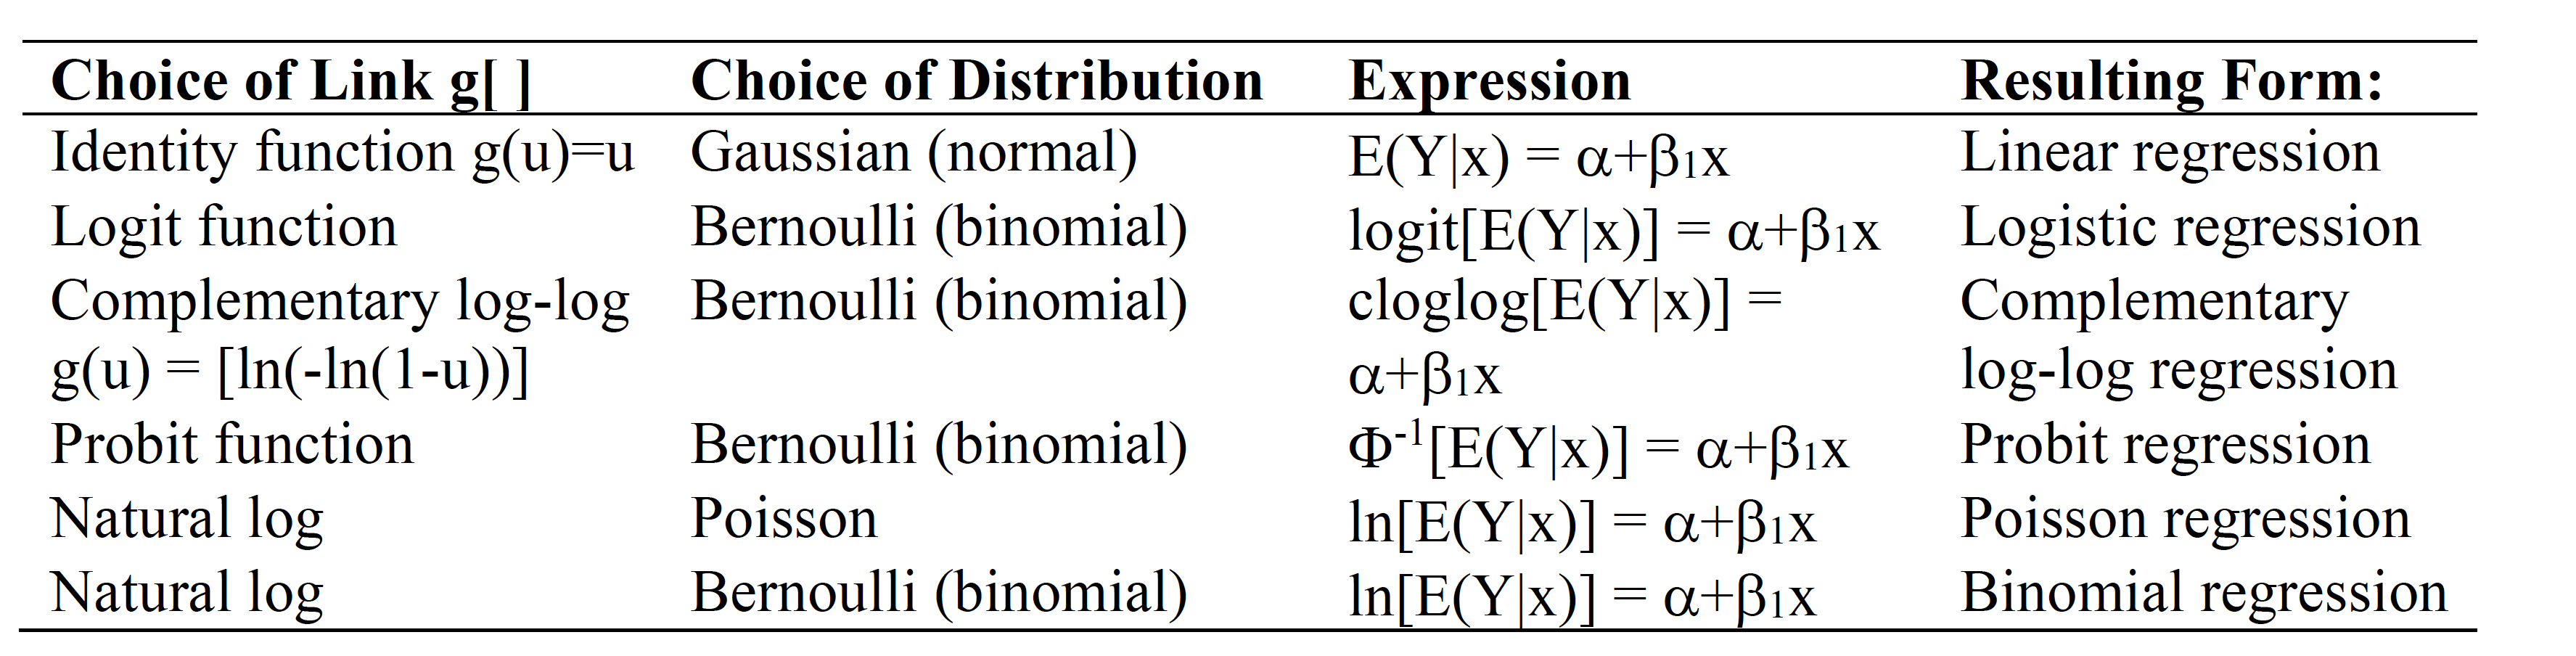 - What is the difference btw the last 2 equations? - Last equation gives risk ratio for binary outcomes. - Can also use identity function E(Y=1|X) for risk differences ??? difference is in rthe error terms --- class:middle ## Three characteristics of GLMs All GLMs have the following three characteristics: 1. A probability distribution describing a generative model for the outcome variable 2. A linear model: `$$\eta = \beta_0 + \beta_1 X_1 + \cdots + \beta_k X_k$$` 3. A link function that relates the linear model to the parameter of the outcome distribution --- class:middle ##R linear syntax <img src="images/glm2.png" width="40%" style="display: block; margin: auto;" /> Default link for linear regression is the identity function (Gaussian distribution) Logistic model link most often is logit function and binomial distribution .large[.blue[ - Standard logistic model -> glm(model formula, data, family = "binomial") - Bayesian logistic model -> rstanarm::stan_glm(model formula, data, family=binomial(link="logit")) - Bayesian logistic model -> brms::brm(model formula, data, family=binomial(link="logit"))]] --- class: middle ## Logistic regression - Logistic regression is a GLM used to model a binary categorical outcome using numerical and categorical predictors - To finish specifying the Logistic model we just need to define a reasonable link function that connects `\(\eta_i\)` (linear outcome variable) to `\(p_i\)` -> logit function - **Logit function:** For `\(0\le p \le 1\)` `$$logit(p) = \log(\frac{p}{1-p}) = log (Odds)$$` -- .pull-left[ ``` r d <- tibble(p = seq(0.001, 0.999, length.out = 1000)) %>% mutate(logit_p = log(p/(1-p))) g <- ggplot(d, aes(x = p, y = logit_p)) + geom_line() + xlim(0,1) + ylab("logit(p)") + labs(title = "logit(p) vs. p") ``` ] .pull-right[ <img src="L10_EPIB704_Logistic_v2_files/figure-html/unnamed-chunk-16-1.svg" width="80%" style="display: block; margin: auto;" /> ] --- class: middle ### Properties of the logit and logistic (inverse logit) functions Logit function takes a value between 0 and 1 and maps it to a value between `\(-\infty\)` and `\(\infty\)` `\(logit(p) = \log\left(\frac{p}{1-p}\right)= \alpha + \beta_1x\)` - Take the inverse of the above equation, applies (*exp*) to both sides to get the **inverse logit** function, AKA **logistic** or **expit** functions: `$$\frac{p}{1-p}= exp^{\alpha + \beta_1x}$$` -- - Rearranging leads to `\(p = \frac{exp^{\alpha + \beta_1x}}{1+exp^{\alpha + \beta_1x}} \in (0,1) \,or\, equivalently\: p = \frac{1}{1+exp^{-(\alpha + \beta_1x)}} \in (0,1)\)` - **.red[The above is the logistic function]** & takes a value between `\(-\infty\)` & `\(\infty\)` and maps it to a value between 0 & 1, a probability. --- class:middle **Properties of the inverse logit or logistic function:** .red[Logit is interpreted as the log odds of a success & inverse logit gives the probability of success.] `$$p = \frac{exp^{\alpha + \beta_1x}}{1+exp^{\alpha + \beta_1x}} \in (0,1)$$` If `\(p\)` = P(D = 1 | X = x), what is P(D = 0 | X = x)? `$$P(D = 0 | X = x) = \frac{1}{1+exp^{\alpha + \beta_1x}} \in (0,1)$$` Facilitates the development of the logit model `$$Odds = \frac{P(D = 1 | X = x)}{P(D = 0 | X = x)} = \frac{\frac{exp^{\alpha + \beta_1x}}{1+exp^{\alpha + \beta_1x}}}{\frac{1}{1+exp^{\alpha + \beta_1x}}} = exp^{\alpha + \beta_1x}$$` Taking logs of both sides $$log(\frac{P(D = 1 | X = x)}{P(D = 0 | X = x)}) = log(Odds) = logit = \alpha + \beta_1x $$ --- class: middle ### The logistic regression model Based on the three GLM criteria we have - `\(y_i \sim \text{Bern}(p_i)\)` - `\(\eta_i = \beta_0+\beta_1 x_{1,i} + \cdots + \beta_n x_{n,i}\)` - `\(\text{logit}(p_i) = \eta_i\)` - fit is done with maximum likelihood and not minimizing the sum of squared residuals, actually there are no residuals! `$$L(success) = \hat{\pi}$$` `$$L(failure) = 1 - \hat{\pi}$$` `$$L(model) = \prod_{i=1}^{n} L(y_{i})$$` -- - Likelihood values are often very small, one reason to use log-likelihood. - Log likelihood is always negative as the likelihood is always between 0-1. - Best fit is smallest value (i.e closest to 0) --- class: middle ###Likelihood Ratio Test (LRT) Here, our goal is to compare the log-likelihoods of two models: the one we build vs. the constant model. <br> Similar to comparing the sum of the squares explained by a LR model to the model that consists solely of the grand mean. <br> The null hypothesis in the LRT is that `\(\beta_1 = \beta_2 = \cdots = \beta_k = 0\)`. The alternative hypothesis is that at least one of these coefficients is non-zero. The test statistic is: `$$G = -2\log(\text{constant model}) - (-2 \log(\text{model}))$$` These two quantities are known as deviances. It can be shown that `\(G\)` follows a `\(\chi^2\)` distribution with k degrees of freedom (k=no. of parameters in the model). --- class:middle ### Likelihood Ratio Test (LRT) Spam example - model GLM (same format as LR except) - use `"glm"` instead of `"lm"` - define `family = "binomial"` for the link function ``` r mod <- glm(spam ~ num_char, data = email, family = "binomial") jtools::summ(mod, confint=T, exp=T, digits = 3, model.info = F, model.fit = F) ``` <table class="table table-striped table-hover table-condensed table-responsive" style="width: auto !important; margin-left: auto; margin-right: auto;border-bottom: 0;"> <thead> <tr> <th style="text-align:left;"> </th> <th style="text-align:right;"> exp(Est.) </th> <th style="text-align:right;"> 2.5% </th> <th style="text-align:right;"> 97.5% </th> <th style="text-align:right;"> z val. </th> <th style="text-align:right;"> p </th> </tr> </thead> <tbody> <tr> <td style="text-align:left;font-weight: bold;"> (Intercept) </td> <td style="text-align:right;"> 0.166 </td> <td style="text-align:right;"> 0.144 </td> <td style="text-align:right;"> 0.190 </td> <td style="text-align:right;"> -25.135 </td> <td style="text-align:right;"> 0.000 </td> </tr> <tr> <td style="text-align:left;font-weight: bold;"> num_char </td> <td style="text-align:right;"> 0.940 </td> <td style="text-align:right;"> 0.925 </td> <td style="text-align:right;"> 0.955 </td> <td style="text-align:right;"> -7.746 </td> <td style="text-align:right;"> 0.000 </td> </tr> </tbody> <tfoot><tr><td style="padding: 0; " colspan="100%"> <sup></sup> Standard errors: MLE</td></tr></tfoot> </table> ``` r logLik(mod) ``` ``` ## 'log Lik.' -1173.201 (df=2) ``` --- class:middle ### Likelihood Ratio Test (LRT) ``` r library(lmtest) lrtest(mod) ``` ``` ## Likelihood ratio test ## ## Model 1: spam ~ num_char ## Model 2: spam ~ 1 ## #Df LogLik Df Chisq Pr(>Chisq) ## 1 2 -1173.2 ## 2 1 -1218.6 -1 90.779 < 2.2e-16 *** ## --- ## Signif. codes: 0 '***' 0.001 '**' 0.01 '*' 0.05 '.' 0.1 ' ' 1 ``` Model is improved with the addition of the `num_char` variable --- class:middle ### The logistic regression model 3 spaces to consider - logistic space - for 1 unit change in x -> linear change in `\(\beta_1\)` (change in log odds) - odds space - for 1 unit change in x -> `\(\dfrac{e^{\beta_1(x+1)}}{e^{\beta_1x}}\)` = `\(e^{\beta_1}\)` **multiplier** -> (change in odds ratio) - probability space - for 1 unit change in x -> no nice sentence to describe the change since non-linear function but intuitively easier to understand `$$p_i = \frac{\exp(\beta_0+\beta_1 x_{1,i} + \cdots + \beta_k x_{k,i})}{1+\exp(\beta_0+\beta_1 x_{1,i} + \cdots + \beta_k x_{k,i})} \in (0,1)$$` --- ## Odds space `\(e^{\beta_1}\)` is the **multiplier** for for 1 unit change in x (odds ratio - constant change) Consider predicting spam based on inclusion of the term `winner` ``` r two.way <- table(email$winner, email$spam); two.way <- two.way[c(2,1),] #changing row order to get OR associated with winner kable(two.way); mosaic::oddsRatio(two.way) ``` <table> <thead> <tr> <th style="text-align:left;"> </th> <th style="text-align:right;"> 0 </th> <th style="text-align:right;"> 1 </th> </tr> </thead> <tbody> <tr> <td style="text-align:left;"> yes </td> <td style="text-align:right;"> 44 </td> <td style="text-align:right;"> 20 </td> </tr> <tr> <td style="text-align:left;"> no </td> <td style="text-align:right;"> 3510 </td> <td style="text-align:right;"> 347 </td> </tr> </tbody> </table> ``` ## [1] 4.597852 ``` ``` r mod <- glm(spam ~ winner, data = email, family = "binomial"); exp(coef(mod)) ``` ``` ## (Intercept) winneryes ## 0.0988604 4.5978517 ``` This shows that OR calculated from 2X2 table = `\(exp (\beta)\)` from logistic model --- class:middle ## Spam model ``` r #Usual model approach spam_fit <- glm(spam ~ num_char, data = email, family = "binomial") jtools::summ(spam_fit, digits=3, confint=T, model.info = F, model.fit = F) #use summary(spam_fit) for details ``` <table class="table table-striped table-hover table-condensed table-responsive" style="width: auto !important; margin-left: auto; margin-right: auto;border-bottom: 0;"> <thead> <tr> <th style="text-align:left;"> </th> <th style="text-align:right;"> Est. </th> <th style="text-align:right;"> 2.5% </th> <th style="text-align:right;"> 97.5% </th> <th style="text-align:right;"> z val. </th> <th style="text-align:right;"> p </th> </tr> </thead> <tbody> <tr> <td style="text-align:left;font-weight: bold;"> (Intercept) </td> <td style="text-align:right;"> -1.799 </td> <td style="text-align:right;"> -1.939 </td> <td style="text-align:right;"> -1.658 </td> <td style="text-align:right;"> -25.135 </td> <td style="text-align:right;"> 0.000 </td> </tr> <tr> <td style="text-align:left;font-weight: bold;"> num_char </td> <td style="text-align:right;"> -0.062 </td> <td style="text-align:right;"> -0.078 </td> <td style="text-align:right;"> -0.046 </td> <td style="text-align:right;"> -7.746 </td> <td style="text-align:right;"> 0.000 </td> </tr> </tbody> <tfoot><tr><td style="padding: 0; " colspan="100%"> <sup></sup> Standard errors: MLE</td></tr></tfoot> </table> --- ### Prediction P(spam) for an email with 2000 characters Model: `$$\log\left(\frac{p}{1-p}\right) = -1.80-0.0621\times \text{num_char}$$` `\(\log\left(\frac{p}{1-p}\right) =\)` -1.80-0.0621* 2 = -1.9242 `\(\frac{p}{1-p} = \exp(-1.9242) =\)` 0.15 `\(\rightarrow p = 0.15 \times (1 - p)\)` `$$p = 0.15 - 0.15p \rightarrow 1.15p = 0.15$$` `$$p = 0.15 / 1.15 = 0.13$$` Somewhat easier with less calculations ``` r rstanarm::invlogit(-1.924) ``` ``` ## [1] 0.1274162 ``` --- class:middle ### Prediction What is the probability that an email with 15000 or 40000 characters is spam? .pull-left[ ``` r # General formula from tidymodels spam_fit <- logistic_reg() %>% set_engine("glm") %>% fit(spam ~ num_char, family="binomial", data = email) newdata <- tibble(num_char = c(2, 15, 40), color= c("#7CB9E8", "#E25822", "#1CAC78"), shape = c(22, 24, 23)) y_hat <- predict(spam_fit, newdata, type = "raw") p_hat <- exp(y_hat) / (1 + exp(y_hat)) newdata <- newdata %>% bind_cols(y_hat = y_hat,p_hat = p_hat) spam_aug <- augment(spam_fit$fit) %>% mutate(prob = exp(.fitted) / (1 + exp(.fitted))) ``` ] -- .pull-right[ <img src="L10_EPIB704_Logistic_v2_files/figure-html/unnamed-chunk-22-1.svg" width="95%" style="display: block; margin: auto;" /> - .blue[2K chars: P(spam) = 0.13] - .brown[15K chars, P(spam) = 0.06] - .green[40K chars, P(spam) = 0.01] ] --- class:middle ## Prediction - The mechanics of prediction is **easy**: - Plug in values of predictors to the model equation - Calculate the predicted value of the response variable, `\(\hat{y}\)` -- - **.red[Getting it right is hard!]** - There is no guarantee the model estimates you have are correct - Or that your model will perform as well with new data as it did with your sample data --- class:middle ## Underfitting and overfitting <img src="L10_EPIB704_Logistic_v2_files/figure-html/unnamed-chunk-23-1.svg" width="70%" style="display: block; margin: auto;" /> --- class: middle ### Sensitivity and specificity We already learned how to compare models using the deviance, but how do we know how well our model works? One techinque for assessing the goodness-of-fit in a logistic regression model is to examine the percentage of the time that our model was *right*.” | | Email is spam | Email is not spam | |-------------------------|-------------------------------|-------------------------------| | Email labelled spam | True positive | False positive (Type 1 error) | | Email labelled not spam | False negative (Type 2 error) | True negative | - Sensitivity = P(Labelled spam | Email spam) = TP / (TP + FN) - Sensitivity = 1 − False negative rate = 1 - (FN / (TP + FN) ) - Specificity = P(Labelled not spam | Email not spam) = TN / (FP + TN) - Specificity = 1 − False positive rate = 1 - (FP / (FP + TN)) --- class: middle ### Classification ``` r mod1 <- glm(spam ~ ., data = email, family = "binomial") #full model email <- email %>% mutate(fitted = fitted.values(mod1)) %>% mutate(fitspam = ifelse(fitted >= 0.5, 1, 0)) tbl <- table(email$spam, email$fitspam) tbl ``` ``` ## ## 0 1 ## 0 3521 33 ## 1 299 68 ``` ``` r sum(diag(tbl)) / nrow(email) ``` ``` ## [1] 0.9153277 ``` Model is correct 91.5% of the time --- class: middle ### Accuracy of other models .pull-left[ **Average** spam risk of the null model ``` r av_risk <- sum(as.numeric(email$spam==1)) / nrow(email) email <- email %>% mutate(fitspam= sample(c(0,1), size=3921, replace=TRUE, c(1-av_risk, av_risk))) table(email$spam, email$fitspam) ``` ``` ## ## 0 1 ## 0 3267 287 ## 1 329 38 ``` ``` r (table(email$spam, email$fitspam)[1,1] + table(email$spam, email$fitspam)[2,2]) / nrow(email) ``` ``` ## [1] 0.8428972 ``` **model accuracy = 82%** ] .pull-right[ Model probability as coin toss ``` r email <- email %>% mutate(fitspam= sample(c(0,1), size=3921, replace=TRUE)) table(email$spam, email$fitspam) ``` ``` ## ## 0 1 ## 0 1809 1745 ## 1 188 179 ``` ``` r (table(email$spam, email$fitspam)[1,1] + table(email$spam, email$fitspam)[2,2]) / nrow(email) ``` ``` ## [1] 0.5070135 ``` **model accuracy = 50%** ] --- class: middle ### Trade-offs .pull-left[ If you were designing a spam filter, would you want sensitivity and specificity to be high or low? <br> ``` r library (rsample) # get initial_split, training and testing functions email_split <- initial_split(email, prop = 0.80) # Create data frames for the two sets: train_data <- training(email_split) test_data <- testing(email_split) email_fit <- logistic_reg() %>% set_engine("glm") %>% fit(spam ~ ., data = train_data, family = "binomial") email_pred <- predict(email_fit, test_data, type = "prob") %>% bind_cols(test_data %>% dplyr::select(spam, time)) ``` What are the trade-offs associated with each decision? ] -- .pull-right[ ``` r email_pred %>% roc_curve(truth = spam, .pred_1, event_level = "second") %>% autoplot() ``` <img src="L10_EPIB704_Logistic_v2_files/figure-html/unnamed-chunk-28-1.svg" width="80%" style="display: block; margin: auto;" /> ``` r email_pred %>% roc_auc(truth = spam,.pred_1, event_level = "second") ``` ``` ## # A tibble: 1 × 3 ## .metric .estimator .estimate ## <chr> <chr> <dbl> ## 1 roc_auc binary 0.875 ``` ] --- class:middle ### Types of logistic regression The three types of logistic regression 1. Binary logistic regression - What we have been doing 2. Multinomial logistic regression - When we have multiple outcomes, e.g. predict whether someone may have the flu, an allergy, a cold, or COVID-19 3. Ordinal logistic regression - When the outcome is ordered, e.g. determine the severity of a COVID-19 infection, sorting it into mild, moderate, and severe cases <br> **For what it's worth, in machine learning (ML) supervised learning is used to classify something or predict a value, and logistic regression is a common classifier used ML ** --- class:middle ### Illustration of reproducing results and more... A recent paper in the [NEJM](https://www.nejm.org/doi/full/10.1056/NEJMoa2204511) concluded that .red[ _"In patients with refractory out-of-hospital cardiac arrest, extracorporeal CPR and conventional CPR had similar effects on survival with a favorable neurologic outcome"_.] <img src="images/inception1.png" width="70%" style="display: block; margin: auto;" /> **Two questions** 1. Can we reproduce the analysis? 2. Accepting the authors' analysis, do we accept their conclusion of .red[similar effects]? --- class:middle ### Illustration of reproduction of results Given the use of OR, the analysis was most likely been a logistic regression with the binary outcome of success / failure at 180 days. ``` r # simulate dataset - one line per individual dat <- data.frame(trt = 1:133 > 63, #0 = control, 1 = extracorporeal # time = sample(1:180, size = 133, replace = TRUE), if wanted to simulate a time to event event = c(1:63 < 11, 1:70 < 15)) %>% mutate(trt = ifelse (trt=="FALSE", 0, 1),event = ifelse (event=="FALSE", 0, 1)) fit <- glm(event ~ trt, data = dat, family = binomial(link="logit")) ``` .pull-left[ **Log-Odds Coefficients** <table class="table table-striped table-hover table-condensed table-responsive" style="width: auto !important; margin-left: auto; margin-right: auto;border-bottom: 0;"> <thead> <tr> <th style="text-align:left;"> </th> <th style="text-align:right;"> Est. </th> <th style="text-align:right;"> S.E. </th> <th style="text-align:right;"> z val. </th> <th style="text-align:right;"> p </th> </tr> </thead> <tbody> <tr> <td style="text-align:left;font-weight: bold;"> (Intercept) </td> <td style="text-align:right;"> -1.7 </td> <td style="text-align:right;"> 0.3 </td> <td style="text-align:right;"> -4.8 </td> <td style="text-align:right;"> 0.0 </td> </tr> <tr> <td style="text-align:left;font-weight: bold;"> trt </td> <td style="text-align:right;"> 0.3 </td> <td style="text-align:right;"> 0.5 </td> <td style="text-align:right;"> 0.6 </td> <td style="text-align:right;"> 0.5 </td> </tr> </tbody> <tfoot><tr><td style="padding: 0; " colspan="100%"> <sup></sup> Standard errors: MLE</td></tr></tfoot> </table> ] -- .pull-right[ **Exponentiated coefficients** which reproduces the NEJM results. <table class="table table-striped table-hover table-condensed table-responsive" style="width: auto !important; margin-left: auto; margin-right: auto;border-bottom: 0;"> <thead> <tr> <th style="text-align:left;"> </th> <th style="text-align:right;"> exp(Est.) </th> <th style="text-align:right;"> 2.5% </th> <th style="text-align:right;"> 97.5% </th> <th style="text-align:right;"> z val. </th> <th style="text-align:right;"> p </th> </tr> </thead> <tbody> <tr> <td style="text-align:left;font-weight: bold;"> (Intercept) </td> <td style="text-align:right;"> 0.19 </td> <td style="text-align:right;"> 0.10 </td> <td style="text-align:right;"> 0.37 </td> <td style="text-align:right;"> -4.84 </td> <td style="text-align:right;"> 0.00 </td> </tr> <tr> <td style="text-align:left;font-weight: bold;"> trt </td> <td style="text-align:right;"> 1.33 </td> <td style="text-align:right;"> 0.54 </td> <td style="text-align:right;"> 3.24 </td> <td style="text-align:right;"> 0.62 </td> <td style="text-align:right;"> 0.54 </td> </tr> </tbody> <tfoot><tr><td style="padding: 0; " colspan="100%"> <sup></sup> Standard errors: MLE</td></tr></tfoot> </table> ] --- class:middle ### Illustration of reproduction of results A simpler approach is to use the aggregated data and apply a `weight` argument within the `glm` function which gives the exact same answer as expected. ``` r # create data frame dat1 <- tibble(Trial = c("INCEPTION", "INCEPTION"), Tx = c("cCPR", "eCPR"), fail = c(53, 56), success = c(10,14)) %>% mutate(total = fail + success, prop_success = success / total) fit1 <- glm(prop_success ~ Tx, data = dat1, family = binomial(link="logit"), weights = total) ``` .pull-left[ **Log-Odds Coefficients** <table class="table table-striped table-hover table-condensed table-responsive" style="width: auto !important; margin-left: auto; margin-right: auto;border-bottom: 0;"> <thead> <tr> <th style="text-align:left;"> </th> <th style="text-align:right;"> Est. </th> <th style="text-align:right;"> S.E. </th> <th style="text-align:right;"> z val. </th> <th style="text-align:right;"> p </th> </tr> </thead> <tbody> <tr> <td style="text-align:left;font-weight: bold;"> (Intercept) </td> <td style="text-align:right;"> -1.7 </td> <td style="text-align:right;"> 0.3 </td> <td style="text-align:right;"> -4.8 </td> <td style="text-align:right;"> 0.0 </td> </tr> <tr> <td style="text-align:left;font-weight: bold;"> TxeCPR </td> <td style="text-align:right;"> 0.3 </td> <td style="text-align:right;"> 0.5 </td> <td style="text-align:right;"> 0.6 </td> <td style="text-align:right;"> 0.5 </td> </tr> </tbody> <tfoot><tr><td style="padding: 0; " colspan="100%"> <sup></sup> Standard errors: MLE</td></tr></tfoot> </table> ] -- .pull-right[ **Exponentiated coefficients** ``` r jtools::summ(fit1, confint=T, exp=T, digits = 1, model.info = F, model.fit = F) ``` <table class="table table-striped table-hover table-condensed table-responsive" style="width: auto !important; margin-left: auto; margin-right: auto;border-bottom: 0;"> <thead> <tr> <th style="text-align:left;"> </th> <th style="text-align:right;"> exp(Est.) </th> <th style="text-align:right;"> 2.5% </th> <th style="text-align:right;"> 97.5% </th> <th style="text-align:right;"> z val. </th> <th style="text-align:right;"> p </th> </tr> </thead> <tbody> <tr> <td style="text-align:left;font-weight: bold;"> (Intercept) </td> <td style="text-align:right;"> 0.2 </td> <td style="text-align:right;"> 0.1 </td> <td style="text-align:right;"> 0.4 </td> <td style="text-align:right;"> -4.8 </td> <td style="text-align:right;"> 0.0 </td> </tr> <tr> <td style="text-align:left;font-weight: bold;"> TxeCPR </td> <td style="text-align:right;"> 1.3 </td> <td style="text-align:right;"> 0.5 </td> <td style="text-align:right;"> 3.2 </td> <td style="text-align:right;"> 0.6 </td> <td style="text-align:right;"> 0.5 </td> </tr> </tbody> <tfoot><tr><td style="padding: 0; " colspan="100%"> <sup></sup> Standard errors: MLE</td></tr></tfoot> </table> ] --- class:middle ### Illustration: Reproduction of Results, using the Bayesian approach Here are **4 methods** which all give the same answer as the frequentist method using the default vague priors (to see defaults use `prior_summary`) - 2 approaches with `rstanarm` - one with aggregated data, one with individual data - 2 approaches with `brms` - one with aggregated data, one with individual data ``` r #using stan_glm fit2 <- stan_glm(prop_success ~ Tx, data = dat1, family = binomial(link="logit"), weights = total, refresh=0) #aggregate data fit2a <- stan_glm(event ~ trt, data = dat, family = binomial(link="logit"), refresh=0) #individual line data #Using brms fit3 <- brm(success | trials(total) ~ Tx, data = dat1, family = binomial(link="logit"), refresh=0) #aggregate data fit3a <- brm(event ~ trt, data = dat, family = binomial(link="logit"), refresh=0) #individual line data ``` --- class:middle ### Reproduction of Results, using the Bayesian approach How to assess the **.red[Odds Ratio]** from logistic regression model .pull-left[ ``` r library(knitr) fit3 <- brm(success | trials(total) ~ Tx, data = dat1, family = binomial(link="logit"), refresh=0) #aggregate data draws3 <- as_draws_df(fit3) %>% # rename and drop the unneeded columns mutate(or = exp(b_TxeCPR)) # compute the OR gg <- draws3 %>% ggplot(aes(x = or)) + stat_halfeye(point_interval = mean_qi, .width = .95, color="blue", fill="lightblue") +# slab_colour scale_y_continuous(NULL, breaks = NULL) + xlim(0, 6) + xlab("Odds ratio")+ theme_bw() ``` ] .pull-right[ <img src="L10_EPIB704_Logistic_v2_files/figure-html/unnamed-chunk-38-1.svg" width="80%" style="display: block; margin: auto;" /> ] --- class:middle ### .red[Do we really want the OR?] OR is a measure of association that is difficult to interpret - Popular because outcome from logistic regression models But other options exist for binomial data - The log-binomial and binomial regression models estimate the risk ratio and the risk difference, respectively - These models are sometimes referred to collectively as binomial regression models with, respectively, a log link and an identity link --- class:middle ### Reproduction of Results, using the Bayesian approach .red[Risk difference] using binomial regression ``` r fit4 <- brm(success | trials(total) ~ Tx, data = dat1, family = binomial(link="identity"), refresh=0) draws4 <- as_draws_df(fit4) %>% #draws from posterior transmute(diff= 100*b_TxeCPR) # rename and drop the unneeded columns ``` -- ``` r print(fit4, digits=2) ``` ``` ## Family: binomial ## Links: mu = identity ## Formula: success | trials(total) ~ Tx ## Data: dat1 (Number of observations: 2) ## Draws: 4 chains, each with iter = 2000; warmup = 1000; thin = 1; ## total post-warmup draws = 4000 ## ## Regression Coefficients: ## Estimate Est.Error l-95% CI u-95% CI Rhat Bulk_ESS Tail_ESS ## Intercept 0.17 0.05 0.09 0.26 1.00 2501 2461 ## TxeCPR 0.04 0.07 -0.09 0.17 1.00 2655 2058 ## ## Draws were sampled using sampling(NUTS). For each parameter, Bulk_ESS ## and Tail_ESS are effective sample size measures, and Rhat is the potential ## scale reduction factor on split chains (at convergence, Rhat = 1). ``` --- class:middle ### Reproduction of Results, using the Bayesian approach .red[Risk difference] using binomial regression <img src="L10_EPIB704_Logistic_v2_files/figure-html/unnamed-chunk-41-1.svg" width="55%" style="display: block; margin: auto;" /> Remember the authors' conclusions **"eCPR and cCPR had similar effects on survival"** What is the probability this is true? Need to define .red[*similar*]? --- class: middle ### Region/Range of Practical Equivalence (ROPE) <img src="L10_EPIB704_Logistic_v2_files/figure-html/unnamed-chunk-42-1.svg" width="35%" style="display: block; margin: auto;" /> **Assuming +/- 2 lives / 100 is similar**, - Blue area represents this equivalence probability, 19.775%. - There remains a 61.475% that eCPR offers a clinically meaningful survival benefit (orange area to the right of blue area). A good resource about the .red[Range of Practical Equivalence -ROPE [Here](https://easystats.github.io/bayestestR/articles/region_of_practical_equivalence.html)] .large[.red[Bayes has certainly deepened our appreciation of this data]] --- class:middle ### Another advantage of using the Bayesian approach Some prior information exists from 2 previous RCTs and the Bayesian analysis can take this information into account. - [PRAGUE](https://pubmed.ncbi.nlm.nih.gov/35191923/) & [ARREST](https://pubmed.ncbi.nlm.nih.gov/30092413/) trials (combined) 25 successes and 122 failures in cCRP (beta(25, 122)). - PRAGUE & ARREST trials (combined) 44 successes and 94 failures in eCRP (beta(44, 94)). ``` r fit5 <- brm(success | trials(total) ~ 0 + Tx, data = dat1, family = binomial(link="identity"), refresh = 0) fit5 <- brm(success | trials(total) ~ 0 + Tx, data = dat1, family = binomial(link="identity"), prior = c(prior(beta(1, 1), class = b, lb = 0, ub = 1), prior(beta(25,122), class = b, coef = "TxcCPR"), prior(beta(44,94),class = b, coef = "TxeCPR")), chains = 4, warmup = 1000, iter = 2000, seed = 123, refresh = 0) ``` --- class:middle ### Another advantage of using the Bayesian approach ``` ## Family: binomial ## Links: mu = identity ## Formula: success | trials(total) ~ 0 + Tx ## Data: dat1 (Number of observations: 2) ## Draws: 4 chains, each with iter = 2000; warmup = 1000; thin = 1; ## total post-warmup draws = 4000 ## ## Regression Coefficients: ## Estimate Est.Error l-95% CI u-95% CI Rhat Bulk_ESS Tail_ESS ## TxcCPR 0.17 0.02 0.12 0.22 1.00 3457 2813 ## TxeCPR 0.28 0.03 0.22 0.34 1.00 3925 2855 ## ## Draws were sampled using sampling(NUTS). For each parameter, Bulk_ESS ## and Tail_ESS are effective sample size measures, and Rhat is the potential ## scale reduction factor on split chains (at convergence, Rhat = 1). ``` --- class:middle ### Another advantage of using the Bayesian approach <img src="L10_EPIB704_Logistic_v2_files/figure-html/unnamed-chunk-45-1.svg" width="80%" style="display: block; margin: auto;" /> Despite inconclusive result from INCEPTION trial, the totality of the evidence suggest a meaningful benefit from eCRP. --- class: middle ### QUESTIONS? ## COMMENTS? # RECOMMENDATIONS? --- class: middle ## Code for the prediction plot ``` r g1 <- ggplot(spam_aug, aes(x = num_char)) + geom_point(aes(y = as.numeric(spam)-1, color = spam), alpha = 0.3) + scale_color_manual(values = c("#0096FF", "#b03a2e")) + scale_y_continuous(breaks = c(0, 1)) + guides(color = FALSE) + geom_line(aes(y = prob)) + geom_point(data = newdata, aes(x = num_char, y = p_hat), fill = newdata$color, shape = newdata$shape, stroke = 1, size = 6) + labs(x = "Number of characters (in thousands)", y = "Spam", title = "Spam vs. number of characters" ) + theme_classic() #g1 ``` --- class: middle ## Code for the Odds Ratio's Posterior Distributions ``` r fit3 <- brm(success | trials(total) ~ Tx, data = dat1, family = binomial(link="logit"), refresh=0) #aggregate data draws3 <- as_draws_df(fit3) %>% # rename and drop the unneeded columns mutate(or = exp(b_TxeCPR)) # compute the OR gg <- draws3 %>% ggplot(aes(x = or, color ="lightblue")) + stat_halfeye(point_interval = mean_qi, .width = .95, color="blue") +# slab_colour scale_y_continuous(NULL, breaks = NULL) + xlim(0, 9) + xlab("Odds ratio")+ theme_minimal() ``` --- class: middle ## Code for the ROPE ``` r gg <- ggplot(draws4, aes(x = diff)) + stat_halfeye(aes(fill = after_stat(abs(x) < 2)), point_interval = mean_qi, .width = .95) + scale_y_continuous(NULL, breaks = NULL) + xlim(-20,25) + xlab("Risk difference survival benefit (eCPR - cCPR)") + scale_fill_manual(values = c("orange", "skyblue")) + ggtitle("Risk difference of survival benefit (/100 patients)", subtitle = "Blue area = range of practical equivalence (ROPE) +/- 2%") + theme_bw() + theme(legend.position="none") ``` Also check here: .blue[https://easystats.github.io/bayestestR/articles/region_of_practical_equivalence.html] Makowski, D., Ben-Shachar, M. S., & Lüdecke, D. (2019). bayestestR: Describing Effects and their Uncertainty, Existence and Significance within the Bayesian Framework. Journal of Open Source Software, 4(40), 1541. https://doi.org/10.21105/joss.01541