TEs and my data
ERM
2024-09-09
Last updated: 2024-09-09
Checks: 7 0
Knit directory: ATAC_learning/
This reproducible R Markdown analysis was created with workflowr (version 1.7.1). The Checks tab describes the reproducibility checks that were applied when the results were created. The Past versions tab lists the development history.
Great! Since the R Markdown file has been committed to the Git repository, you know the exact version of the code that produced these results.
Great job! The global environment was empty. Objects defined in the global environment can affect the analysis in your R Markdown file in unknown ways. For reproduciblity it’s best to always run the code in an empty environment.
The command set.seed(20231016) was run prior to running
the code in the R Markdown file. Setting a seed ensures that any results
that rely on randomness, e.g. subsampling or permutations, are
reproducible.
Great job! Recording the operating system, R version, and package versions is critical for reproducibility.
Nice! There were no cached chunks for this analysis, so you can be confident that you successfully produced the results during this run.
Great job! Using relative paths to the files within your workflowr project makes it easier to run your code on other machines.
Great! You are using Git for version control. Tracking code development and connecting the code version to the results is critical for reproducibility.
The results in this page were generated with repository version cc49b3b. See the Past versions tab to see a history of the changes made to the R Markdown and HTML files.
Note that you need to be careful to ensure that all relevant files for
the analysis have been committed to Git prior to generating the results
(you can use wflow_publish or
wflow_git_commit). workflowr only checks the R Markdown
file, but you know if there are other scripts or data files that it
depends on. Below is the status of the Git repository when the results
were generated:
Ignored files:
    Ignored:    .RData
    Ignored:    .Rhistory
    Ignored:    .Rproj.user/
    Ignored:    data/ACresp_SNP_table.csv
    Ignored:    data/ARR_SNP_table.csv
    Ignored:    data/All_merged_peaks.tsv
    Ignored:    data/CAD_gwas_dataframe.RDS
    Ignored:    data/CTX_SNP_table.csv
    Ignored:    data/Collapsed_expressed_NG_peak_table.csv
    Ignored:    data/DEG_toplist_sep_n45.RDS
    Ignored:    data/FRiP_first_run.txt
    Ignored:    data/Final_four_data/
    Ignored:    data/Frip_1_reads.csv
    Ignored:    data/Frip_2_reads.csv
    Ignored:    data/Frip_3_reads.csv
    Ignored:    data/Frip_4_reads.csv
    Ignored:    data/Frip_5_reads.csv
    Ignored:    data/Frip_6_reads.csv
    Ignored:    data/GO_KEGG_analysis/
    Ignored:    data/HF_SNP_table.csv
    Ignored:    data/Ind1_75DA24h_dedup_peaks.csv
    Ignored:    data/Ind1_TSS_peaks.RDS
    Ignored:    data/Ind1_firstfragment_files.txt
    Ignored:    data/Ind1_fragment_files.txt
    Ignored:    data/Ind1_peaks_list.RDS
    Ignored:    data/Ind1_summary.txt
    Ignored:    data/Ind2_TSS_peaks.RDS
    Ignored:    data/Ind2_fragment_files.txt
    Ignored:    data/Ind2_peaks_list.RDS
    Ignored:    data/Ind2_summary.txt
    Ignored:    data/Ind3_TSS_peaks.RDS
    Ignored:    data/Ind3_fragment_files.txt
    Ignored:    data/Ind3_peaks_list.RDS
    Ignored:    data/Ind3_summary.txt
    Ignored:    data/Ind4_79B24h_dedup_peaks.csv
    Ignored:    data/Ind4_TSS_peaks.RDS
    Ignored:    data/Ind4_V24h_fraglength.txt
    Ignored:    data/Ind4_fragment_files.txt
    Ignored:    data/Ind4_fragment_filesN.txt
    Ignored:    data/Ind4_peaks_list.RDS
    Ignored:    data/Ind4_summary.txt
    Ignored:    data/Ind5_TSS_peaks.RDS
    Ignored:    data/Ind5_fragment_files.txt
    Ignored:    data/Ind5_fragment_filesN.txt
    Ignored:    data/Ind5_peaks_list.RDS
    Ignored:    data/Ind5_summary.txt
    Ignored:    data/Ind6_TSS_peaks.RDS
    Ignored:    data/Ind6_fragment_files.txt
    Ignored:    data/Ind6_peaks_list.RDS
    Ignored:    data/Ind6_summary.txt
    Ignored:    data/Knowles_4.RDS
    Ignored:    data/Knowles_5.RDS
    Ignored:    data/Knowles_6.RDS
    Ignored:    data/LiSiLTDNRe_TE_df.RDS
    Ignored:    data/MI_gwas.RDS
    Ignored:    data/SNP_GWAS_PEAK_MRC_id
    Ignored:    data/SNP_GWAS_PEAK_MRC_id.csv
    Ignored:    data/SNP_gene_cat_list.tsv
    Ignored:    data/SNP_supp_schneider.RDS
    Ignored:    data/TE_info/
    Ignored:    data/all_TSSE_scores.RDS
    Ignored:    data/all_four_filtered_counts.txt
    Ignored:    data/aln_run1_results.txt
    Ignored:    data/anno_ind1_DA24h.RDS
    Ignored:    data/anno_ind4_V24h.RDS
    Ignored:    data/annotated_gwas_SNPS.csv
    Ignored:    data/background_n45_he_peaks.RDS
    Ignored:    data/cardiac_muscle_FRIP.csv
    Ignored:    data/cardiomyocyte_FRIP.csv
    Ignored:    data/col_ng_peak.csv
    Ignored:    data/cormotif_full_4_run.RDS
    Ignored:    data/cormotif_full_4_run_he.RDS
    Ignored:    data/cormotif_full_6_run.RDS
    Ignored:    data/cormotif_full_6_run_he.RDS
    Ignored:    data/cormotif_probability_45_list.csv
    Ignored:    data/cormotif_probability_45_list_he.csv
    Ignored:    data/cormotif_probability_all_6_list.csv
    Ignored:    data/cormotif_probability_all_6_list_he.csv
    Ignored:    data/embryo_heart_FRIP.csv
    Ignored:    data/enhancer_list_ENCFF126UHK.bed
    Ignored:    data/enhancerdata/
    Ignored:    data/filt_Peaks_efit2.RDS
    Ignored:    data/filt_Peaks_efit2_bl.RDS
    Ignored:    data/filt_Peaks_efit2_n45.RDS
    Ignored:    data/first_Peaksummarycounts.csv
    Ignored:    data/first_run_frag_counts.txt
    Ignored:    data/full_bedfiles/
    Ignored:    data/gene_ref.csv
    Ignored:    data/gwas_1_dataframe.RDS
    Ignored:    data/gwas_2_dataframe.RDS
    Ignored:    data/gwas_3_dataframe.RDS
    Ignored:    data/gwas_4_dataframe.RDS
    Ignored:    data/gwas_5_dataframe.RDS
    Ignored:    data/high_conf_peak_counts.csv
    Ignored:    data/high_conf_peak_counts.txt
    Ignored:    data/high_conf_peaks_bl_counts.txt
    Ignored:    data/high_conf_peaks_counts.txt
    Ignored:    data/hits_files/
    Ignored:    data/hyper_files/
    Ignored:    data/hypo_files/
    Ignored:    data/ind1_DA24hpeaks.RDS
    Ignored:    data/ind1_TSSE.RDS
    Ignored:    data/ind2_TSSE.RDS
    Ignored:    data/ind3_TSSE.RDS
    Ignored:    data/ind4_TSSE.RDS
    Ignored:    data/ind4_V24hpeaks.RDS
    Ignored:    data/ind5_TSSE.RDS
    Ignored:    data/ind6_TSSE.RDS
    Ignored:    data/initial_complete_stats_run1.txt
    Ignored:    data/left_ventricle_FRIP.csv
    Ignored:    data/median_24_lfc.RDS
    Ignored:    data/median_3_lfc.RDS
    Ignored:    data/mergedPeads.gff
    Ignored:    data/mergedPeaks.gff
    Ignored:    data/motif_list_full
    Ignored:    data/motif_list_n45
    Ignored:    data/motif_list_n45.RDS
    Ignored:    data/multiqc_fastqc_run1.txt
    Ignored:    data/multiqc_fastqc_run2.txt
    Ignored:    data/multiqc_genestat_run1.txt
    Ignored:    data/multiqc_genestat_run2.txt
    Ignored:    data/my_hc_filt_counts.RDS
    Ignored:    data/my_hc_filt_counts_n45.RDS
    Ignored:    data/n45_bedfiles/
    Ignored:    data/n45_files
    Ignored:    data/other_papers/
    Ignored:    data/peakAnnoList_1.RDS
    Ignored:    data/peakAnnoList_2.RDS
    Ignored:    data/peakAnnoList_24_full.RDS
    Ignored:    data/peakAnnoList_24_n45.RDS
    Ignored:    data/peakAnnoList_3.RDS
    Ignored:    data/peakAnnoList_3_full.RDS
    Ignored:    data/peakAnnoList_3_n45.RDS
    Ignored:    data/peakAnnoList_4.RDS
    Ignored:    data/peakAnnoList_5.RDS
    Ignored:    data/peakAnnoList_6.RDS
    Ignored:    data/peakAnnoList_Eight.RDS
    Ignored:    data/peakAnnoList_full_motif.RDS
    Ignored:    data/peakAnnoList_n45_motif.RDS
    Ignored:    data/siglist_full.RDS
    Ignored:    data/siglist_n45.RDS
    Ignored:    data/summary_peakIDandReHeat.csv
    Ignored:    data/test.list.RDS
    Ignored:    data/testnames.txt
    Ignored:    data/toplist_6.RDS
    Ignored:    data/toplist_full.RDS
    Ignored:    data/toplist_full_DAR_6.RDS
    Ignored:    data/toplist_n45.RDS
    Ignored:    data/trimmed_seq_length.csv
    Ignored:    data/unclassified_full_set_peaks.RDS
    Ignored:    data/unclassified_n45_set_peaks.RDS
    Ignored:    data/xstreme/
    Ignored:    trimmed_Ind1_75DA24h_S7.nodup.splited.bam/

Untracked files:
    Untracked:  DOX_DAR_assess.Rmd
    Untracked:  EAR_2_plot.pdf
    Untracked:  ESR_1_plot.pdf
    Untracked:  Firstcorr plotATAC.pdf
    Untracked:  IND1_2_3_6_corrplot.pdf
    Untracked:  LR_3_plot.pdf
    Untracked:  NR_1_plot.pdf
    Untracked:  analysis/LFC_corr.Rmd
    Untracked:  analysis/ReHeat_analysis.Rmd
    Untracked:  analysis/TE_analysis_old.Rmd
    Untracked:  analysis/my_hc_filt_counts.csv
    Untracked:  analysis/nucleosome_explore.Rmd
    Untracked:  code/IGV_snapshot_code.R
    Untracked:  code/LongDARlist.R
    Untracked:  code/TSSE.R
    Untracked:  code/just_for_Fun.R
    Untracked:  code/toplist_assembly.R
    Untracked:  lcpm_filtered_corplot.pdf
    Untracked:  log2cpmfragcount.pdf
    Untracked:  output/cormotif_probability_45_list.csv
    Untracked:  output/cormotif_probability_all_6_list.csv
    Untracked:  splited/
    Untracked:  trimmed_Ind1_75DA24h_S7.nodup.fragment.size.distribution.pdf
    Untracked:  trimmed_Ind1_75DA3h_S1.nodup.fragment.size.distribution.pdf

Unstaged changes:
    Modified:   analysis/CorMotif_data_n45.Rmd
    Modified:   analysis/GO_KEGG_analysis.Rmd
    Modified:   analysis/Raodah.Rmd
    Modified:   analysis/Smaller_set_DAR.Rmd
    Modified:   analysis/TE_analysis.Rmd
    Modified:   analysis/final_four_analysis.Rmd
Note that any generated files, e.g. HTML, png, CSS, etc., are not included in this status report because it is ok for generated content to have uncommitted changes.
These are the previous versions of the repository in which changes were
made to the R Markdown (analysis/TE_analysis_ff.Rmd) and
HTML (docs/TE_analysis_ff.html) files. If you’ve configured
a remote Git repository (see ?wflow_git_remote), click on
the hyperlinks in the table below to view the files as they were in that
past version.
| File | Version | Author | Date | Message |
|---|---|---|---|---|
| Rmd | cc49b3b | reneeisnowhere | 2024-09-09 | updated with new peak file |
| Rmd | 6e09040 | reneeisnowhere | 2024-09-08 | updated with new peaks |
library(tidyverse)
library(kableExtra)
library(broom)
library(RColorBrewer)
library(ChIPseeker)
library("TxDb.Hsapiens.UCSC.hg38.knownGene")
library("org.Hs.eg.db")
library(rtracklayer)
library(edgeR)
library(ggfortify)
library(limma)
library(readr)
library(BiocGenerics)
library(gridExtra)
library(VennDiagram)
library(scales)
library(BiocParallel)
library(ggpubr)
library(devtools)
library(biomaRt)
library(eulerr)
library(smplot2)
library(genomation)
library(ggsignif)
library(plyranges)
library(ggrepel)
loading data
This is where I pull in the repeatmasker file taken from UCSC
genomebrowser, the peaks assigned with the closest expressed genes as
‘neargenes’ by TSS, the same peaks list, only condensing to unique peaks
(some are assigned to two neargene), I call the collapsed_peaks and the
peaks assigned to each MRC (EAR, etc…).
With the TSS data and the collapsed data, I made granges objects. I also
separate out the LINEs, SINEs, LTRs, DNAs, and Retroposons from the
repeatmasker to make granges objects from those sets.
repeatmasker <- read.delim("data/other_papers/repeatmasker.tsv")# TSS_NG_data <- read_delim("data/n45_bedfiles/TSS_NG_data.tsv",
# delim = "\t", escape_double = FALSE,
# trim_ws = TRUE)
# Collapsed_peaks <- read_delim("data/n45_bedfiles/TSS_NG_data_collapsed_peaks.tsv",
# delim = "\t",
# escape_double = FALSE,
# trim_ws = TRUE)
### With new TSS_ngdata frame
TSS_NG_data <- read_delim("data/Final_four_data/TSS_assigned_NG.txt",
delim = "\t", escape_double = FALSE,
trim_ws = TRUE)
Collapsed_peaks <- read_delim("data/Final_four_data/collapsed_new_peaks.txt",
delim = "\t",
escape_double = FALSE,
trim_ws = TRUE)
TSS_data_gr <- TSS_NG_data %>%
dplyr::filter(chr != "chrX") %>%
dplyr::filter(chr != "chrY") %>%
GRanges()
Col_TSS_data_gr <- Collapsed_peaks %>%
dplyr::filter(chr != "chrX") %>%
dplyr::filter(chr != "chrY") %>%
GRanges()
reClass_list <- repeatmasker %>%
distinct(repClass)
Line_repeats <- repeatmasker %>%
dplyr::filter(repClass == "LINE") %>%
makeGRangesFromDataFrame(., keep.extra.columns = TRUE, seqnames.field = "genoName", start.field = "genoStart", end.field = "genoEnd",starts.in.df.are.0based=TRUE)
Sine_repeats <- repeatmasker %>%
dplyr::filter(repClass == "SINE") %>%
makeGRangesFromDataFrame(., keep.extra.columns = TRUE, seqnames.field = "genoName", start.field = "genoStart", end.field = "genoEnd",starts.in.df.are.0based=TRUE)
LTR_repeats <- repeatmasker %>%
dplyr::filter(repClass == "LTR") %>%
makeGRangesFromDataFrame(., keep.extra.columns = TRUE, seqnames.field = "genoName", start.field = "genoStart", end.field = "genoEnd",starts.in.df.are.0based=TRUE)
DNA_repeats <- repeatmasker %>%
dplyr::filter(repClass == "DNA") %>%
makeGRangesFromDataFrame(., keep.extra.columns = TRUE, seqnames.field = "genoName", start.field = "genoStart", end.field = "genoEnd",starts.in.df.are.0based=TRUE)
retroposon_repeats <- repeatmasker %>%
dplyr::filter(repClass == "Retroposon") %>%
makeGRangesFromDataFrame(., keep.extra.columns = TRUE, seqnames.field = "genoName", start.field = "genoStart", end.field = "genoEnd",starts.in.df.are.0based=TRUE)
all_TEs_gr <- repeatmasker %>%
makeGRangesFromDataFrame(., keep.extra.columns = TRUE, seqnames.field = "genoName", start.field = "genoStart", end.field = "genoEnd",starts.in.df.are.0based=TRUE)
peakAnnoList_ff_motif <- readRDS("data/Final_four_data/peakAnnoList_ff_motif.RDS")
EAR_df <- as.data.frame(peakAnnoList_ff_motif$EAR)
# EAR_df_gr <- EAR_df %>% GRanges()
ESR_df <- as.data.frame(peakAnnoList_ff_motif$ESR)
# ESR_df_gr <-ESR_df %>% GRanges()
LR_df <- as.data.frame(peakAnnoList_ff_motif$LR)
# LR_df_gr <-LR_df %>% GRanges()
NR_df <- as.data.frame(peakAnnoList_ff_motif$NR)
# NR_df_gr <-NR_df %>% GRanges()this code contains the fill functions for each of the plots that needed similar colors.
# scale fill repeat, 2nd set ----------------------------------------------
rep_other_names<- repeatmasker %>%
  distinct(repClass) %>%
  rbind("Other")

scale_fill_repeat <-  function(...){
  ggplot2:::manual_scale(
    'fill',
    values = setNames(c( "#8DD3C7",
                         "#FFFFB3",
                         "#BEBADA" ,
                         "#FB8072",
                         "#80B1D3",
                         "#FDB462",
                         "#B3DE69",
                         "#FCCDE5",
                         "#D9D9D9",
                         "#BC80BD",
                         "#CCEBC5",
                         "pink4",
                         "cornflowerblue",
                         "chocolate",
                         "brown",
                         "green",
                         "yellow4",
                         "purple",
                         "darkorchid4",
                         "coral4",
                         "darkolivegreen4",
                         "darkorange",
                         "darkgrey"), unique(rep_other_names$repClass)),
    ...
  )
}


# scale fill LTRs ---------------------------------------------------------

LTR_df <- LTR_repeats %>%
  as.data.frame() %>%
  mutate(repFamily=factor(repFamily))


scale_fill_LTRs <-  function(...){
  ggplot2:::manual_scale(
    'fill',
    values = setNames(c( "#8DD3C7",
                         "#FFFFB3",
                         "#BEBADA" ,
                         "#FB8072",
                         "#80B1D3",
                         "#FDB462",
                         "#B3DE69",
                         "#FCCDE5",
                         "#D9D9D9",
                         "#BC80BD",
                         "#CCEBC5",
                         "pink4",
                         "cornflowerblue",
                         "chocolate",
                         "brown",
                         "green",
                         "yellow4",
                         "purple",
                         "darkorchid4",
                         "coral4",
                         "darkolivegreen4",
                         "darkorange"), unique(LTR_df$repFamily)),
    ...
  )
}


scale_fill_DNA_family <-  function(...){
  ggplot2:::manual_scale(
    'fill',
    values = setNames(c( "#8DD3C7", "#FFFFB3", "#BEBADA" ,"#FB8072", "#80B1D3", "#FDB462", "#B3DE69", "#FCCDE5", "purple4"), unique(DNA_family$repFamily)),
    ...
  )
}


# # scale fill repeat first -------------------------------------------------
#
# scale_fill_repeat <-  function(...){
#   ggplot2:::manual_scale(
#     'fill',
#     values = setNames(c( "#8DD3C7",
#                          "#FFFFB3",
#                          "#BEBADA" ,
#                          "#FB8072",
#                          "#80B1D3",
#                          "#FDB462",
#                          "#B3DE69",
#                          "#FCCDE5",
#                          "#D9D9D9",
#                          "#BC80BD",
#                          "#CCEBC5",
#                          "pink4",
#                          "cornflowerblue",
#                          "chocolate",
#                          "brown",
#                          "green",
#                          "yellow4",
#                          "purple",
#                          "darkorchid4",
#                          "coral4",
#                          "darkolivegreen4",
#                          "darkorange"), unique(repeatmasker$repClass)),
#     ...
#   )
# }

# scale lines -------------------------------------------------------------
Line_df <- Line_repeats %>%
  as.data.frame() %>%
  mutate(repFamily=factor(repFamily))


scale_fill_lines <-  function(...){
  ggplot2:::manual_scale(
    'fill',
    values = setNames(c( "#8DD3C7",
                         "#FFFFB3",
                         "#BEBADA" ,
                         "#FB8072",
                         "#80B1D3",
                         "#FDB462",
                         "#B3DE69",
                         "#FCCDE5",
                         "#D9D9D9",
                         "#BC80BD",
                         "#CCEBC5",
                         "pink4",
                         "cornflowerblue",
                         "chocolate",
                         "brown",
                         "green",
                         "yellow4",
                         "purple",
                         "darkorchid4",
                         "coral4",
                         "darkolivegreen4",
                         "darkorange"), unique(Line_df$repFamily)),
    ...
  )
}


# scale fill L2 family ----------------------------------------------------
L2_line_df<- Line_df %>%
  dplyr::filter(repFamily=="L2")


scale_fill_L2 <-  function(...){
  ggplot2:::manual_scale(
    'fill',
    values = setNames(c( "#8DD3C7",
                         "#FFFFB3",
                         "#BEBADA" ,
                         "#FB8072",
                         "#80B1D3",
                         "#FDB462",
                         "#B3DE69",
                         "#FCCDE5",
                         "#D9D9D9",
                         "#BC80BD",
                         "#CCEBC5",
                         "pink4",
                         "cornflowerblue",
                         "chocolate",
                         "brown",
                         "green",
                         "yellow4",
                         "purple",
                         "darkorchid4",
                         "coral4",
                         "darkolivegreen4",
                         "darkorange"), unique(L2_line_df$repName)),
    ...
  )
}

# scale fill sines --------------------------------------------------------
Sine_df <- Sine_repeats %>%
  as.data.frame() %>%
  mutate(repFamily=factor(repFamily))


scale_fill_sines <-  function(...){
  ggplot2:::manual_scale(
    'fill',
    values = setNames(c( "#8DD3C7",
                         "#FFFFB3",
                         "#BEBADA" ,
                         "#FB8072",
                         "#80B1D3",
                         "#FDB462",
                         "#B3DE69",
                         "#FCCDE5",
                         "#D9D9D9",
                         "#BC80BD",
                         "#CCEBC5",
                         "pink4",
                         "cornflowerblue",
                         "chocolate",
                         "brown",
                         "green",
                         "yellow4",
                         "purple",
                         "darkorchid4",
                         "coral4",
                         "darkolivegreen4",
                         "darkorange"), unique(Sine_df$repFamily)),
    ...
  )
}


# scale fill DNAs ---------------------------------------------------------
DNA_df <- DNA_repeats %>%
  as.data.frame() %>%
  mutate(repFamily=factor(repFamily))


scale_fill_DNAs <-  function(...){
  ggplot2:::manual_scale(
    'fill',
    values = setNames(c( "#8DD3C7",
                         "#FFFFB3",
                         "#BEBADA" ,
                         "#FB8072",
                         "#80B1D3",
                         "#FDB462",
                         "#B3DE69",
                         "#FCCDE5",
                         "#D9D9D9",
                         "#BC80BD",
                         "#CCEBC5",
                         "pink4",
                         "cornflowerblue",
                         "chocolate",
                         "brown",
                         "green",
                         "yellow4",
                         "purple",
                         "darkorchid4",
                         "coral4",
                         "darkolivegreen4",
                         "darkorange",
                         "blue",
                         "grey",
                         "lightgrey"), unique(DNA_df$repFamily)),
    ...
  )
}


# scale fill retroposons --------------------------------------------------

retroposon_df <- retroposon_repeats %>%
  as.data.frame() %>%
  mutate(repName=factor(repName))

scale_fill_retroposons <-  function(...){
  ggplot2:::manual_scale(
    'fill',
    values = setNames(c( "#8DD3C7",
                         "#FFFFB3",
                         "#BEBADA" ,
                         "#FB8072",
                         "#80B1D3",
                         "#FDB462",
                         "#B3DE69",
                         "#FCCDE5",
                         "#D9D9D9",
                         "#BC80BD",
                         "#CCEBC5",
                         "pink4",
                         "cornflowerblue",
                         "chocolate",
                         "brown",
                         "green",
                         "yellow4",
                         "purple",
                         "darkorchid4",
                         "coral4",
                         "darkolivegreen4",
                         "darkorange"), unique(retroposon_df$repName)),
    ...
  )
}
TE distrubution:
The code below uses the TE data sets to create dataframes that contain all peaks that overlap a TE. Additionally, I wanted to know size distribution of the overlaps(width) between TEs and my peaks, the size of the TEs and their size distribution, and the size distribution of my peaks. This was to determine a cutoff across TEs to minimize size bias. We used this data to apply a inclusion stringency cutoff for TEs of >50% of the full TE needed to be covered by a peak to call the peak “TE-containing”. In the plots, the median of each density distribution is shown by the dotted line.
all_TEs_gr %>%
  as.data.frame() %>%
  mutate(repClass=factor(repClass)) %>%
  dplyr::filter(repClass=="LINE") %>%
  ggplot(., aes(x=width))+
    geom_density(aes(fill=repClass, alpha = 0.5))+
  geom_vline(aes(xintercept = median(width)), linetype = 2)+
  theme_classic()+
  ggtitle("Distribution of lengths of all LINEs across human genome",subtitle = " limited x axis")+
  coord_cartesian(xlim= c(0,2500))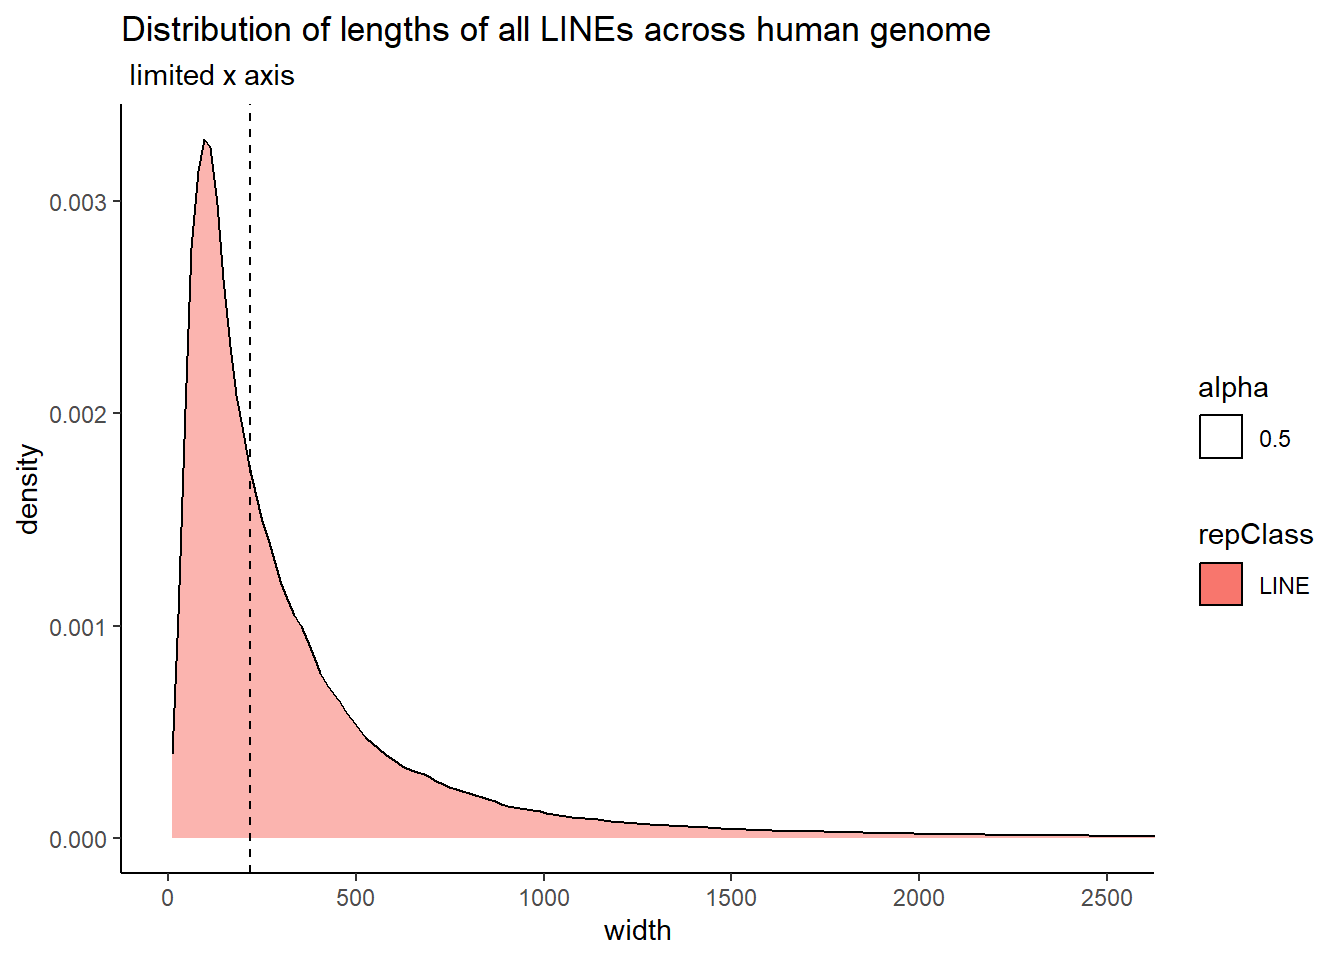
all_TEs_gr %>%
  as.data.frame() %>%
  mutate(repClass=factor(repClass)) %>%
  dplyr::filter(repClass=="SINE") %>%
  ggplot(., aes(x=width))+
    geom_density(aes(fill=repClass, alpha = 0.5))+
   geom_vline(aes(xintercept = median(width)), linetype = 2)+
  theme_classic()+
  ggtitle("Distribution of lengths of all SINEs across human genome")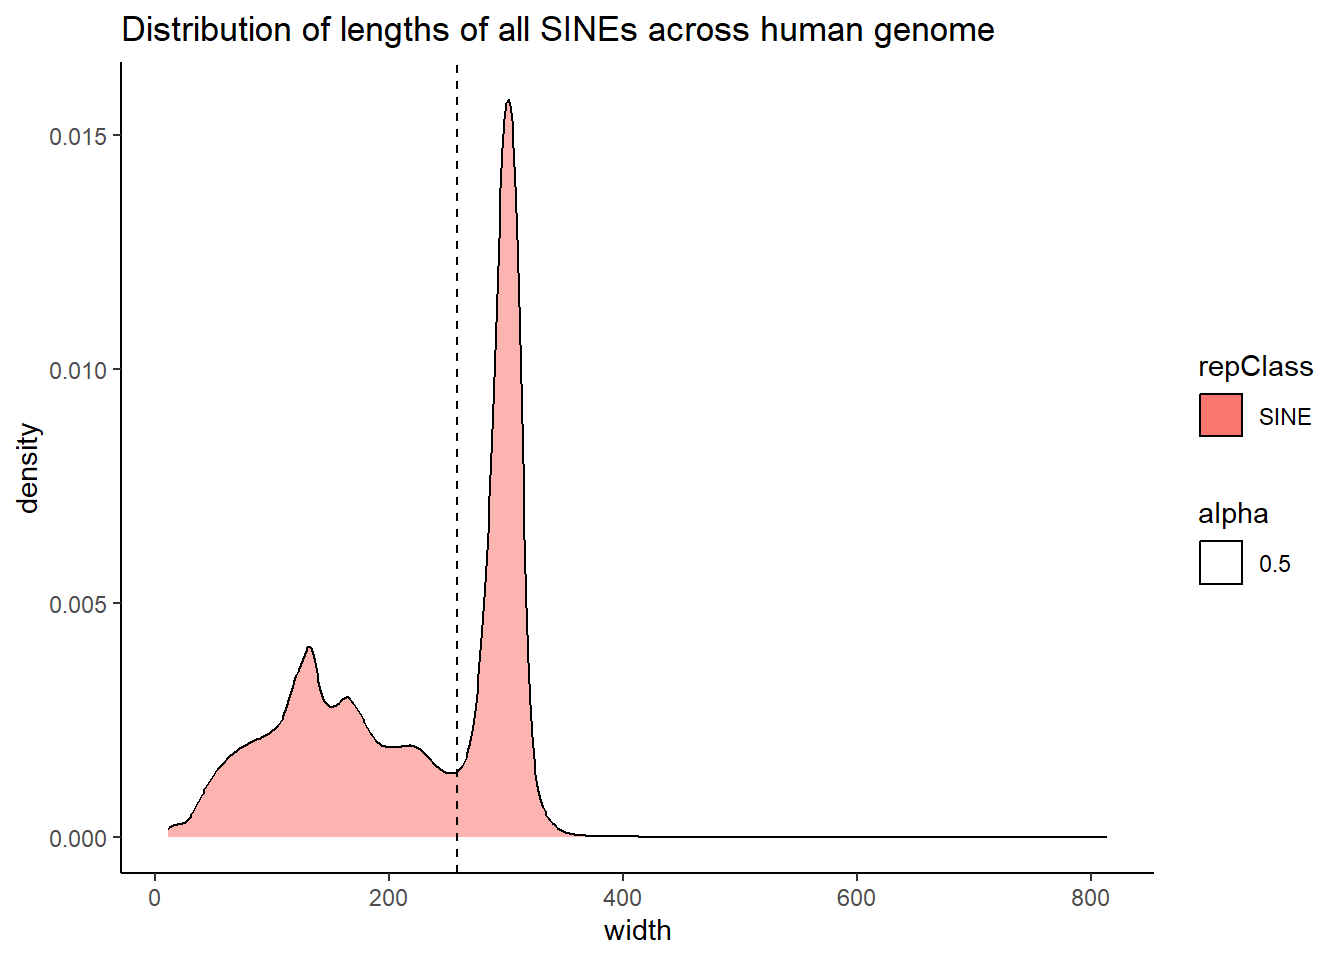
all_TEs_gr %>%
  as.data.frame() %>%
  mutate(repClass=factor(repClass)) %>%
  dplyr::filter(repClass=="LTR") %>%
  ggplot(., aes(x=width))+
    geom_density(aes(fill=repClass, alpha = 0.5))+
   geom_vline(aes(xintercept = median(width)), linetype = 2)+
  theme_classic()+
  ggtitle("Distribution of lengths of all LTRs across human genome",subtitle = " limited x axis")+
  coord_cartesian(xlim= c(0,2500))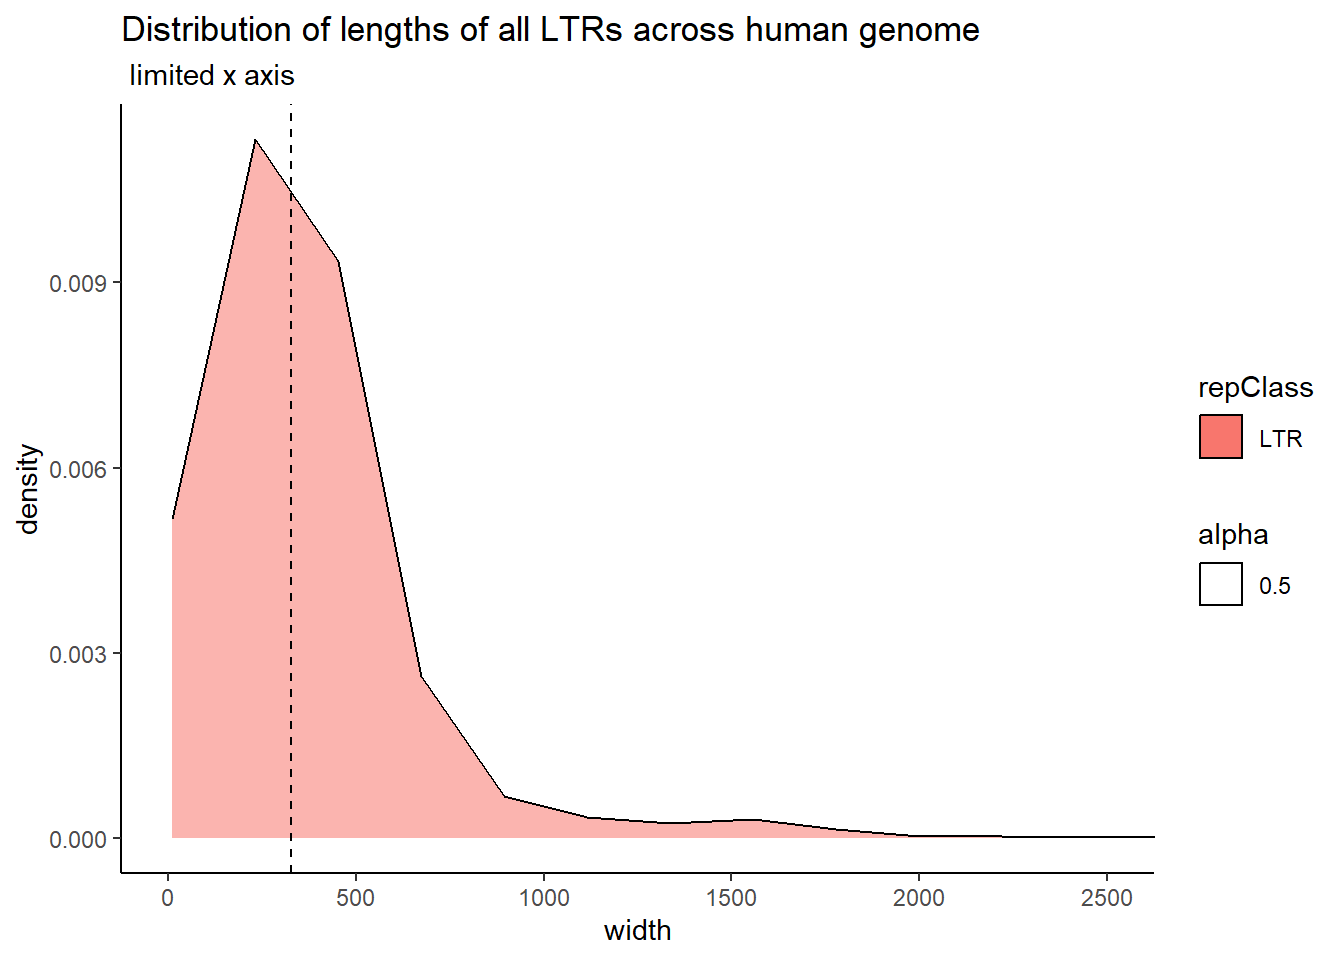
all_TEs_gr %>%
  as.data.frame() %>%
  mutate(repClass=factor(repClass)) %>%
  dplyr::filter(repClass=="DNA") %>%
  ggplot(., aes(x=width))+
    geom_density(aes(fill=repClass, alpha = 0.5))+
   geom_vline(aes(xintercept = median(width)), linetype = 2)+
  theme_classic()+
  ggtitle("Distribution of lengths of all DNA-TEs across human genome",subtitle = " limited x axis")+
  coord_cartesian(xlim= c(0,2500))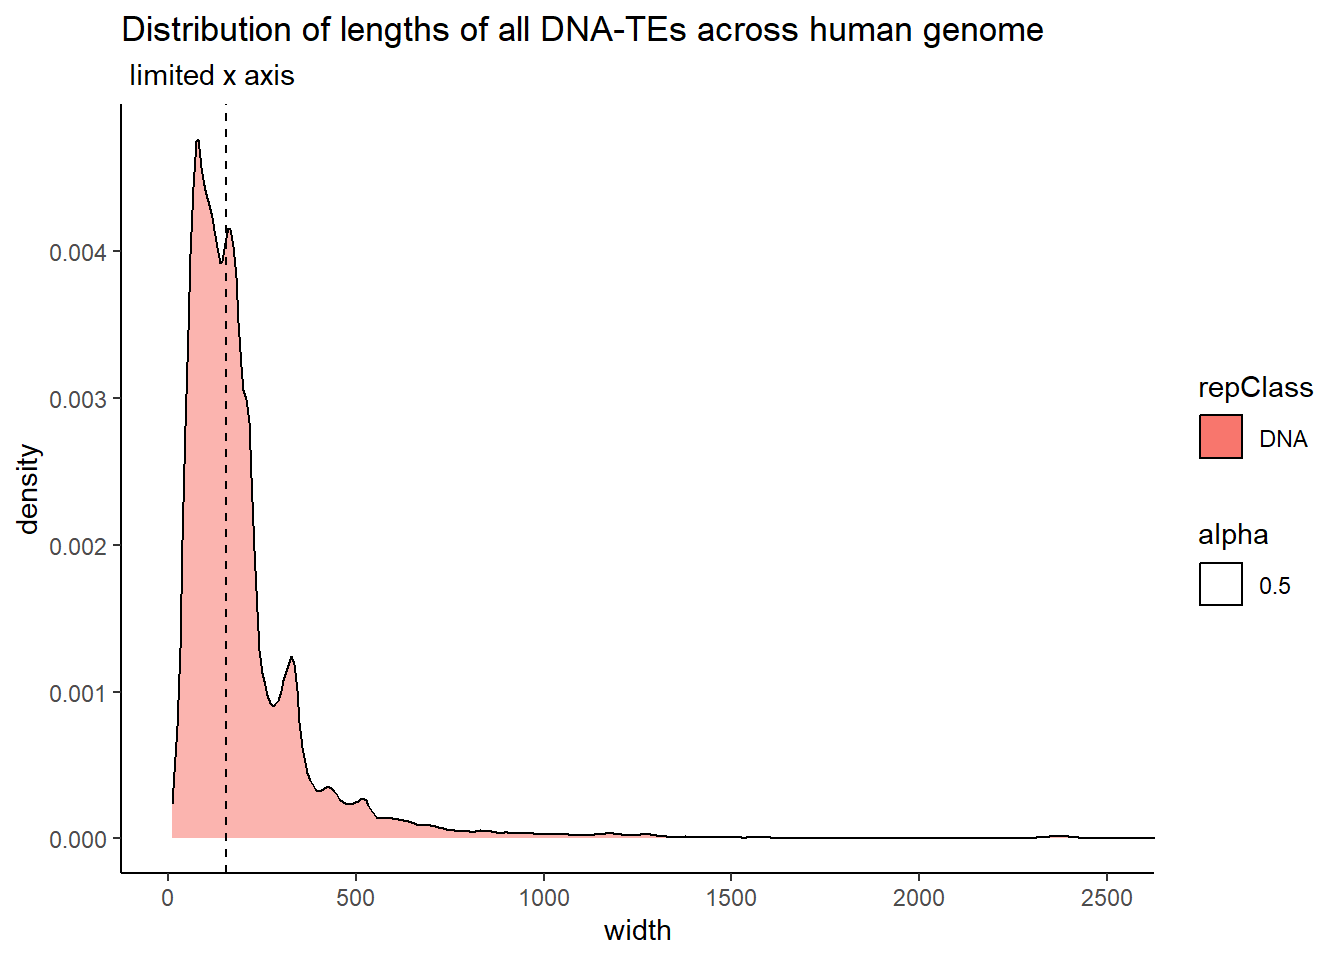
all_TEs_gr %>%
  as.data.frame() %>%
  mutate(repClass=factor(repClass)) %>%
  dplyr::filter(repClass=="Retroposon") %>%
  ggplot(., aes(x=width))+
    geom_density(aes(fill=repClass,alpha = 0.5))+
   geom_vline(aes(xintercept = median(width)), linetype = 2)+
  theme_classic()+
  ggtitle("Distribution of lengths of all Retroposons across human genome",subtitle = " limited x axis")+
   coord_cartesian(xlim= c(0,2500))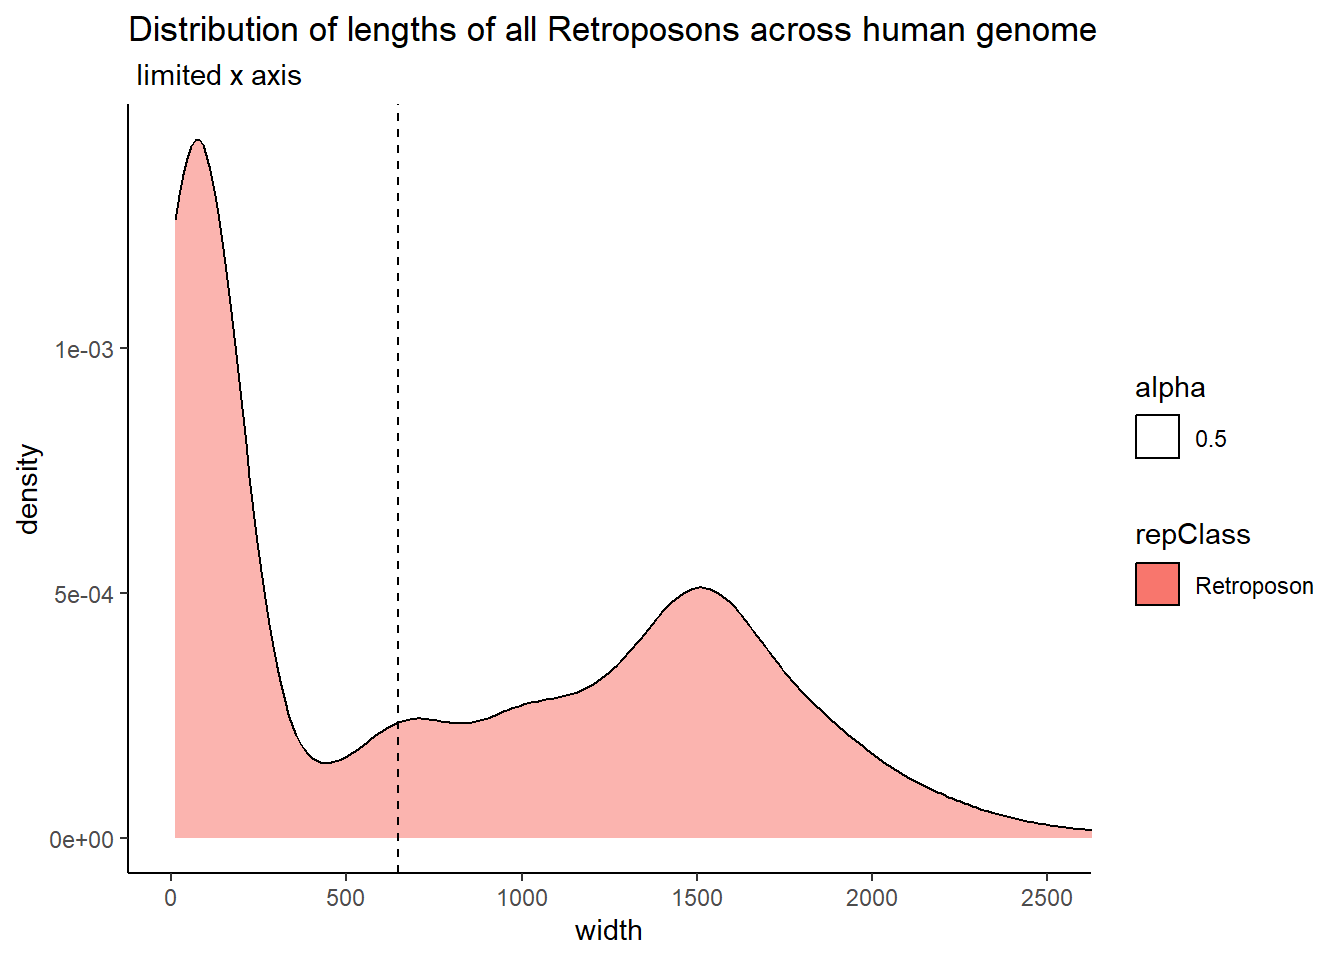
all_TEs_gr %>%
  as.data.frame() %>%
  dplyr::select(repClass, width) %>%
  # dplyr::filter(repClass=="LTR") %>%
  group_by(repClass) %>%
  summarise(med.width=median(width),mean.width=mean(width)) %>%
  kable(., caption="Table 1: Summary of mean and median length of each TE Class") %>%
  kable_paper("striped", full_width = TRUE) %>%
kable_styling(full_width = FALSE, font_size = 14)| repClass | med.width | mean.width |
|---|---|---|
| DNA | 155.0 | 210.61264 |
| DNA? | 125.0 | 137.59542 |
| LINE | 219.0 | 421.99752 |
| LTR | 329.0 | 371.36349 |
| LTR? | 170.0 | 208.63493 |
| Low_complexity | 44.0 | 61.55669 |
| RC | 171.0 | 210.89231 |
| RC? | 144.0 | 150.47242 |
| RNA | 165.0 | 163.94730 |
| Retroposon | 646.0 | 776.24171 |
| SINE | 258.0 | 221.43075 |
| SINE? | 83.5 | 74.34211 |
| Satellite | 496.0 | 8741.48243 |
| Simple_repeat | 36.0 | 55.83912 |
| Unknown | 119.0 | 136.70621 |
| rRNA | 86.0 | 140.04608 |
| scRNA | 99.0 | 96.07143 |
| snRNA | 77.5 | 79.82394 |
| srpRNA | 136.0 | 169.81834 |
| tRNA | 69.0 | 60.12893 |
Col_TSS_data_gr %>%
  as.data.frame %>%
   ggplot(., aes(x=width))+
    geom_density(color="darkblue",fill="lightblue",aes(alpha = 0.5))+
  geom_vline(data=Col_TSS_data_gr$width., aes(xintercept = median(width)), linetype = 2)+
  theme_classic()+
  ggtitle("Distribution of peak length (bps) across all experimentally derived peaks",subtitle = " limited x axis")+
  coord_cartesian(xlim= c(0,2500))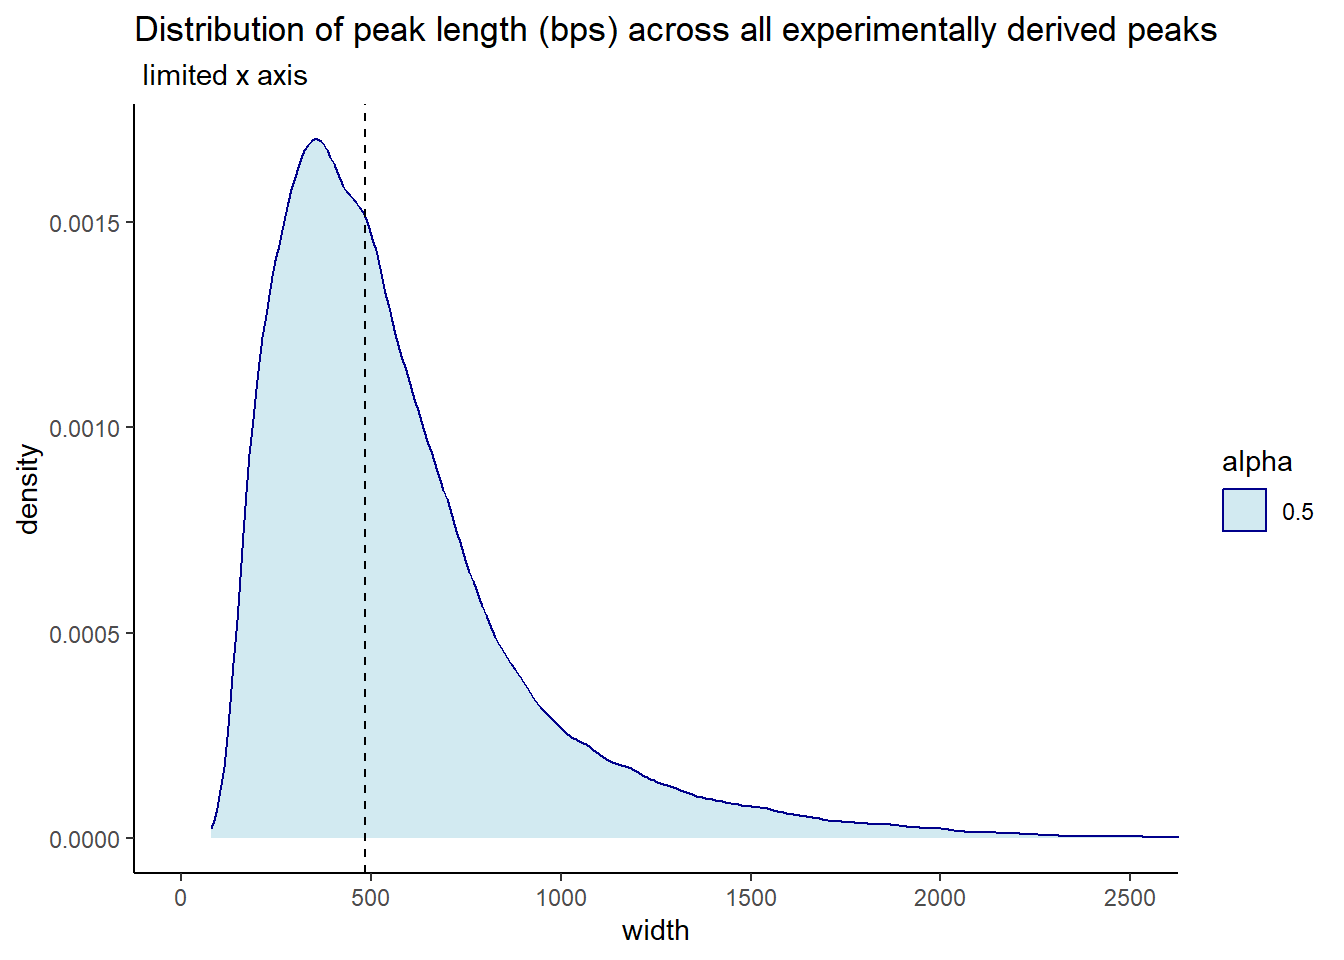
fullDF_overlap <- join_overlap_intersect(TSS_data_gr,all_TEs_gr)
fullDF_overlap %>%
  as.data.frame() %>%
  group_by(repClass) %>%
  tally %>%
  kable(., caption="Table 2: Count of peaks by TE class; overlap 1 bp or greater") %>%
  kable_paper("striped", full_width = TRUE) %>%
  kable_styling(full_width = FALSE, font_size = 14)

subsetByOverlaps(TSS_data_gr,all_TEs_gr) %>% as.data.frame %>%
   ggplot(., aes(x=width))+
    geom_density(color="darkblue",fill="lightblue",aes(alpha = 0.5))+
   geom_vline(aes(xintercept = median(width)), linetype = 2)+
  theme_classic()+
  ggtitle("Distribution of overlaps between all TEs and all my peaks",subtitle = " limited x axis")+
  coord_cartesian(xlim= c(0,2500))

### This is how I subset only those peaks who cover >50% of TEs
# hits <- findOverlaps(TSS_data_gr,all_TEs_gr)
# overlaps <- pintersect(TSS_data_gr[queryHits(hits)], all_TEs_gr[subjectHits(hits)])
# percentOverlap <- width(overlaps) / width(all_TEs_gr[subjectHits(hits)])
# hits <- hits[percentOverlap > 0.5]
# ### THis actually did not work well---I ended up losing data.  What I wanted was a data frame that had metadata from both the TE overlap and the peak metadata, so I could easily sort and manipulation.
# testingol <- TSS_data_gr[queryHits(hits)]
# testingol %>% as.data.frame() %>%
#   left_join(., (fullDF_overlap %>% as.data.frame(.)), by =c("seqnames"="seqnames","start"="start","end"="end","Peakid"="Peakid", "NG_start"="NG_start", "end_position"="end_position", "entrezgene_id"="entrezgene_id", "ensembl_gene_id"="ensembl_gene_id","dist_to_NG"="dist_to_NG", "width"="width", "strand"="strand", "hgnc_symbol" = "hgnc_symbol")) %>%
#   group_by(repClass) %>%
#   tally %>%
#   kable(., caption=" Table 3: Count of peaks by TE class; overlap> 50%") %>%
#   kable_paper("striped", full_width = TRUE) %>%
#   kable_styling(full_width = FALSE, font_size = 14)
The first dataframe to subset peaks that overlap >50% of a TE, was using the full neargene dataframe, where a peak is listed more than once because it was assigned more than one neargene ( one-to-many relationships). I changed the code to use the ‘collapsed’ data frame. This means the data frame was simplified to only include peaks one time, but those peaks that were assigned to more than one neargene had the assigned neargenes condensed and separated by a comma into the same column to create a one-to-one relationship dataframe. (yes, wordy I know)
######################################################
all_TEs_gr$TE_width <- width(all_TEs_gr)
Col_TSS_data_gr$peak_width <- width(Col_TSS_data_gr)
Col_fullDF_overlap <- join_overlap_intersect(Col_TSS_data_gr,all_TEs_gr)
Col_fullDF_overlap %>%
  as.data.frame() %>%
  group_by(repClass) %>%
  tally %>%
  kable(., caption=" Table 2: Count of peaks by TE class; overlap at least 1 bp; using one:one df ") %>%
  kable_paper("striped", full_width = TRUE) %>%
kable_styling(full_width = FALSE, font_size = 14)| repClass | n |
|---|---|
| DNA | 17644 |
| DNA? | 142 |
| LINE | 42686 |
| LTR | 29738 |
| LTR? | 269 |
| Low_complexity | 5634 |
| RC | 53 |
| RC? | 8 |
| RNA | 28 |
| Retroposon | 432 |
| SINE | 54916 |
| SINE? | 1 |
| Satellite | 223 |
| Simple_repeat | 29872 |
| Unknown | 301 |
| rRNA | 57 |
| scRNA | 33 |
| snRNA | 146 |
| srpRNA | 45 |
| tRNA | 307 |
Col_fullDF_overlap %>%
   as.data.frame %>%
  mutate(per_ol= width/TE_width) %>%
  dplyr::filter(per_ol>0.5) %>%
  group_by(repClass) %>%
  tally() %>%
  kable(., caption=" Table 3:Count of peaks by TE class; overlap of >50% of TE; newway ") %>%
  kable_paper("striped", full_width = TRUE) %>%
kable_styling(full_width = FALSE, font_size = 14)| repClass | n |
|---|---|
| DNA | 12026 |
| DNA? | 119 |
| LINE | 26250 |
| LTR | 18929 |
| LTR? | 205 |
| Low_complexity | 5203 |
| RC | 41 |
| RC? | 6 |
| RNA | 22 |
| Retroposon | 86 |
| SINE | 32920 |
| SINE? | 1 |
| Satellite | 80 |
| Simple_repeat | 27756 |
| Unknown | 248 |
| rRNA | 46 |
| scRNA | 27 |
| snRNA | 126 |
| srpRNA | 30 |
| tRNA | 296 |
Filter_TE_list <- Col_fullDF_overlap %>%
   as.data.frame %>%
  mutate(per_ol= width/TE_width)
  # dplyr::filter(per_ol>0.5)

Unique_peak_overlap <- Col_fullDF_overlap %>%
  as.data.frame() %>%
  distinct(Peakid)

peak_overlap_50unique <-  Filter_TE_list %>%
   dplyr::filter(per_ol>0.5) %>%
  distinct(Peakid)
Note that the counts of peaks total to more than the total number of peaks that overlap a TE because many peaks overlap multiple elements (generally the very small TEs).
A summary of numbers of peaks is below:
- Total number of peaks = 172481
- Total number of peaks overlapping at least 1 TE = 110200
- Total number of peaks overlapping by >50% TE length = 83727
note these numbers include peaks that are not classified by an MRC.
Tables 4 and 5 above used the “new” way of sub-setting (keeping all metadata organized vs the sub-setting code I found on the internet). Just to verify the numbers were the same, I ran the data using the old method and compared the numbers. They are identical (Table 6) to each other. Success!
Distribution of TE overlaps by peaks according to class
Below are plots of the distribution of overlapping widths between peaks and TEs. The first plot is all TE Class, and the 2nd plot limits the classes to LINEs, SINEs, LTRs, DNAs, and Retroposons.
Col_fullDF_overlap %>%
  as.data.frame %>%
  ggplot(., aes(x=width, fill=repClass))+
    geom_density(color="darkblue",aes(alpha = 0.5))+
  theme_classic()+
  ggtitle("Distribution of all overlapping widths in my data",subtitle = " limited x axis")+
  coord_cartesian(xlim= c(0,750))+
  scale_fill_repeat()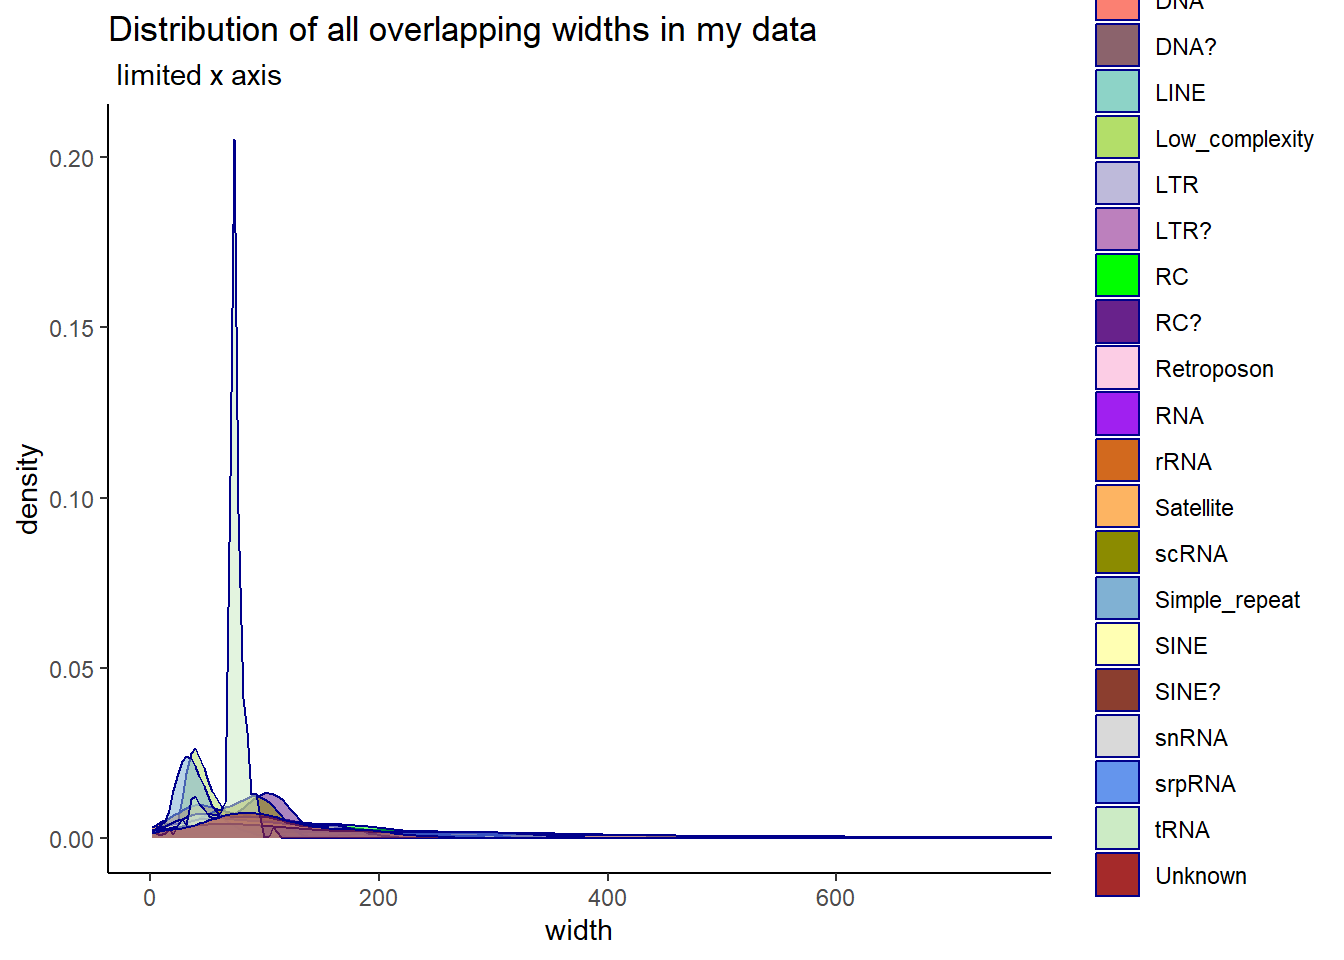
Col_fullDF_overlap %>%
  as.data.frame %>%
  dplyr::filter(repClass=="LINE"|repClass=="SINE"|repClass =="LTR"|repClass=="DNA"|repClass =="Retroposon") %>%
  ggplot(., aes(x=width, fill=repClass))+
    geom_density(color="darkblue",aes(alpha = 0.5))+
  theme_classic()+
  ggtitle("Distribution of all overlapping peak-TE widths",subtitle = "Just LINE, SINE,LTR, DNA, Retroposons; limited x axis")+
  coord_cartesian(xlim= c(0,1550))+
  scale_fill_repeat()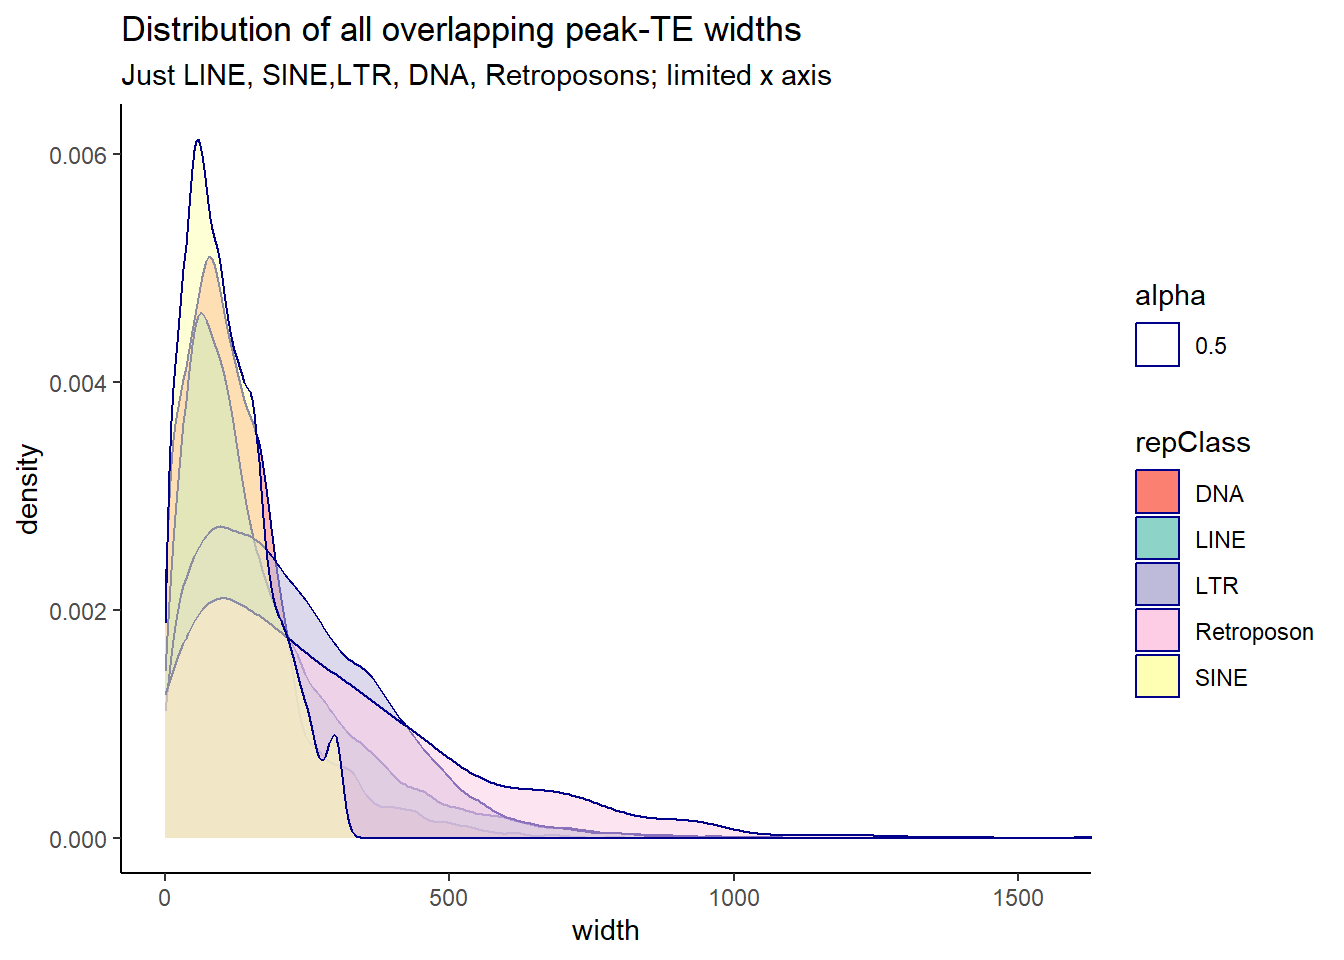
Peak_TE_overlapbreakdown <- Col_TSS_data_gr %>% as.data.frame %>%
  distinct(Peakid) %>%
  left_join(.,(Col_fullDF_overlap %>% as.data.frame)) %>%
   mutate(TEstatus=if_else(is.na(repClass),"not_TE_peak","TE_peak")) %>%
   mutate(mrc=if_else(Peakid %in% EAR_df$Peakid, "EAR",
                     if_else(Peakid %in% ESR_df$Peakid,"ESR",
                             if_else(Peakid %in% LR_df$Peakid,"LR",
                                     if_else(Peakid %in% NR_df$Peakid,"NR","not_mrc"))))) %>%  mutate(per_ol= width/TE_width)


TE_mrc_status_list <- Peak_TE_overlapbreakdown %>%
      dplyr::select(Peakid,repName,repClass,repFamily,width,TEstatus, mrc, per_ol)


 Peak_TE_overlapbreakdown %>%
   dplyr::select(Peakid,repName,repClass,repFamily,width,TEstatus, mrc, per_ol) %>%
   ### adding a line to only show single peaks
   distinct(Peakid, .keep_all = TRUE) %>%
   mutate(mrc="all_peaks") %>%
   rbind((TE_mrc_status_list %>%
            ### adding a line to only show single peaks
            distinct(Peakid, .keep_all = TRUE))) %>%
   mutate(repClass=factor(repClass)) %>%
   mutate(TEstatus=factor(TEstatus, levels = c("TE_peak","not_TE_peak")))%>%
   dplyr::filter(mrc != "not_mrc") %>%
  mutate(mrc=factor(mrc, levels = c("EAR","ESR", "LR", "NR","all_peaks"))) %>%
     ggplot(., aes(x=mrc, fill= TEstatus))+
  geom_bar(position="fill", col="black")+
   theme_classic()+
  ggtitle(paste("TE status by MRC and Family","all"))
TE_mrc_status_list %>%
   dplyr::select(Peakid,repName,repClass,repFamily,width,TEstatus, mrc, per_ol) %>%
   distinct(Peakid, .keep_all = TRUE) %>%
   mutate(mrc="all_peaks") %>%
   rbind((TE_mrc_status_list %>% distinct(Peakid, .keep_all = TRUE))) %>%
   mutate(repClass=factor(repClass)) %>%
   mutate(TEstatus=factor(TEstatus, levels = c("TE_peak","not_TE_peak")))%>%
   dplyr::filter(mrc != "not_mrc") %>%
  mutate(mrc=factor(mrc, levels = c("EAR","ESR", "LR", "NR","all_peaks"))) %>%
     group_by(mrc, TEstatus) %>%
     count() %>%
     pivot_wider(., id_cols = mrc, names_from = TEstatus, values_from = n) %>%
     rowwise() %>%
     mutate(summary= sum(c_across(TE_peak:not_TE_peak))) %>%
     ungroup() %>%
     pivot_longer(., cols= c(TE_peak, not_TE_peak), names_to = c("TEstatus"), values_to = "n") %>%
     mutate(percent_mrc= n/summary*100) %>%
      kable(., caption="Table 7: Summary of peak numbers overlapping and not overlapping TEs by each basic MRC.") %>%
  kable_paper("striped", full_width = TRUE) %>%
  kable_styling(full_width = FALSE, font_size = 14)
The plots below represent numbers when I include the >50% stringency cutoff filter.
per_cov=0.5

Peak_TE_overlapbreakdown %>%
   dplyr::select(Peakid,repName,repClass,repFamily,width,TEstatus, mrc, per_ol) %>%
    distinct(Peakid, .keep_all = TRUE) %>%
   mutate(mrc="all_peaks") %>%
   rbind((TE_mrc_status_list %>%  distinct(Peakid, .keep_all = TRUE))) %>%
   mutate(repClass=factor(repClass)) %>%
   mutate(TEstatus=factor(TEstatus, levels = c("TE_peak","not_TE_peak")))%>%
   dplyr::filter(mrc != "not_mrc") %>%
  mutate(mrc=factor(mrc, levels = c("EAR","ESR", "LR", "NR","all_peaks"))) %>%
   dplyr::filter(per_ol>per_cov| is.na(per_ol)) %>%
   ggplot(., aes(x=mrc, fill= TEstatus))+
  geom_bar(position="fill", col="black")+
  theme_classic()+
  ggtitle(paste("TE status by MRC and Family",">",per_cov*100,"% covered"))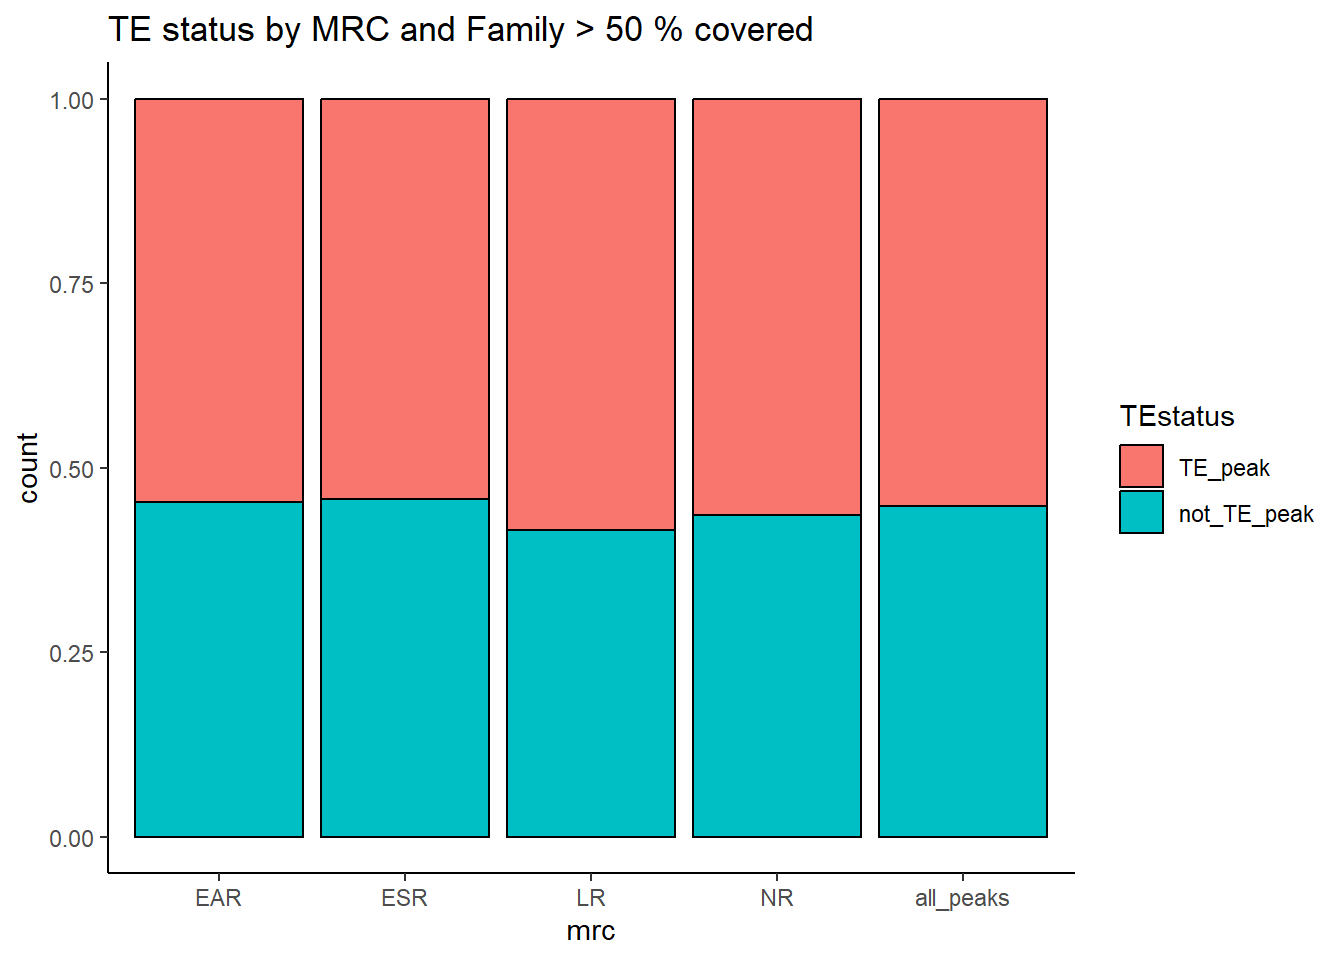
   TE_mrc_status_list %>%
  distinct(Peakid, .keep_all = TRUE) %>%
   mutate(mrc="all_peaks") %>%
   rbind((TE_mrc_status_list %>%  distinct(Peakid, .keep_all = TRUE))) %>%
   mutate(repClass=factor(repClass)) %>%
   mutate(TEstatus=factor(TEstatus, levels = c("TE_peak","not_TE_peak")))%>%
   dplyr::filter(mrc != "not_mrc") %>%
  mutate(mrc=factor(mrc, levels = c("EAR","ESR", "LR", "NR","all_peaks"))) %>%
      dplyr::filter(per_ol>per_cov| is.na(per_ol)) %>%
     group_by(mrc, TEstatus) %>%
     count() %>%
     pivot_wider(., id_cols = mrc, names_from = TEstatus, values_from = n) %>%
     rowwise() %>%
     mutate(summary= sum(c_across(TE_peak:not_TE_peak))) %>%
     ungroup() %>%
     pivot_longer(., cols= c(TE_peak, not_TE_peak), names_to = c("TEstatus"), values_to = "n") %>%
     mutate(percent_mrc= n/summary*100) %>%
      kable(., caption="Table 8: Summary of peak numbers overlapping and not overlapping TEs by each basic MRC using strigency cutoff of 50%.") %>%
  kable_paper("striped", full_width = TRUE) %>%
kable_styling(full_width = FALSE, font_size = 14)| mrc | summary | TEstatus | n | percent_mrc |
|---|---|---|---|---|
| EAR | 5552 | TE_peak | 3033 | 54.62896 |
| EAR | 5552 | not_TE_peak | 2519 | 45.37104 |
| ESR | 11795 | TE_peak | 6396 | 54.22637 |
| ESR | 11795 | not_TE_peak | 5399 | 45.77363 |
| LR | 31116 | TE_peak | 18174 | 58.40725 |
| LR | 31116 | not_TE_peak | 12942 | 41.59275 |
| NR | 63846 | TE_peak | 35983 | 56.35905 |
| NR | 63846 | not_TE_peak | 27863 | 43.64095 |
| all_peaks | 125700 | TE_peak | 69366 | 55.18377 |
| all_peaks | 125700 | not_TE_peak | 56334 | 44.81623 |
Human genome TE breakdown
I first wanted to know the distribution of TEs across the human genome compared to each other. Below are pie plots with all classes from repeatmasker, and then pie plots with ONLY the LINES, SINES, LTRs, DNAs, and Retroposon classes.
repeatmasker  %>%
   mutate(repClass=factor(repClass)) %>%
count(repClass) %>%
   mutate(perc= n/sum(n)) %>%
   arrange(desc(n)) %>%
  mutate(repClass = fct_rev(fct_inorder(repClass))) %>%
  mutate(text_y = cumsum(n) - n/2) %>%
   ggplot(., aes(x = "", y = n, fill = repClass)) +
  geom_col(color = "black") +
  coord_polar(theta = "y", start = 0)+
  geom_label_repel(aes(label = paste0(repClass,"\n",sprintf("%.2f",perc*100),"%")),
                     position = position_stack(vjust = .5),
                     force=.9,show.legend = FALSE,max.overlaps = 35) +
  theme_void()+
  ggtitle("Human genome TE breakdown", subtitle=paste(length(repeatmasker$milliIns)))+
  scale_fill_repeat()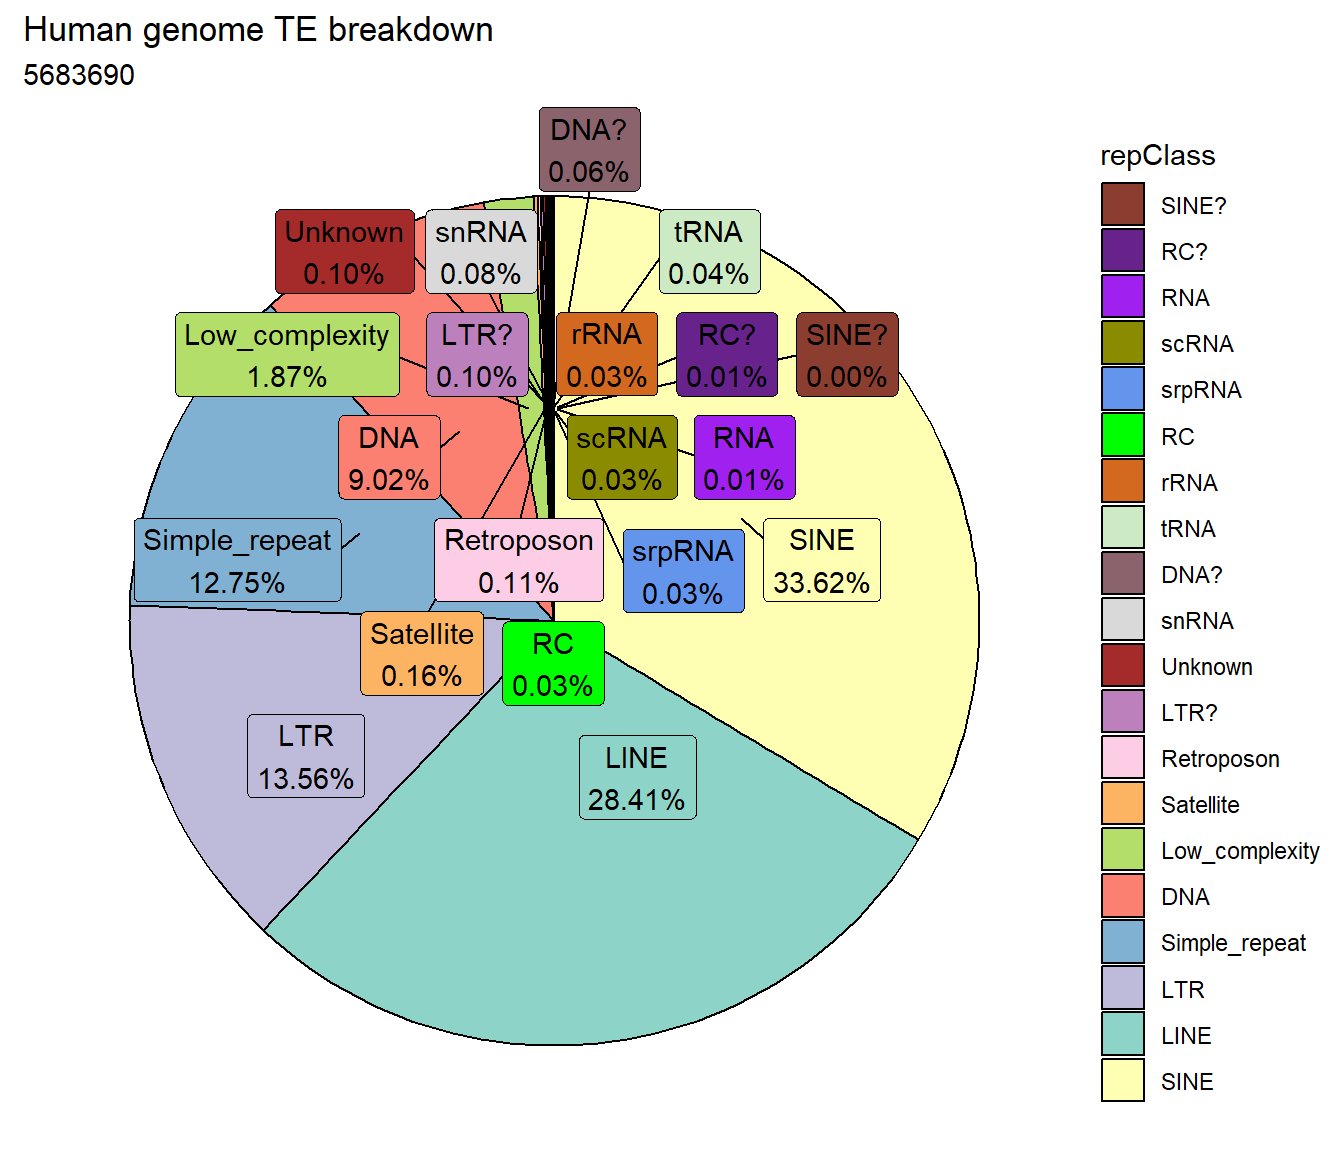
LiSiLTDNRe <- repeatmasker %>%
  dplyr::filter(repClass=="LINE"|repClass=="SINE"|repClass=="LTR"|repClass=="DNA"|repClass=="Retroposon")


repeatmasker  %>%
   mutate(repClass=factor(repClass)) %>%
  dplyr::filter(repClass=="LINE"|repClass=="SINE"|repClass=="LTR"|repClass=="DNA"|repClass=="Retroposon") %>%
count(repClass) %>%
   mutate(perc= n/sum(n)) %>%
   arrange(desc(n)) %>%
  mutate(repClass = fct_rev(fct_inorder(repClass))) %>%
  mutate(text_y = cumsum(n) - n/2) %>%
   ggplot(., aes(x = "", y = n, fill = repClass)) +
  geom_col(color = "black") +
  coord_polar(theta = "y", start = 0)+
  geom_label_repel(aes(label = paste0(repClass,"\n",sprintf("%.2f",perc*100),"%")),
                     position = position_stack(vjust = .5),
                     force=.9,show.legend = FALSE,max.overlaps = 35) +
  theme_void()+
  ggtitle("Human genome TE breakdown LINE/SINE/LTR/DNA/Retroposon only", subtitle=paste(length(LiSiLTDNRe$milliIns)))+
  scale_fill_repeat()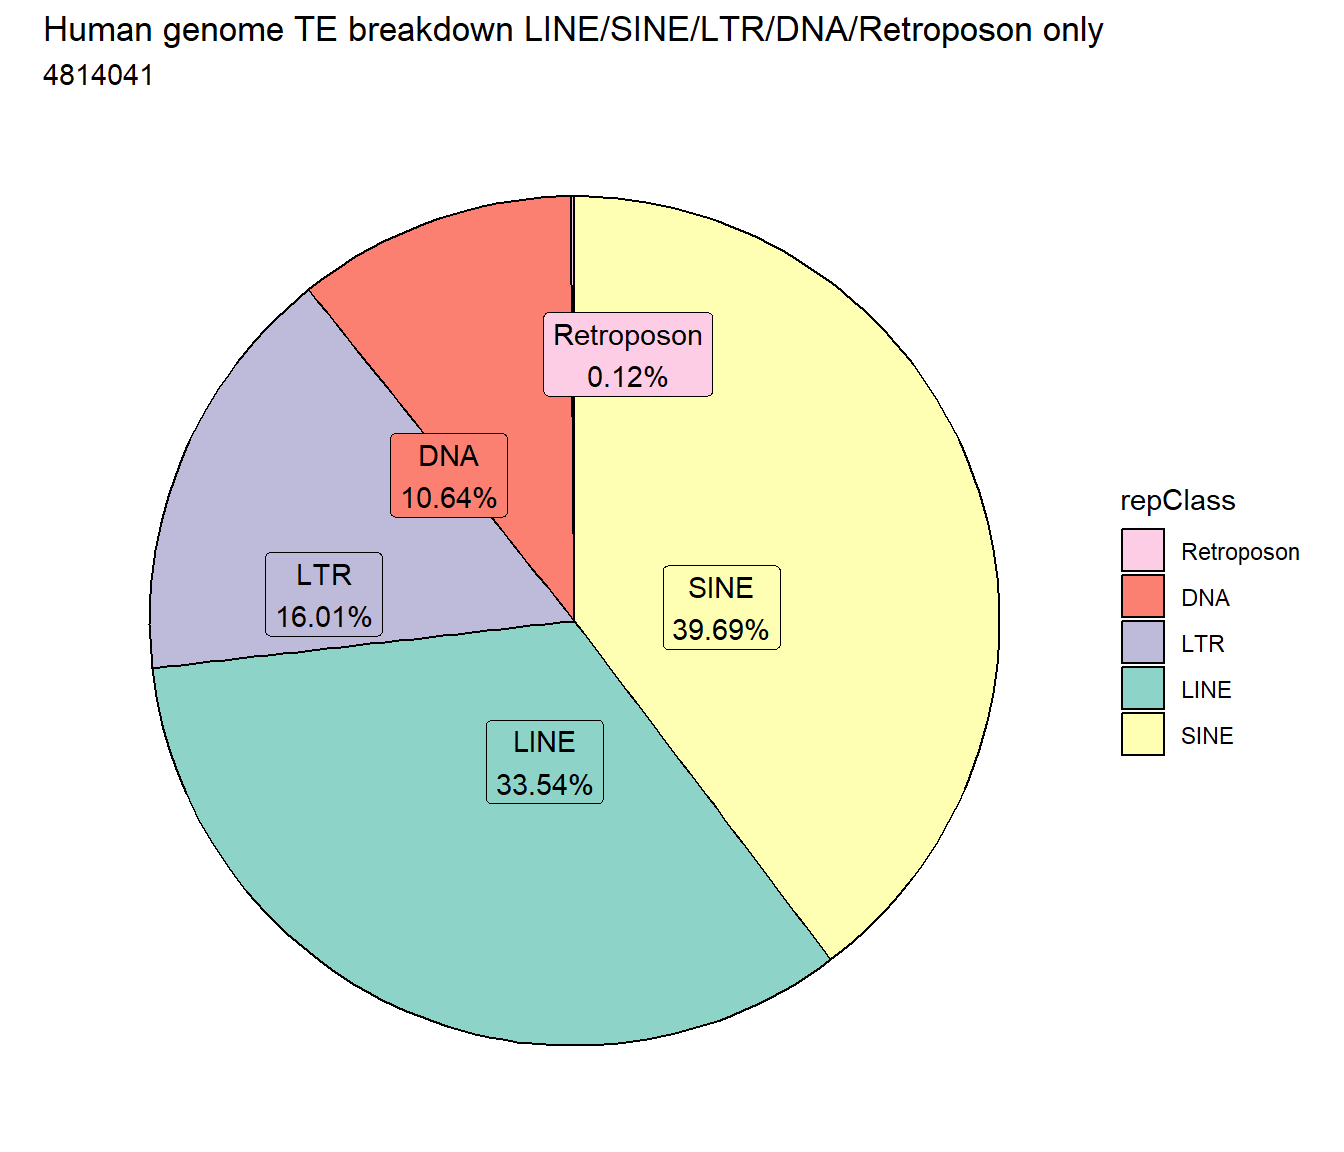
repeatmasker  %>%
  mutate(repClass_org=repClass) %>%
   mutate(repClass=factor(repClass)) %>%
   mutate(repClass=if_else(##relable repClass with other
    repClass_org=="LINE", repClass_org,
    if_else(repClass_org=="SINE",repClass_org,
            if_else(repClass_org=="LTR", repClass_org,
                    if_else(repClass_org=="DNA", repClass_org,                            if_else(repClass_org=="Retroposon",repClass_org,"Other")))))) %>%
  # dplyr::filter(repClass=="LINE"|repClass=="SINE"|repClass=="LTR"|repClass=="DNA"|repClass=="Retroposon") %>%
count(repClass) %>%
   mutate(perc= n/sum(n)) %>%
   arrange(desc(n)) %>%
  mutate(repClass = fct_rev(fct_inorder(repClass))) %>%
  mutate(text_y = cumsum(n) - n/2) %>%
   ggplot(., aes(x = "", y = n, fill = repClass)) +
  geom_col(color = "black") +
  coord_polar(theta = "y", start = 0)+
  geom_label_repel(aes(label = paste0(repClass,"\n",sprintf("%.2f",perc*100),"%")),
                     position = position_stack(vjust = .5),
                     force=.9,show.legend = FALSE,max.overlaps = 35) +
  theme_void()+
  ggtitle("Human genome TE breakdown LINE/SINE/LTR/DNA/Retroposon focused with other", subtitle=paste(length(repeatmasker$milliIns)))+
  scale_fill_repeat()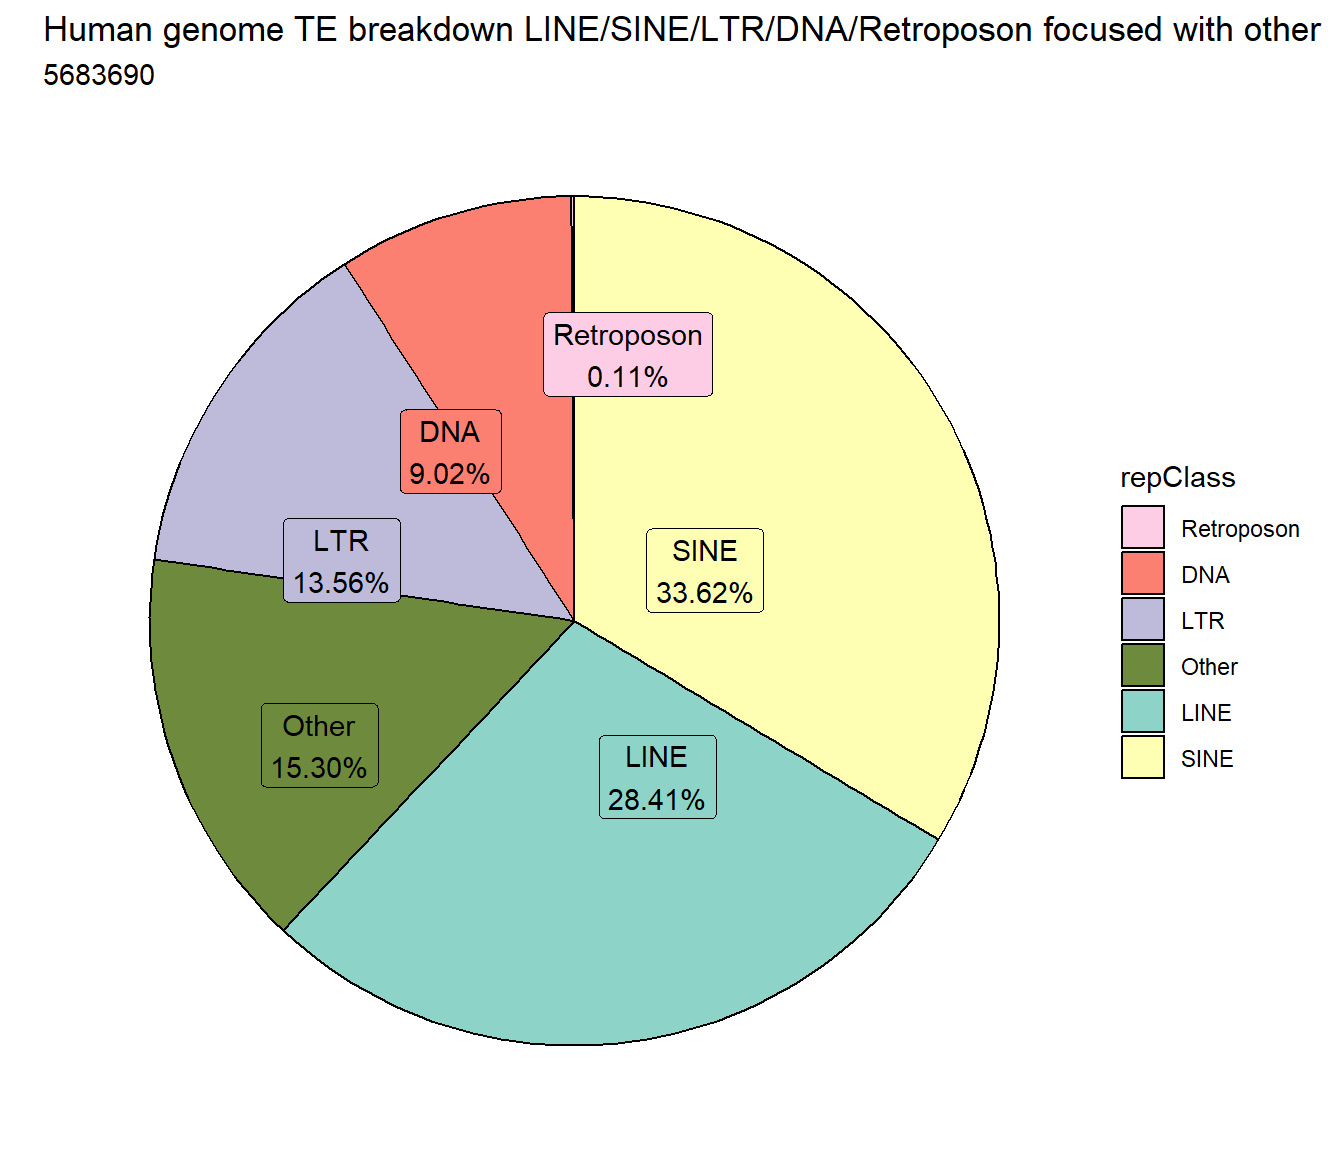
# saveRDS(TE_mrc_status_list,"data/TE_info/TE_mrc_status_list.RDS")
TE_ALL_count <- TE_mrc_status_list %>%
  dplyr::filter(TEstatus =="TE_peak") %>%
  dplyr::filter(mrc!="not_mrc") %>%
  distinct(Peakid) %>%
    count
TE_ALL_count_filt <- TE_mrc_status_list %>%
  dplyr::filter(repClass=="LINE"|repClass=="SINE"|repClass=="LTR"|repClass=="DNA"|repClass=="Retroposon") %>%
  dplyr::filter(TEstatus =="TE_peak") %>%
  dplyr::filter(mrc!="not_mrc") %>%
  distinct(Peakid) %>%
    count
TE_50_count <- TE_mrc_status_list %>%
  # distinct() %>%
  dplyr::filter(per_ol>per_cov) %>%
  dplyr::filter(TEstatus =="TE_peak") %>%
  dplyr::filter(mrc!="not_mrc") %>%
  distinct(Peakid) %>%
    count
TE_50_count_filt <- TE_mrc_status_list %>%
  dplyr::filter(repClass=="LINE"|repClass=="SINE"|repClass=="LTR"|repClass=="DNA"|repClass=="Retroposon") %>%
  dplyr::filter(per_ol>per_cov) %>%
  dplyr::filter(TEstatus =="TE_peak") %>%
  dplyr::filter(mrc!="not_mrc") %>%
  distinct(Peakid) %>%
    count


TE_mrc_status_list %>%
   mutate(repClass=factor(repClass)) %>%
   # group_by(repClass) %>%
  dplyr::filter(TEstatus =="TE_peak") %>%
   count(repClass) %>%
  mutate(perc= n/sum(n)) %>%
   arrange(desc(n)) %>%
  mutate(repClass = fct_rev(fct_inorder(repClass))) %>%
  mutate(text_y = cumsum(n) - n/2) %>%
  ggplot(., aes(x = "", y = n, fill = repClass)) +
  geom_col(color = "black") +
  coord_polar(theta = "y", start = 0)+
   geom_label_repel(aes(label = paste0(repClass,"\n",sprintf("%.2f",perc*100),"%")),
                     position = position_stack(vjust = .5),
                     force=.9,show.legend = FALSE,max.overlaps = 35) +
  theme_void()+
  ggtitle("TE breakdown of all peaks",subtitle = paste(TE_ALL_count$n))+
  scale_fill_repeat()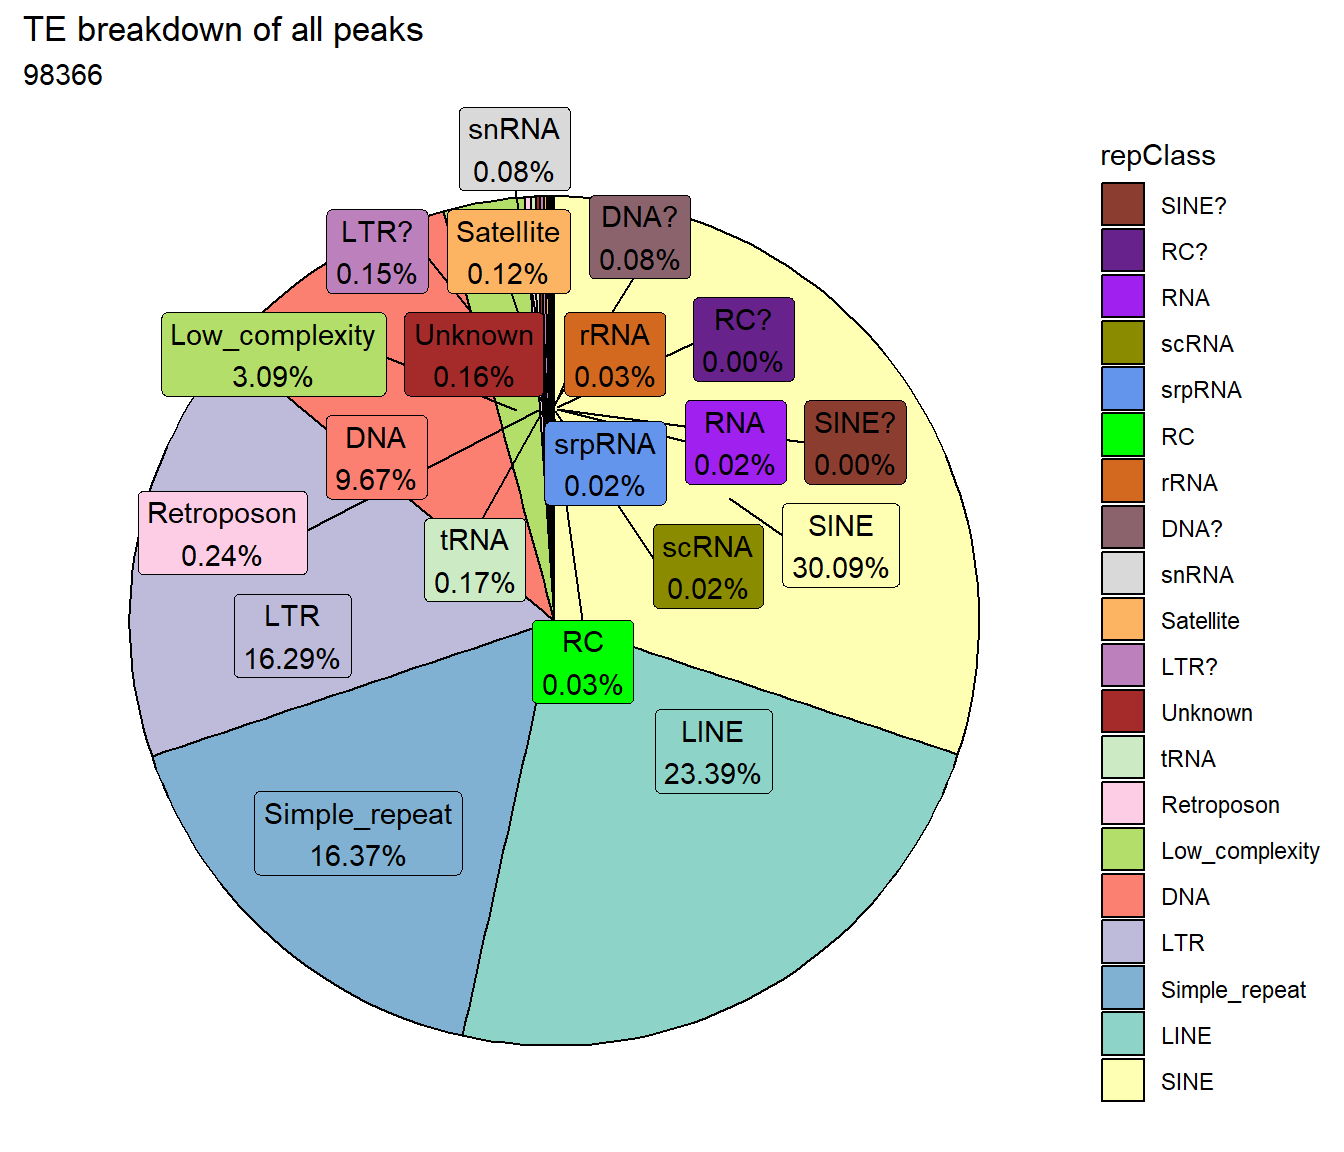
TE_mrc_status_list %>%
   mutate(repClass=factor(repClass)) %>%
   dplyr::filter(repClass=="LINE"|repClass=="SINE"|repClass=="LTR"|repClass=="DNA"|repClass=="Retroposon") %>%
  # group_by(repClass) %>%
  dplyr::filter(TEstatus =="TE_peak") %>%
   count(repClass) %>%
  mutate(perc= n/sum(n)) %>%
   arrange(desc(n)) %>%
  mutate(repClass = fct_rev(fct_inorder(repClass))) %>%
  mutate(text_y = cumsum(n) - n/2) %>%
  ggplot(., aes(x = "", y = n, fill = repClass)) +
  geom_col(color = "black") +
  coord_polar(theta = "y", start = 0)+
   geom_label_repel(aes(label = paste0(repClass,"\n",sprintf("%.2f",perc*100),"%")),
                     position = position_stack(vjust = .5),
                     force=.9,show.legend = FALSE,max.overlaps = 35)+
  # geom_label_repel(aes(label = paste(n,"\n", repClass)),
  #                    position = position_stack(vjust = .3),
  #                    show.legend = FALSE,max.overlaps = 50) +
  theme_void()+
  ggtitle("TE breakdown of all peaks",subtitle = paste(TE_ALL_count_filt$n))+
  scale_fill_repeat()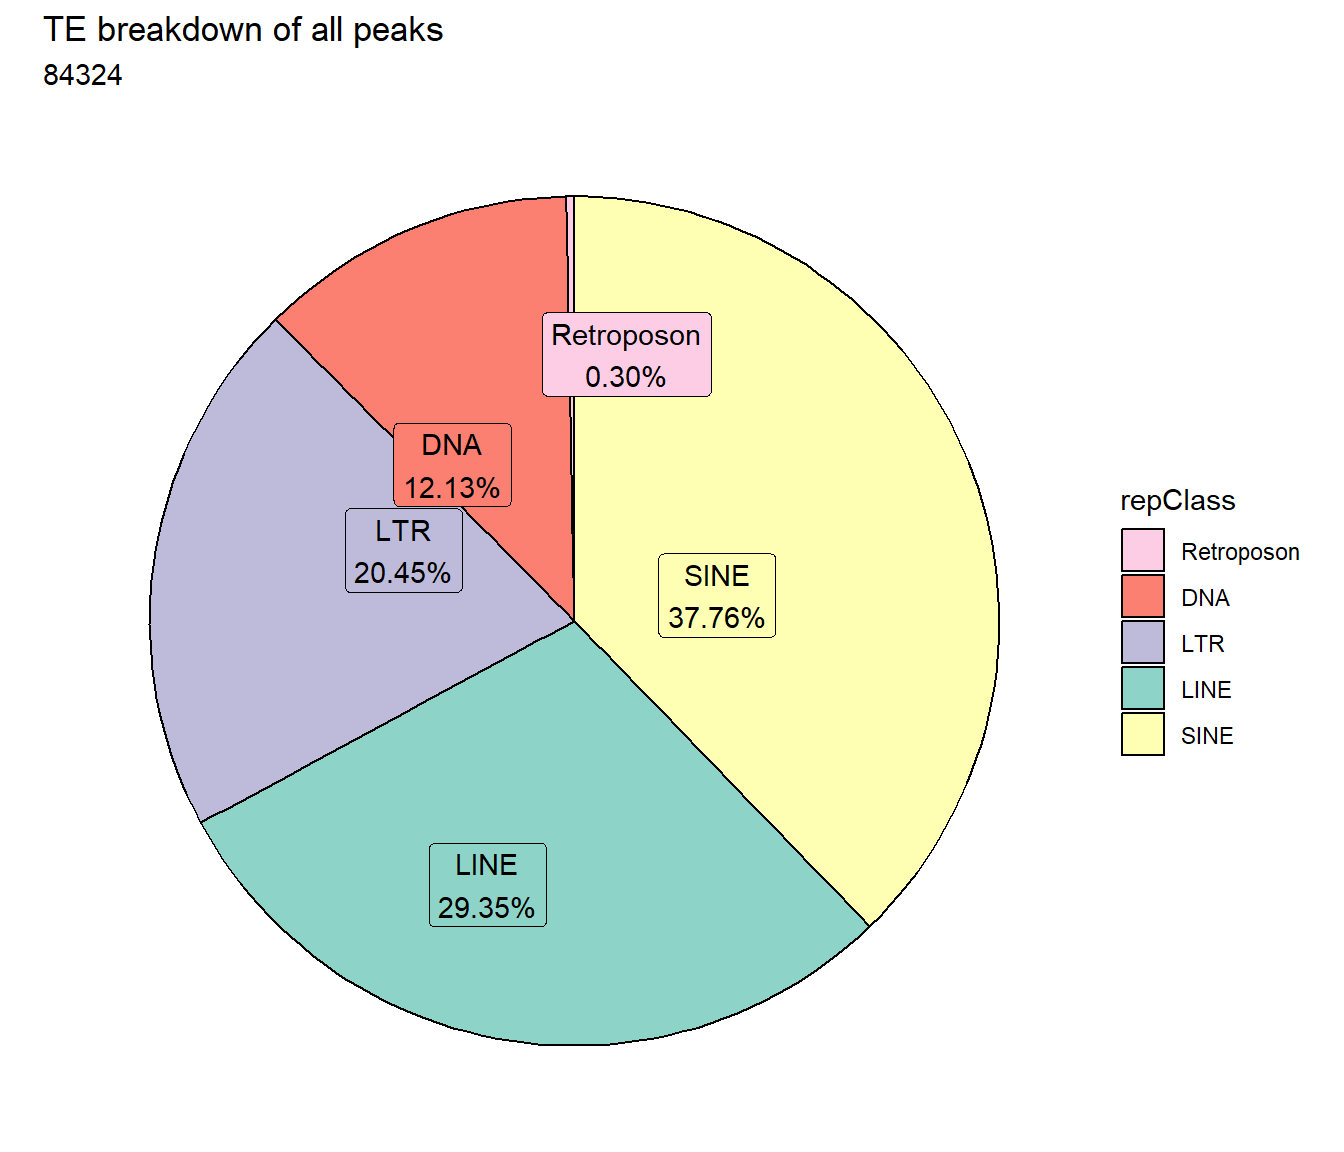
TE_mrc_status_list %>%
   mutate(repClass=factor(repClass)) %>%
  distinct() %>%
  dplyr::filter(per_ol>.5) %>%
  # group_by(repClass) %>%
  dplyr::filter(TEstatus =="TE_peak") %>%
   count(repClass) %>%
  mutate(perc= n/sum(n)) %>%
   arrange(desc(n)) %>%
  mutate(repClass = fct_rev(fct_inorder(repClass))) %>%
  mutate(text_y = cumsum(n) - n/2) %>%
  ggplot(., aes(x = "", y = n, fill = repClass)) +
  geom_col(color = "black") +
  coord_polar(theta = "y", start = 0)+
  geom_label_repel(aes(label = paste0(repClass,"\n",sprintf("%.2f",perc*100),"%")),
                     position = position_stack(vjust = .5),
                     force=.9,show.legend = FALSE,max.overlaps = 35) +
    # geom_label_repel(aes(label = paste(n,"\n", repClass)),
    #                  position = position_stack(vjust = .3),
    #                  show.legend = FALSE,max.overlaps = 50) +
  theme_void()+
  ggtitle("TE breakdown of all peaks using 50% cutoff",subtitle = paste(TE_50_count$n))+
  scale_fill_repeat()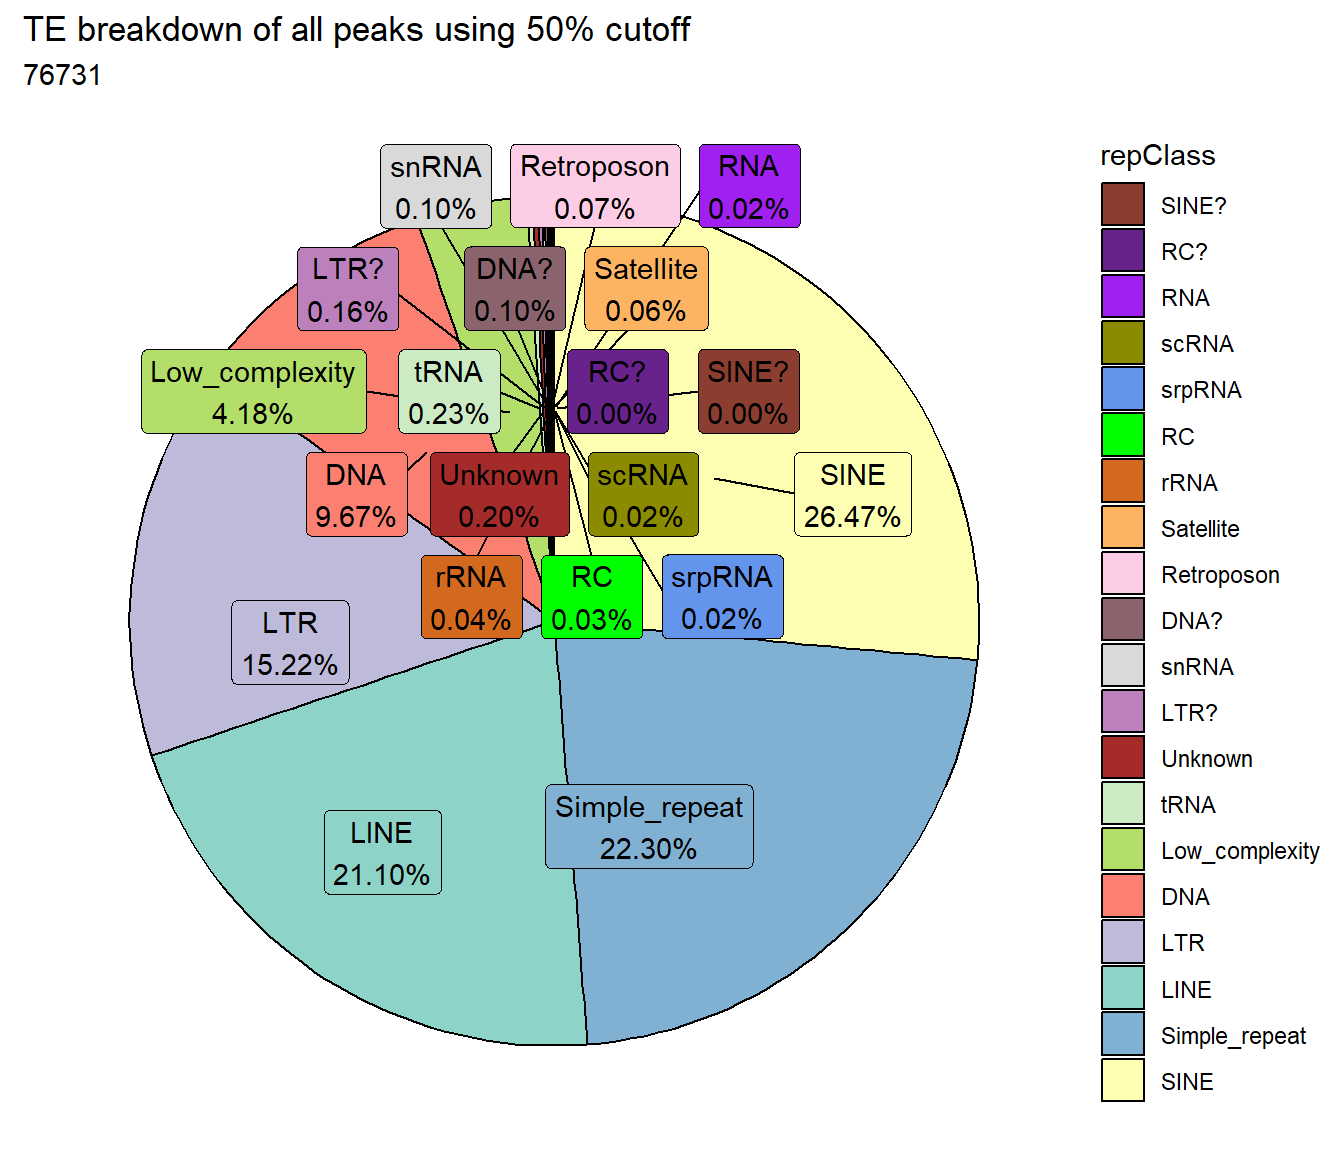
TE_mrc_status_list %>%
   mutate(repClass_org=repClass) %>%
   mutate(repClass=factor(repClass)) %>%
   mutate(repClass=if_else(##relable repClass with other
    repClass_org=="LINE", repClass_org,
    if_else(repClass_org=="SINE",repClass_org,
            if_else(repClass_org=="LTR", repClass_org,
                    if_else(repClass_org=="DNA", repClass_org,
                            if_else(repClass_org=="Retroposon",repClass_org,"Other")))))) %>%
  distinct() %>%
  dplyr::filter(per_ol>per_cov) %>%
  # group_by(repClass) %>%
  dplyr::filter(TEstatus =="TE_peak") %>%
   count(repClass) %>%
  mutate(perc= n/sum(n)) %>%
   arrange(desc(n)) %>%
  mutate(repClass = fct_rev(fct_inorder(repClass))) %>%
  mutate(text_y = cumsum(n) - n/2) %>%
  ggplot(., aes(x = "", y = n, fill = repClass)) +
  geom_col(color = "black") +
  coord_polar(theta = "y", start = 0)+

  geom_label_repel(aes(label = paste0(repClass,"\n",sprintf("%.2f",perc*100),"%")),
                     position = position_stack(vjust = .5),
                     force=.9,show.legend = FALSE,max.overlaps = 35) +
  # geom_label_repel(aes(label = paste(n,"\n", repClass)),
  #                    position = position_stack(vjust = .3),
  #                    show.legend = FALSE,max.overlaps = 50) +
  theme_void()+
  ggtitle("TE breakdown of all peaks using 50% cutoff",subtitle = paste(TE_50_count_filt$n, "peaks that contain LINEs, SINEs, LTRs, DNAs, or Retroposons"))+
  scale_fill_repeat()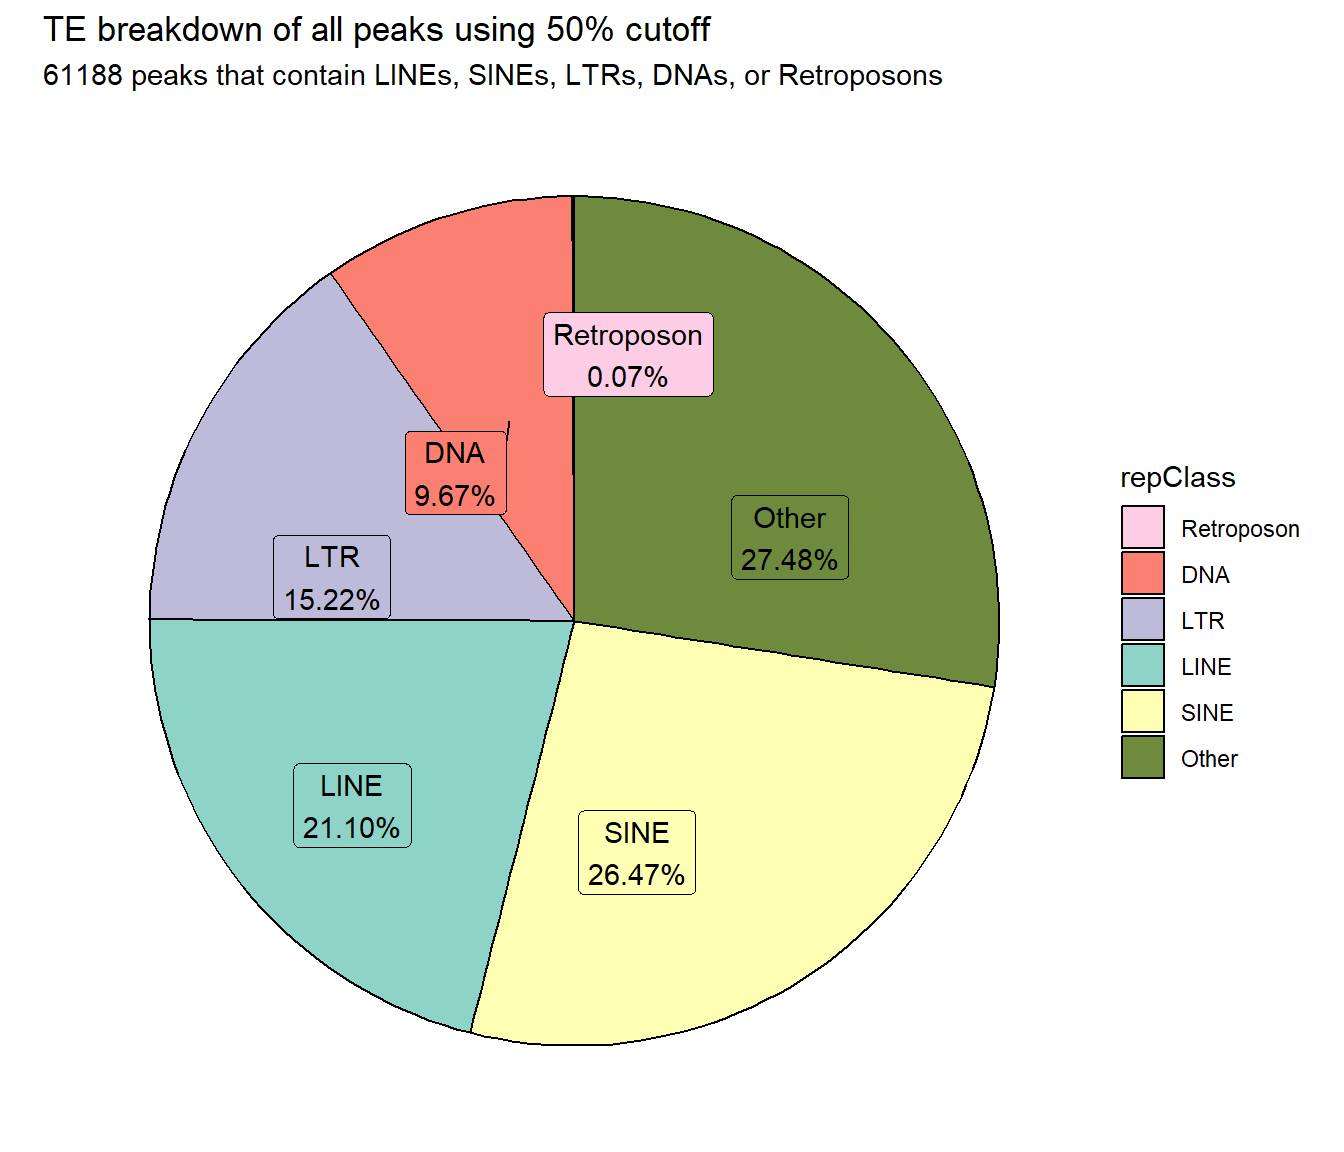
Peak_TE_overlapbreakdown%>%
  dplyr::filter(TEstatus=="TE_peak") %>%
  distinct() %>%
  mutate(repClass=factor(repClass)) %>%
  ggplot(., aes(x=width))+
    geom_density(aes(fill=repClass, alpha = 0.5))+
    theme_classic()+
   # coord_cartesian(xlim= c(0,500))+
  ggtitle("Distribution of all overlapping peak-TE widths")+
  scale_fill_repeat()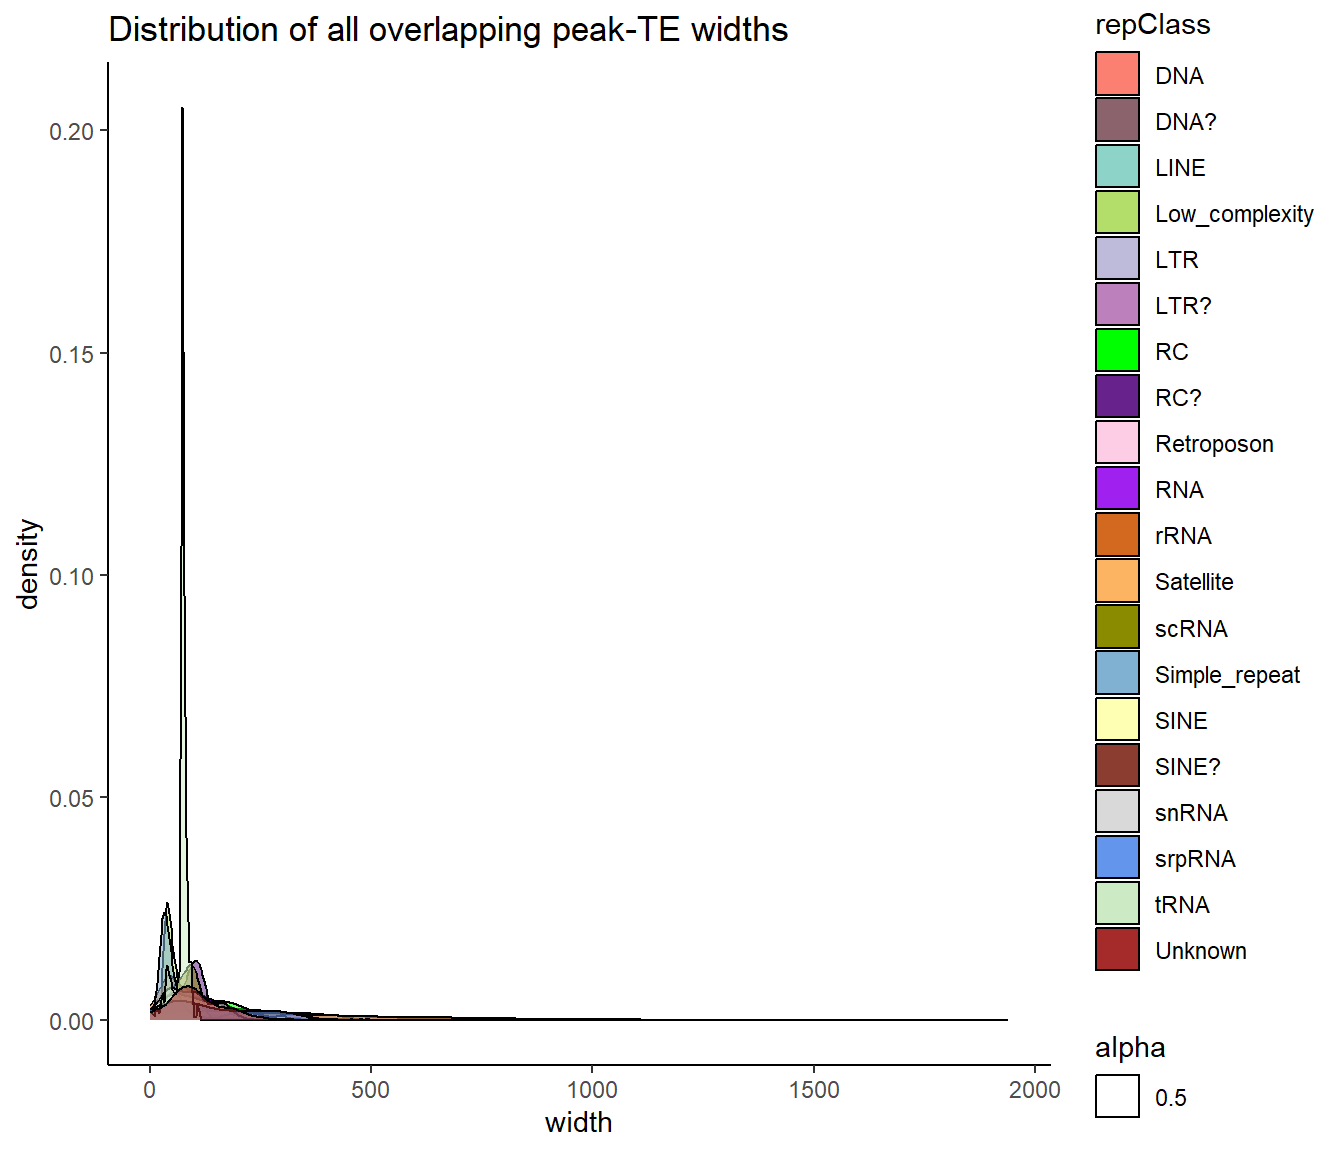
Peak_TE_overlapbreakdown%>%
  dplyr::filter(TEstatus=="TE_peak") %>%
  distinct() %>%
  mutate(repClass=factor(repClass)) %>%
  dplyr::filter(repClass=="LINE"|repClass=="SINE"|repClass=="LTR"|repClass=="DNA"|repClass=="Retroposon") %>%
  ggplot(., aes(x=width))+
    geom_density(aes(fill=repClass, alpha = 0.5))+
    theme_classic()+
   # coord_cartesian(xlim= c(0,500))+
  ggtitle("Filtered Distribution of all overlapping peak-TE widths")+
  scale_fill_repeat()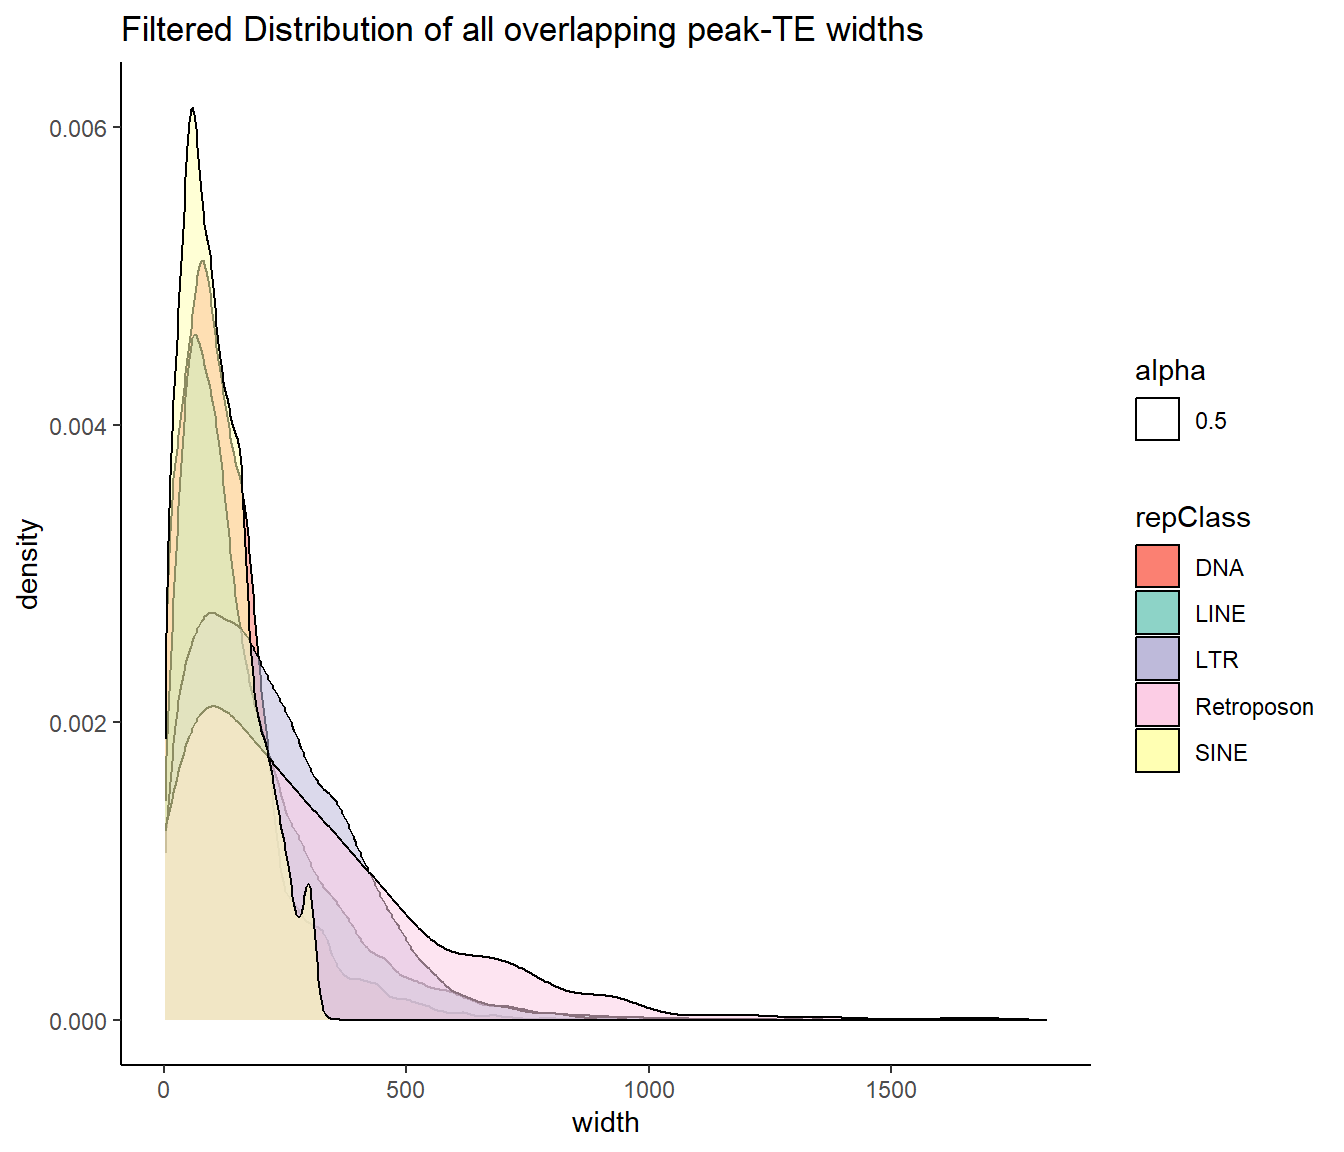
TE_mrc_status_list %>%
  dplyr::filter(per_ol>0.5) %>%
  distinct() %>%
  dplyr::filter(TEstatus=="TE_peak") %>%
  mutate(repClass=factor(repClass)) %>%
  ggplot(., aes(x=width))+
    geom_density(aes(fill=repClass, alpha = 0.5))+
  scale_fill_repeat()+
  theme_classic()+
  ggtitle("Distribution of all overlapping peak-TE widths >50%")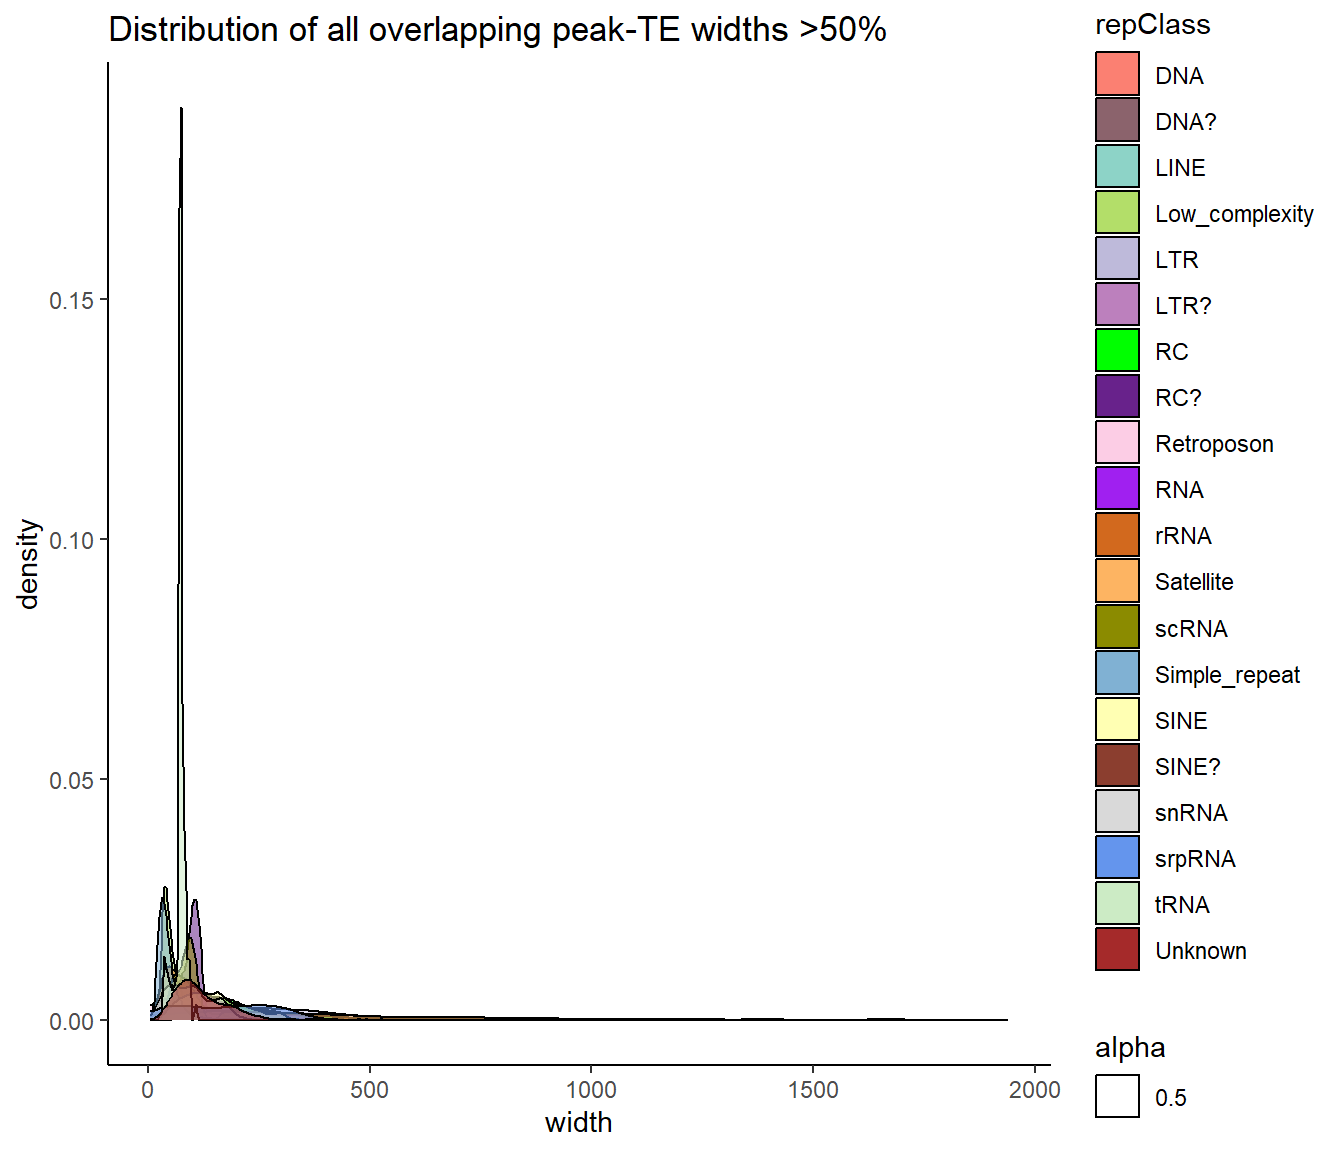
TE_mrc_status_list %>%
  dplyr::filter(per_ol>0.5) %>%
  distinct() %>%
  dplyr::filter(TEstatus=="TE_peak") %>%
  mutate(repClass=factor(repClass)) %>%
  dplyr::filter(repClass=="LINE"|repClass=="SINE"|repClass=="LTR"|repClass=="DNA"|repClass=="Retroposon") %>%
  ggplot(., aes(x=width))+
    geom_density(aes(fill=repClass, alpha = 0.5))+
  scale_fill_repeat()+
  theme_classic()+
  ggtitle("Filtered Distribution of all overlapping peak-TE widths >50%")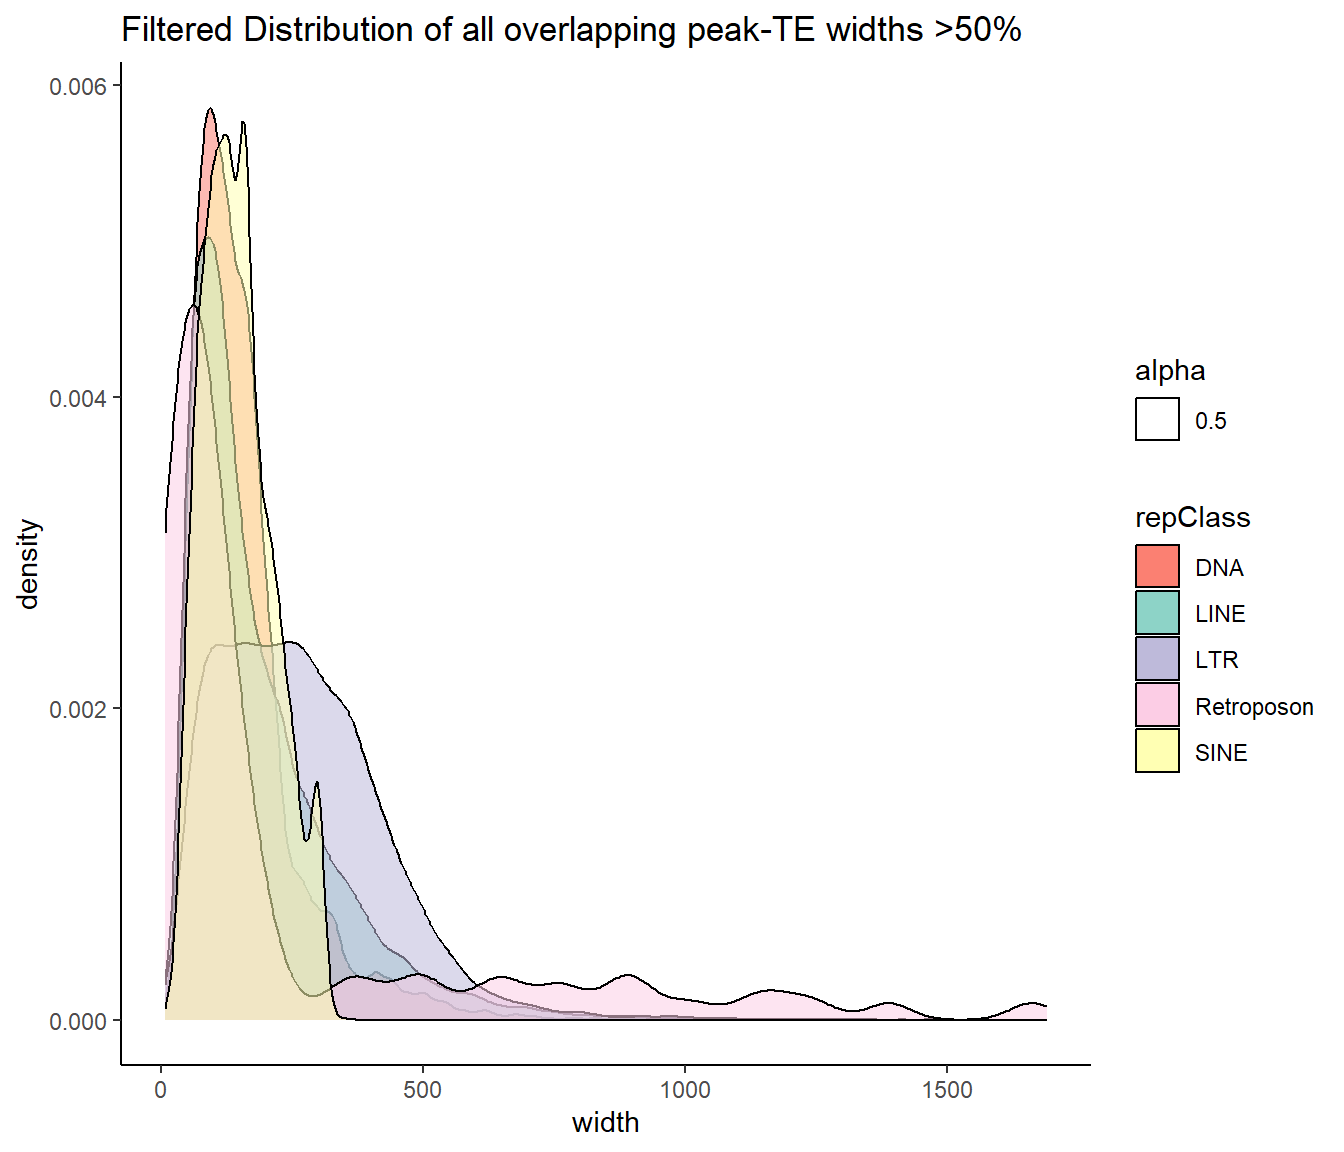
Line repeats
per_cov <- 0.5


Line_df%>%
count(repFamily) %>%
   mutate(perc= n/sum(n)) %>%
   arrange(desc(n)) %>%
  mutate(repFamily = fct_rev(fct_inorder(repFamily))) %>%
  mutate(text_y = cumsum(n) - n/2) %>%
   ggplot(., aes(x = "", y = n, fill = repFamily)) +
  geom_col(color = "black") +
  coord_polar(theta = "y", start = 0)+
  geom_label_repel(aes(label = paste0(repFamily,"\n",sprintf("%.2f",perc*100),"%")),
                     position = position_stack(vjust = .5),
                     force=.9,show.legend = FALSE,max.overlaps = 35) +
  theme_void()+
  ggtitle("Human genome LINE breakdown", subtitle=paste(length(Line_df$milliIns)))+
  scale_fill_lines()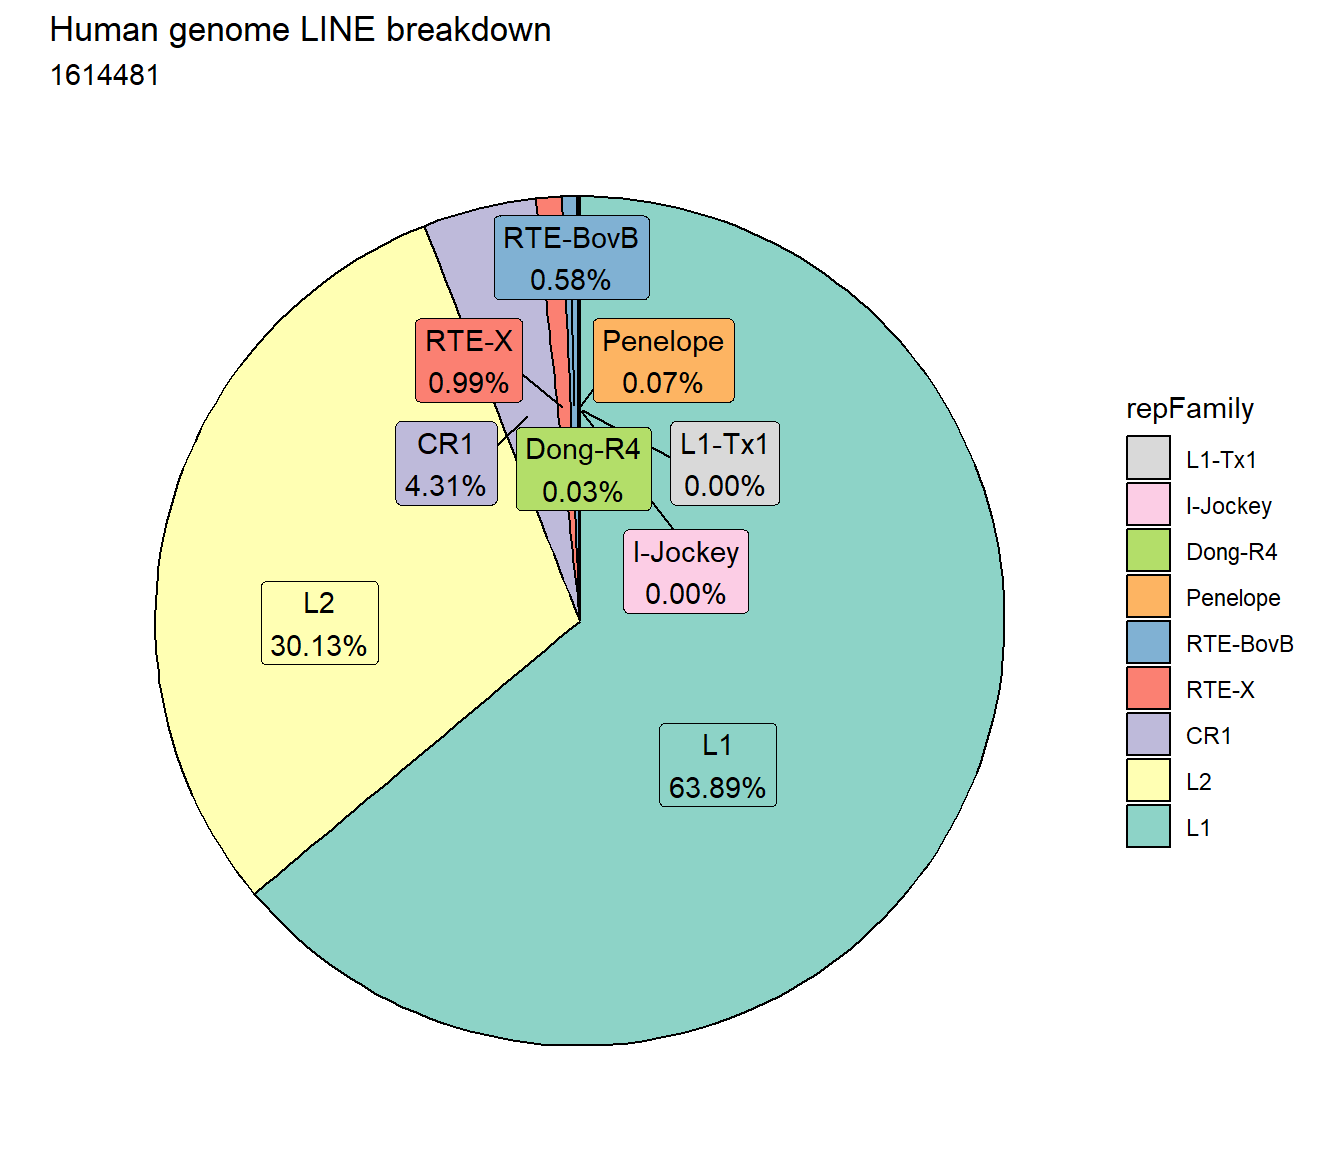
TE_LINE_count <- TE_mrc_status_list %>%
  dplyr::filter(TEstatus =="TE_peak"&repClass=="LINE"&per_ol>per_cov) %>%
  count

TE_mrc_status_list %>%
  dplyr::filter(repClass == "LINE"&per_ol>per_cov) %>%
   mutate(repFamily=factor(repFamily)) %>%
     # group_by(repFamily) %>%
  count(repFamily) %>%
   mutate(perc= n/sum(n)) %>%
   arrange(desc(n)) %>%
  mutate(repFamily = fct_rev(fct_inorder(repFamily))) %>%
  mutate(text_y = cumsum(n) - n/2) %>%
  ggplot(., aes(x = "", y = n, fill = repFamily)) +
  geom_col(color = "black") +
  coord_polar(theta = "y", start = 0)+
  geom_label_repel(aes(label = paste0(repFamily,"\n",sprintf("%.2f",perc*100),"%")),
                     position = position_stack(vjust = .5),
                     force=.9,show.legend = FALSE,max.overlaps = 35) +
  theme_void()+
  ggtitle(paste0("LINE breakdown of peaks ",per_cov),subtitle=paste(TE_LINE_count$n))+
  scale_fill_lines()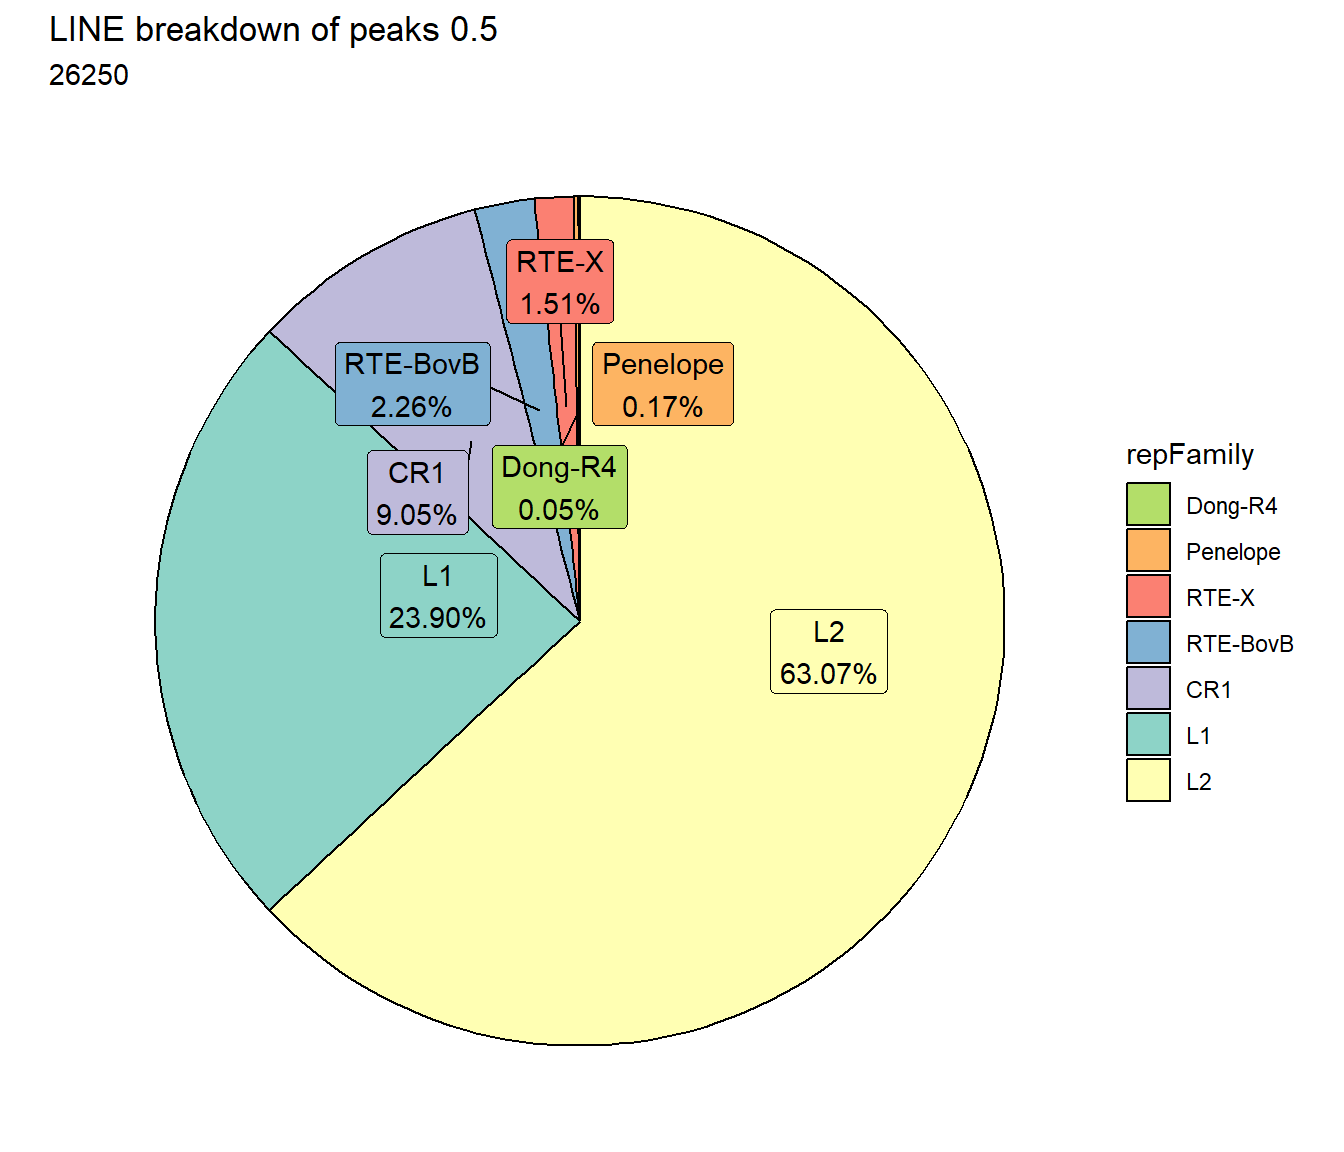
EAR_LINE_count <- TE_mrc_status_list %>%
  dplyr::filter(mrc =="EAR"&repClass=="LINE"&per_ol>per_cov) %>%
  count
ESR_LINE_count <- TE_mrc_status_list %>%
  dplyr::filter(mrc =="ESR"&repClass=="LINE"&per_ol>per_cov) %>%
  count
LR_LINE_count <- TE_mrc_status_list %>%
  dplyr::filter(mrc =="LR"&repClass=="LINE"&per_ol>per_cov) %>%
  count
NR_LINE_count <- TE_mrc_status_list %>%
  dplyr::filter(mrc =="NR"&repClass=="LINE"&per_ol>per_cov) %>%
  count

TE_mrc_status_list %>%
  dplyr::filter(mrc =="EAR"&repClass=="LINE"&per_ol>per_cov) %>%
  mutate(repFamily=factor(repFamily)) %>%
  # group_by(repFamily) %>%
  count(repFamily) %>%
  mutate(perc= n/sum(n)) %>%
  arrange(desc(n)) %>%
  mutate(repFamily = fct_rev(fct_inorder(repFamily))) %>%
  mutate(text_y = cumsum(n) - n/2) %>%
  ggplot(., aes(x = "", y = n, fill = repFamily)) +
  geom_col(color = "black") +
  coord_polar(theta = "y", start = 0)+
  geom_label_repel(aes(label = paste0(repFamily,"\n",sprintf("%.2f",perc*100),"%")),
                     position = position_stack(vjust = .5),
                     force=.9,show.legend = FALSE,max.overlaps = 35) +
  theme_void()+
  ggtitle(paste0("EAR LINE breakdown of peaks ",per_cov),subtitle=paste(EAR_LINE_count$n))+
  scale_fill_lines()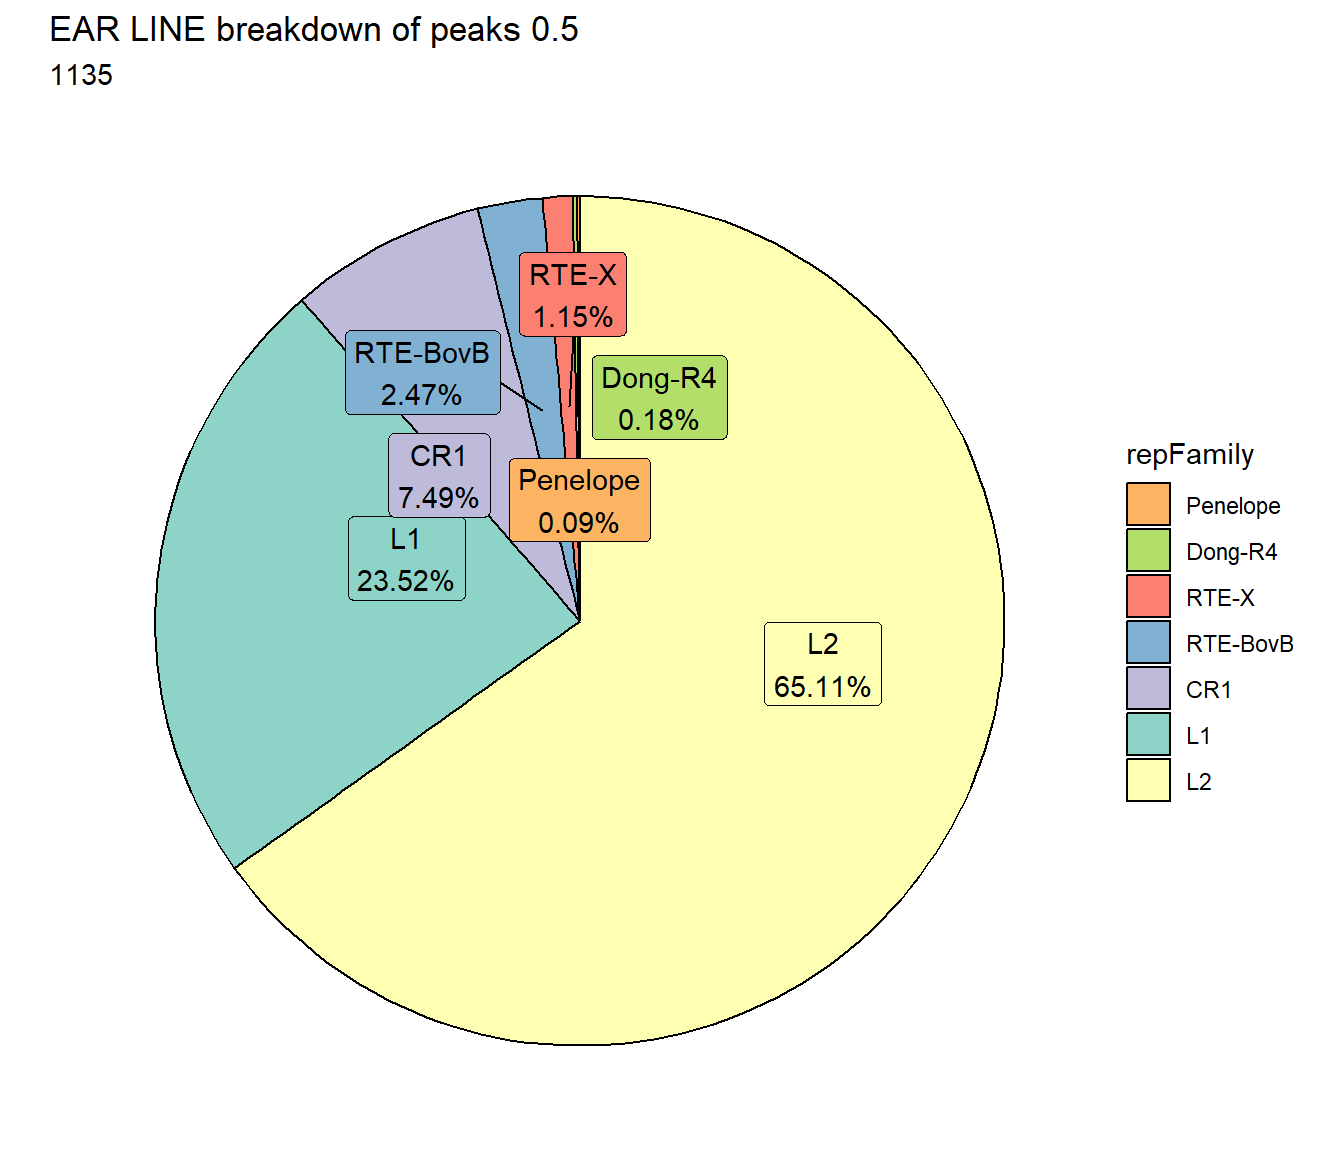
TE_mrc_status_list %>%
  dplyr::filter(mrc =="ESR"&repClass=="LINE"&per_ol>per_cov) %>%
  mutate(repFamily=factor(repFamily)) %>%
  count(repFamily) %>%
  mutate(perc= n/sum(n)) %>%
  arrange(desc(n)) %>%
  mutate(repFamily = fct_rev(fct_inorder(repFamily))) %>%
  mutate(text_y = cumsum(n) - n/2) %>%
  ggplot(., aes(x = "", y = n, fill = repFamily)) +
  geom_col(color = "black") +
  coord_polar(theta = "y", start = 0)+
  geom_label_repel(aes(label = paste0(repFamily,"\n",sprintf("%.2f",perc*100),"%")),
                     position = position_stack(vjust = .5),
                     force=.9,show.legend = FALSE,max.overlaps = 35) +
  theme_void()+
  ggtitle(paste0("ESR LINE breakdown of peaks ",per_cov),subtitle=paste(ESR_LINE_count$n))+
  scale_fill_lines()
TE_mrc_status_list %>%
  dplyr::filter(mrc =="LR"&repClass=="LINE"&per_ol>per_cov) %>%
  mutate(repFamily=factor(repFamily)) %>%
  count(repFamily) %>%
  mutate(perc= n/sum(n)) %>%
  arrange(desc(n)) %>%
  mutate(repFamily = fct_rev(fct_inorder(repFamily))) %>%
  mutate(text_y = cumsum(n) - n/2) %>%
  ggplot(., aes(x = "", y = n, fill = repFamily)) +
  geom_col(color = "black") +
  coord_polar(theta = "y", start = 0)+
  geom_label_repel(aes(label = paste0(repFamily,"\n",sprintf("%.2f",perc*100),"%")),
                     position = position_stack(vjust = .5),
                     force=.9,show.legend = FALSE,max.overlaps = 35) +
  theme_void()+
  ggtitle(paste0("LR LINE breakdown of peaks ",per_cov),subtitle=paste(LR_LINE_count$n))+
  scale_fill_lines()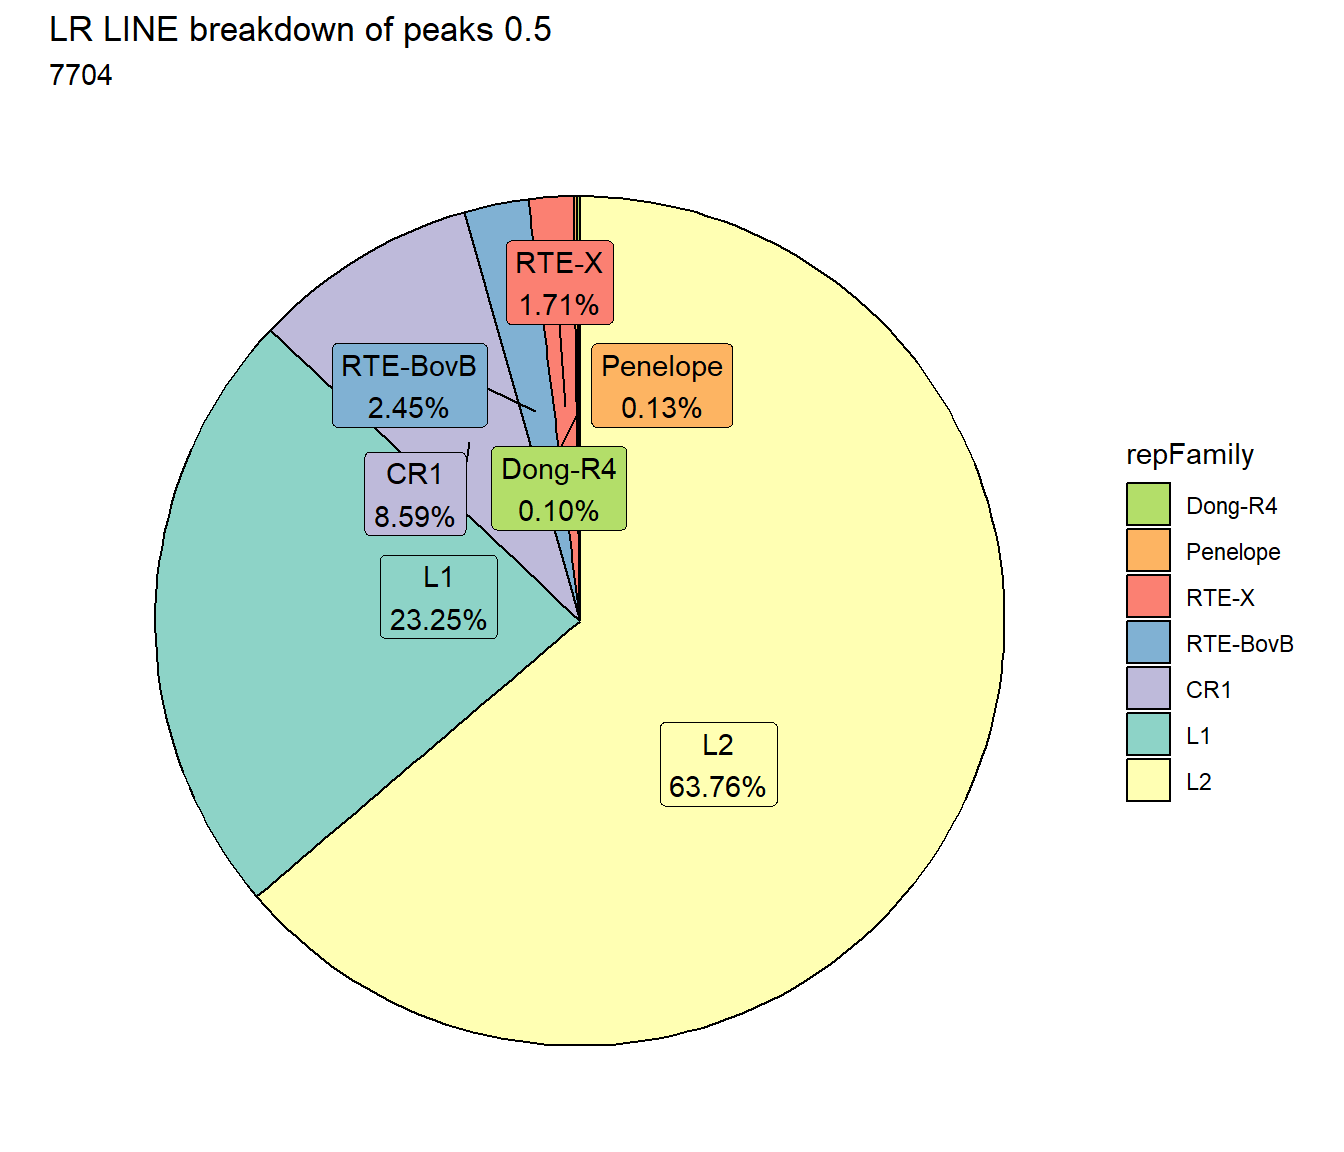
TE_mrc_status_list %>%
  dplyr::filter(mrc =="NR"&repClass=="LINE"&per_ol>per_cov) %>%
  mutate(repFamily=factor(repFamily)) %>%
  count(repFamily) %>%
  mutate(perc= n/sum(n)) %>%
  arrange(desc(n)) %>%
  mutate(repFamily = fct_rev(fct_inorder(repFamily))) %>%
  mutate(text_y = cumsum(n) - n/2) %>%
  ggplot(., aes(x = "", y = n, fill = repFamily)) +
  geom_col(color = "black") +
  coord_polar(theta = "y", start = 0)+
  geom_label_repel(aes(label = paste0(repFamily,"\n",sprintf("%.2f",perc*100),"%")),
                     position = position_stack(vjust = .5),
                     force=.9,show.legend = FALSE,max.overlaps = 35) +
  theme_void()+
  ggtitle(paste0("NR LINE breakdown of peaks ",per_cov),subtitle=paste(NR_LINE_count$n))+
  scale_fill_lines()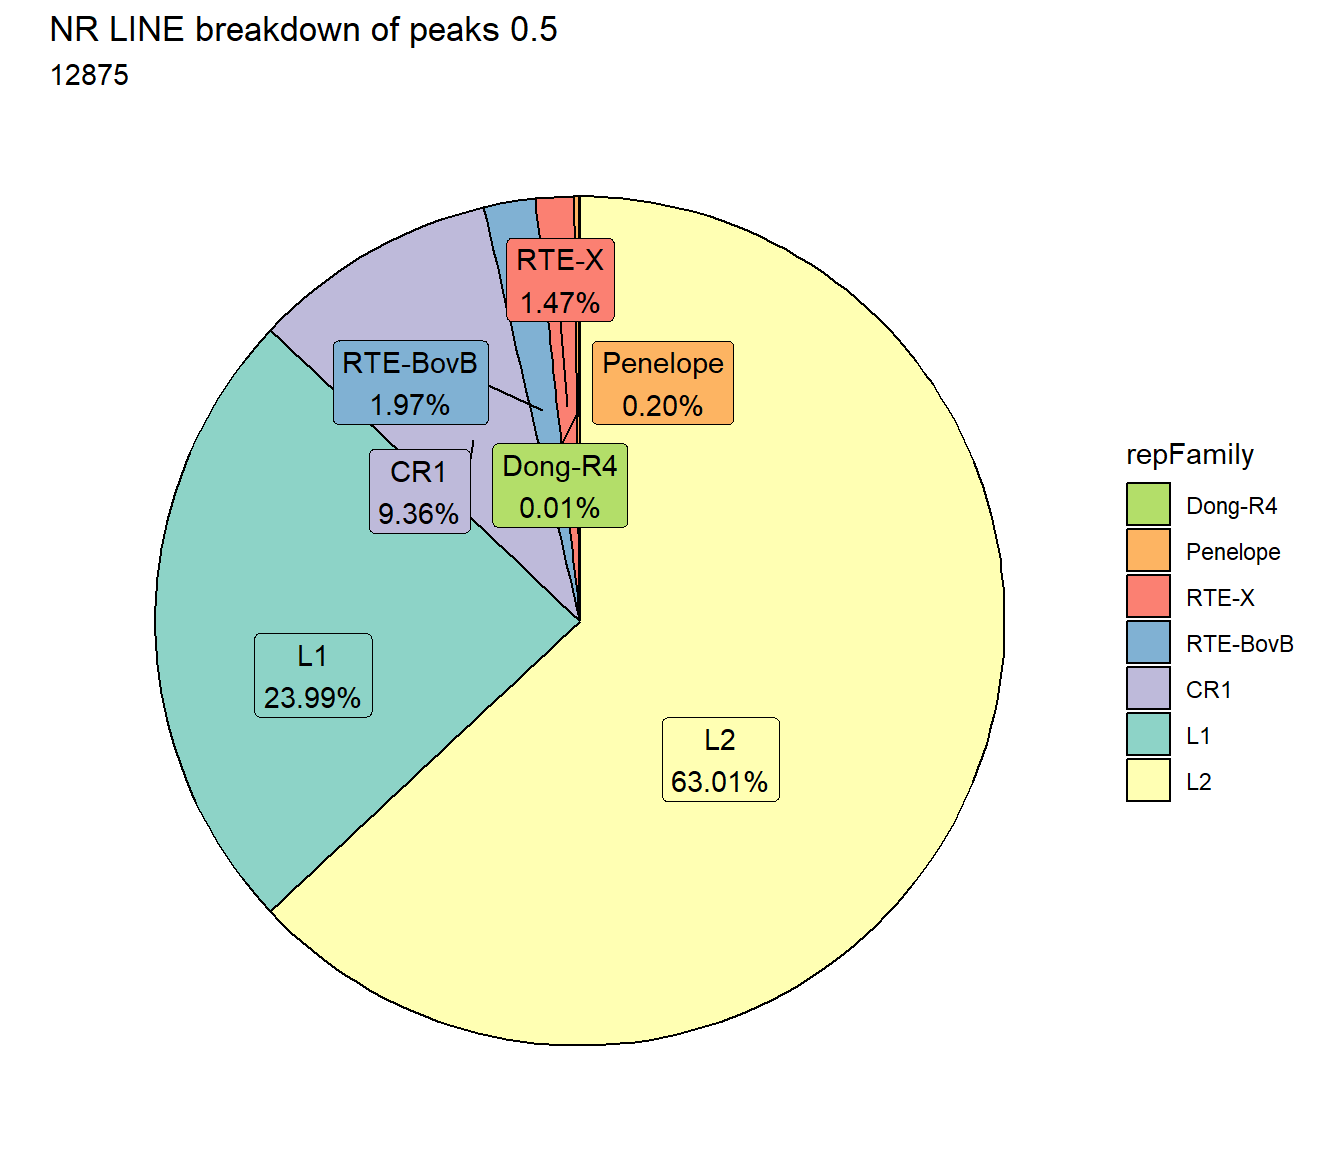
all_L2_count <- TE_mrc_status_list %>%
  dplyr::filter(repClass=="LINE"&repFamily=="L2"&per_ol>per_cov) %>%
  tally
EAR_L2_count <- TE_mrc_status_list %>%
  dplyr::filter(repClass=="LINE"&repFamily=="L2", mrc=="EAR"&per_ol>per_cov) %>%
  tally
ESR_L2_count <- TE_mrc_status_list %>%
  dplyr::filter(repClass=="LINE"&repFamily=="L2", mrc=="ESR"&per_ol>per_cov) %>%
  tally
LR_L2_count <- TE_mrc_status_list %>%
  dplyr::filter(repClass=="LINE"&repFamily=="L2", mrc=="LR"&per_ol>per_cov) %>%
  tally
NR_L2_count <- TE_mrc_status_list %>%
  dplyr::filter(repClass=="LINE"&repFamily=="L2", mrc=="NR"&per_ol>per_cov) %>%
  tally


TE_mrc_status_list %>%
  dplyr::filter(repClass=="LINE"&repFamily=="L2"&per_ol>per_cov)%>%
  mutate(repName=factor(repName)) %>%
  # group_by(repName) %>%
  count(repName) %>%
  mutate(perc= n/sum(n)) %>%
  arrange(desc(n)) %>%
  mutate(repName = fct_rev(fct_inorder(repName))) %>%
  mutate(text_y = cumsum(n) - n/2) %>%
  ggplot(., aes(x = "", y = n, fill = repName)) +
  geom_col(color = "black") +
  coord_polar(theta = "y", start = 0)+
  geom_label_repel(aes(label = paste0(repName,"\n",sprintf("%.2f",perc*100),"%")),
                     position = position_stack(vjust = .5),
                     force=.9,show.legend = FALSE,max.overlaps = 35) +
  # geom_label_repel(aes(label = n),
  #                    position = position_stack(vjust = .3),
  #                    show.legend = FALSE,max.overlaps = 50) +
  theme_void()+
  ggtitle(paste0("LINE-L2 breakdown for all peaks ",per_cov),subtitle=paste(all_L2_count," total LINEs"))+
  scale_fill_L2()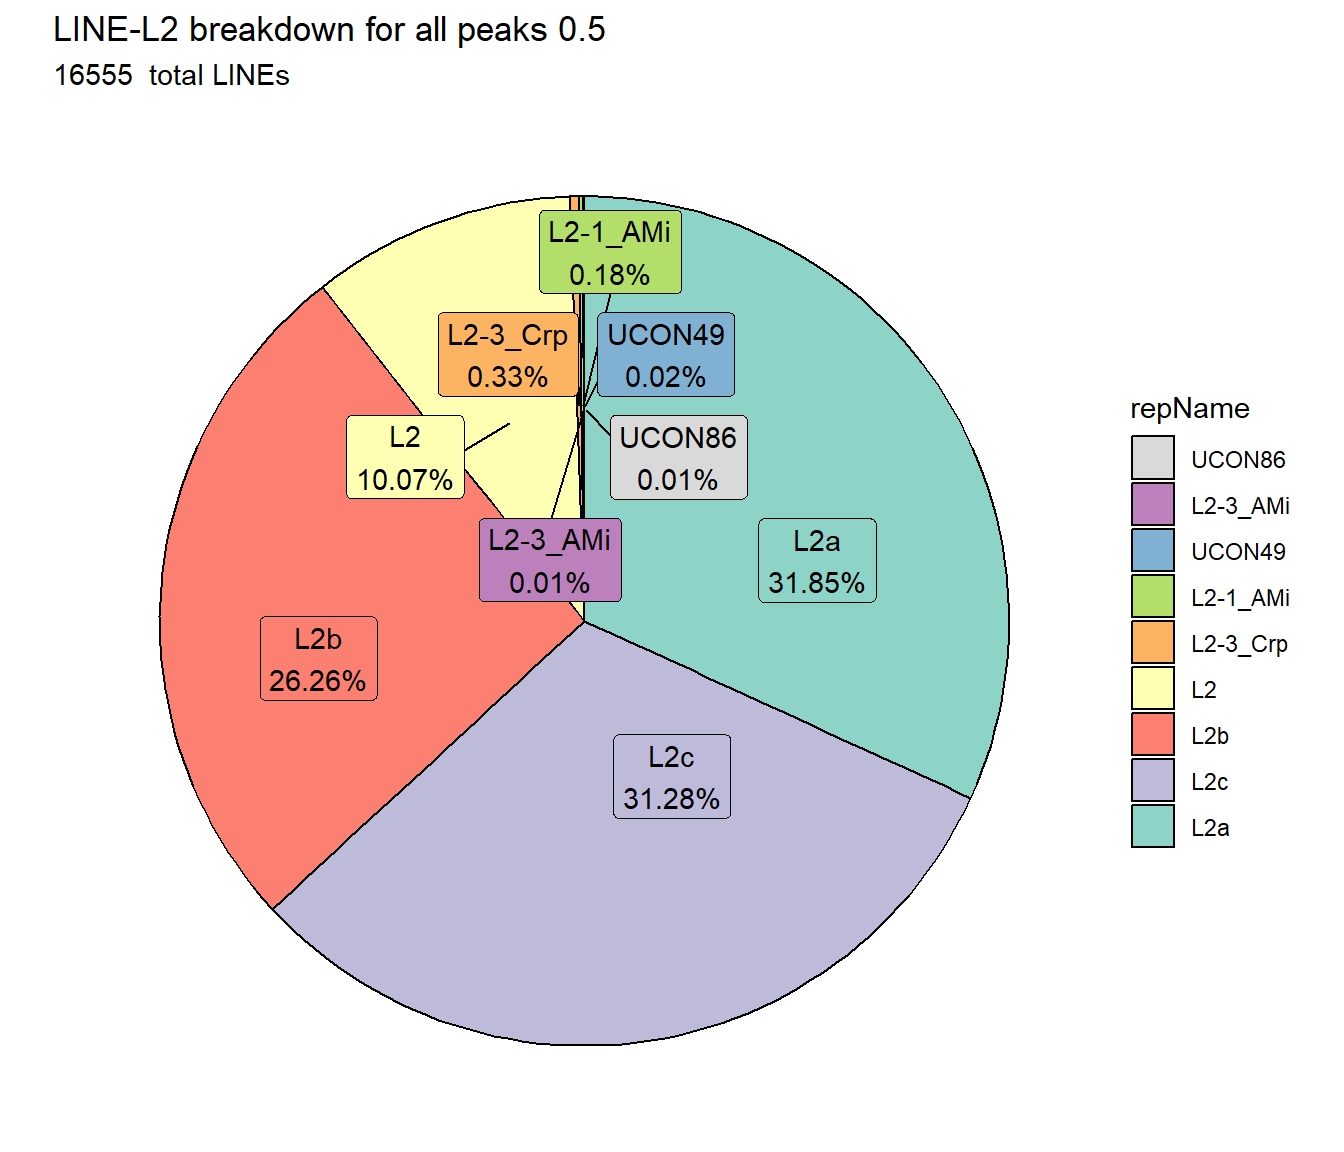
TE_mrc_status_list %>%
  dplyr::filter(mrc =="EAR"&repClass=="LINE"&repFamily=="L2"&per_ol>per_cov)%>%
  mutate(repName=factor(repName)) %>%
  # group_by(repName) %>%
  count(repName) %>%
  mutate(perc= n/sum(n)) %>%
  arrange(desc(n)) %>%
  mutate(repName = fct_rev(fct_inorder(repName))) %>%
  mutate(text_y = cumsum(n) - n/2) %>%
  ggplot(., aes(x = "", y = n, fill = repName)) +
  geom_col(color = "black") +
  coord_polar(theta = "y", start = 0)+
  # geom_label_repel(aes(label = n),
  #                    position = position_stack(vjust = .3),
  #                    show.legend = FALSE,max.overlaps = 50) +
  geom_label_repel(aes(label = paste0(repName,"\n",sprintf("%.2f",perc*100),"%")),
                     position = position_stack(vjust = .5),
                     force=.9,show.legend = FALSE,max.overlaps = 35) +
  theme_void()+
  ggtitle(paste0("LINE-L2 breakdown for EAR ",per_cov),subtitle=paste(EAR_L2_count$n," total L2s"))+
  scale_fill_L2()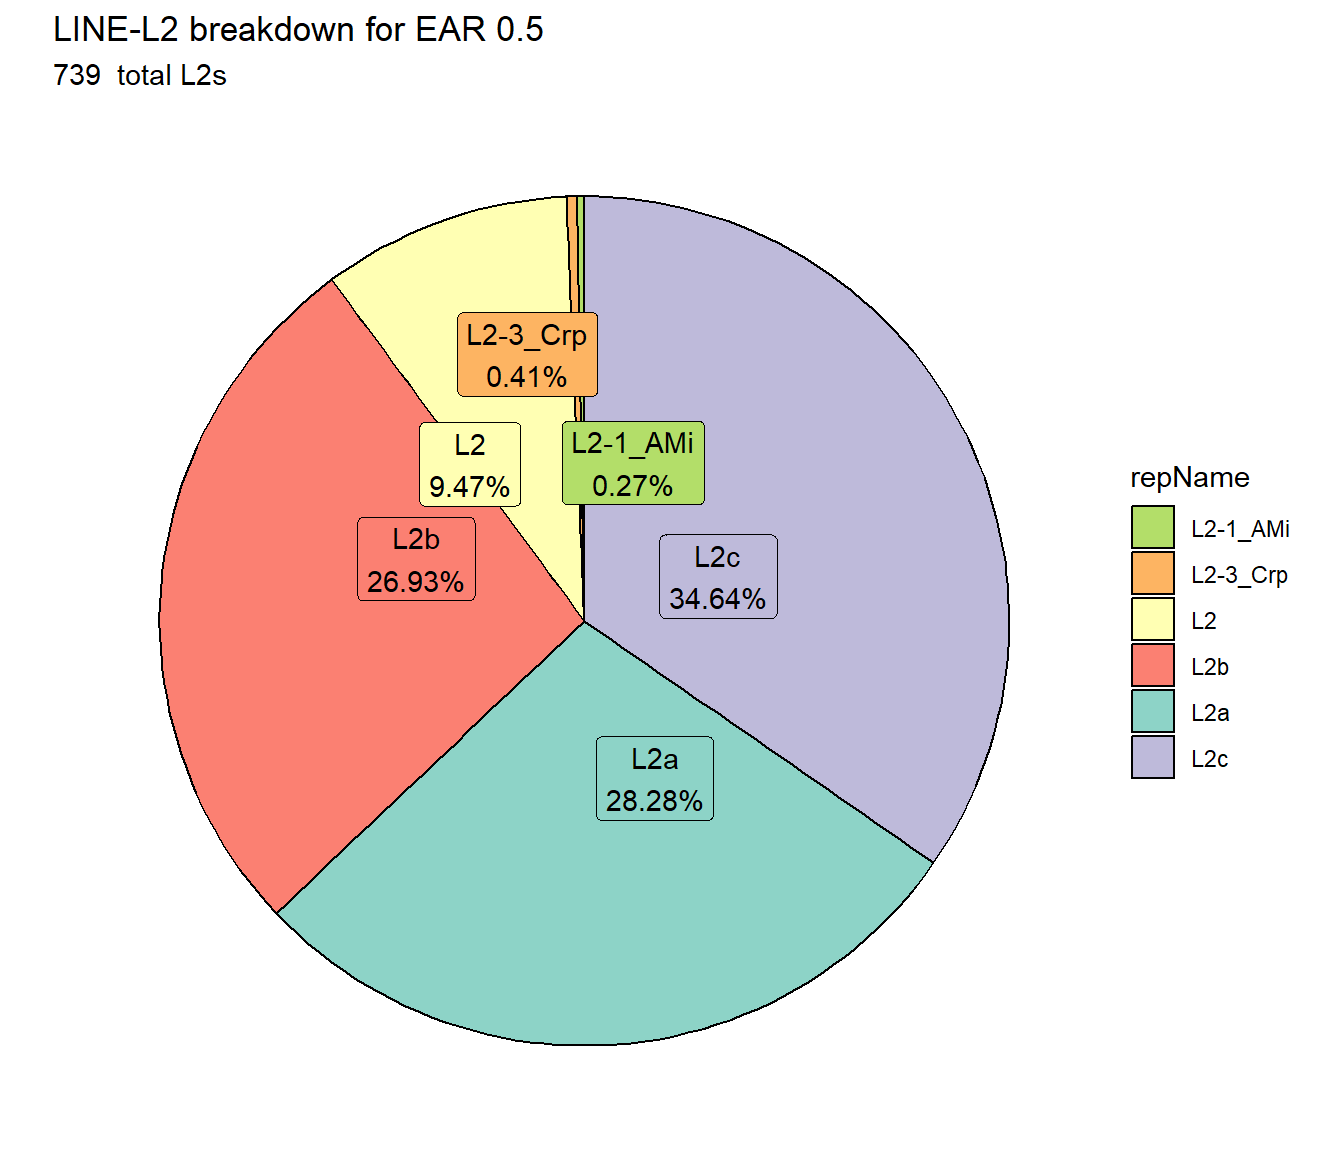
TE_mrc_status_list %>%
  dplyr::filter(mrc =="ESR"&repClass=="LINE"&repFamily=="L2"&per_ol>per_cov)%>%
  mutate(repName=factor(repName)) %>%
  # group_by(repName) %>%
  count(repName) %>%
  mutate(perc= n/sum(n)) %>%
  arrange(desc(n)) %>%
  mutate(repName = fct_rev(fct_inorder(repName))) %>%
  mutate(text_y = cumsum(n) - n/2) %>%
  ggplot(., aes(x = "", y = n, fill = repName)) +
  geom_col(color = "black") +
  coord_polar(theta = "y", start = 0)+
  geom_label_repel(aes(label = paste0(repName,"\n",sprintf("%.2f",perc*100),"%")),
                     position = position_stack(vjust = .5),
                     force=.9,show.legend = FALSE,max.overlaps = 35) +
  theme_void()+
  ggtitle(paste0("LINE-L2 breakdown for ESR ",per_cov),subtitle=paste(ESR_L2_count$n," total L2s"))+
  scale_fill_L2()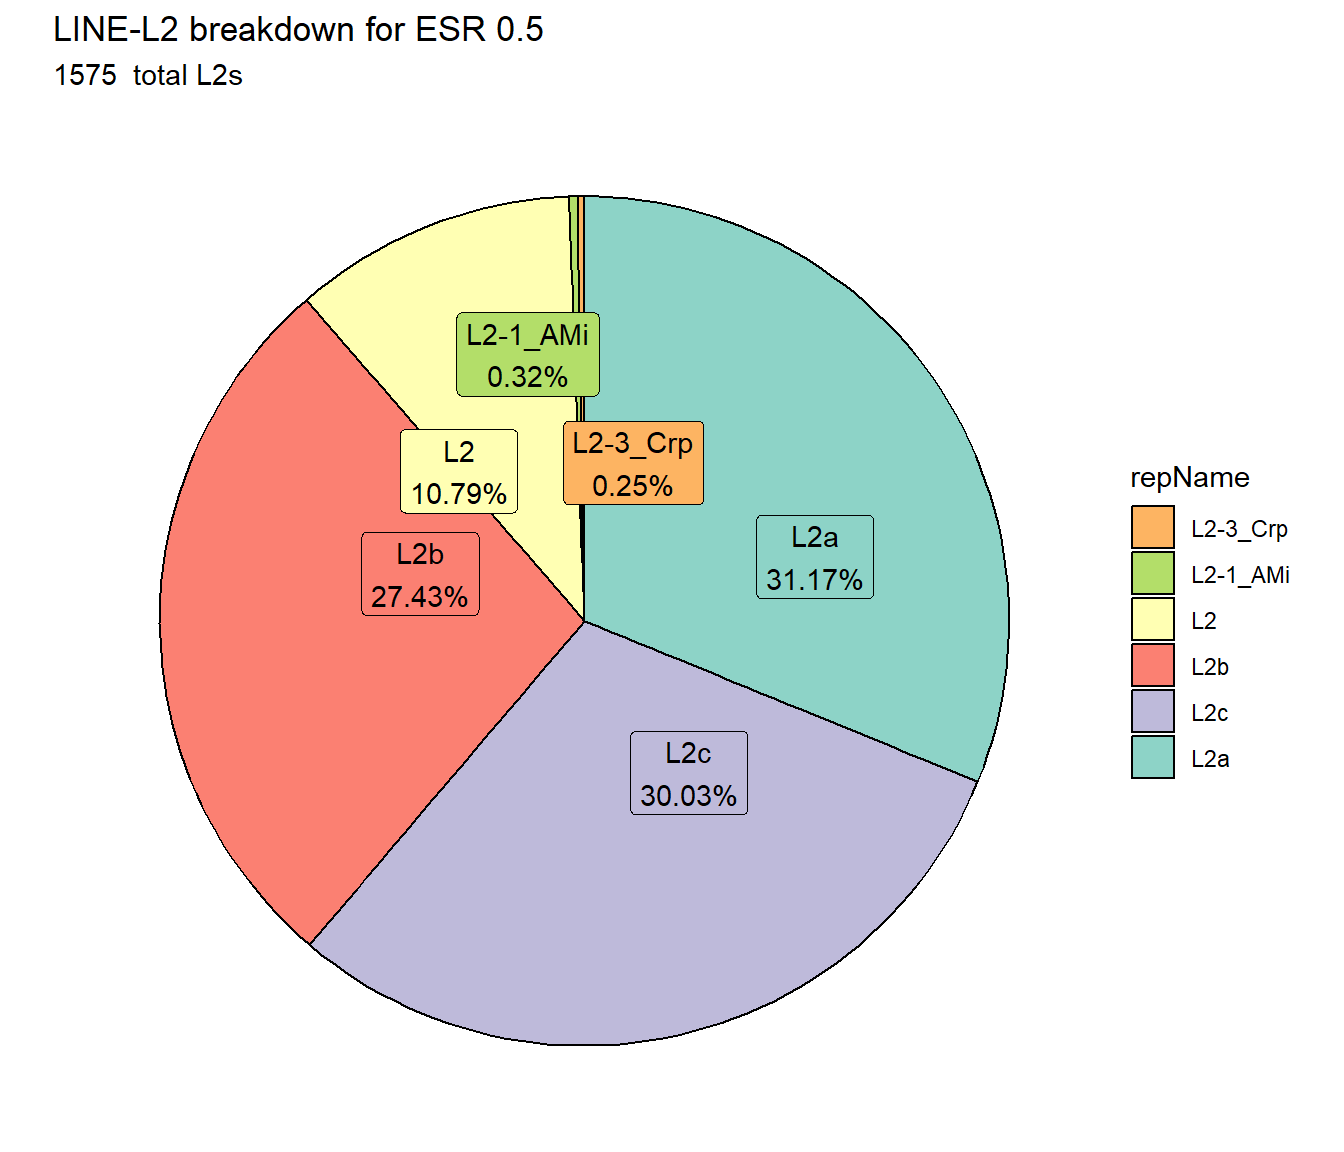
TE_mrc_status_list %>%
  dplyr::filter(mrc =="LR"&repClass=="LINE"&repFamily=="L2"&per_ol>per_cov)%>%
  mutate(repName=factor(repName)) %>%
  count(repName) %>%
  mutate(perc= n/sum(n)) %>%
  arrange(desc(n)) %>%
  mutate(repName = fct_rev(fct_inorder(repName))) %>%
  mutate(text_y = cumsum(n) - n/2) %>%
  ggplot(., aes(x = "", y = n, fill = repName)) +
  geom_col(color = "black") +
  coord_polar(theta = "y", start = 0)+
  geom_label_repel(aes(label = paste0(repName,"\n",sprintf("%.2f",perc*100),"%")),
                     position = position_stack(vjust = .5),
                     force=.9,show.legend = FALSE,max.overlaps = 35) +
  theme_void()+
  ggtitle(paste0("LINE-L2 breakdown for LR ",per_cov),subtitle=paste(LR_L2_count$n," total L2s"))+
  scale_fill_L2()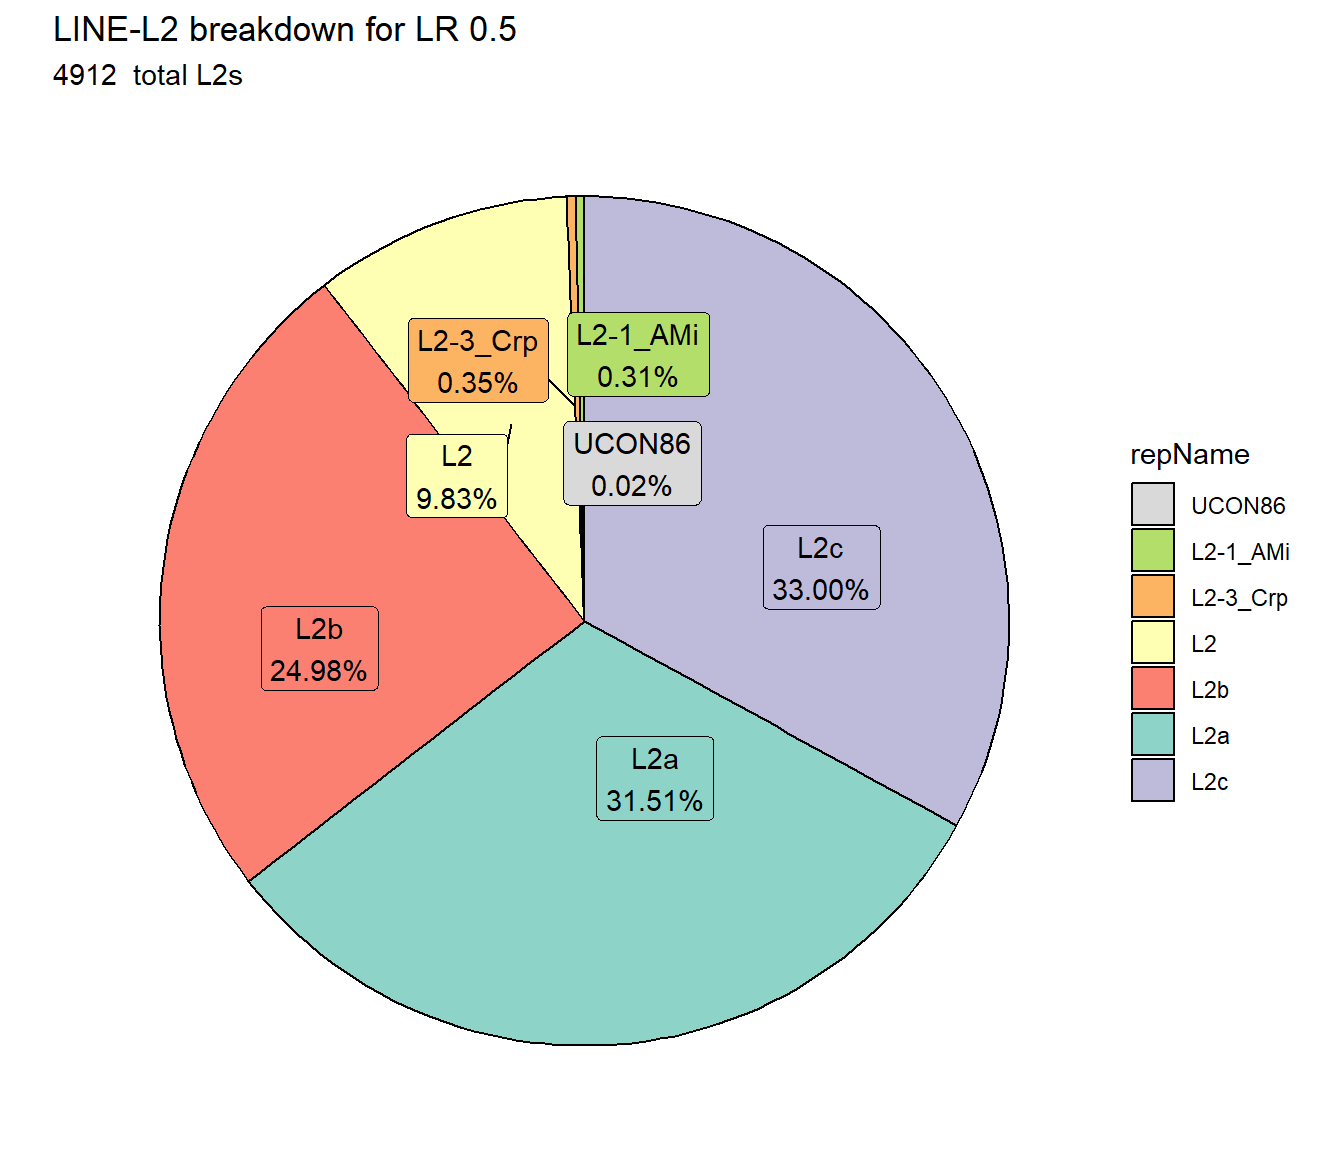
TE_mrc_status_list %>%
  dplyr::filter(mrc =="NR"&repClass=="LINE"&repFamily=="L2"&per_ol>per_cov)%>%
  mutate(repName=factor(repName)) %>%
  count(repName) %>%
  mutate(perc= n/sum(n)) %>%
  arrange(desc(n)) %>%
  mutate(repName = fct_rev(fct_inorder(repName))) %>%
  mutate(text_y = cumsum(n) - n/2) %>%
  ggplot(., aes(x = "", y = n, fill = repName)) +
  geom_col(color = "black") +
  coord_polar(theta = "y", start = 0)+
  geom_label_repel(aes(label = paste0(repName,"\n",sprintf("%.2f",perc*100),"%")),
                     position = position_stack(vjust = .5),
                     force=.9,show.legend = FALSE,max.overlaps = 35) +
  theme_void()+
  ggtitle(paste0("LINE-L2 breakdown for NR ",per_cov),subtitle=paste(NR_L2_count$n," total L2s"))+
  scale_fill_L2()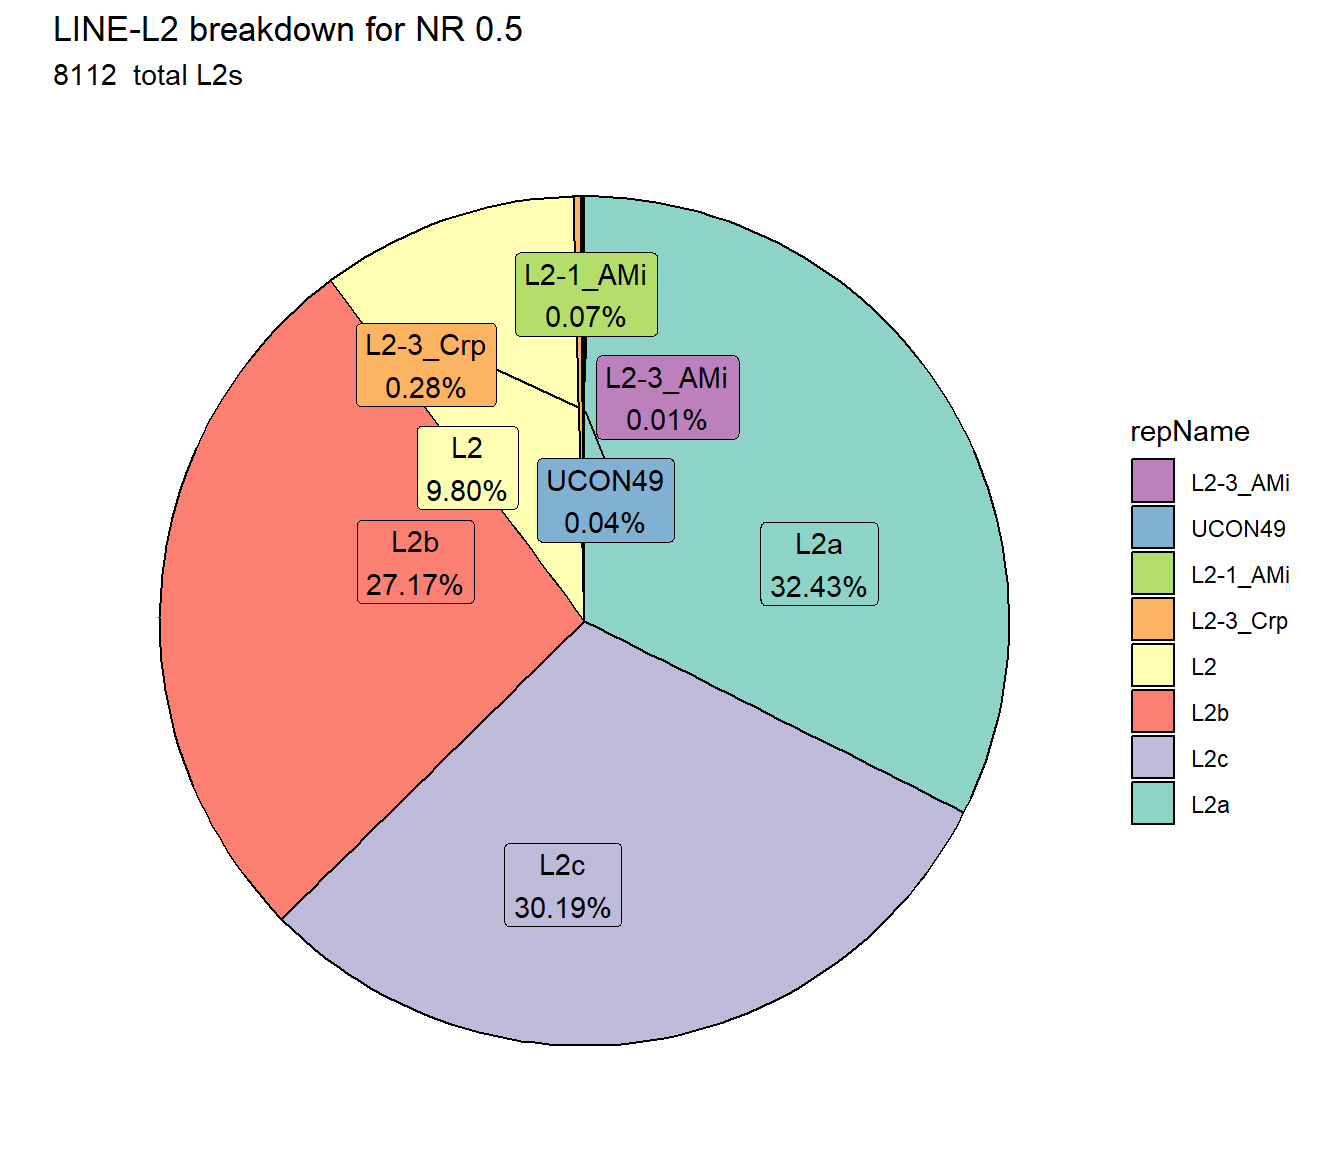
Sine repeats
Sine_df%>%
count(repFamily) %>%
   mutate(perc= n/sum(n)) %>%
   arrange(desc(n)) %>%
  mutate(repFamily = fct_rev(fct_inorder(repFamily))) %>%
  mutate(text_y = cumsum(n) - n/2) %>%
   ggplot(., aes(x = "", y = n, fill = repFamily)) +
  geom_col(color = "black") +
  coord_polar(theta = "y", start = 0)+
  geom_label_repel(aes(label = paste0(repFamily,"\n",sprintf("%.2f",perc*100),"%")),
                     position = position_stack(vjust = .5),
                     force=.9,show.legend = FALSE,max.overlaps = 35) +
  theme_void()+
  ggtitle("Human genome SINE breakdown", subtitle=paste(length(Sine_df$milliIns)))+
  scale_fill_sines()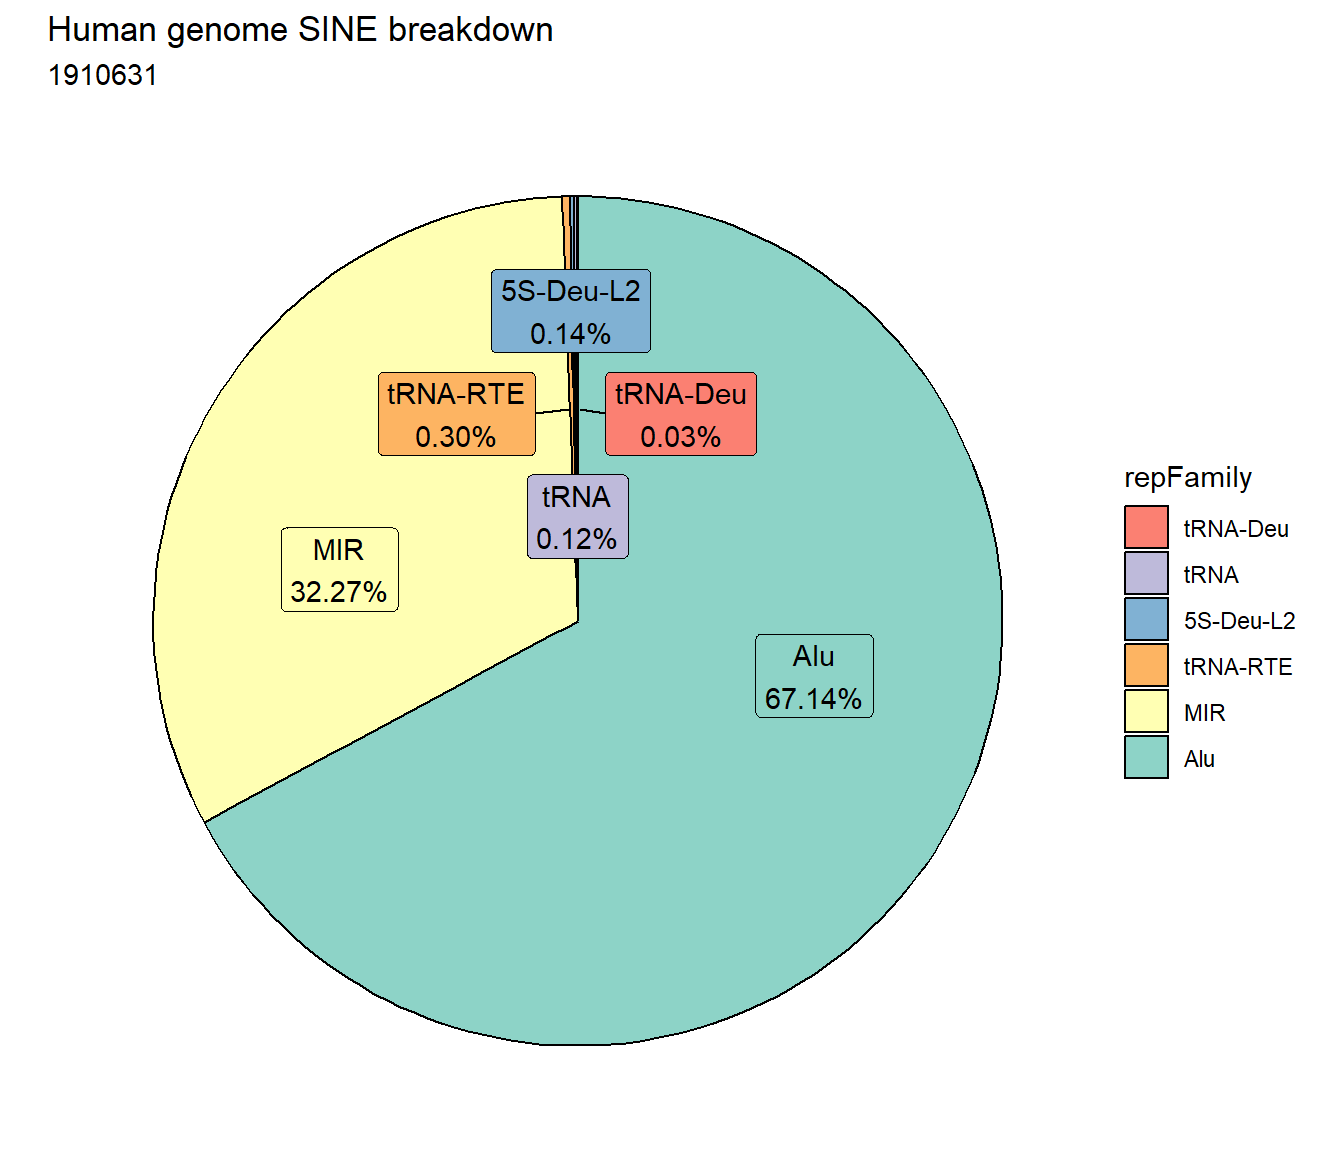
TE_SINE_count <- TE_mrc_status_list %>%
  dplyr::filter(TEstatus =="TE_peak"&repClass=="SINE"&per_ol>per_cov) %>%
  count

TE_mrc_status_list %>%
  dplyr::filter(repClass == "SINE"&per_ol>per_cov) %>%
   mutate(repFamily=factor(repFamily)) %>%
     # group_by(repFamily) %>%
  count(repFamily) %>%
   mutate(perc= n/sum(n)) %>%
   arrange(desc(n)) %>%
  mutate(repFamily = fct_rev(fct_inorder(repFamily))) %>%
  mutate(text_y = cumsum(n) - n/2) %>%
  ggplot(., aes(x = "", y = n, fill = repFamily)) +
  geom_col(color = "black") +
  coord_polar(theta = "y", start = 0)+
  geom_label_repel(aes(label = paste0(repFamily,"\n",sprintf("%.2f",perc*100),"%")),
                     position = position_stack(vjust = .5),
                     force=.9,show.legend = FALSE,max.overlaps = 35) +
   # geom_label_repel(aes(label = n),
   #                   position = position_stack(vjust = .3),
   #                   show.legend = FALSE,max.overlaps = 50) +
  theme_void()+
  ggtitle(paste0("SINE breakdown of peaks ",per_cov),subtitle=paste(TE_SINE_count$n," total SINEs found"))+
  scale_fill_sines()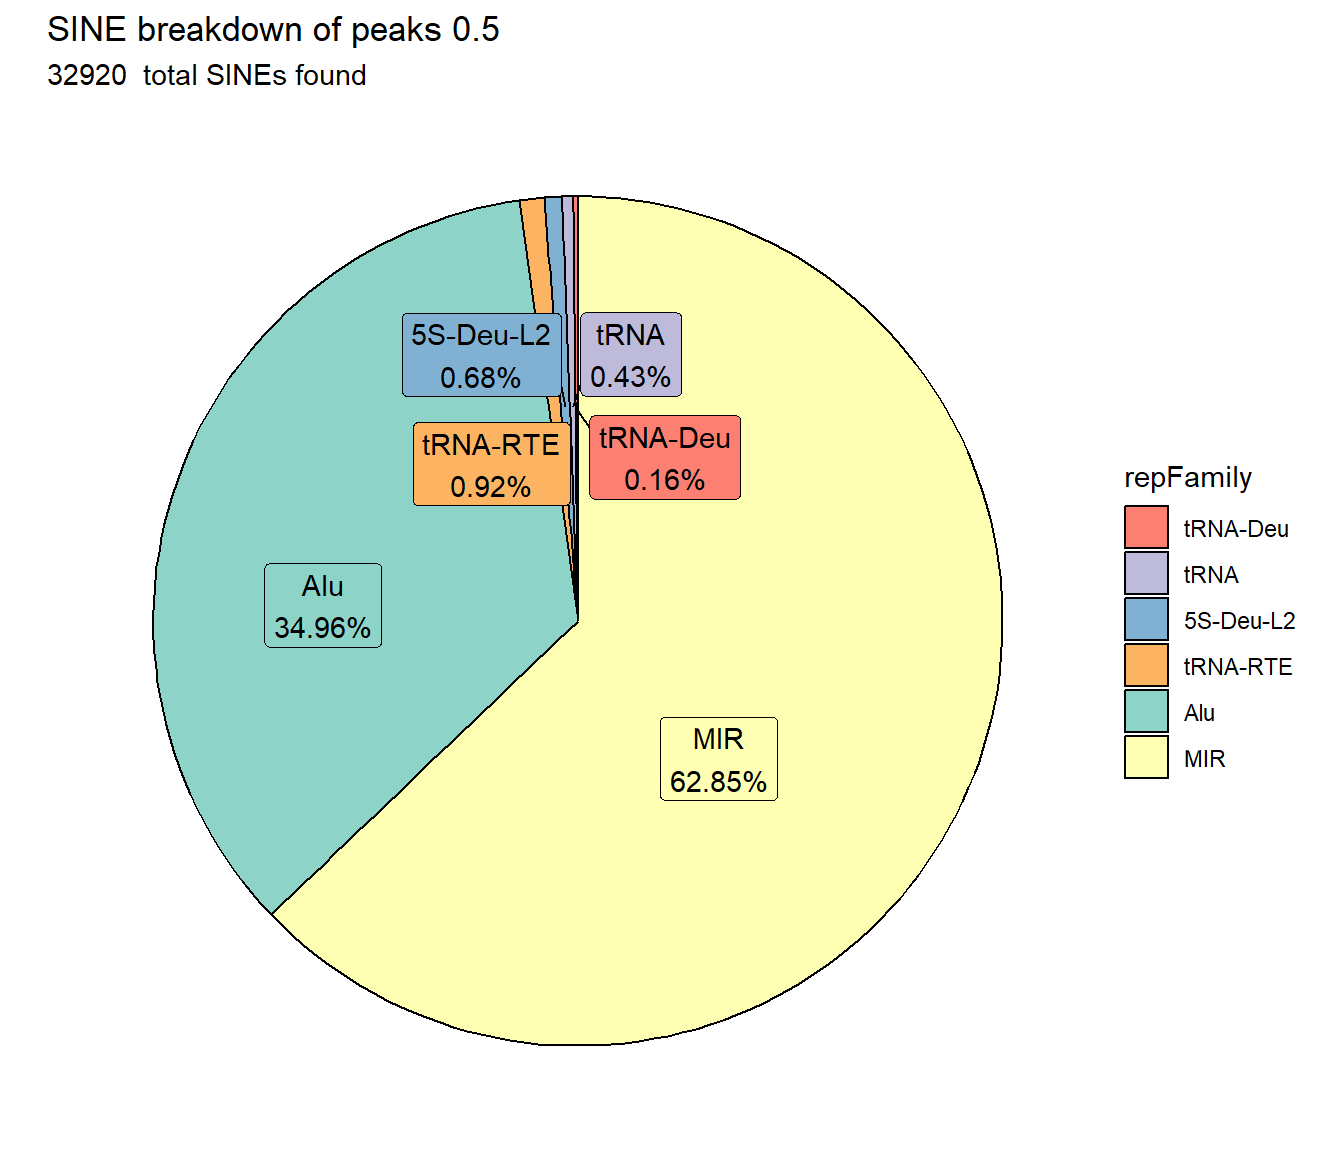
EAR_SINE_count <- TE_mrc_status_list %>%
  dplyr::filter(mrc =="EAR"&repClass=="SINE"&per_ol>per_cov) %>%
  count
ESR_SINE_count <- TE_mrc_status_list %>%
  dplyr::filter(mrc =="ESR"&repClass=="SINE"&per_ol>per_cov) %>%
  count
LR_SINE_count <- TE_mrc_status_list %>%
  dplyr::filter(mrc =="LR"&repClass=="SINE"&per_ol>per_cov) %>%
  count
NR_SINE_count <- TE_mrc_status_list %>%
  dplyr::filter(mrc =="NR"&repClass=="SINE"&per_ol>per_cov) %>%
  count

TE_mrc_status_list %>%
  dplyr::filter(mrc =="EAR"&repClass=="SINE"&per_ol>per_cov) %>%
  mutate(repFamily=factor(repFamily)) %>%
  # group_by(repFamily) %>%
  count(repFamily) %>%
  mutate(perc= n/sum(n)) %>%
  arrange(desc(n)) %>%
  mutate(repFamily = fct_rev(fct_inorder(repFamily))) %>%
  mutate(text_y = cumsum(n) - n/2) %>%
  ggplot(., aes(x = "", y = n, fill = repFamily)) +
  geom_col(color = "black") +
  coord_polar(theta = "y", start = 0)+
  # geom_label_repel(aes(label = n),
  #                    position = position_stack(vjust = .3),
  #                    show.legend = FALSE,max.overlaps = 50) +
  geom_label_repel(aes(label = paste0(repFamily,"\n",sprintf("%.2f",perc*100),"%")),
                     position = position_stack(vjust = .5),
                     force=.9,show.legend = FALSE,max.overlaps = 35) +
  theme_void()+
  ggtitle(paste0("EAR SINE breakdown of peaks ",per_cov),subtitle=paste(EAR_SINE_count$n))+
  scale_fill_sines()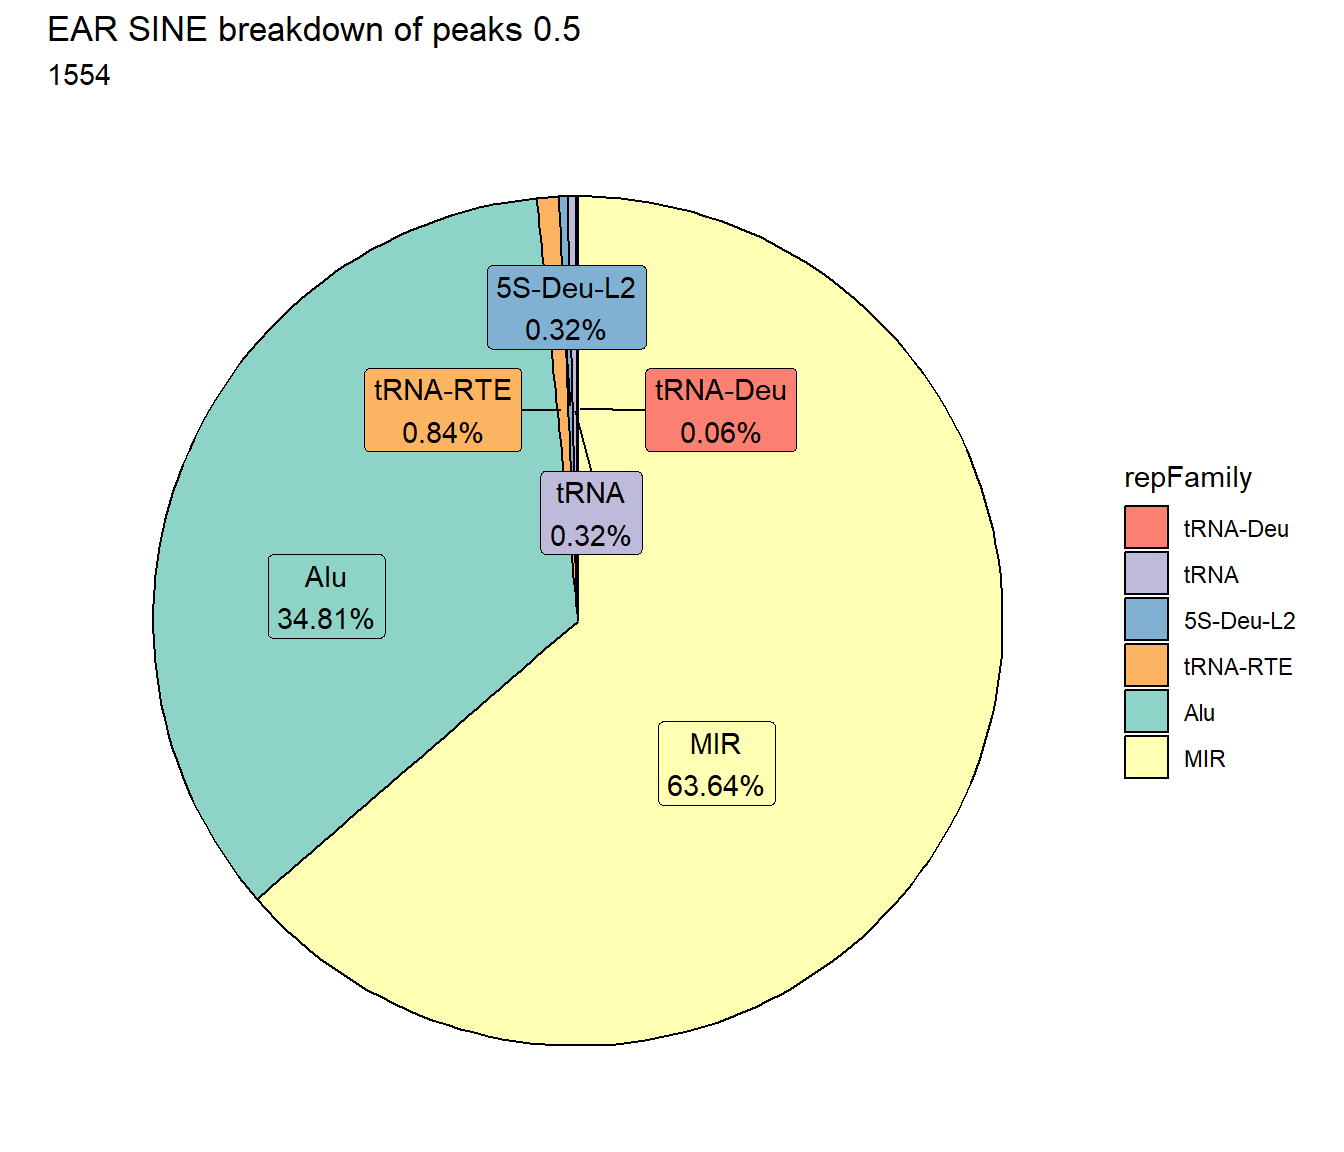
TE_mrc_status_list %>%
  dplyr::filter(mrc =="ESR"&repClass=="SINE"&per_ol>per_cov) %>%
  mutate(repFamily=factor(repFamily)) %>%
  # group_by(repFamily) %>%
  count(repFamily) %>%
  mutate(perc= n/sum(n)) %>%
  arrange(desc(n)) %>%
  mutate(repFamily = fct_rev(fct_inorder(repFamily))) %>%
  mutate(text_y = cumsum(n) - n/2) %>%
  ggplot(., aes(x = "", y = n, fill = repFamily)) +
  geom_col(color = "black") +
  coord_polar(theta = "y", start = 0)+
  geom_label_repel(aes(label = paste0(repFamily,"\n",sprintf("%.2f",perc*100),"%")),
                     position = position_stack(vjust = .5),
                     force=.9,show.legend = FALSE,max.overlaps = 35) +
  # geom_label_repel(aes(label = n),
  #                    position = position_stack(vjust = .3),
  #
  theme_void()+
  ggtitle(paste0("ESR SINE breakdown of peaks ",per_cov),subtitle=paste(ESR_SINE_count$n))+
  scale_fill_sines()
TE_mrc_status_list %>%
  dplyr::filter(mrc =="LR"&repClass=="SINE"&per_ol>per_cov) %>%
  mutate(repFamily=factor(repFamily)) %>%
  # group_by(repFamily) %>%
  count(repFamily) %>%
  mutate(perc= n/sum(n)) %>%
  arrange(desc(n)) %>%
  mutate(repFamily = fct_rev(fct_inorder(repFamily))) %>%
  mutate(text_y = cumsum(n) - n/2) %>%
  ggplot(., aes(x = "", y = n, fill = repFamily)) +
  geom_col(color = "black") +
  coord_polar(theta = "y", start = 0)+
  # geom_label_repel(aes(label = n),
  #                    position = position_stack(vjust = .3),
  #                    show.legend = FALSE,max.overlaps = 50) +
  geom_label_repel(aes(label = paste0(repFamily,"\n",sprintf("%.2f",perc*100),"%")),
                     position = position_stack(vjust = .5),
                     force=.9,show.legend = FALSE,max.overlaps = 35) +
  theme_void()+
  ggtitle(paste0("LR SINE breakdown of peaks ",per_cov),subtitle=paste(LR_SINE_count$n))+
  scale_fill_sines()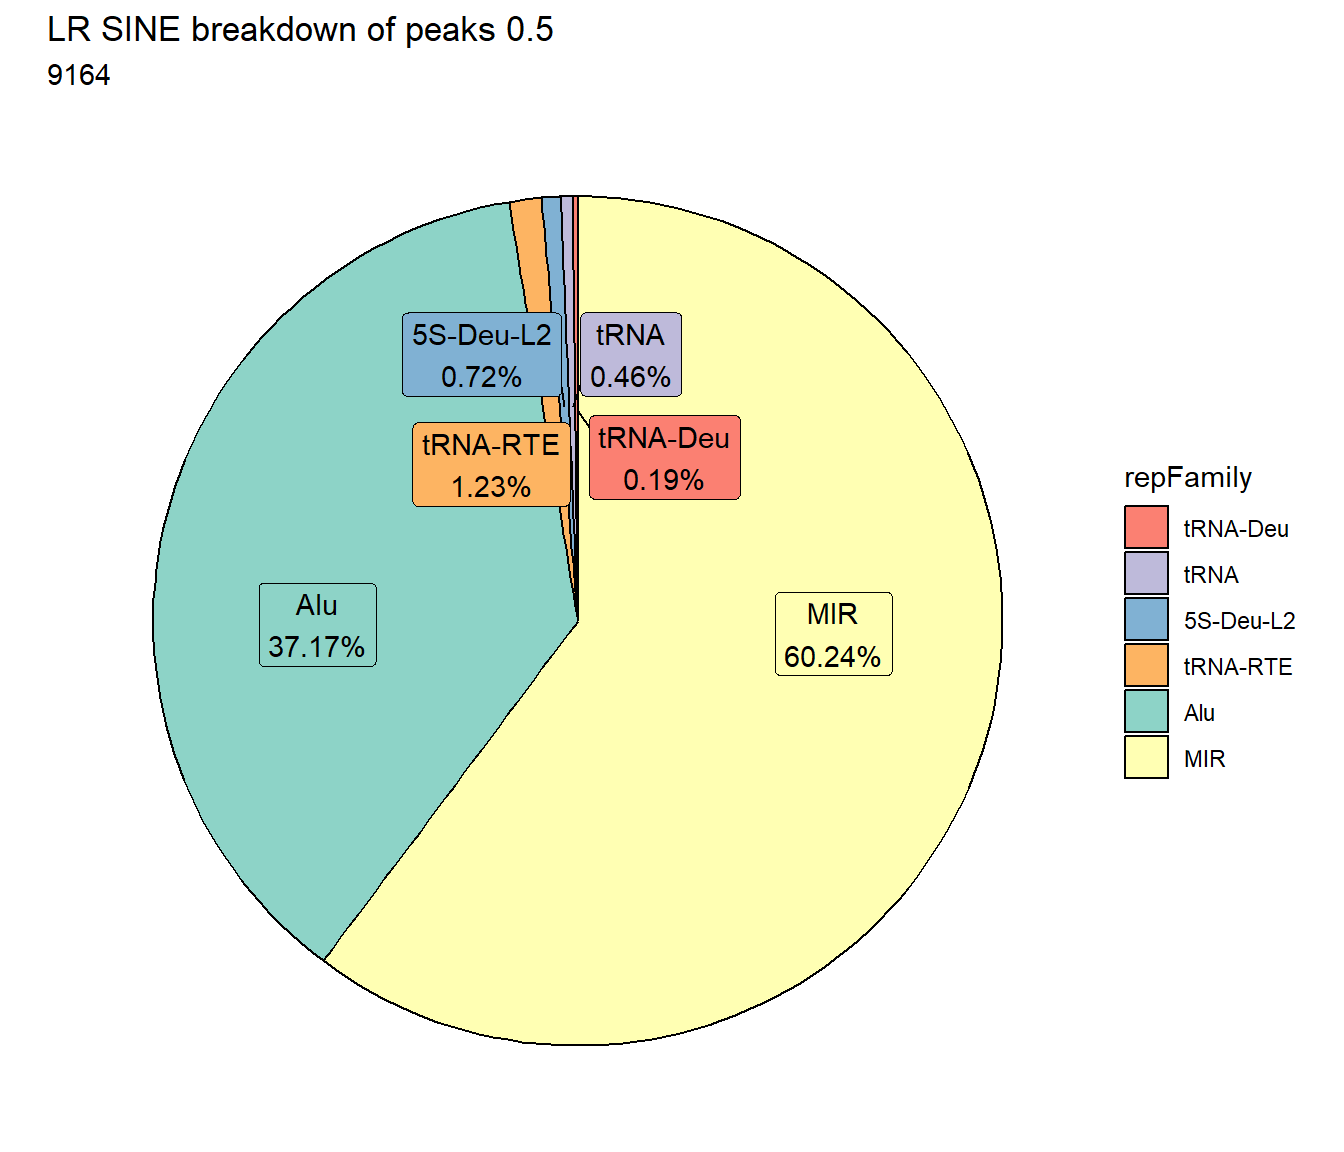
TE_mrc_status_list %>%
dplyr::filter(mrc =="NR"&repClass=="SINE"&per_ol>per_cov) %>%
mutate(repFamily=factor(repFamily)) %>%
# group_by(repFamily) %>%
count(repFamily) %>%
mutate(perc= n/sum(n)) %>%
arrange(desc(n)) %>%
mutate(repFamily = fct_rev(fct_inorder(repFamily))) %>%
mutate(text_y = cumsum(n) - n/2) %>%
ggplot(., aes(x = "", y = n, fill = repFamily)) +
geom_col(color = "black") +
coord_polar(theta = "y", start = 0)+
# geom_label_repel(aes(label = n),
# position = position_stack(vjust = .3),
# show.legend = FALSE,max.overlaps = 50) +
geom_label_repel(aes(label = paste0(repFamily,"\n",sprintf("%.2f",perc*100),"%")),
position = position_stack(vjust = .5),
force=.9,show.legend = FALSE,max.overlaps = 35) +
theme_void()+
ggtitle(paste0("NR SINE breakdown of peaks ",per_cov),subtitle=paste(NR_SINE_count$n))+
scale_fill_sines()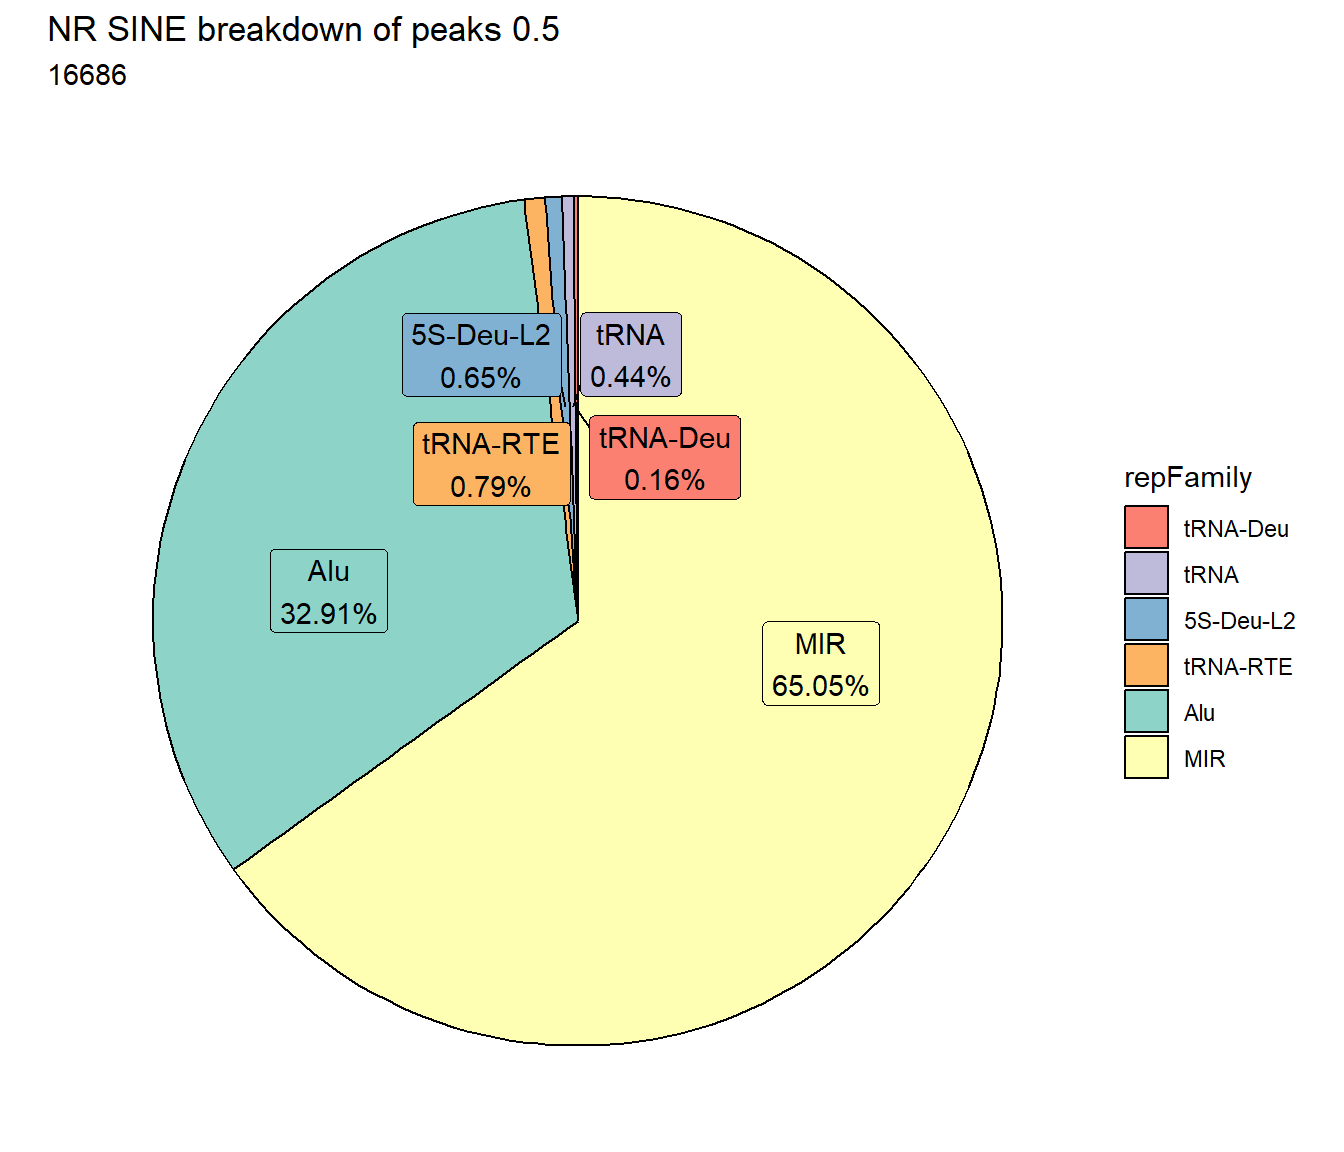 #### LTR repeats
per_cov <- 0.5


LTR_df%>%
count(repFamily) %>%
   mutate(perc= n/sum(n)) %>%
   arrange(desc(n)) %>%
  mutate(repFamily = fct_rev(fct_inorder(repFamily))) %>%
  mutate(text_y = cumsum(n) - n/2) %>%
   ggplot(., aes(x = "", y = n, fill = repFamily)) +
  geom_col(color = "black") +
  coord_polar(theta = "y", start = 0)+
  geom_label_repel(aes(label = paste0(repFamily,"\n",sprintf("%.2f",perc*100),"%")),
                     position = position_stack(vjust = .5),
                     force=.9,show.legend = FALSE,max.overlaps = 35) +
  theme_void()+
  ggtitle("Human genome LTR breakdown", subtitle=paste(length(LTR_df$milliIns)))+
  scale_fill_LTRs()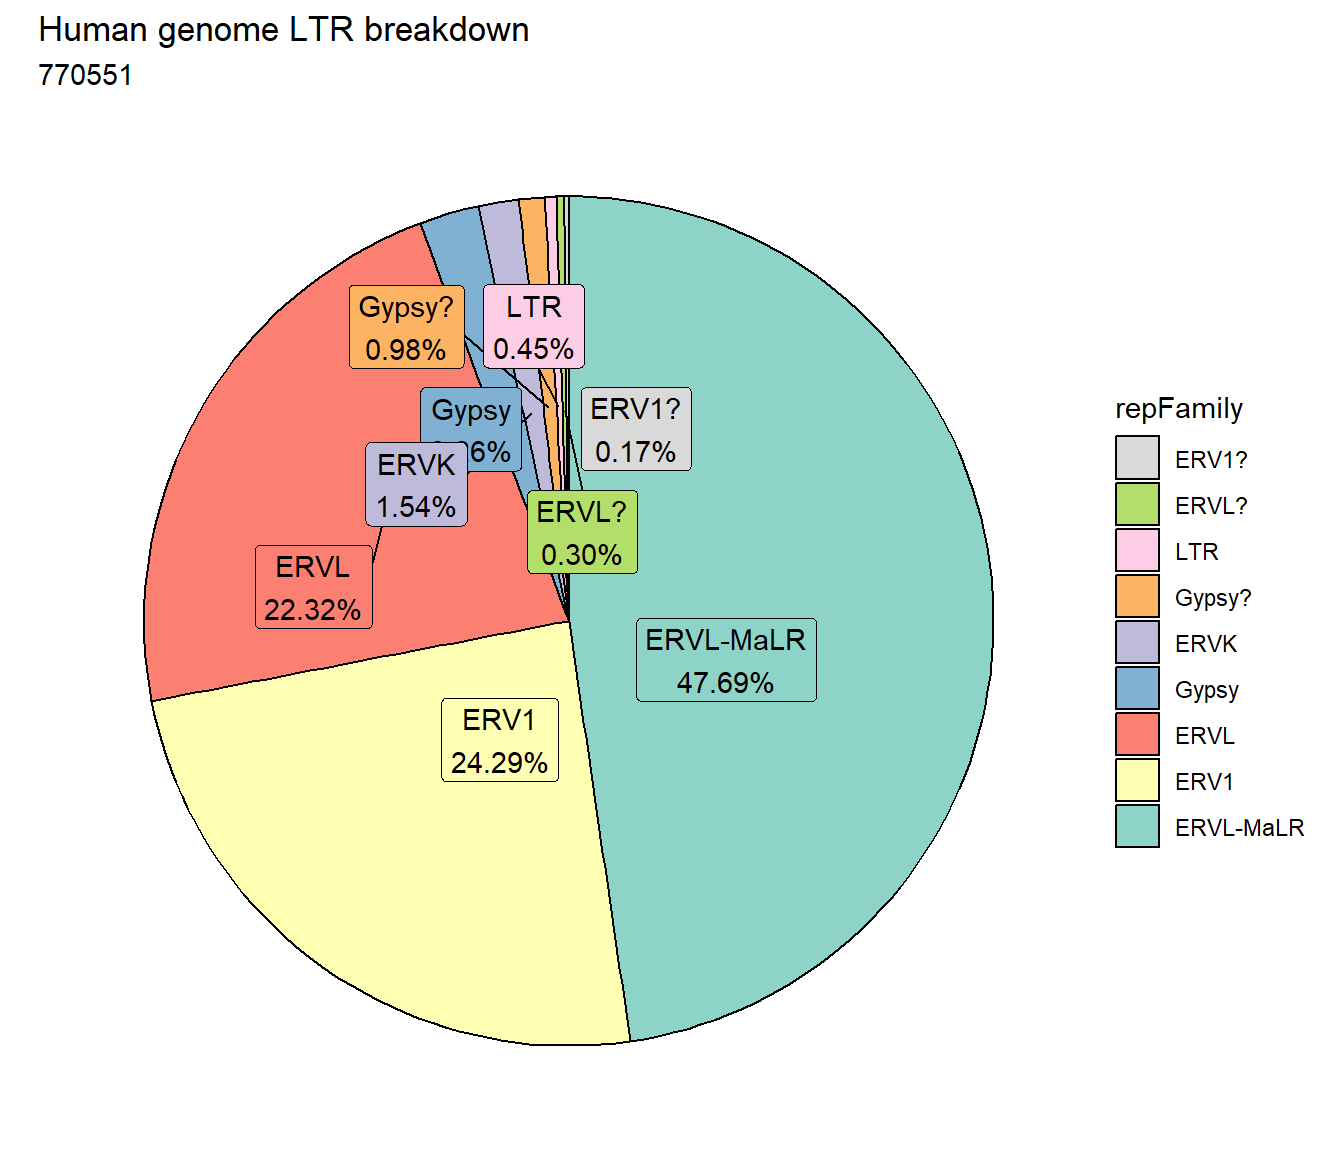
LTR_count <- TE_mrc_status_list %>%
  dplyr::filter(repClass=="LTR"&per_ol> per_cov) %>%
  count
EAR_LTR_count <- TE_mrc_status_list %>%
  dplyr::filter(mrc =="EAR"&repClass=="LTR"&per_ol> per_cov) %>%
  count
ESR_LTR_count <- TE_mrc_status_list %>%
  dplyr::filter(mrc =="ESR"&repClass=="LTR"&per_ol> per_cov) %>%
  count
LR_LTR_count <- TE_mrc_status_list %>%
  dplyr::filter(mrc =="LR"&repClass=="LTR"&per_ol> per_cov) %>%
  count
NR_LTR_count <- TE_mrc_status_list %>%
  dplyr::filter(mrc =="NR"&repClass=="LTR"&per_ol> per_cov) %>%
  count

TE_mrc_status_list %>%
  dplyr::filter(repClass=="LTR"&per_ol> per_cov) %>%
  mutate(repFamily=factor(repFamily)) %>%
  # group_by(repFamily) %>%
  count(repFamily) %>%
  mutate(perc= n/sum(n)) %>%
  arrange(desc(n)) %>%
  mutate(repFamily = fct_rev(fct_inorder(repFamily))) %>%
  mutate(text_y = cumsum(n) - n/2) %>%
  ggplot(., aes(x = "", y = n, fill = repFamily)) +
  geom_col(color = "black") +
  coord_polar(theta = "y", start = 0)+
  geom_label_repel(aes(label = paste0(repFamily,"\n",sprintf("%.2f",perc*100),"%")),
                     position = position_stack(vjust = .5),
                     force=.9,show.legend = FALSE,max.overlaps = 35) +
  theme_void()+
  ggtitle(paste("All peaks LTR breakdown of peaks",per_cov),subtitle=paste(LTR_count$n))+
  scale_fill_LTRs()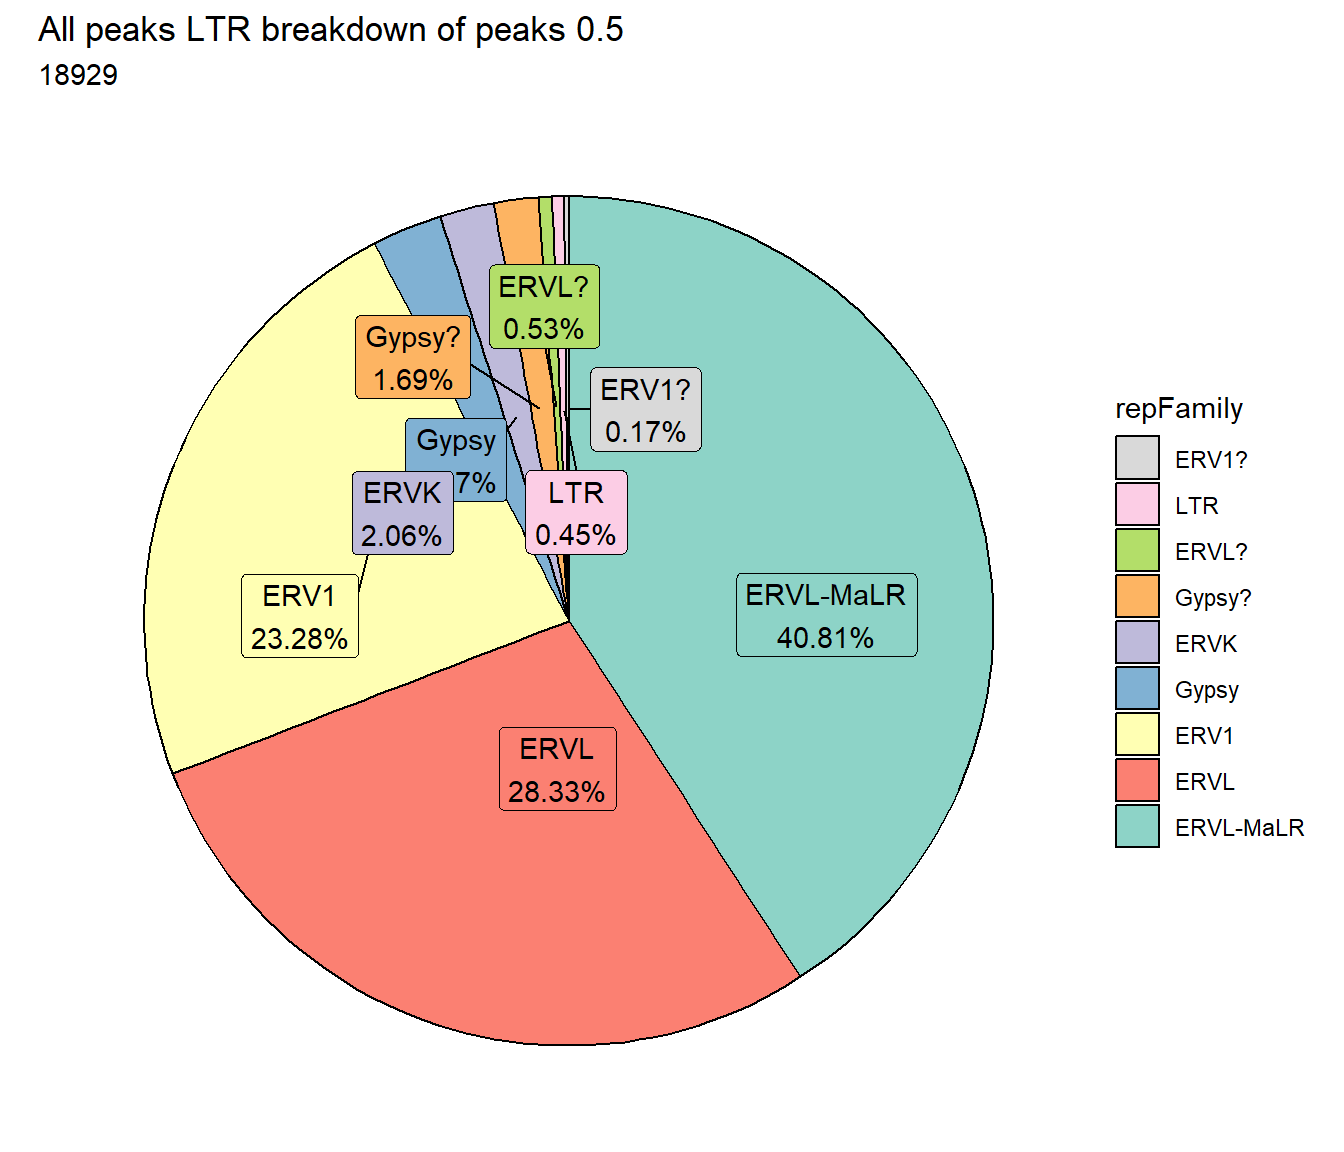
TE_mrc_status_list %>%
  dplyr::filter(mrc =="EAR"&repClass=="LTR"&per_ol> per_cov) %>%
  mutate(repFamily=factor(repFamily)) %>%
  # group_by(repFamily) %>%
  count(repFamily) %>%
  mutate(perc= n/sum(n)) %>%
  arrange(desc(n)) %>%
  mutate(repFamily = fct_rev(fct_inorder(repFamily))) %>%
  mutate(text_y = cumsum(n) - n/2) %>%
  ggplot(., aes(x = "", y = n, fill = repFamily)) +
  geom_col(color = "black") +
  coord_polar(theta = "y", start = 0)+
  geom_label_repel(aes(label = paste0(repFamily,"\n",sprintf("%.2f",perc*100),"%")),
                     position = position_stack(vjust = .5),
                     force=.9,show.legend = FALSE,max.overlaps = 35) +
  theme_void()+
  ggtitle(paste("EAR LTR breakdown of peaks",per_cov),subtitle=paste(EAR_LTR_count$n))+
  scale_fill_LTRs()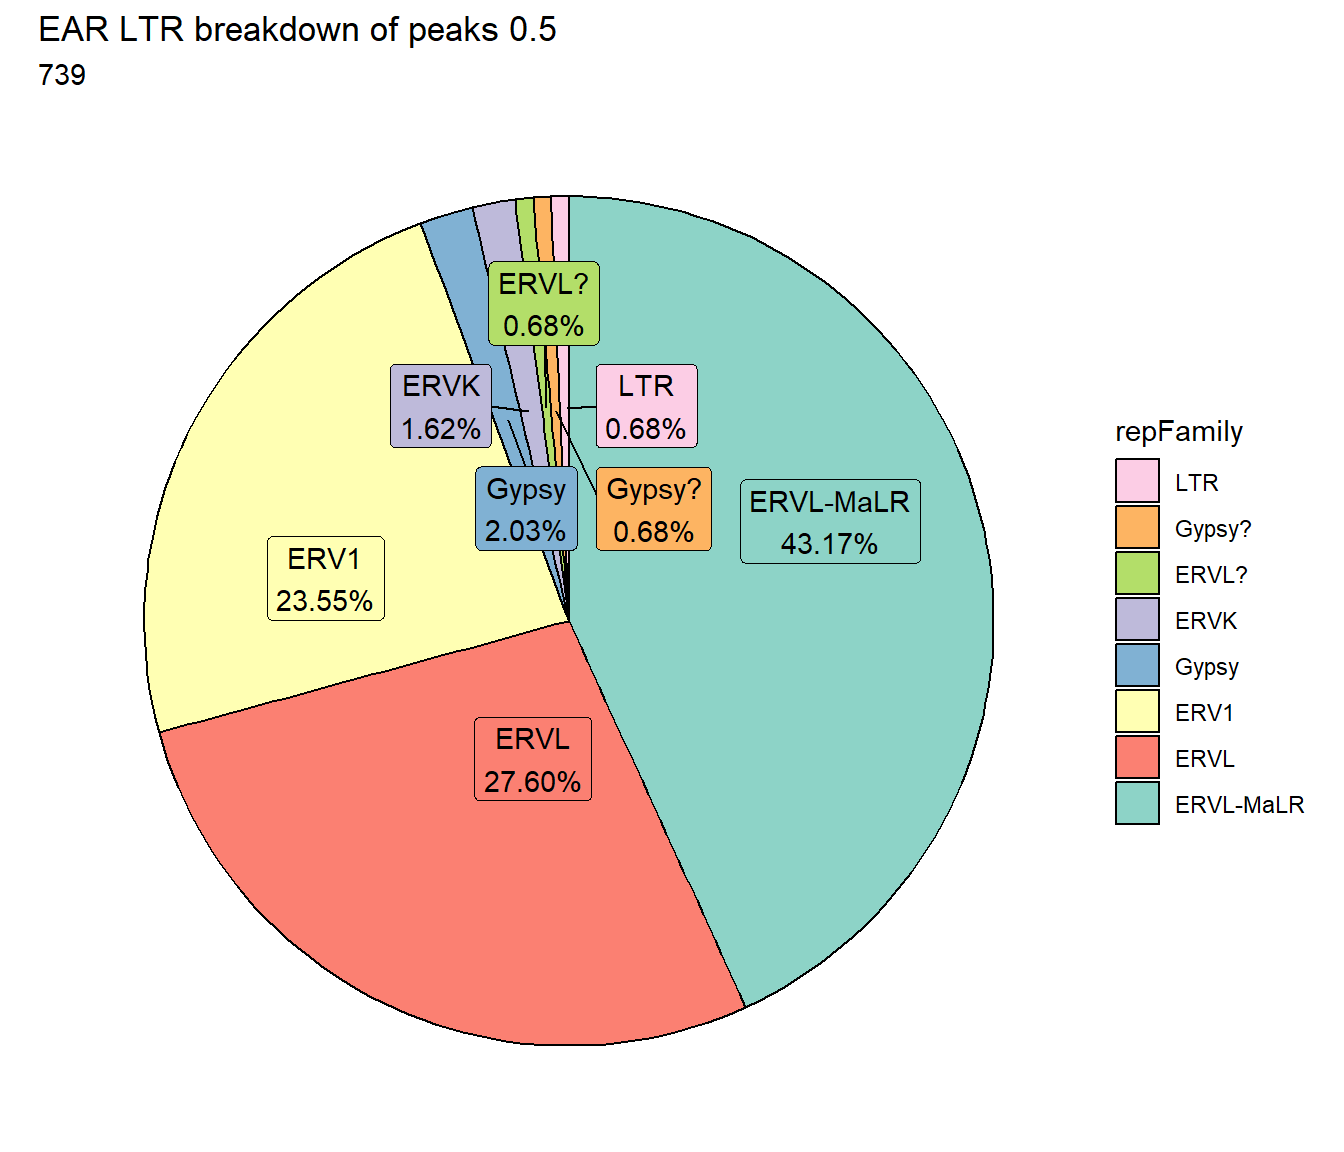
TE_mrc_status_list %>%
  dplyr::filter(mrc =="ESR"&repClass=="LTR"&per_ol> per_cov) %>%
  mutate(repFamily=factor(repFamily)) %>%
  # group_by(repFamily) %>%
  count(repFamily) %>%
  mutate(perc= n/sum(n)) %>%
  arrange(desc(n)) %>%
  mutate(repFamily = fct_rev(fct_inorder(repFamily))) %>%
  mutate(text_y = cumsum(n) - n/2) %>%
  ggplot(., aes(x = "", y = n, fill = repFamily)) +
  geom_col(color = "black") +
  coord_polar(theta = "y", start = 0)+
  geom_label_repel(aes(label = paste0(repFamily,"\n",sprintf("%.2f",perc*100),"%")),
                     position = position_stack(vjust = .5),
                     force=.9,show.legend = FALSE,max.overlaps = 35) +
  theme_void()+
  ggtitle(paste("ESR LTR breakdown of peaks",per_cov),subtitle=paste(ESR_LTR_count$n))+
  scale_fill_LTRs()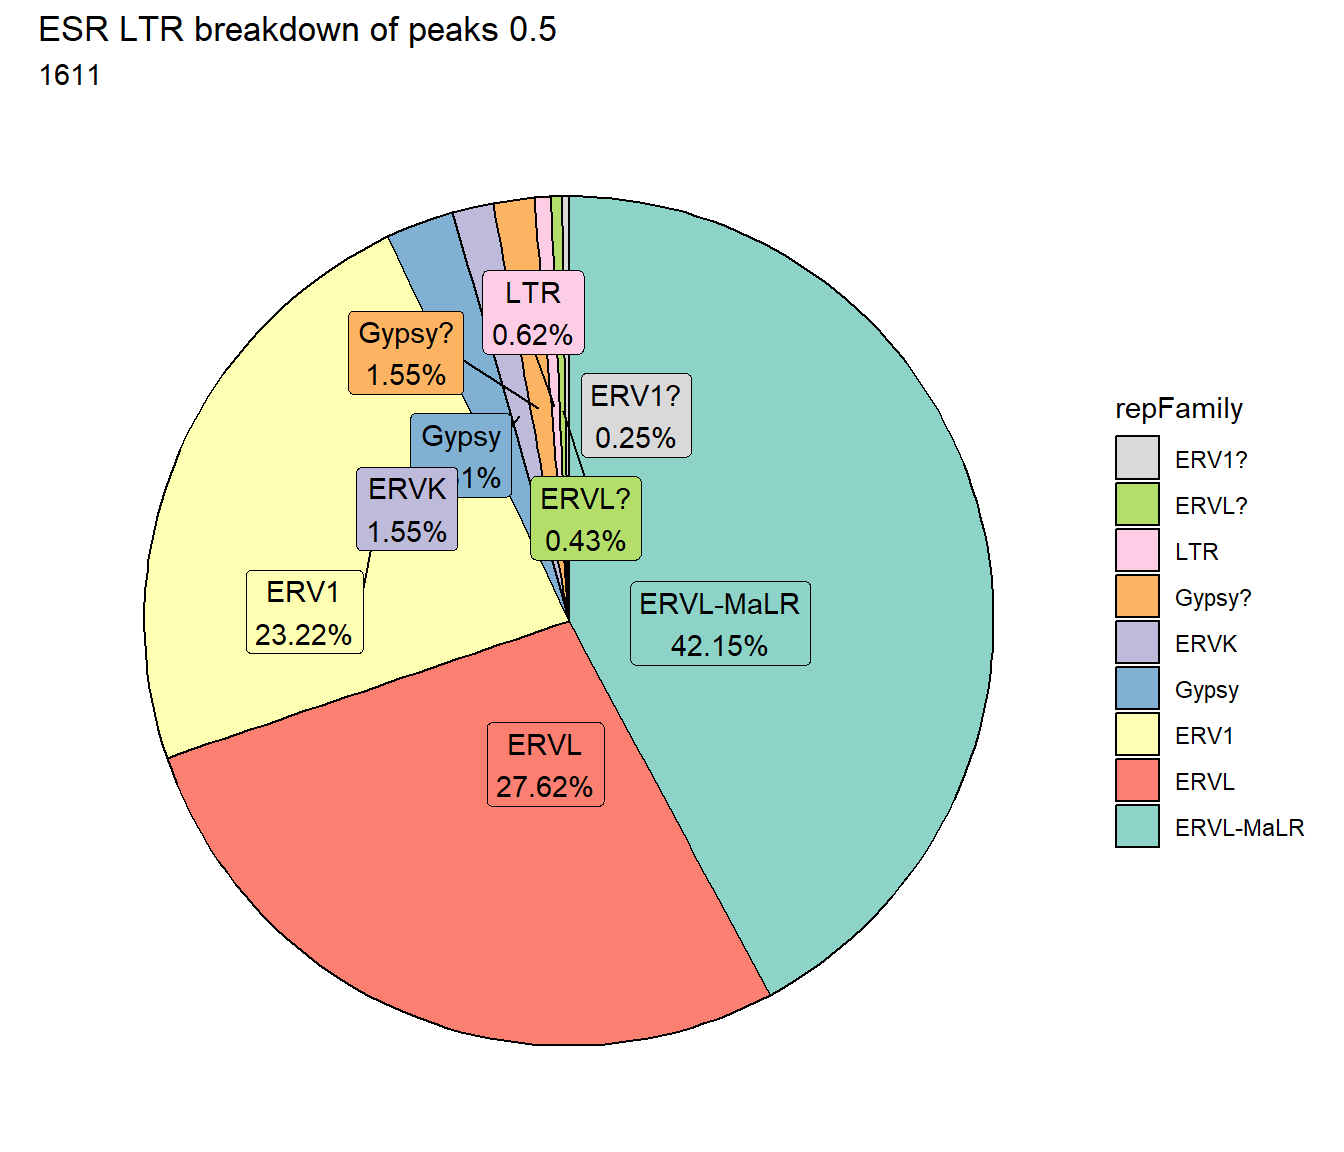
TE_mrc_status_list %>%
  dplyr::filter(mrc =="LR"&repClass=="LTR"&per_ol> per_cov) %>%
  mutate(repFamily=factor(repFamily)) %>%
  # group_by(repFamily) %>%
  count(repFamily) %>%
  mutate(perc= n/sum(n)) %>%
  arrange(desc(n)) %>%
  mutate(repFamily = fct_rev(fct_inorder(repFamily))) %>%
  mutate(text_y = cumsum(n) - n/2) %>%
  ggplot(., aes(x = "", y = n, fill = repFamily)) +
  geom_col(color = "black") +
  coord_polar(theta = "y", start = 0)+
  geom_label_repel(aes(label = paste0(repFamily,"\n",sprintf("%.2f",perc*100),"%")),
                     position = position_stack(vjust = .5),
                     force=.9,show.legend = FALSE,max.overlaps = 35) +
  theme_void()+
  ggtitle(paste("LR LTR breakdown of peaks ",per_cov),subtitle=paste(LR_LTR_count$n))+
  scale_fill_LTRs()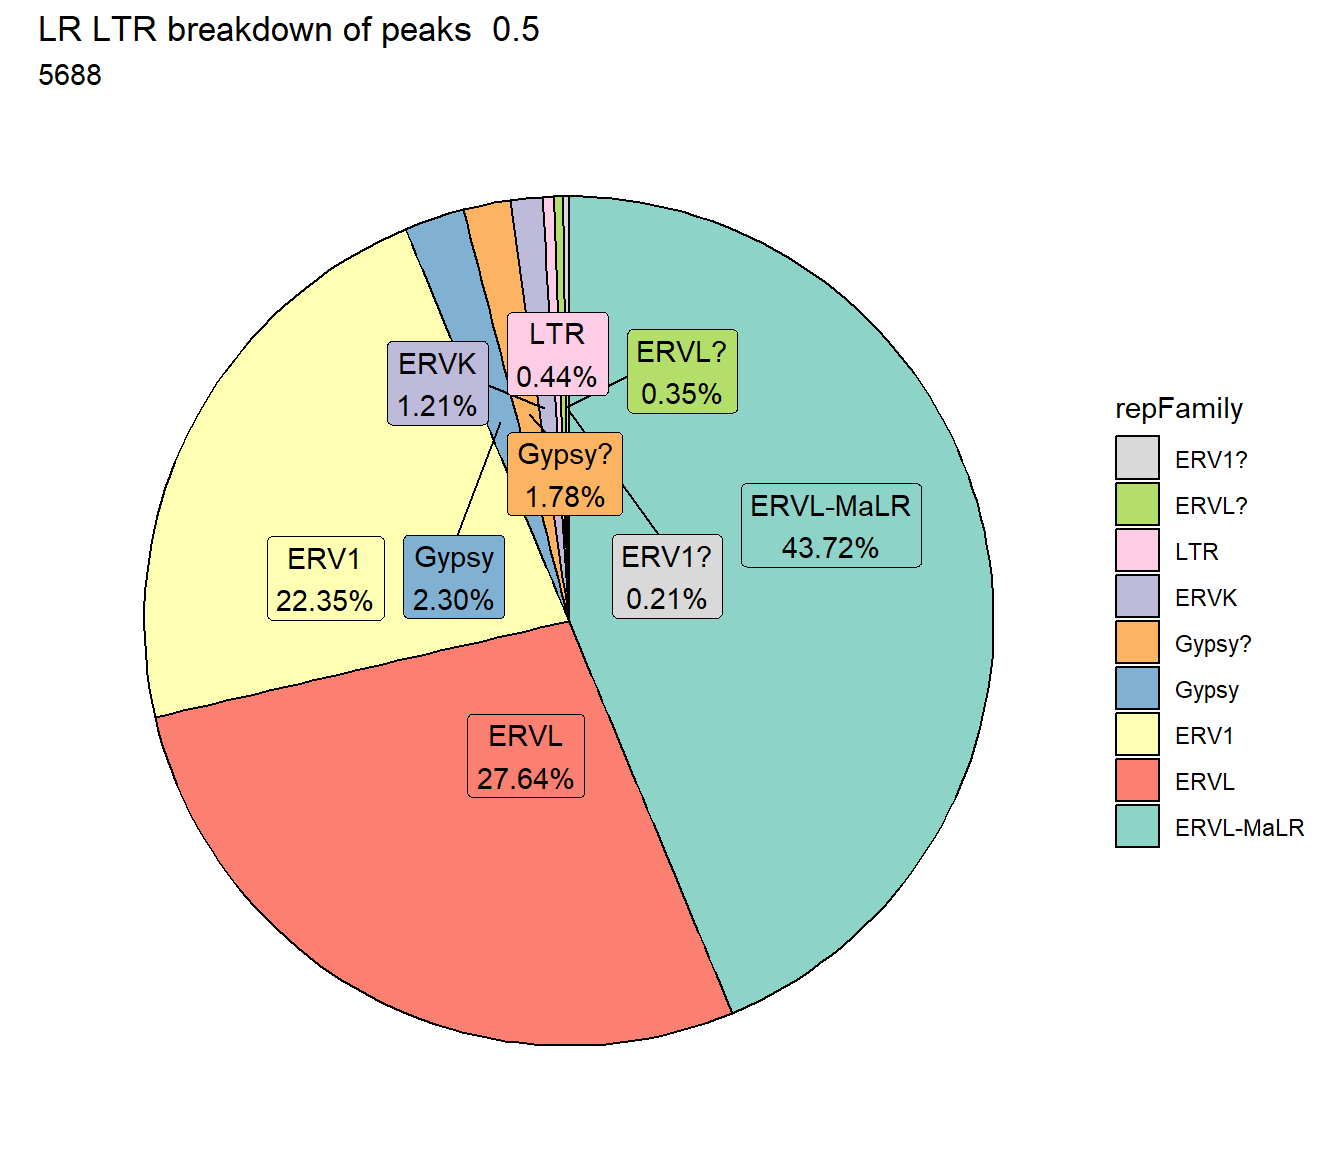
TE_mrc_status_list %>%
dplyr::filter(mrc =="NR"&repClass=="LTR"&per_ol> per_cov) %>%
mutate(repFamily=factor(repFamily)) %>%
# group_by(repFamily) %>%
count(repFamily) %>%
mutate(perc= n/sum(n)) %>%
arrange(desc(n)) %>%
mutate(repFamily = fct_rev(fct_inorder(repFamily))) %>%
mutate(text_y = cumsum(n) - n/2) %>%
ggplot(., aes(x = "", y = n, fill = repFamily)) +
geom_col(color = "black") +
coord_polar(theta = "y", start = 0)+
geom_label_repel(aes(label = paste0(repFamily,"\n",sprintf("%.2f",perc*100),"%")),
position = position_stack(vjust = .5),
force=.9,show.legend = FALSE,max.overlaps = 35) +
theme_void()+
ggtitle(paste("NR LTR breakdown of peaks", per_cov),subtitle=paste(NR_LTR_count$n))+
scale_fill_LTRs()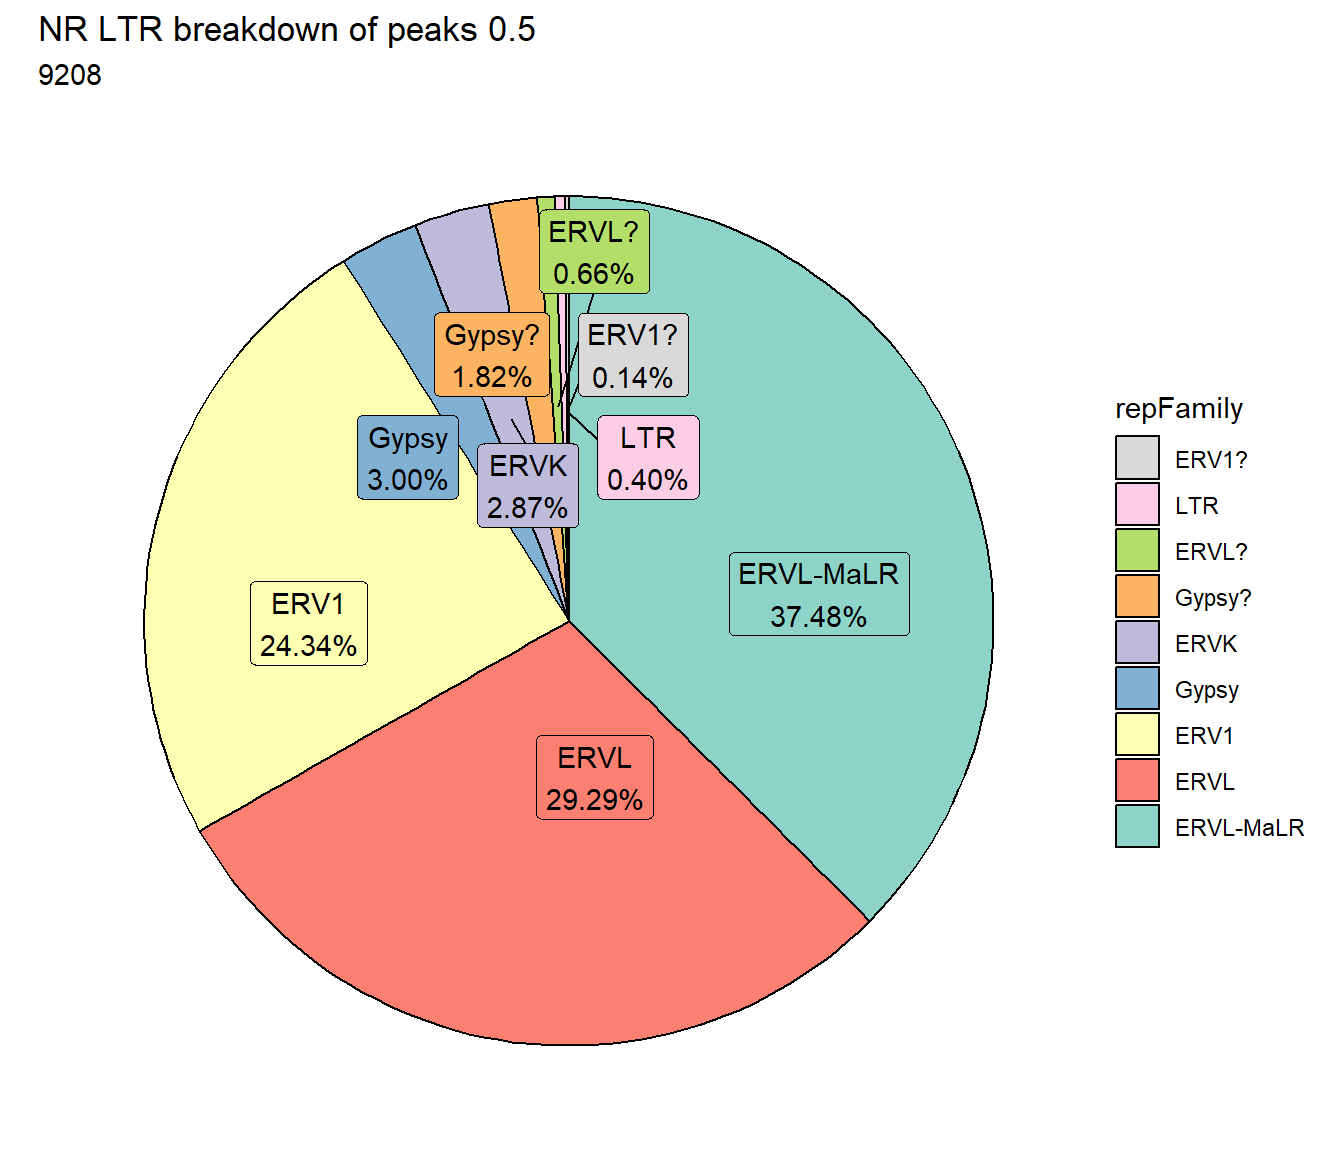 #### DNA TEs
per_cov <- 0.5

DNA_df%>%
count(repFamily) %>%
   mutate(perc= n/sum(n)) %>%
   arrange(desc(n)) %>%
  mutate(repFamily = fct_rev(fct_inorder(repFamily))) %>%
  mutate(text_y = cumsum(n) - n/2) %>%
   ggplot(., aes(x = "", y = n, fill = repFamily)) +
  geom_col(color = "black") +
  coord_polar(theta = "y", start = 0)+
  geom_label_repel(aes(label = paste0(repFamily,"\n",sprintf("%.2f",perc*100),"%")),
                     position = position_stack(vjust = .5),
                     force=.9,show.legend = FALSE,max.overlaps = 50) +
  theme_void()+
  ggtitle("Human genome DNA breakdown", subtitle=paste(length(DNA_df$milliIns)))+
  scale_fill_DNAs()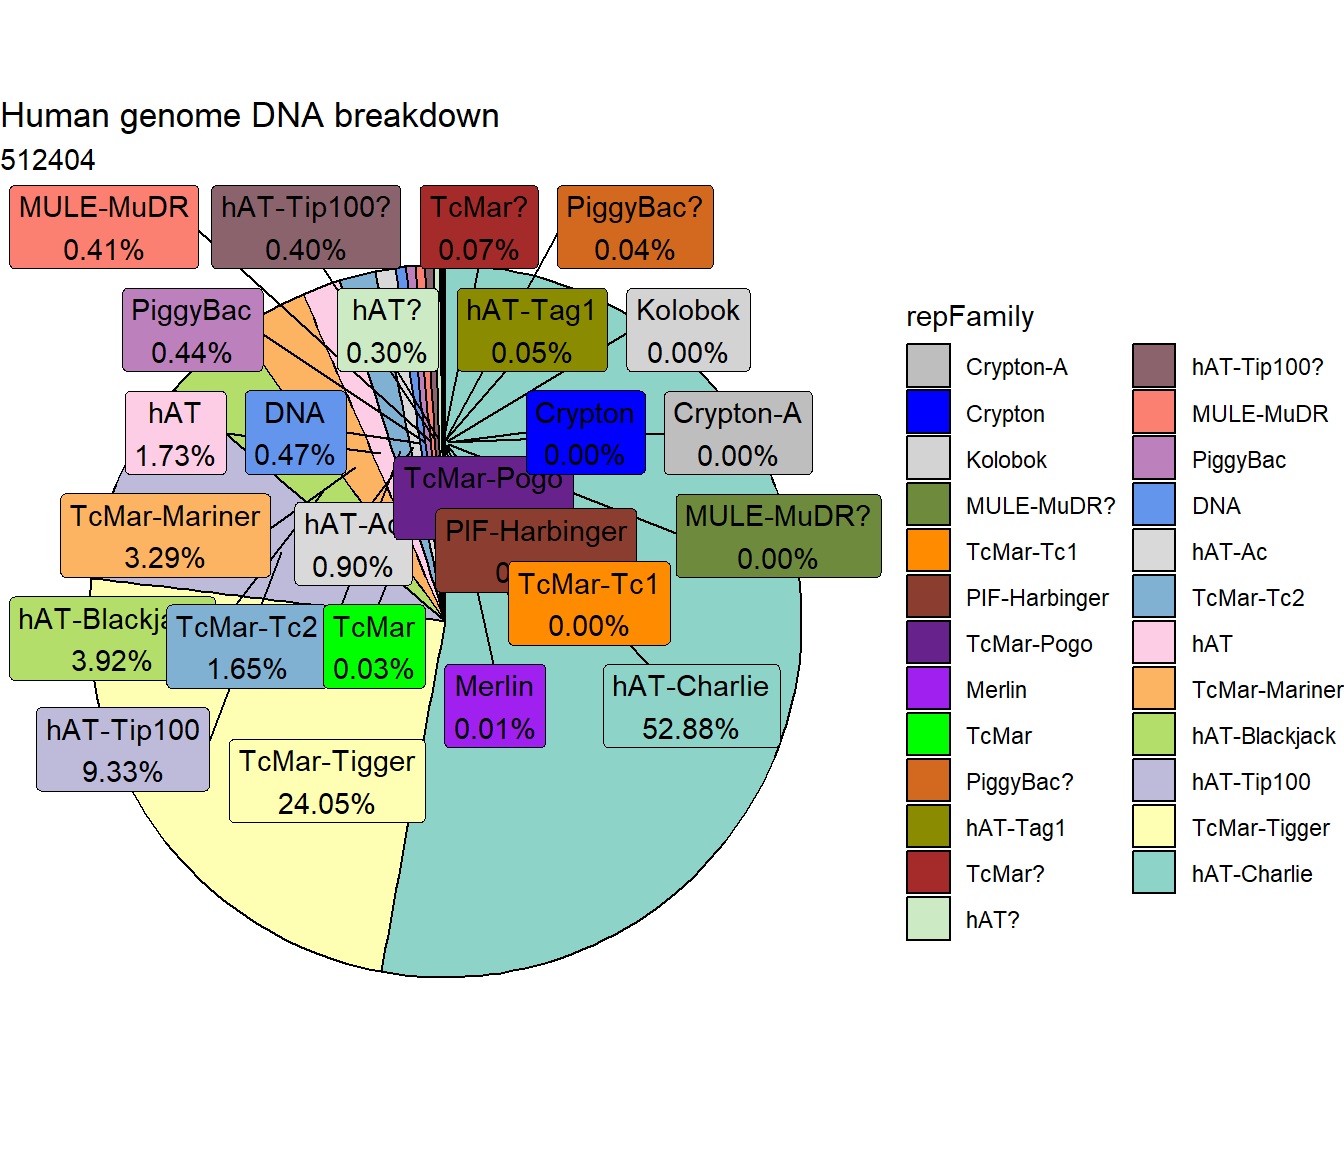
TE_DNA_count <- TE_mrc_status_list %>%
  dplyr::filter(TEstatus =="TE_peak"&repClass=="DNA"&per_ol>per_cov) %>%
  count

TE_mrc_status_list %>%
  dplyr::filter(repClass == "DNA"&per_ol>per_cov) %>%
   mutate(repFamily=factor(repFamily)) %>%
     # group_by(repFamily) %>%
  count(repFamily) %>%
   mutate(perc= n/sum(n)) %>%
   arrange(desc(n)) %>%
  mutate(repFamily = fct_rev(fct_inorder(repFamily))) %>%
  mutate(text_y = cumsum(n) - n/2) %>%
  ggplot(., aes(x = "", y = n, fill = repFamily)) +
  geom_col(color = "black") +
  coord_polar(theta = "y", start = 0)+
   # geom_label(aes(label = repClass),
   #          position = position_stack(vjust = .8)) +
  # geom_label(aes(label=repClass, y=text_y))
  geom_label_repel(aes(label = paste0(repFamily,"\n",sprintf("%.2f",perc*100),"%")),
                     position = position_stack(vjust = .5),
                     force=.9,show.legend = FALSE,max.overlaps = 35) +
  theme_void()+
  ggtitle(paste("DNA breakdown of peaks", per_cov),subtitle=paste(TE_DNA_count$n))+
  scale_fill_DNAs()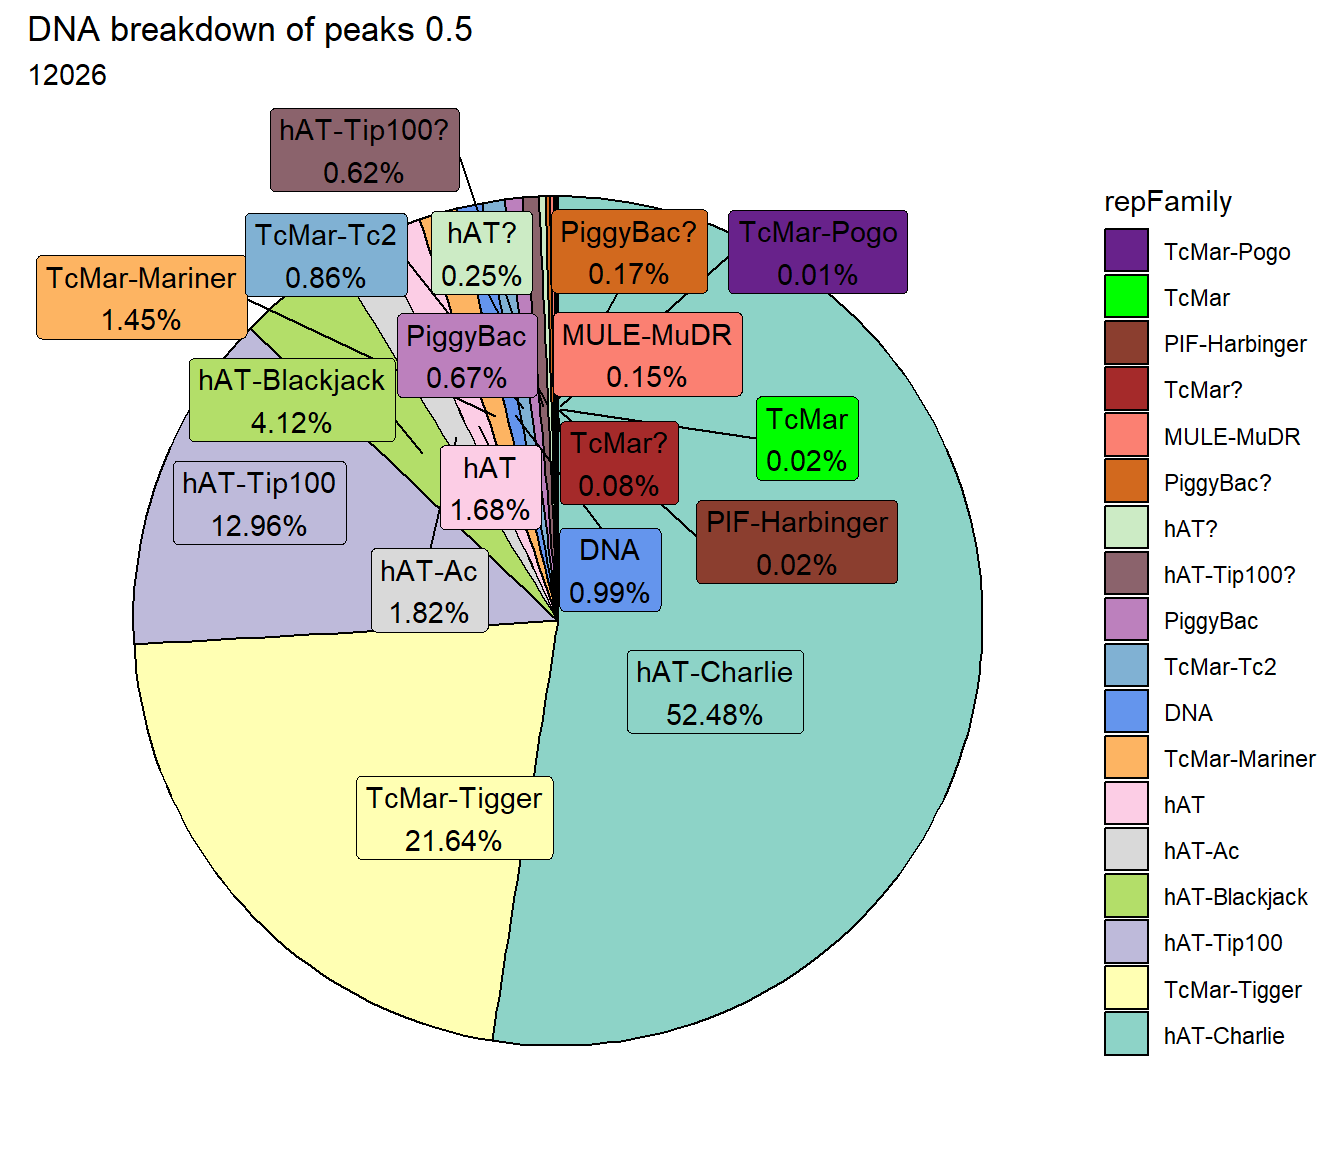
EAR_DNA_count <- TE_mrc_status_list %>%
  dplyr::filter(mrc =="EAR"&repClass=="DNA"&per_ol>per_cov) %>%
  count
ESR_DNA_count <- TE_mrc_status_list %>%
  dplyr::filter(mrc =="ESR"&repClass=="DNA"&per_ol>per_cov) %>%
  count
LR_DNA_count <- TE_mrc_status_list %>%
  dplyr::filter(mrc =="LR"&repClass=="DNA"&per_ol>per_cov) %>%
  count
NR_DNA_count <- TE_mrc_status_list %>%
  dplyr::filter(mrc =="NR"&repClass=="DNA"&per_ol>per_cov) %>%
  count


TE_mrc_status_list %>%
  dplyr::filter(mrc =="EAR"&repClass=="DNA"&per_ol>per_cov) %>%
  mutate(repFamily=factor(repFamily)) %>%
  # group_by(repFamily) %>%
  count(repFamily) %>%
  mutate(perc= n/sum(n)) %>%
  arrange(desc(n)) %>%
  mutate(repFamily = fct_rev(fct_inorder(repFamily))) %>%
  mutate(text_y = cumsum(n) - n/2) %>%
  ggplot(., aes(x = "", y = n, fill = repFamily)) +
  geom_col(color = "black") +
  coord_polar(theta = "y", start = 0)+
  # geom_label_repel(aes(label = n),
  #                    position = position_stack(vjust = .3),
  #                    show.legend = FALSE,max.overlaps = 50) +
  geom_label_repel(aes(label = paste0(repFamily,"\n",sprintf("%.2f",perc*100),"%")),
                     position = position_stack(vjust = .5),
                     force=.9,show.legend = FALSE,max.overlaps = 35) +
  theme_void()+
  ggtitle(paste("EAR DNA breakdown of peaks",per_cov),subtitle=paste(EAR_DNA_count$n))+
  scale_fill_DNAs()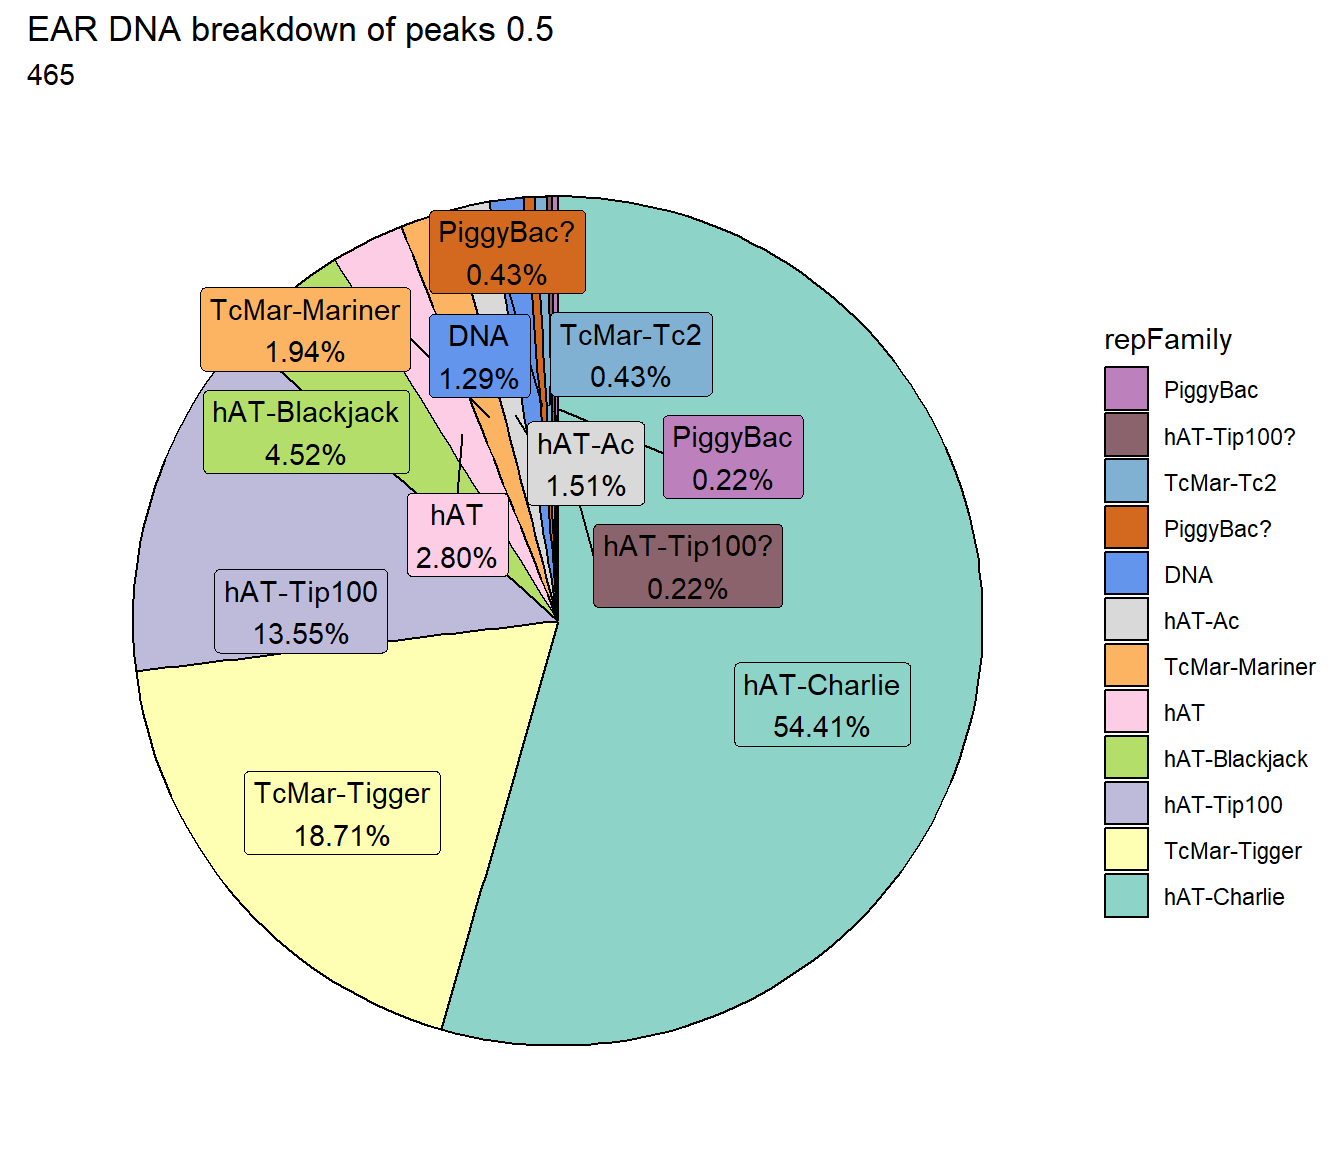
TE_mrc_status_list %>%
  dplyr::filter(mrc =="ESR"&repClass=="DNA"&per_ol>per_cov) %>%
  mutate(repFamily=factor(repFamily)) %>%
  # group_by(repFamily) %>%
  count(repFamily) %>%
  mutate(perc= n/sum(n)) %>%
  arrange(desc(n)) %>%
  mutate(repFamily = fct_rev(fct_inorder(repFamily))) %>%
  mutate(text_y = cumsum(n) - n/2) %>%
  ggplot(., aes(x = "", y = n, fill = repFamily)) +
  geom_col(color = "black") +
  coord_polar(theta = "y", start = 0)+
  geom_label_repel(aes(label = paste0(repFamily,"\n",sprintf("%.2f",perc*100),"%")),
                     position = position_stack(vjust = .5),
                     force=.9,show.legend = FALSE,max.overlaps = 35) +
  theme_void()+
  ggtitle(paste("ESR DNA breakdown of peaks",per_cov),subtitle=paste(ESR_DNA_count$n))+
  scale_fill_DNAs()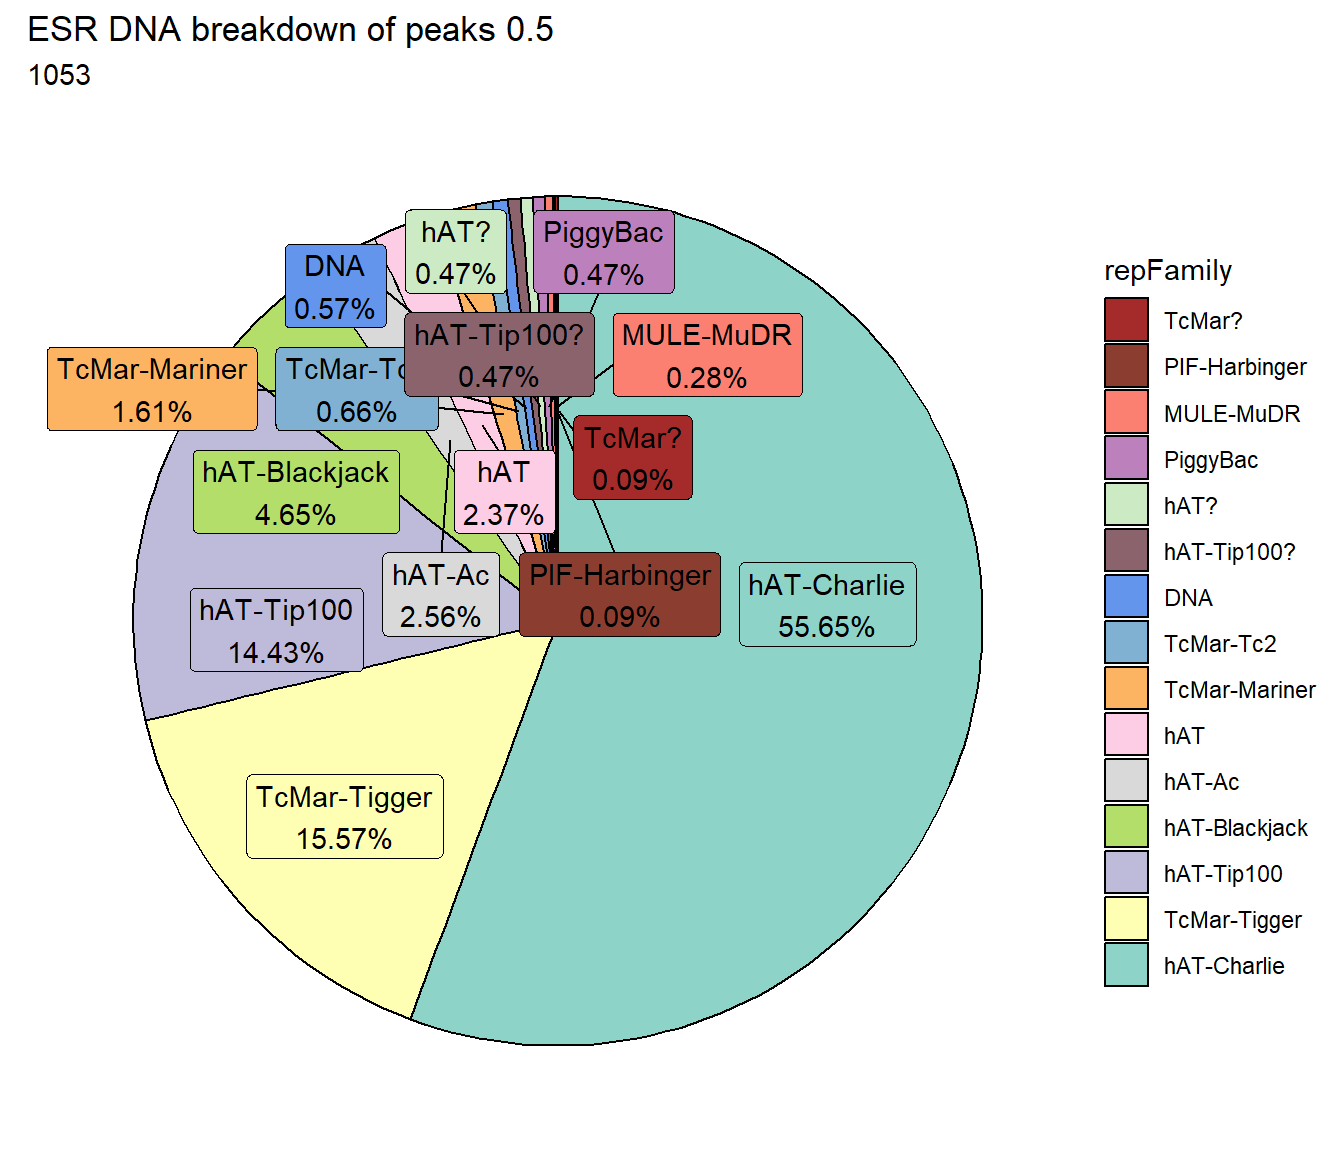
TE_mrc_status_list %>%
  dplyr::filter(mrc =="LR"&repClass=="DNA"&per_ol>per_cov) %>%
  mutate(repFamily=factor(repFamily)) %>%
  # group_by(repFamily) %>%
  count(repFamily) %>%
  mutate(perc= n/sum(n)) %>%
  arrange(desc(n)) %>%
  mutate(repFamily = fct_rev(fct_inorder(repFamily))) %>%
  mutate(text_y = cumsum(n) - n/2) %>%
  ggplot(., aes(x = "", y = n, fill = repFamily)) +
  geom_col(color = "black") +
  coord_polar(theta = "y", start = 0)+
  geom_label_repel(aes(label = paste0(repFamily,"\n",sprintf("%.2f",perc*100),"%")),
                     position = position_stack(vjust = .5),
                     force=.9,show.legend = FALSE,max.overlaps = 35) +
  theme_void()+
  ggtitle(paste("LR DNA breakdown of peaks",per_cov),subtitle=paste(LR_DNA_count$n))+
  scale_fill_DNAs()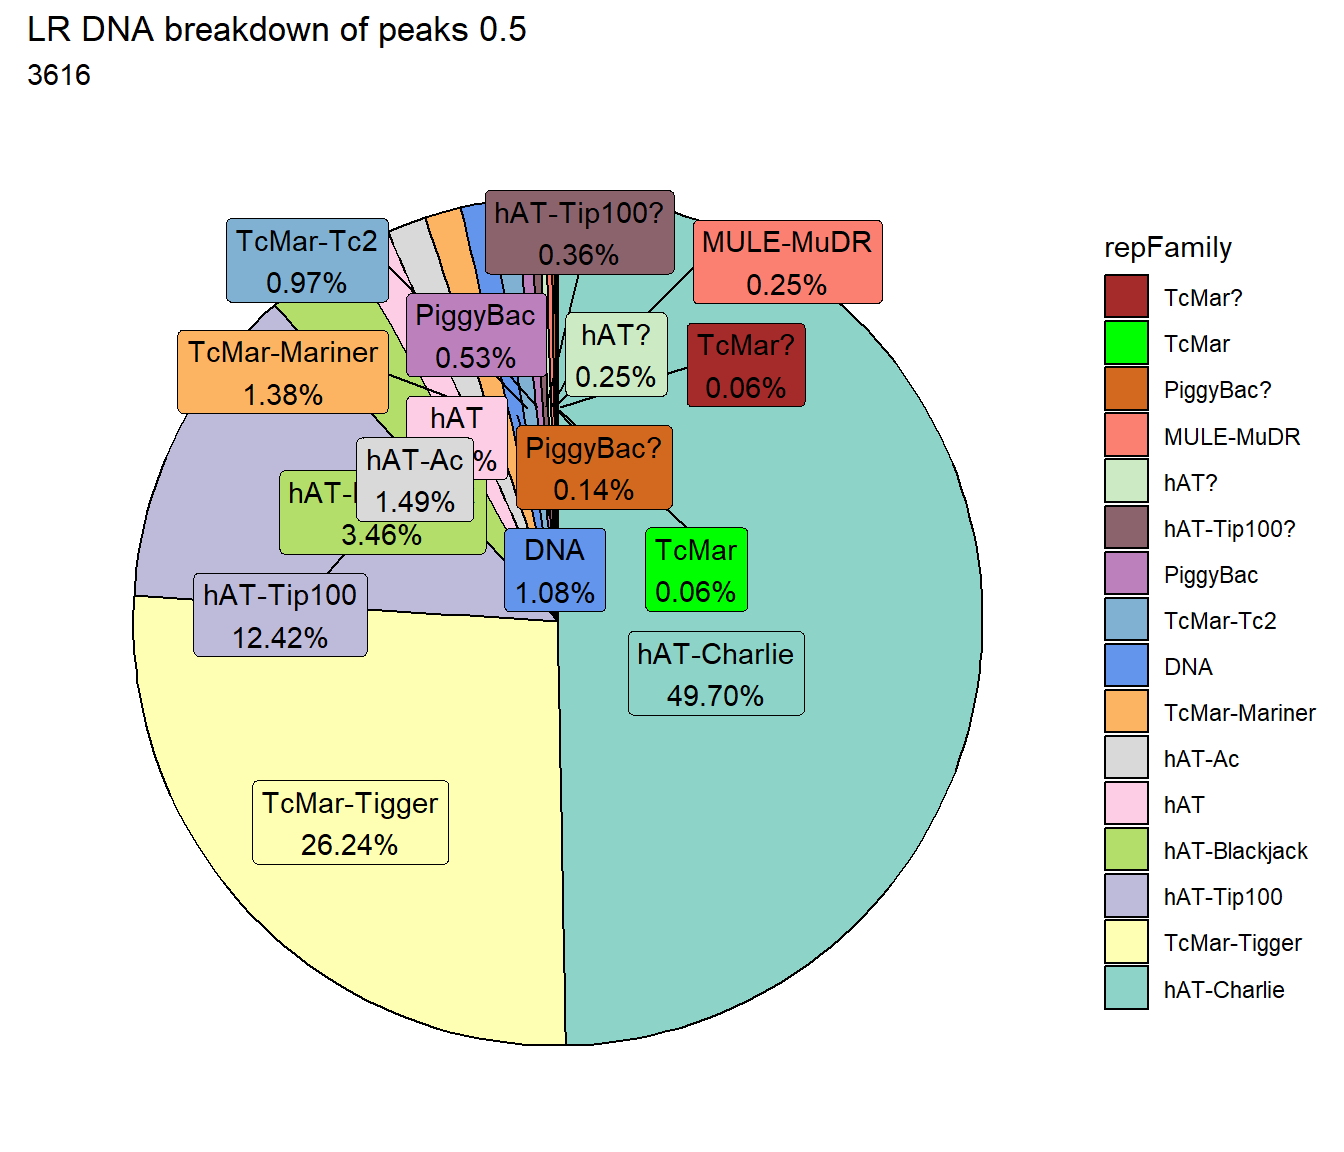
TE_mrc_status_list %>%
  dplyr::filter(mrc =="NR"&repClass=="DNA"&per_ol>per_cov) %>%
  mutate(repFamily=factor(repFamily)) %>%
  # group_by(repFamily) %>%
  count(repFamily) %>%
  mutate(perc= n/sum(n)) %>%
  arrange(desc(n)) %>%
  mutate(repFamily = fct_rev(fct_inorder(repFamily))) %>%
  mutate(text_y = cumsum(n) - n/2) %>%
  ggplot(., aes(x = "", y = n, fill = repFamily)) +
  geom_col(color = "black") +
  coord_polar(theta = "y", start = 0)+
  geom_label_repel(aes(label = paste0(repFamily,"\n",sprintf("%.2f",perc*100),"%")),
                     position = position_stack(vjust = .5),
                     force=.9,show.legend = FALSE,max.overlaps = 35) +
  theme_void()+
  ggtitle(paste("NR DNA breakdown of peaks", per_cov),subtitle=paste(NR_DNA_count$n))+
  scale_fill_DNAs()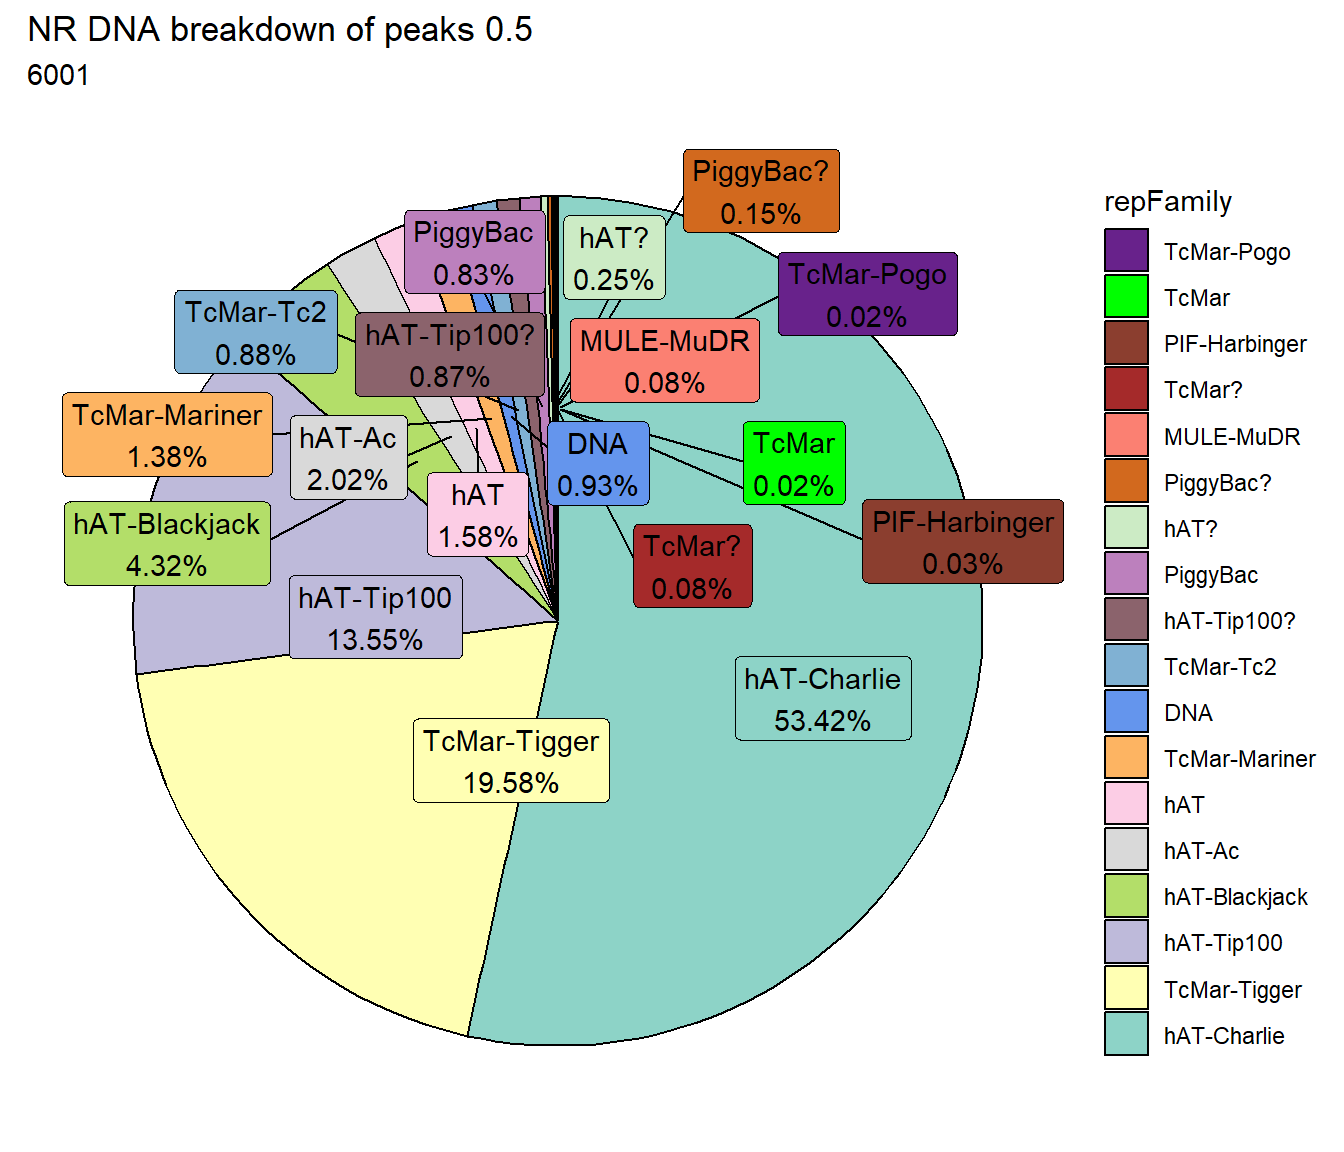
retroposon
per_cov <- 0.5

retroposon_df%>%
  count(repName) %>%
  mutate(perc= n/sum(n)) %>%
  arrange(desc(n)) %>%
  mutate(repName = fct_rev(fct_inorder(repName))) %>%
  mutate(text_y = cumsum(n) - n/2) %>%
  ggplot(., aes(x = "", y = n, fill = repName)) +
  geom_col(color = "black") +
  coord_polar(theta = "y", start = 0)+
  geom_label_repel(aes(label =  paste0(repName ,"\n", sprintf("%.2f", perc*100),"%")),
                     position = position_stack(vjust = .5),
                     force=.9,show.legend = FALSE,max.overlaps = 35) +
  theme_void()+
  ggtitle("Human genome retroposon breakdown", subtitle= paste( length(retroposon_df$milliIns)))+
  scale_fill_retroposons()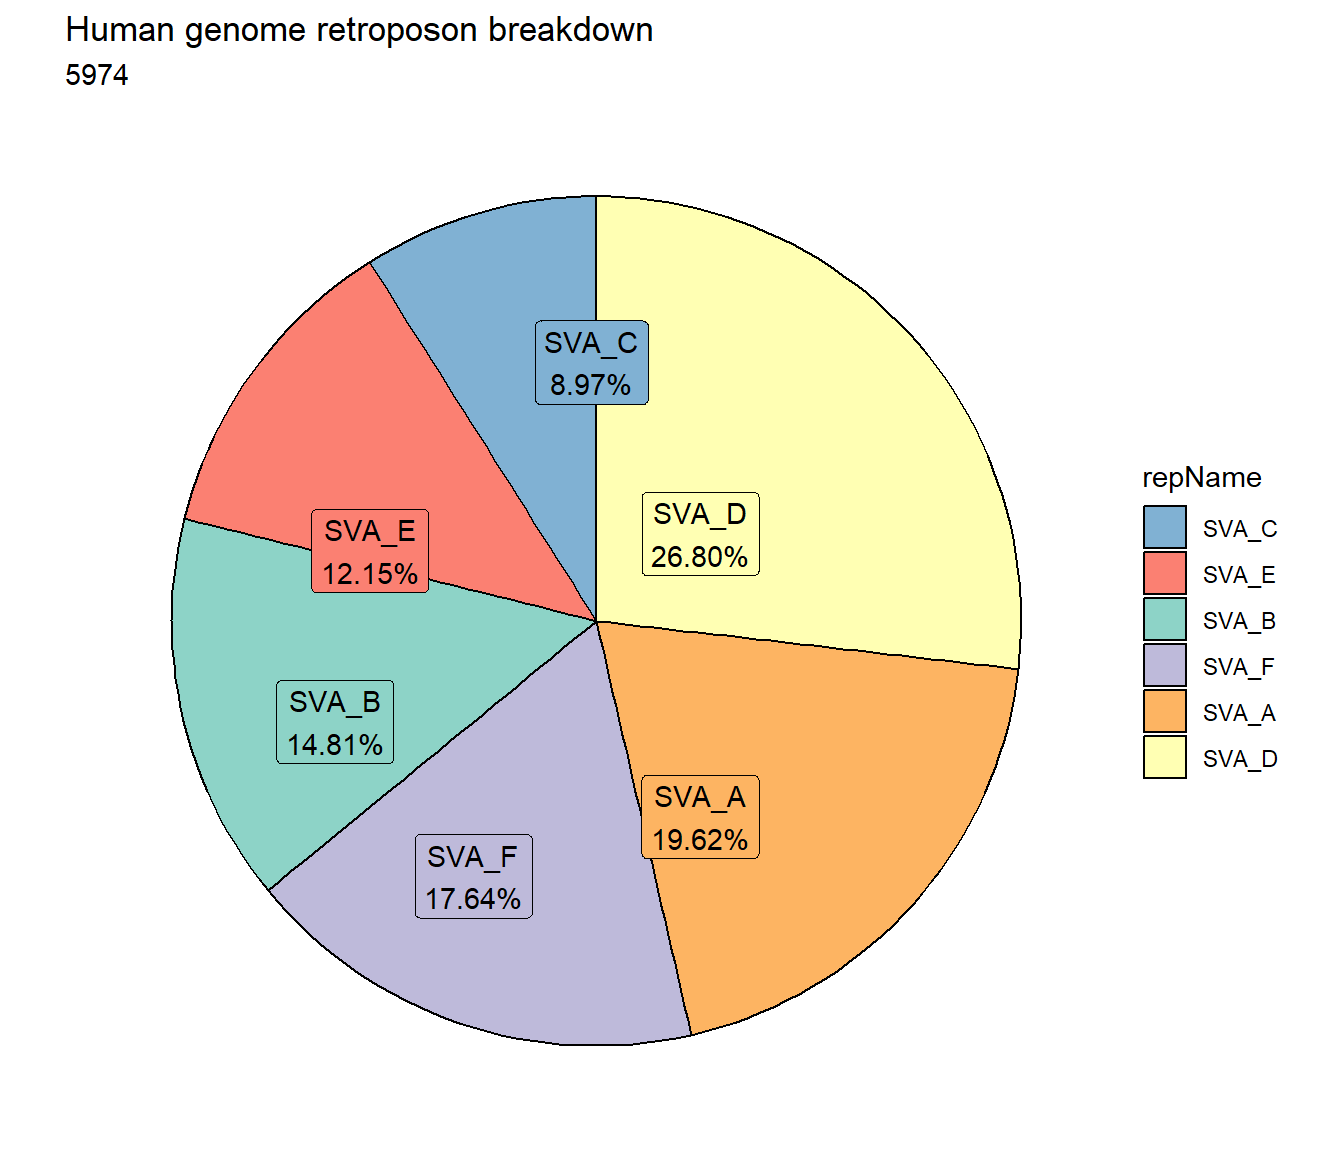
TE_retroposon_count <- TE_mrc_status_list %>%
  dplyr::filter(TEstatus =="TE_peak"&repClass=="Retroposon"&per_ol>per_cov) %>%
  count

TE_mrc_status_list %>%
  dplyr::filter(repClass == "Retroposon"&per_ol>per_cov) %>%
   mutate(repName=factor(repName)) %>%
     # group_by(repName) %>%
  count(repName) %>%
   mutate(perc= n/sum(n)) %>%
   arrange(desc(n)) %>%
  mutate(repName = fct_rev(fct_inorder(repName))) %>%
  mutate(text_y = cumsum(n) - n/2) %>%
  ggplot(., aes(x = "", y = n, fill = repName)) +
  geom_col(color = "black") +
  coord_polar(theta = "y", start = 0)+
   # geom_label(aes(label = repClass),
   #          position = position_stack(vjust = .8)) +
  geom_label_repel(aes(label = paste0(repName,"\n",sprintf("%.2f",perc*100),"%")),
                     position = position_stack(vjust = .5),
                     force=.9,show.legend = FALSE,max.overlaps = 35) +
  theme_void()+
  ggtitle(paste("retroposon breakdown of peaks",per_cov),subtitle=paste(TE_retroposon_count$n))+
  scale_fill_retroposons()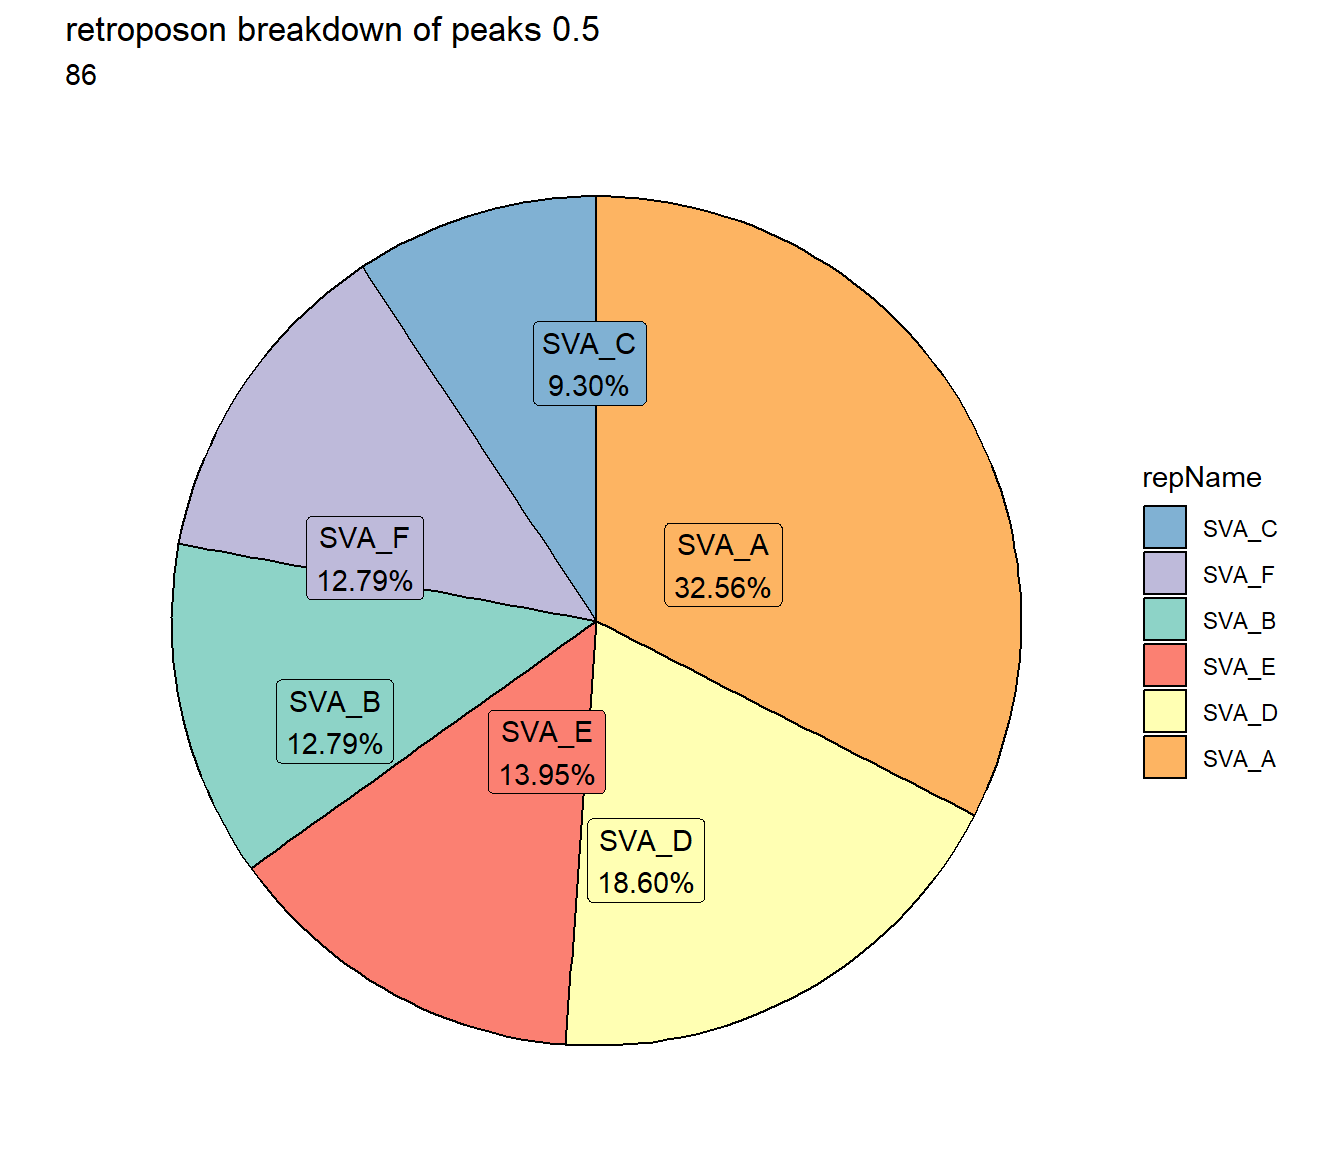
EAR_Retroposon_count <- TE_mrc_status_list %>%
  dplyr::filter(mrc =="EAR"&repClass=="Retroposon"&per_ol>per_cov) %>%
  count
ESR_Retroposon_count <- TE_mrc_status_list %>%
  dplyr::filter(mrc =="ESR"&repClass=="Retroposon"&per_ol>per_cov) %>%
  count
LR_Retroposon_count <- TE_mrc_status_list %>%
  dplyr::filter(mrc =="LR"&repClass=="Retroposon"&per_ol>per_cov) %>%
  count
NR_Retroposon_count <- TE_mrc_status_list %>%
  dplyr::filter(mrc =="NR"&repClass=="Retroposon"&per_ol>per_cov) %>%
  count


TE_mrc_status_list %>%
  dplyr::filter(mrc =="ESR"&repClass=="Retroposon"&per_ol>per_cov) %>%
  mutate(repName=factor(repName)) %>%
  # group_by(repName) %>%
  count(repName) %>%
  mutate(perc= n/sum(n)) %>%
  arrange(desc(n)) %>%
   mutate(repName = fct_rev(fct_inorder(repName))) %>%
  mutate(text_y = cumsum(n) - n/2) %>%
  ggplot(., aes(x = "", y = n, fill = repName)) +
  geom_col(color = "black") +
  coord_polar(theta = "y", start = 0)+
  geom_label_repel(aes(label = paste0(repName,"\n",sprintf("%.2f",perc*100),"%")),
                     position = position_stack(vjust = .5),
                     force=.9,show.legend = FALSE,max.overlaps = 35) +
  theme_void()+
  ggtitle(paste("ESR Retroposon breakdown of peaks",per_cov),subtitle=paste(ESR_Retroposon_count$n))+
  scale_fill_retroposons()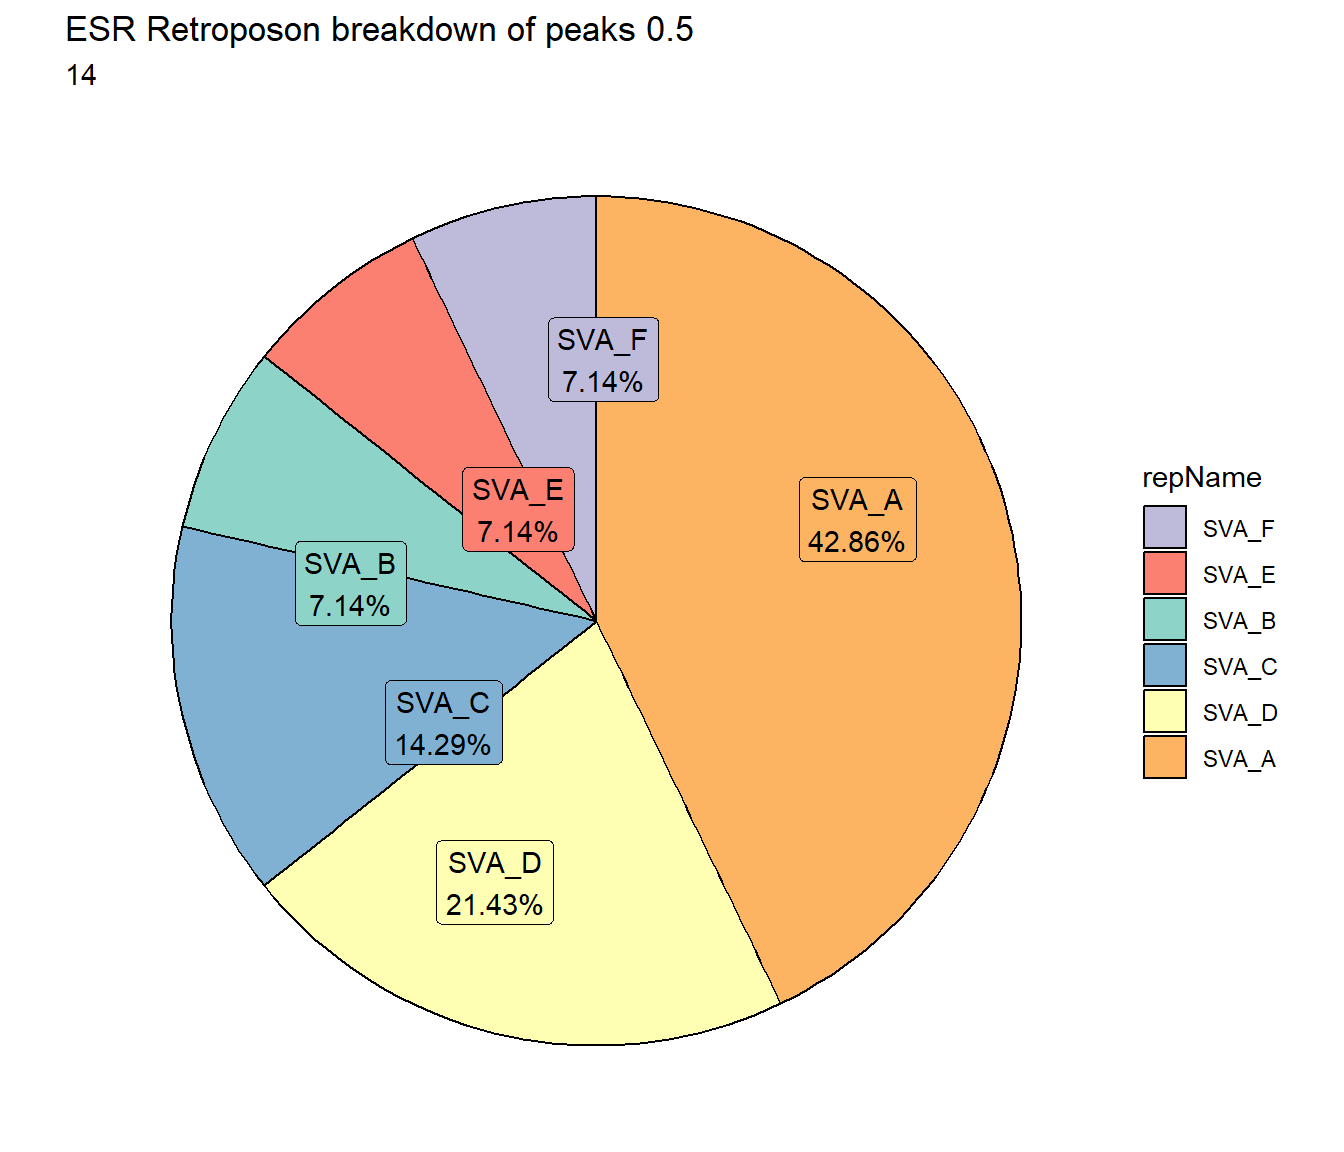
TE_mrc_status_list %>%
  dplyr::filter(mrc =="LR"&repClass=="Retroposon"&per_ol>per_cov) %>%
  mutate(repName=factor(repName)) %>%
  # group_by(repName) %>%
  count(repName) %>%
  mutate(perc= n/sum(n)) %>%
  arrange(desc(n)) %>%
   mutate(repName = fct_rev(fct_inorder(repName))) %>%
  mutate(text_y = cumsum(n) - n/2) %>%
  ggplot(., aes(x = "", y = n, fill = repName)) +
  geom_col(color = "black") +
  coord_polar(theta = "y", start = 0)+
  geom_label_repel(aes(label = paste0(repName,"\n",sprintf("%.2f",perc*100),"%")),
                     position = position_stack(vjust = .5),
                     force=.9,show.legend = FALSE,max.overlaps = 35) +
  theme_void()+
  ggtitle(paste("LR Retroposon breakdown of peaks",per_cov),subtitle=paste(LR_Retroposon_count$n))+
  scale_fill_retroposons()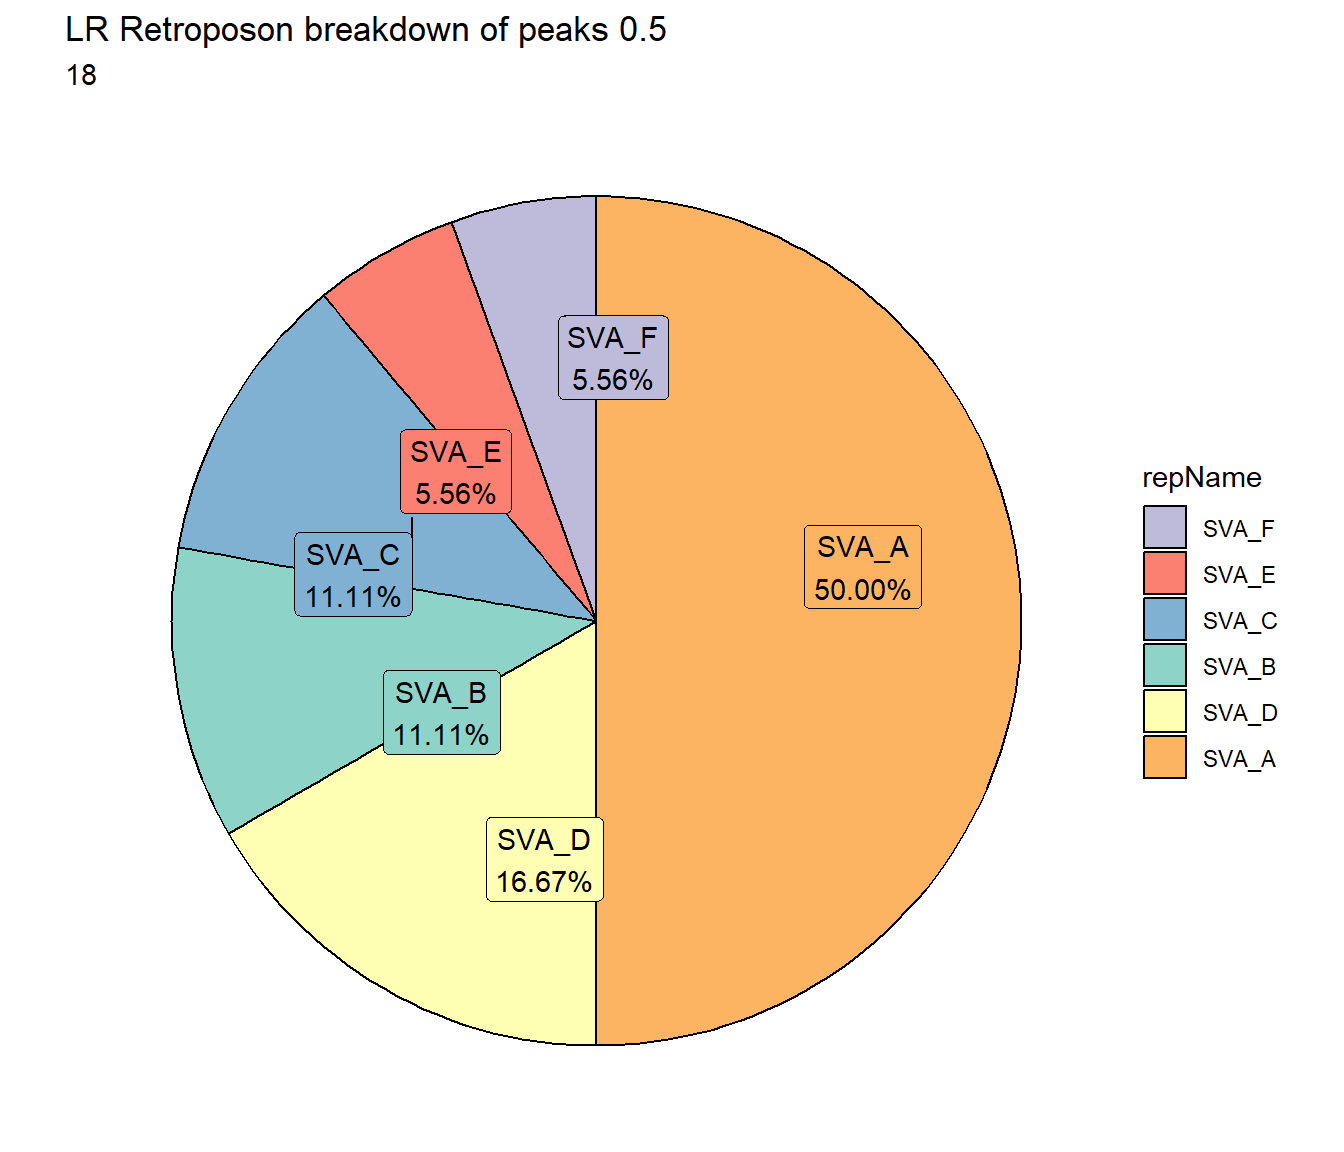
TE_mrc_status_list %>%
  dplyr::filter(mrc =="NR"&repClass=="Retroposon"&per_ol>per_cov) %>%
  mutate(repName=factor(repName)) %>%
  # group_by(repName) %>%
  count(repName) %>%
  mutate(perc= n/sum(n)) %>%
  arrange(desc(n)) %>%
   mutate(repName = fct_rev(fct_inorder(repName))) %>%
  mutate(text_y = cumsum(n) - n/2) %>%
  ggplot(., aes(x = "", y = n, fill = repName)) +
  geom_col(color = "black") +
  coord_polar(theta = "y", start = 0)+
  geom_label_repel(aes(label = paste0(repName,"\n",sprintf("%.2f",perc*100),"%")),
                     position = position_stack(vjust = .5),
                     force=.9,show.legend = FALSE,max.overlaps = 35) +
  theme_void()+
  ggtitle(paste("NR Retroposon breakdown of peaks",per_cov),subtitle=paste(NR_Retroposon_count$n))+
  scale_fill_retroposons()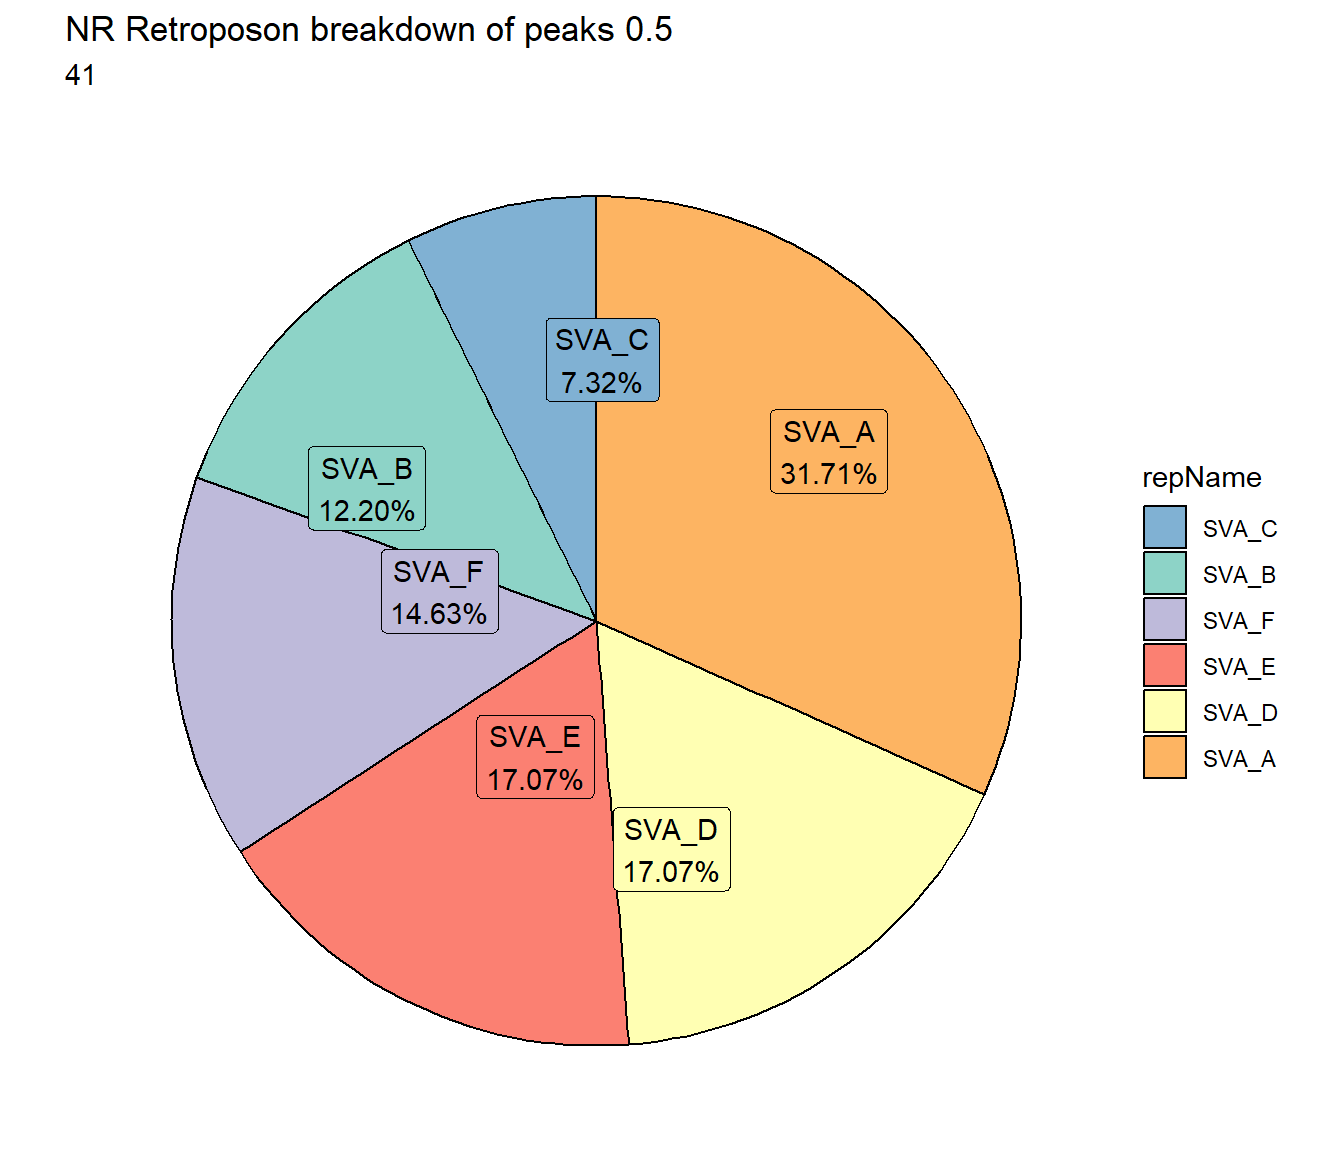
TE by response cluster bargraph summaries
TE_mrc_status_list %>%
   mutate(repClass_org = repClass) %>% #copy repClass for storage
  mutate(repClass=if_else(##relable repClass with other
    repClass_org=="LINE", repClass_org,if_else(repClass_org=="SINE",repClass_org,if_else(repClass_org=="LTR", repClass_org, if_else(repClass_org=="DNA", repClass_org, if_else(repClass_org=="Retroposon",repClass_org,"Other")))))) %>%
   dplyr::select(Peakid,repName,repClass,repFamily,width,TEstatus, mrc, per_ol) %>% distinct(Peakid, .keep_all = TRUE) %>%
   mutate(mrc="all_peaks") %>%
   rbind((TE_mrc_status_list %>% distinct(Peakid,.keep_all = TRUE))) %>%
   mutate(repClass=factor(repClass)) %>%
   mutate(TEstatus=factor(TEstatus, levels = c("TE_peak","not_TE_peak")))%>%
   dplyr::filter(mrc != "not_mrc") %>%
  mutate(mrc=factor(mrc, levels = c("EAR","ESR", "LR", "NR","all_peaks"))) %>%
  ggplot(., aes(x=mrc, fill= TEstatus))+
  geom_bar(position="fill", col="black")+
  theme_classic()+
  ggtitle(paste("TE status by MRC and Family","all"))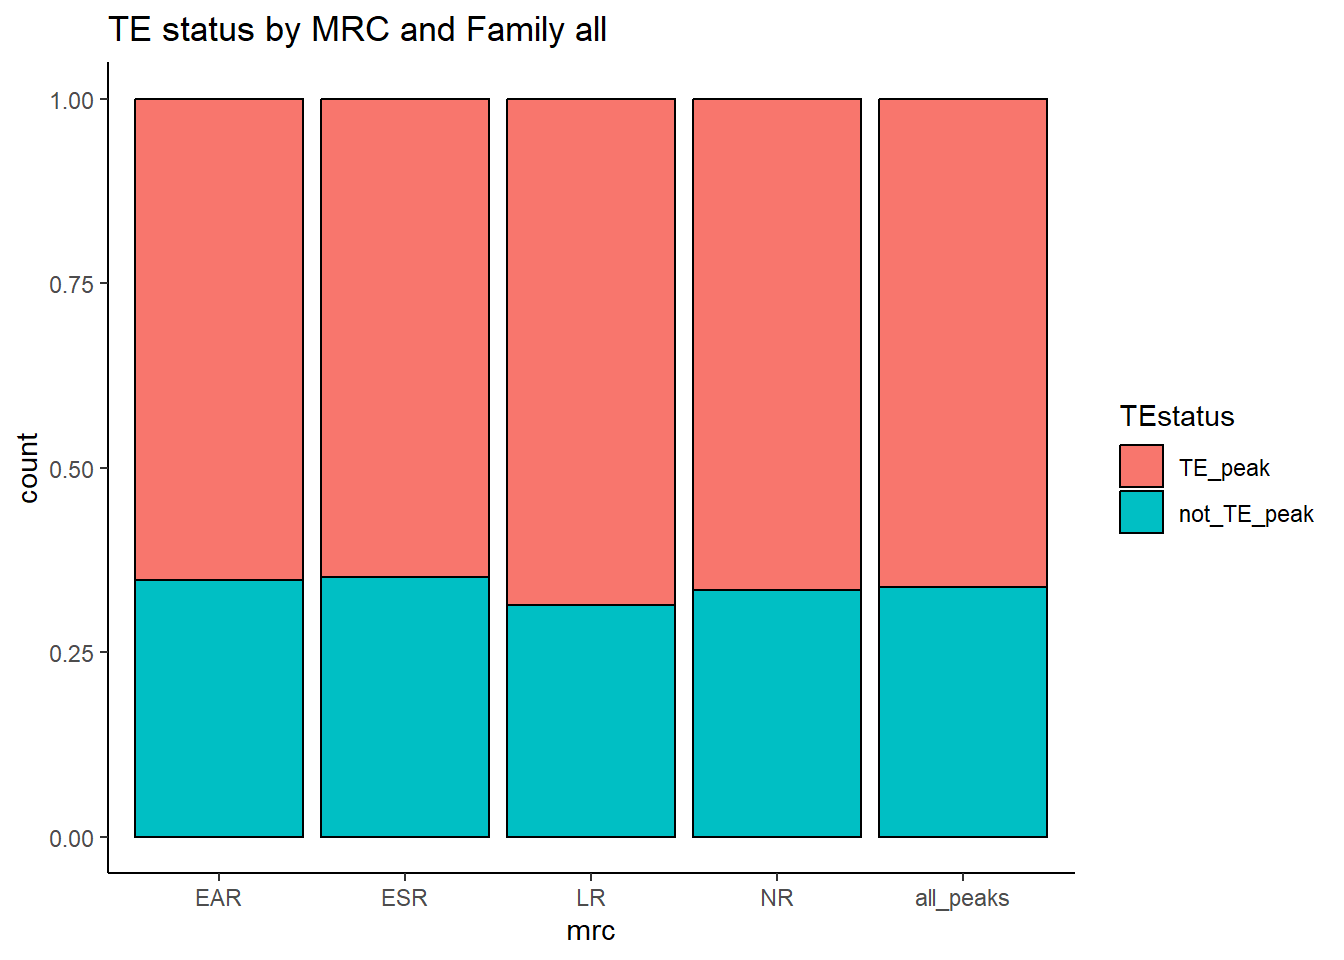
  # geom_text(aes(label = sprintf('%d', after_stat(count))), stat = 'count')


TE_mrc_status_list %>%
   mutate(repClass_org = repClass) %>% #copy repClass for storage
  mutate(repClass=if_else(##relable repClass with other
    repClass_org=="LINE", repClass_org,if_else(repClass_org=="SINE",repClass_org,if_else(repClass_org=="LTR", repClass_org, if_else(repClass_org=="DNA", repClass_org, if_else(repClass_org=="Retroposon",repClass_org,"Other")))))) %>%
   dplyr::select(Peakid,repName,repClass,repFamily,width,TEstatus, mrc, per_ol) %>% distinct(Peakid, .keep_all = TRUE) %>%
   mutate(mrc="all_peaks") %>%
   rbind((TE_mrc_status_list %>% distinct(Peakid,.keep_all = TRUE))) %>%
   mutate(repClass=factor(repClass)) %>%
   mutate(TEstatus=factor(TEstatus, levels = c("TE_peak","not_TE_peak")))%>%
   dplyr::filter(mrc != "not_mrc") %>%
  dplyr::filter(is.na(per_ol)| per_ol>per_cov) %>%
  mutate(mrc=factor(mrc, levels = c("EAR","ESR", "LR", "NR","all_peaks"))) %>%
  ggplot(., aes(x=mrc, fill= TEstatus))+
  geom_bar(position="fill", col="black")+
  theme_classic()+
  ggtitle(paste("TE status by MRC and Family",">", per_cov*100,"%"))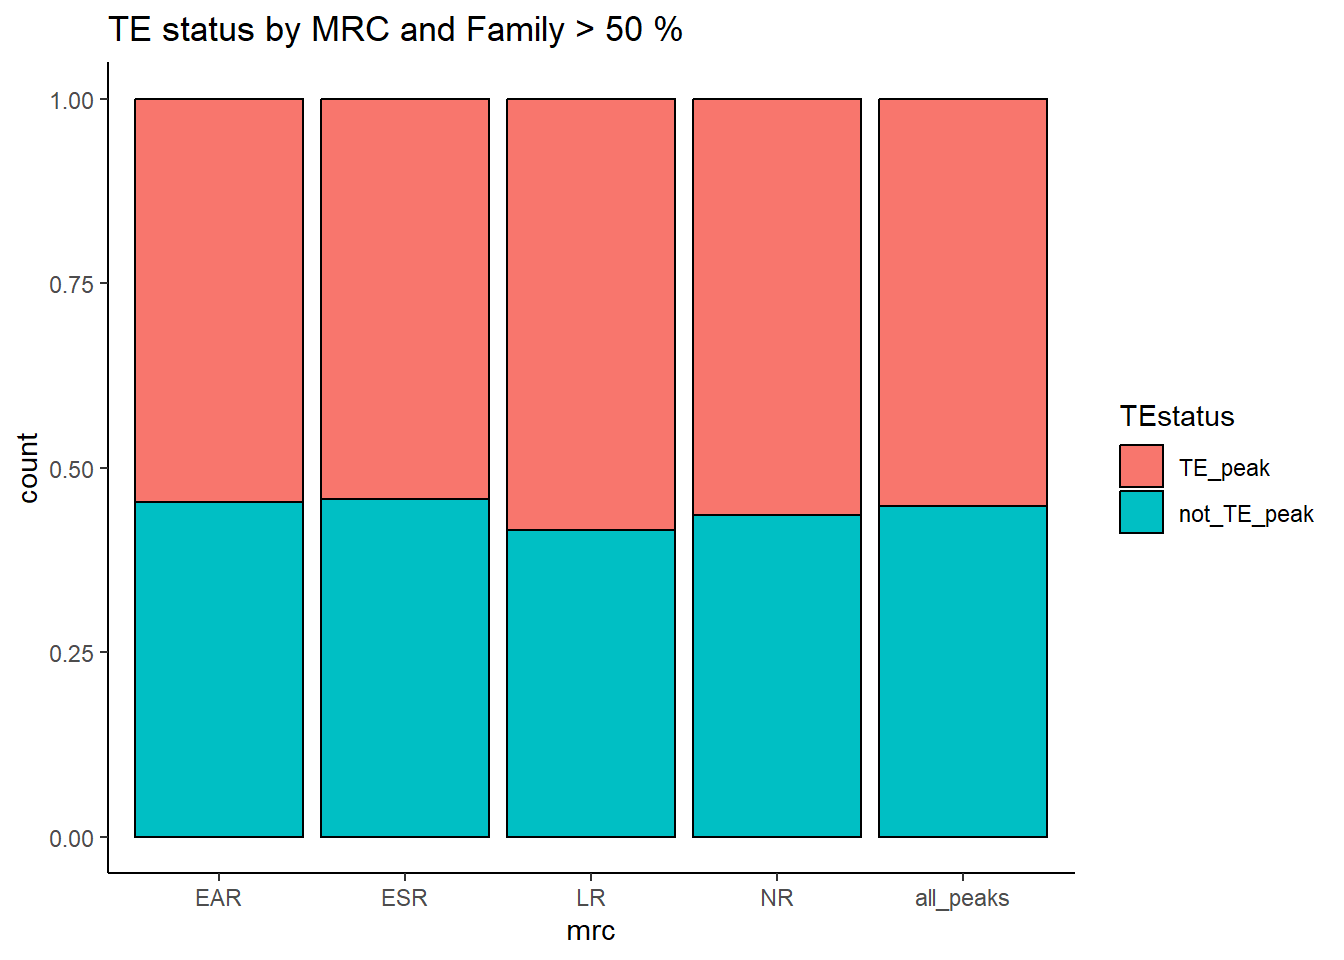
TE_counts_nofilt <- TE_mrc_status_list %>%
   mutate(repClass_org = repClass) %>% #copy repClass for storage
  mutate(repClass=if_else(##relable repClass with other
    repClass_org=="LINE", repClass_org,if_else(repClass_org=="SINE",repClass_org,if_else(repClass_org=="LTR", repClass_org, if_else(repClass_org=="DNA", repClass_org, if_else(repClass_org=="Retroposon",repClass_org,if_else(is.na(repClass_org),repClass_org,"Other"))))))) %>%
   dplyr::select(Peakid,repName,repClass,repFamily,width,TEstatus, mrc, per_ol) %>% distinct(Peakid, .keep_all = TRUE) %>%
   mutate(mrc="all_peaks") %>%
  rbind((TE_mrc_status_list %>% distinct(Peakid,.keep_all = TRUE))) %>%
  # mutate(repClass=factor(repClass)) %>%
   mutate(TEstatus=factor(TEstatus, levels = c("TE_peak","not_TE_peak")))%>%
   dplyr::filter(mrc != "not_mrc") %>%
  mutate(mrc=factor(mrc, levels = c("EAR","ESR", "LR", "NR","all_peaks"))) %>%
     group_by(mrc, TEstatus) %>%
     count() %>%
     pivot_wider(., id_cols = mrc, names_from = TEstatus, values_from = n) %>%
     rowwise() %>%
     mutate(summary= sum(c_across(TE_peak:not_TE_peak))) %>%
     ungroup() %>%
     pivot_longer(., cols= c(TE_peak, not_TE_peak), names_to = c("TEstatus"), values_to = "n") %>%
     mutate(percent_mrc= n/summary*100)

notinterested_list <- c("Simple_repeat","Satellite","Low_complexity","DNA?","snRNA","tRNA","Unknown","RC","LTR?","srpRNA","scRNA","rRNA","RC?","SINE?")

Lines_Etc <- TE_mrc_status_list %>%
   mutate(repClass_org = repClass) %>%
  dplyr::filter(!repClass %in% notinterested_list) %>%
  mutate(repClass=if_else(##relable repClass with other
    repClass_org=="LINE", repClass_org,
    if_else(repClass_org=="SINE",repClass_org,
            if_else(repClass_org=="LTR", repClass_org,
                    if_else(repClass_org=="DNA", repClass_org,
                            if_else(repClass_org=="Retroposon",repClass_org, if_else(is.na(repClass_org),repClass_org,"Other"))))))) %>%
   dplyr::select(Peakid,repName,repClass,repFamily,width,TEstatus, mrc, per_ol)%>% distinct(Peakid, .keep_all = TRUE) %>%
   mutate(mrc="all_peaks")


LiSiLTDNRe_TE_no_cut <-
TE_mrc_status_list %>%
   mutate(repClass_org = repClass) %>%
  dplyr::filter(!repClass %in% notinterested_list) %>%
  mutate(repClass=if_else(##relable repClass with other
    repClass_org=="LINE", repClass_org,
    if_else(repClass_org=="SINE",repClass_org,
            if_else(repClass_org=="LTR", repClass_org,
                    if_else(repClass_org=="DNA", repClass_org,
        if_else(repClass_org=="Retroposon",repClass_org,if_else(is.na(repClass_org),repClass_org,"Other"))))))) %>%
   dplyr::select(Peakid,repName,repClass,repFamily,width,TEstatus, mrc, per_ol) %>% distinct(Peakid, .keep_all = TRUE) %>%
  rbind(Lines_Etc) %>%
  mutate(repClass=factor(repClass)) %>%
   mutate(TEstatus=factor(TEstatus, levels = c("TE_peak","not_TE_peak")))%>%
   dplyr::filter(mrc != "not_mrc") %>%
  # dplyr::filter(is.na(per_ol)|per_ol>per_cov) %>%
  mutate(mrc=factor(mrc, levels = c("EAR","ESR", "LR", "NR","all_peaks"))) %>%
     group_by(mrc, TEstatus) %>%
     count() %>%
     pivot_wider(., id_cols = mrc, names_from = TEstatus, values_from = n) %>%
     rowwise() %>%
     mutate(summary= sum(c_across(TE_peak:not_TE_peak))) %>%
     ungroup() %>%
     pivot_longer(., cols= c(TE_peak, not_TE_peak), names_to = c("TEstatus"), values_to = "n") %>%
     mutate(percent_mrc= n/summary*100)

LiSiLTDNRe_TE_no_cut %>%
  kable(., caption="Table 9: Summary of peak numbers overlapping and not overlapping TEs by each basic MRC with LINEs/SINEs/etc only in TE_peak count") %>%
  kable_paper("striped", full_width = TRUE) %>%
  kable_styling(full_width = FALSE, font_size = 14) %>%
scroll_box(height = "500px")| mrc | summary | TEstatus | n | percent_mrc |
|---|---|---|---|---|
| EAR | 6548 | TE_peak | 4029 | 61.53024 |
| EAR | 6548 | not_TE_peak | 2519 | 38.46976 |
| ESR | 13799 | TE_peak | 8400 | 60.87398 |
| ESR | 13799 | not_TE_peak | 5399 | 39.12602 |
| LR | 38384 | TE_peak | 25442 | 66.28283 |
| LR | 38384 | not_TE_peak | 12942 | 33.71717 |
| NR | 74326 | TE_peak | 46463 | 62.51245 |
| NR | 74326 | not_TE_peak | 27863 | 37.48755 |
| all_peaks | 151633 | TE_peak | 95299 | 62.84846 |
| all_peaks | 151633 | not_TE_peak | 56334 | 37.15154 |
LiSiLTDNRe_TE_cut <-
TE_mrc_status_list %>%
   mutate(repClass_org = repClass) %>%
  dplyr::filter(!repClass %in% notinterested_list) %>%
  mutate(repClass=if_else(##relable repClass with other
    repClass_org=="LINE", repClass_org,
    if_else(repClass_org=="SINE",repClass_org,
            if_else(repClass_org=="LTR", repClass_org,
                    if_else(repClass_org=="DNA", repClass_org,
        if_else(repClass_org=="Retroposon",repClass_org,if_else(is.na(repClass_org),repClass_org,"Other"))))))) %>%
   dplyr::select(Peakid,repName,repClass,repFamily,width,TEstatus, mrc, per_ol) %>% distinct(Peakid, .keep_all = TRUE) %>%
  rbind(Lines_Etc) %>%
  mutate(repClass=factor(repClass)) %>%
   mutate(TEstatus=factor(TEstatus, levels = c("TE_peak","not_TE_peak")))%>%
   dplyr::filter(mrc != "not_mrc") %>%
  dplyr::filter(is.na(per_ol)|per_ol>per_cov) %>%
  mutate(mrc=factor(mrc, levels = c("EAR","ESR", "LR", "NR","all_peaks"))) %>%
     group_by(mrc, TEstatus) %>%
     count() %>%
     pivot_wider(., id_cols = mrc, names_from = TEstatus, values_from = n) %>%
     rowwise() %>%
     mutate(summary= sum(c_across(TE_peak:not_TE_peak))) %>%
     ungroup() %>%
     pivot_longer(., cols= c(TE_peak, not_TE_peak), names_to = c("TEstatus"), values_to = "n") %>%
     mutate(percent_mrc= n/summary*100)


TE_mrc_status_list %>%
   mutate(repClass_org = repClass) %>%
  dplyr::filter(!repClass %in% notinterested_list) %>%
  mutate(repClass=if_else(##relable repClass with other
    repClass_org=="LINE", repClass_org,
    if_else(repClass_org=="SINE",repClass_org,
            if_else(repClass_org=="LTR", repClass_org,
                    if_else(repClass_org=="DNA", repClass_org,
                            if_else(repClass_org=="Retroposon",repClass_org,"Other")))))) %>%
   dplyr::select(Peakid,repName,repClass,repFamily,width,TEstatus, mrc, per_ol) %>% distinct(Peakid, .keep_all = TRUE) %>%
  rbind(Lines_Etc) %>%
  dplyr::filter(is.na(per_ol)| per_ol > per_cov) %>%
   mutate(repClass=factor(repClass)) %>%
   mutate(TEstatus=factor(TEstatus, levels = c("TE_peak","not_TE_peak")))%>%
   dplyr::filter(mrc != "not_mrc") %>%
  mutate(mrc=factor(mrc, levels = c("EAR","ESR", "LR", "NR","all_peaks"))) %>%
  ggplot(., aes(x=mrc, fill= TEstatus))+
  geom_bar(position="fill", col="black")+
  theme_classic()+
  ggtitle(paste("TE status by MRC and Family", per_cov), subtitle = "Just LINEs, SINEs,LTRs, DNAs, Retroposons, and all peaks in the MRC families")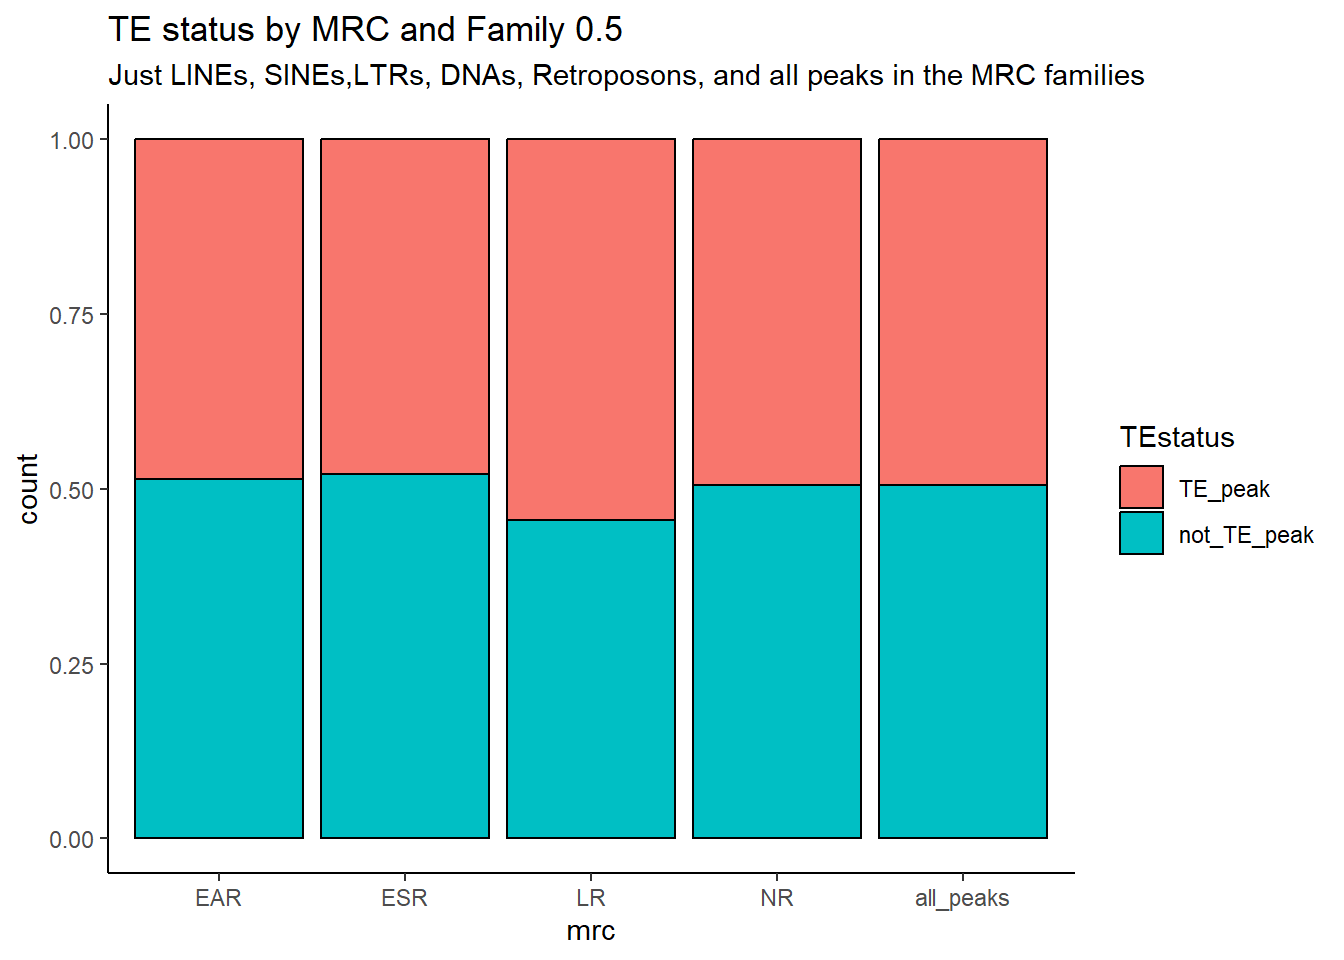
LiSiLTDNRe_TE_cut %>%
  kable(., caption="Table 10: Summary of peak numbers overlapping and not overlapping TEs by each basic MRC using stringency cutoff of 50%. LINEs/SINEs/etc only in TE_peak count") %>%
  kable_paper("striped", full_width = TRUE) %>%
  kable_styling(full_width = FALSE, font_size = 14) %>%
scroll_box(height = "500px")| mrc | summary | TEstatus | n | percent_mrc |
|---|---|---|---|---|
| EAR | 4906 | TE_peak | 2387 | 48.65471 |
| EAR | 4906 | not_TE_peak | 2519 | 51.34529 |
| ESR | 10352 | TE_peak | 4953 | 47.84583 |
| ESR | 10352 | not_TE_peak | 5399 | 52.15417 |
| LR | 28423 | TE_peak | 15481 | 54.46645 |
| LR | 28423 | not_TE_peak | 12942 | 45.53355 |
| NR | 55166 | TE_peak | 27303 | 49.49244 |
| NR | 55166 | not_TE_peak | 27863 | 50.50756 |
| all_peaks | 111518 | TE_peak | 55184 | 49.48439 |
| all_peaks | 111518 | not_TE_peak | 56334 | 50.51561 |
Chi square tests
# ##complete counts()
print("Chi square tests without filtering")
[1] "Chi square tests without filtering"chitest_LRvNRTE_nf <- matrix(c(TE_counts_nofilt$n[5],TE_counts_nofilt$n[6],TE_counts_nofilt$n[7],TE_counts_nofilt$n[8]), ncol=2, byrow=TRUE)
chisq.test(chitest_LRvNRTE_nf)
    Pearson's Chi-squared test with Yates' continuity correction

data:  chitest_LRvNRTE_nf
X-squared = 52.772, df = 1, p-value = 3.745e-13
chitest_EARvNRTE_nf <- matrix(c(TE_counts_nofilt$n[1],TE_counts_nofilt$n[2],TE_counts_nofilt$n[7],TE_counts_nofilt$n[8]), ncol=2, byrow=TRUE)
chisq.test(chitest_EARvNRTE_nf)
    Pearson's Chi-squared test with Yates' continuity correction

data:  chitest_EARvNRTE_nf
X-squared = 5.0997, df = 1, p-value = 0.02393
chitest_ESRvNRTE_nf <- matrix(c(TE_counts_nofilt$n[3],TE_counts_nofilt$n[4],TE_counts_nofilt$n[7],TE_counts_nofilt$n[8]), ncol=2, byrow=TRUE)
chisq.test(chitest_ESRvNRTE_nf)
    Pearson's Chi-squared test with Yates' continuity correction

data:  chitest_ESRvNRTE_nf
X-squared = 16.45, df = 1, p-value = 4.994e-05
### just subsets
print("chi test on subsets without >50% overlap cut off")[1] "chi test on subsets without >50% overlap cut off"chitest_LRvNRTE_nc <- matrix(c(LiSiLTDNRe_TE_no_cut$n[5],LiSiLTDNRe_TE_no_cut$n[6],LiSiLTDNRe_TE_no_cut$n[7],LiSiLTDNRe_TE_no_cut$n[8]), ncol=2, byrow=TRUE)
chisq.test(chitest_LRvNRTE_nc)
    Pearson's Chi-squared test with Yates' continuity correction

data:  chitest_LRvNRTE_nc
X-squared = 155.63, df = 1, p-value < 2.2e-16
chitest_EARvNRTE_nc <- matrix(c(LiSiLTDNRe_TE_no_cut$n[1],LiSiLTDNRe_TE_no_cut$n[2],LiSiLTDNRe_TE_no_cut$n[7],LiSiLTDNRe_TE_no_cut$n[8]), ncol=2, byrow=TRUE)
chisq.test(chitest_EARvNRTE_nc)
    Pearson's Chi-squared test with Yates' continuity correction

data:  chitest_EARvNRTE_nc
X-squared = 2.4336, df = 1, p-value = 0.1188
chitest_ESRvNRTE_nc <- matrix(c(LiSiLTDNRe_TE_no_cut$n[3],LiSiLTDNRe_TE_no_cut$n[4],LiSiLTDNRe_TE_no_cut$n[7],LiSiLTDNRe_TE_no_cut$n[8]), ncol=2, byrow=TRUE)
chisq.test(chitest_ESRvNRTE_nc)
    Pearson's Chi-squared test with Yates' continuity correction

data:  chitest_ESRvNRTE_nc
X-squared = 13.227, df = 1, p-value = 0.000276
##### JUst using the .5 overlap cutoff
print(" chi tests using >50% cutoff")[1] " chi tests using >50% cutoff"chitest_LRvNRTE <- matrix(c(LiSiLTDNRe_TE_cut$n[5],LiSiLTDNRe_TE_cut$n[6],LiSiLTDNRe_TE_cut$n[7],LiSiLTDNRe_TE_cut$n[8]), ncol=2, byrow=TRUE)
chisq.test(chitest_LRvNRTE)
    Pearson's Chi-squared test with Yates' continuity correction

data:  chitest_LRvNRTE
X-squared = 185.54, df = 1, p-value < 2.2e-16
chitest_EARvNRTE <- matrix(c(LiSiLTDNRe_TE_cut$n[1],LiSiLTDNRe_TE_cut$n[2],LiSiLTDNRe_TE_cut$n[7],LiSiLTDNRe_TE_cut$n[8]), ncol=2, byrow=TRUE)
chisq.test(chitest_EARvNRTE)
    Pearson's Chi-squared test with Yates' continuity correction

data:  chitest_EARvNRTE
X-squared = 1.2316, df = 1, p-value = 0.2671
chitest_ESRvNRTE <- matrix(c(LiSiLTDNRe_TE_cut$n[3],LiSiLTDNRe_TE_cut$n[4],LiSiLTDNRe_TE_cut$n[7],LiSiLTDNRe_TE_cut$n[8]), ncol=2, byrow=TRUE)
chisq.test(chitest_ESRvNRTE)
    Pearson's Chi-squared test with Yates' continuity correction

data:  chitest_ESRvNRTE
X-squared = 9.3897, df = 1, p-value = 0.002182
Breakdown of Classes by 4 member clusters
per_cov <- 0.5

ggline_df <- Line_repeats %>%
  as.data.frame() %>%
 tidyr::unite(Peakid,seqnames:end, sep= ".") %>%
  dplyr::select(Peakid,repName,repClass, repFamily,width) %>%
  mutate(TEstatus ="TE_peak", mrc="h.genome", per_ol = "NA") %>%
    rbind(TE_mrc_status_list %>% dplyr::filter(repClass=="LINE") %>% mutate(mrc="all_peaks"))


ggsine_df <-
  Sine_repeats %>%
  as.data.frame() %>%
 tidyr::unite(Peakid,seqnames:end, sep= ".") %>%
  dplyr::select(Peakid,repName,repClass, repFamily,width) %>%
  mutate(TEstatus ="TE_peak", mrc="h.genome",per_ol = "NA") %>%
    rbind(TE_mrc_status_list %>% dplyr::filter(repClass=="SINE") %>% mutate(mrc="all_peaks"))

ggLTR_df <-LTR_repeats %>%
  as.data.frame() %>%
 tidyr::unite(Peakid,seqnames:end, sep= ".") %>%
  dplyr::select(Peakid,repName,repClass, repFamily,width) %>%
  mutate(TEstatus ="TE_peak", mrc="h.genome",per_ol = "NA")%>%
    rbind(TE_mrc_status_list %>% dplyr::filter(repClass=="LTR") %>% mutate(mrc="all_peaks"))


ggDNA_df <-DNA_repeats %>%
  as.data.frame() %>%
 tidyr::unite(Peakid,seqnames:end, sep= ".") %>%
  dplyr::select(Peakid,repName,repClass, repFamily,width) %>%
  mutate(TEstatus ="TE_peak", mrc="h.genome",per_ol = "NA")%>%
    rbind(TE_mrc_status_list %>% dplyr::filter(repClass=="DNA") %>% mutate(mrc="all_peaks"))


ggretroposon_df <-retroposon_repeats %>%
  as.data.frame() %>%
 tidyr::unite(Peakid,seqnames:end, sep= ".") %>%
  dplyr::select(Peakid,repName,repClass, repFamily,width) %>%
  mutate(TEstatus ="TE_peak", mrc="h.genome",per_ol = "NA")%>%
    rbind(TE_mrc_status_list %>% dplyr::filter(repClass=="Retroposon") %>% mutate(mrc="all_peaks"))


plot1 <- TE_mrc_status_list %>%
  dplyr::filter(repClass=="LINE"&per_ol>per_cov) %>%
  dplyr::filter(mrc != "not_mrc") %>%
  rbind(., ggline_df) %>%
  mutate(repFamily=factor(repFamily)) %>%
  mutate(mrc=factor(mrc, levels = c("EAR","ESR", "LR", "NR","all_peaks","h.genome"))) %>%
  ggplot(., aes(x=mrc, fill= repFamily))+
  geom_bar(position="fill", col="black")+
  theme_bw()+
  ggtitle(paste("LINE breakdown by MRC and Family", per_cov))+
  scale_fill_lines()
plot1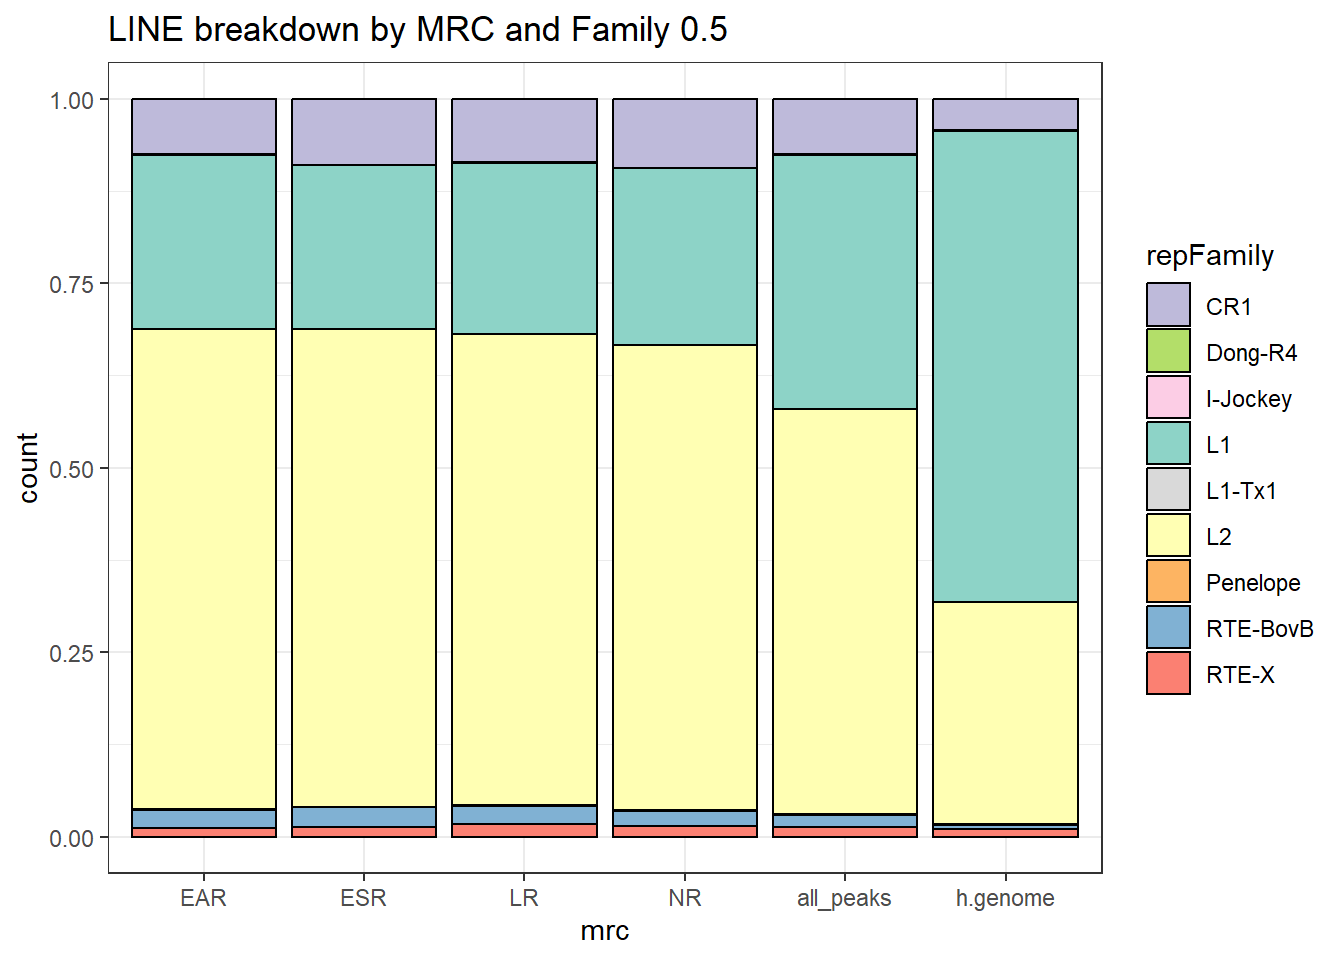
plot2 <- TE_mrc_status_list %>%
  dplyr::filter(repClass=="SINE"&per_ol>per_cov) %>%
  dplyr::filter(mrc != "not_mrc") %>%
   rbind(., ggsine_df) %>%
  mutate(repFamily=factor(repFamily)) %>%
  mutate(mrc=factor(mrc, levels = c("EAR","ESR", "LR", "NR","all_peaks","h.genome"))) %>%
  ggplot(., aes(x=mrc, fill= repFamily))+
  geom_bar(position="fill", col="black")+
  theme_bw()+
  ggtitle(paste("SINE breakdown by MRC and Family",per_cov))+
  scale_fill_sines()
plot2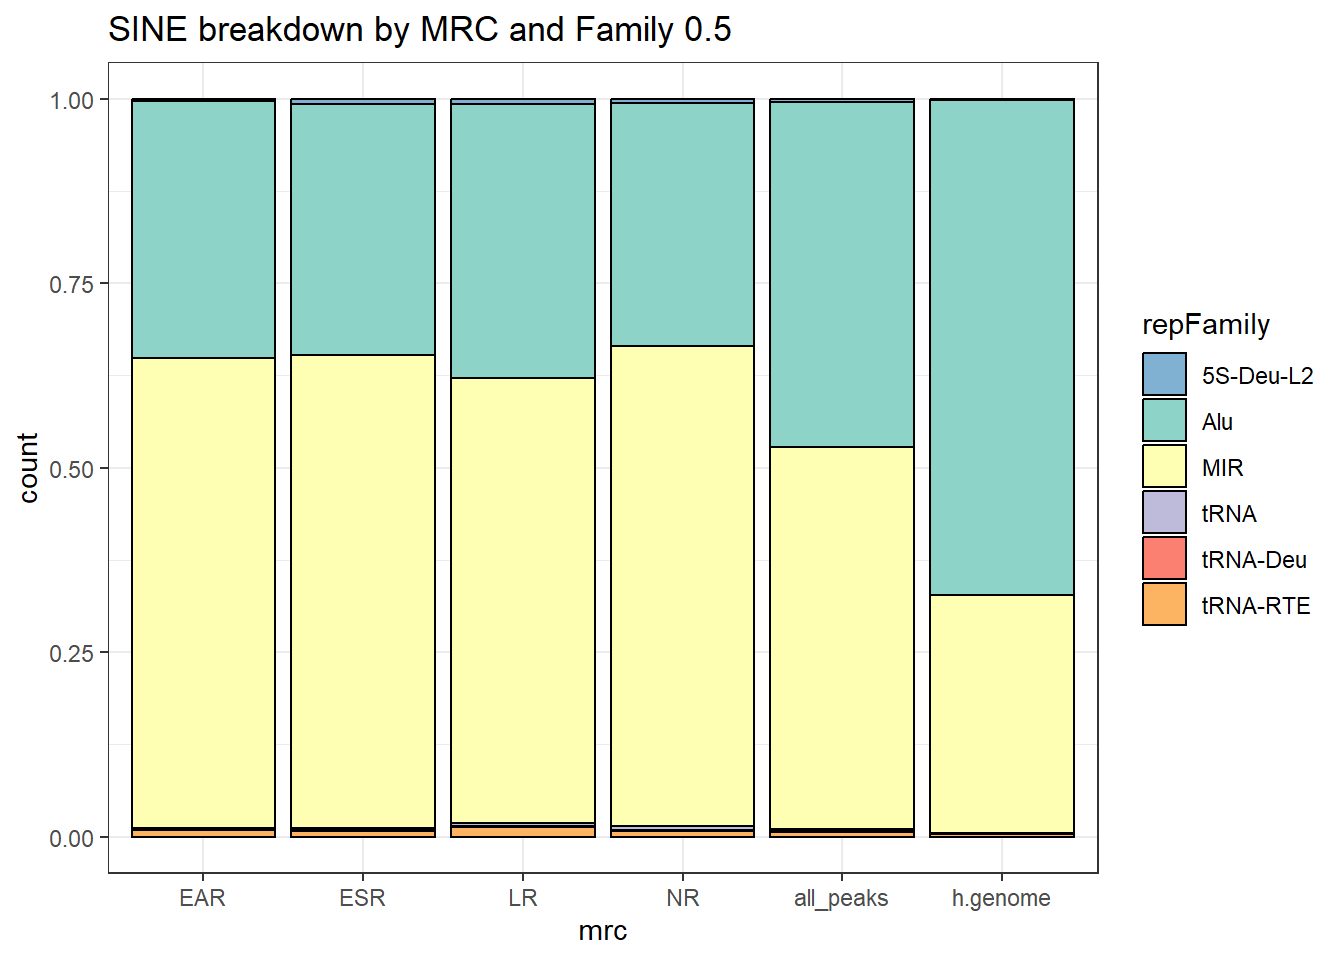
TE_mrc_status_list %>%
  dplyr::filter(repClass=="LTR"&per_ol>per_cov) %>%
  dplyr::filter(mrc != "not_mrc") %>%
   rbind(., ggLTR_df) %>%
  mutate(repFamily=factor(repFamily)) %>%
  mutate(mrc=factor(mrc, levels = c("EAR","ESR", "LR", "NR","all_peaks","h.genome"))) %>%
  ggplot(., aes(x=mrc, fill= repFamily))+
  geom_bar(position="fill", col="black")+
  theme_bw()+
  ggtitle(paste("LTR breakdown by MRC and Family",per_cov))+
  scale_fill_LTRs()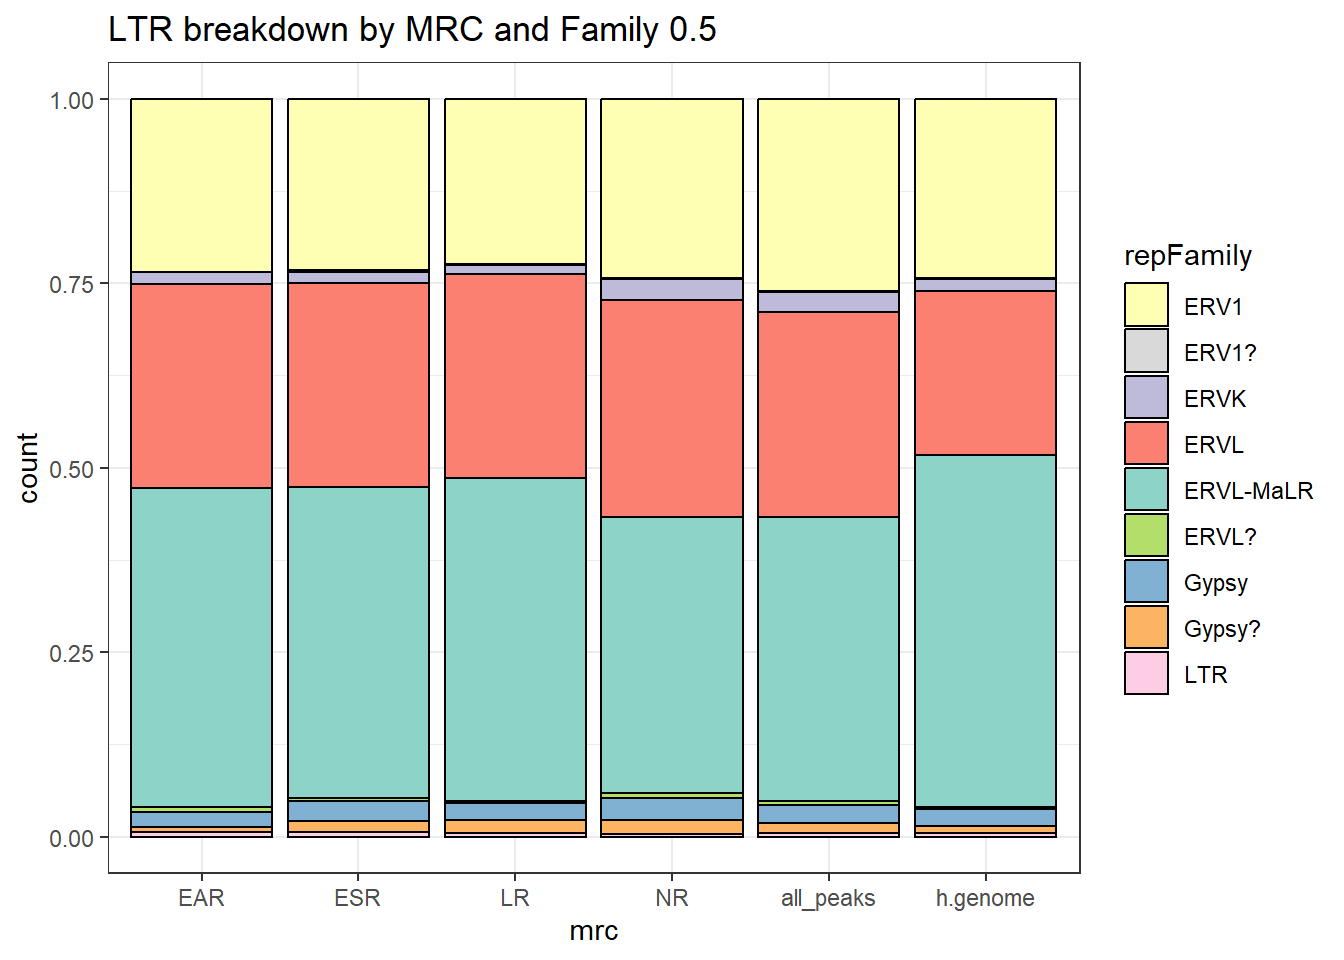
TE_mrc_status_list %>%
  dplyr::filter(repClass=="DNA"&per_ol>per_cov) %>%
  dplyr::filter(mrc != "not_mrc") %>%
   rbind(., ggDNA_df) %>%
  mutate(repFamily=factor(repFamily)) %>%
  mutate(mrc=factor(mrc, levels = c("EAR","ESR", "LR", "NR","all_peaks","h.genome"))) %>%
  ggplot(., aes(x=mrc, fill= repFamily))+
  geom_bar(position="fill", col="black")+
  theme_classic()+
  ggtitle(paste("DNA breakdown by MRC and Family",per_cov))+
  scale_fill_DNAs()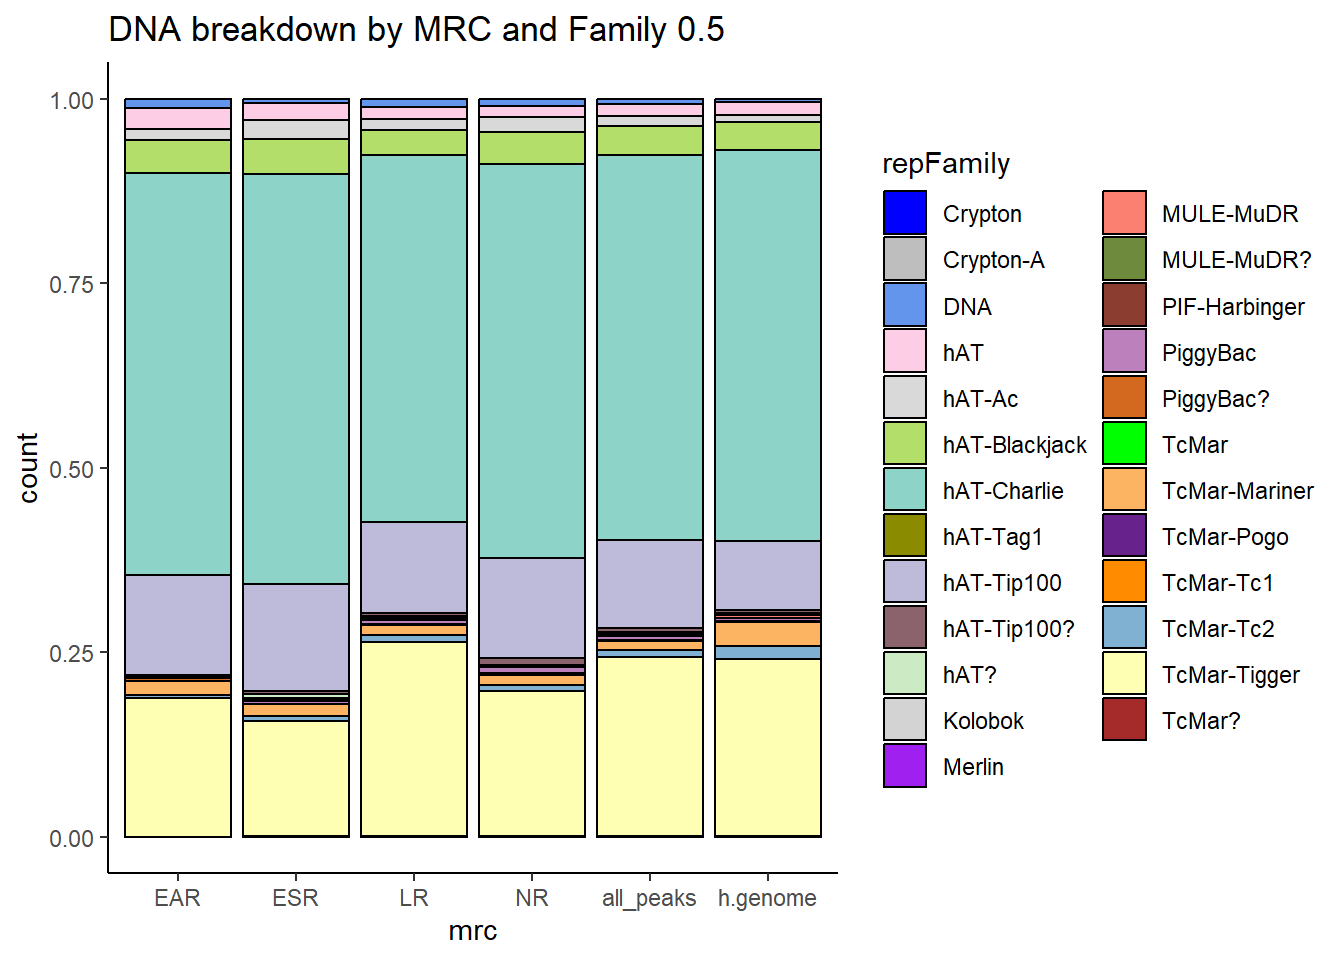
TE_mrc_status_list %>%
  dplyr::filter(repClass=="Retroposon"&per_ol>per_cov) %>%
  dplyr::filter(mrc != "not_mrc") %>%
   rbind(., ggretroposon_df) %>%
  mutate(repName=factor(repName)) %>%
  mutate(mrc=factor(mrc, levels = c("EAR","ESR", "LR", "NR","all_peaks","h.genome"))) %>%
  ggplot(., aes(x=mrc, fill= repName))+
  geom_bar(position="fill", col="black")+
  theme_classic()+
  ggtitle(paste("Retroposon breakdown by MRC and Family",per_cov))+
  scale_fill_retroposons()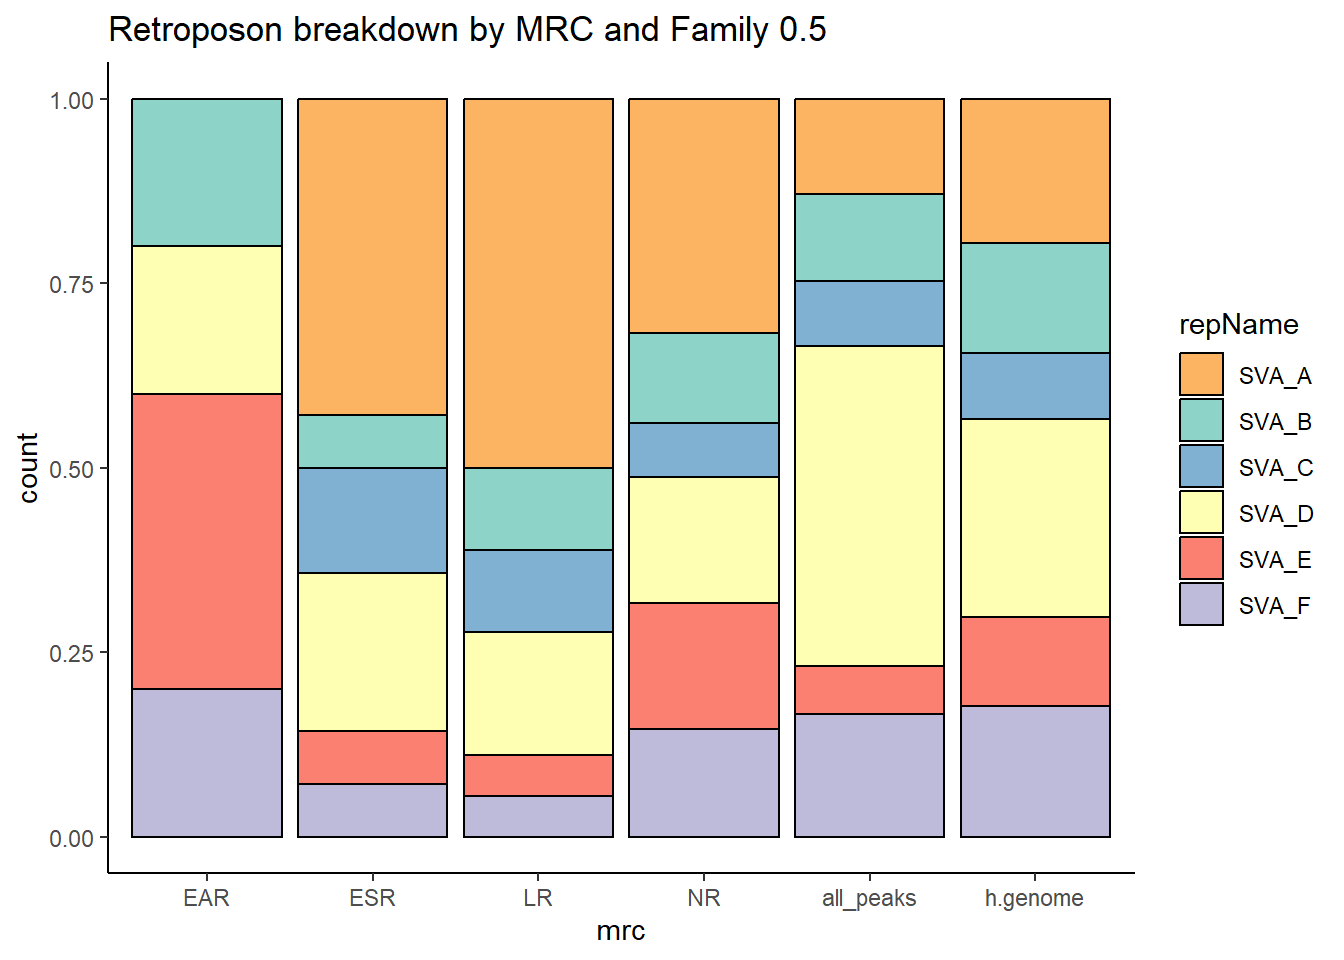
Adding in the new categories
Here I break up the categories using median LFC
- EAR_open = median 3 hour LFC > 0
- EAR_close = median 3 hour LFC < 0
- ESR_A = median 3 hour > 0 and median 24 hour >0
- ESR_B = median 3 hour < 0 and median 24 hour <0
- ESR_C = median 3 hour > 0 and median 24 hour <0
- ESR_D = median 3 hour < 0 and median 24 hour >0
- LR_open = median 24 hour LFC > 0
- LR_close = median 24 hour LFC < 0
- NR = all NR classified peaks
per_cov=0.5
median_24_lfc <- read_csv("data/Final_four_data/median_24_lfc.csv")
median_3_lfc <- read_csv("data/Final_four_data/median_3_lfc.csv")

open_3med <- median_3_lfc %>%
  dplyr::filter(med_3h_lfc > 0)

close_3med <- median_3_lfc %>%
  dplyr::filter(med_3h_lfc < 0)

open_24med <- median_24_lfc %>%
  dplyr::filter(med_24h_lfc > 0)

close_24med <- median_24_lfc %>%
  dplyr::filter(med_24h_lfc < 0)

medA <- median_3_lfc %>%
  left_join(median_24_lfc, by=c("peak"="peak")) %>%
  dplyr::filter(med_3h_lfc > 0 & med_24h_lfc>0)

medB <- median_3_lfc %>%
  left_join(median_24_lfc, by=c("peak"="peak")) %>%
  dplyr::filter(med_3h_lfc < 0 & med_24h_lfc < 0)

medC <- median_3_lfc %>%
  left_join(median_24_lfc, by=c("peak"="peak")) %>%
  dplyr::filter(med_3h_lfc > 0& med_24h_lfc <0)


medD <- median_3_lfc %>%
 left_join(median_24_lfc, by=c("peak"="peak"))%>%
  dplyr::filter(med_3h_lfc < 0 & med_24h_lfc > 0)


EAR_open <- EAR_df %>%
  dplyr::filter(Peakid %in% open_3med$peak)

EAR_open_gr <- EAR_open %>% GRanges()

EAR_close <- EAR_df %>%
  dplyr::filter(Peakid %in% close_3med$peak)

EAR_close_gr <- EAR_close %>% GRanges()

LR_open <- LR_df %>%
  dplyr::filter(Peakid %in% open_24med$peak)

LR_open_gr <- LR_open %>% GRanges()

LR_close <- LR_df %>%
  dplyr::filter(Peakid %in% close_24med$peak)

LR_close_gr <- LR_close %>% GRanges()

NR_gr <- NR_df %>%
   GRanges()

ESR_open <- ESR_df %>%
  dplyr::filter(Peakid %in% medA$peak)

ESR_open_gr <- ESR_open %>% GRanges()

ESR_close <- ESR_df %>%
  dplyr::filter(Peakid %in% medB$peak)

ESR_close_gr <- ESR_close %>% GRanges()

ESR_C <- ESR_df %>%
  dplyr::filter(Peakid %in% medC$peak)

ESR_D <- ESR_df %>%
  dplyr::filter(Peakid %in% medD$peak)


ESR_OC <- ESR_C %>%
  rbind(ESR_D)
ESR_OC_gr <- ESR_OC %>% GRanges()

Eight_group_TE <-  Col_TSS_data_gr %>%
  as.data.frame %>%
  dplyr::select(Peakid) %>%
  left_join(.,(Col_fullDF_overlap %>%
                 as.data.frame)) %>%
   mutate(TEstatus=if_else(is.na(repClass),"not_TE_peak","TE_peak")) %>%
   mutate(mrc=if_else(Peakid %in% EAR_open$Peakid, "EAR_open",
                      if_else(Peakid %in% EAR_close$Peakid, "EAR_close",
                              if_else(Peakid %in% ESR_open$Peakid,"ESR_open",
                                      if_else(Peakid %in% ESR_close$Peakid,"ESR_close",
                                              if_else(Peakid %in% ESR_OC$Peakid,"ESR_OC",
                                                              if_else(Peakid %in% LR_open$Peakid, "LR_open",
                                                                      if_else(Peakid %in% LR_close$Peakid, "LR_close",
                                     if_else(Peakid %in% NR_df$Peakid, "NR", "not_mrc"))))))))) %>%
                                       mutate(per_ol= width/TE_width) %>%
  mutate(repClass_org=repClass) %>%
  mutate(repClass=factor(repClass)) %>%
  mutate(repClass=if_else(##relable repClass with other
    repClass_org=="LINE", repClass_org,
    if_else(repClass_org=="SINE",repClass_org,
            if_else(repClass_org=="LTR", repClass_org,
                    if_else(repClass_org=="DNA", repClass_org,
                            if_else(repClass_org=="Retroposon",repClass_org,
                                    if_else(is.na(repClass_org), repClass_org, "Other"))))))) %>%
  dplyr::select(Peakid, repName,repClass,repClass_org, repFamily, width, TEstatus, mrc, per_ol)


Eight_group_TE %>% distinct(Peakid,.keep_all = TRUE) %>%
  group_by(mrc, TEstatus) %>%
  dplyr::filter(is.na(per_ol)|per_ol>per_cov) %>%
  # dplyr::filter(is.na(repClass)|repClass != "Other") %>%
  tally
# A tibble: 18 × 3
# Groups: mrc [9]
mrc TEstatus n
<chr> <chr> <int>
1 EAR_close TE_peak 1679
2 EAR_close not_TE_peak 1447
3 EAR_open TE_peak 1354
4 EAR_open not_TE_peak 1072
5 ESR_OC TE_peak 478
6 ESR_OC not_TE_peak 350
7 ESR_close TE_peak 3542
8 ESR_close not_TE_peak 3335
9 ESR_open TE_peak 2376
10 ESR_open not_TE_peak 1714
11 LR_close TE_peak 5649
12 LR_close not_TE_peak 4726
13 LR_open TE_peak 12525
14 LR_open not_TE_peak 8216
15 NR TE_peak 35983
16 NR not_TE_peak 27863
17 not_mrc TE_peak 5780
18 not_mrc not_TE_peak 7611EAR
ESR
LR
NR
sub-set breakdown with new classes
This section reclassifies any TE that is NOT a LINE, SINE, LTR, DNA, or retroposon as “other”. Still using > 50% coverage cutoff
per_cov <- 0.5
subsetall_df <-  Eight_group_TE %>%
  dplyr::filter(per_ol>per_cov) %>%
  dplyr::filter(mrc != "not_mrc") %>%
  mutate(mrc="all_peaks")

# h.genome_df <- LiSiLTDNRe %>%
h.genome_df <- repeatmasker %>%
  mutate(repClass_org = repClass) %>% #copy repClass for storage
  mutate(repClass=if_else(##relable repClass with other
    repClass_org=="LINE", repClass_org,if_else(repClass_org=="SINE",repClass_org,if_else(repClass_org=="LTR", repClass_org, if_else(repClass_org=="DNA", repClass_org, if_else(repClass_org=="Retroposon",repClass_org,"Other")))))) %>%
  mutate(Peakid=paste0(rownames(.),"_TE")) %>%
  dplyr::select(Peakid,repName,repClass, repFamily,repClass_org) %>%
   mutate(TEstatus ="TE_peak", mrc="h.genome",per_ol = "NA", width="NA")


Eight_group_TE %>%
  dplyr::filter(mrc != "not_mrc") %>%
  dplyr::filter(per_ol>per_cov) %>%
  rbind(subsetall_df) %>%
  mutate(mrc=factor(mrc, levels = c("EAR_open","EAR_close","ESR_open", "ESR_close","ESR_OC", "LR_open","LR_close","NR","all_peaks"))) %>%
  ggplot(., aes(x=mrc, fill= repClass))+
  geom_bar(position="fill", col="black")+
  theme_bw()+
  ggtitle(paste("Repeat breakdown across eight clusters", per_cov))+
  scale_fill_repeat()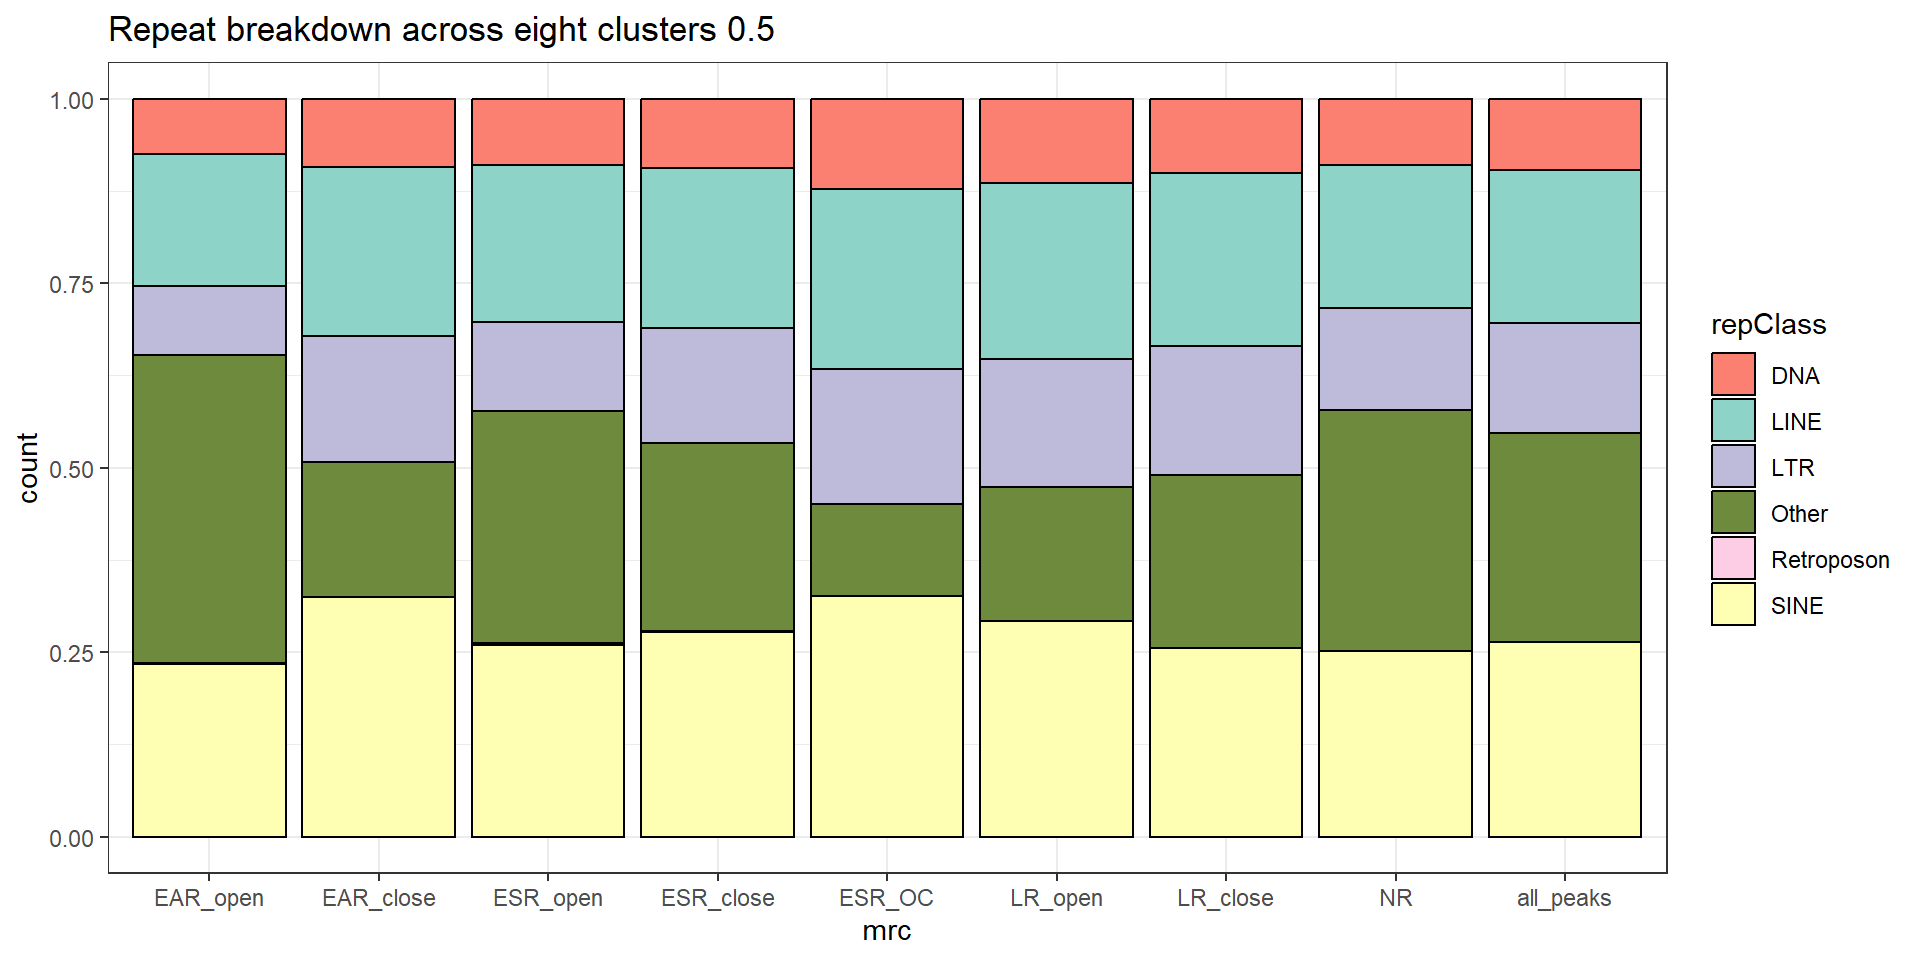
Now I will display without the “other” and regraph with new groups
Eight_group_TE %>%
  dplyr::filter(mrc != "not_mrc") %>%
  dplyr::filter(per_ol>per_cov) %>%
  rbind(subsetall_df) %>%
  mutate(mrc=factor(mrc, levels = c("EAR_open","EAR_close","ESR_open", "ESR_close","ESR_OC", "LR_open","LR_close","NR","all_peaks"))) %>%
  dplyr::filter(is.na(repClass)|repClass != "Other") %>%
  ggplot(., aes(x=mrc, fill= repClass))+
  geom_bar(position="fill", col="black")+
  theme_bw()+
   ggtitle(paste("Repeat breakdown across eight clusters without 'Other'", per_cov))+
  scale_fill_repeat()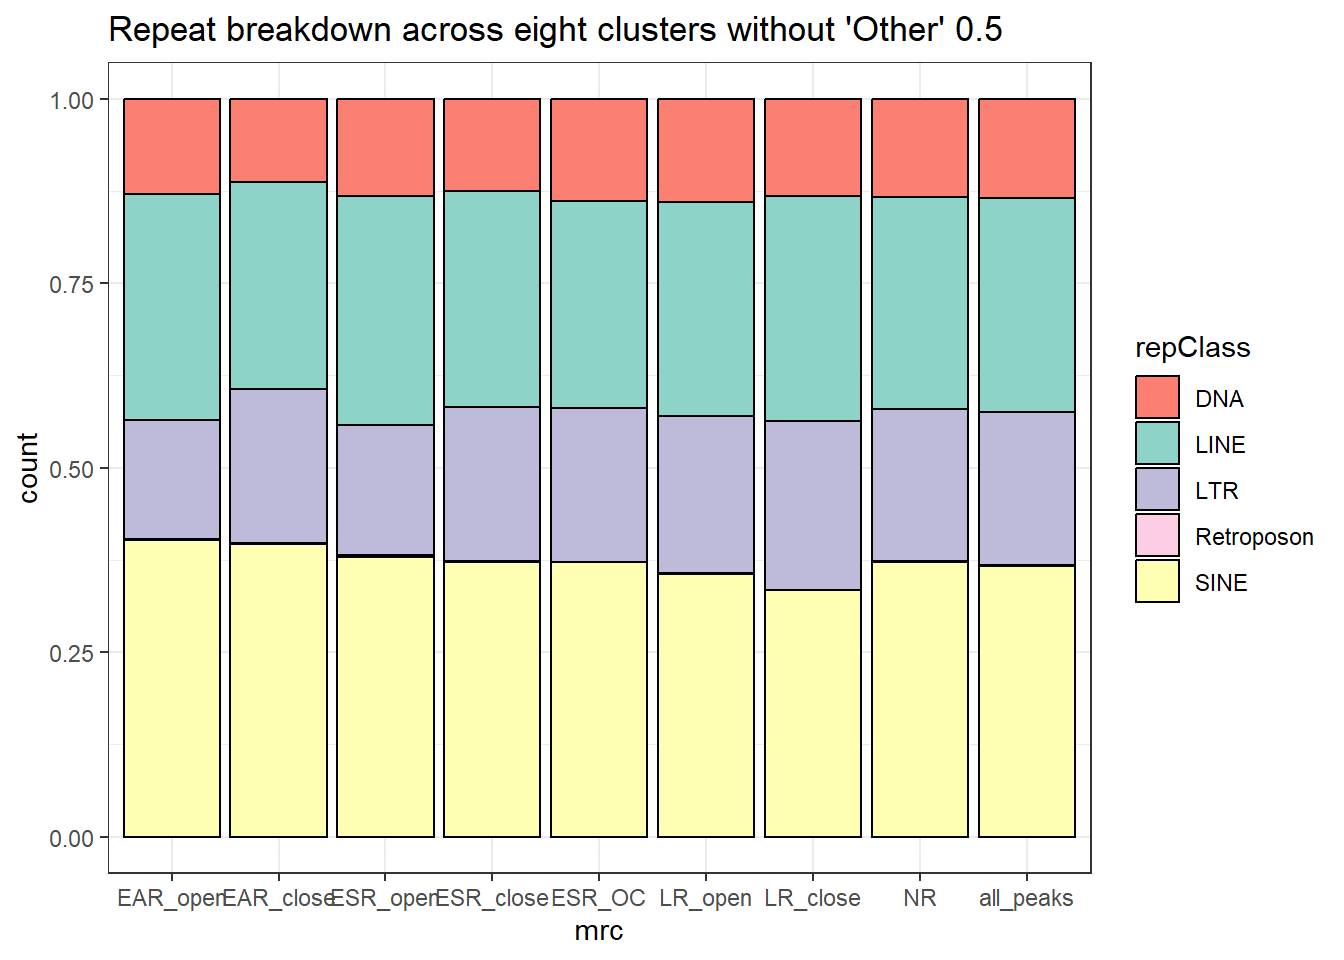
Eight_group_TE %>%
   mutate(repClass_org = repClass) %>%
   dplyr::select(Peakid,repName,repClass,repFamily,width,TEstatus, mrc, per_ol) %>%
  distinct(Peakid, .keep_all = TRUE) %>%
  rbind(Lines_Etc) %>%
   dplyr::filter(per_ol>per_cov|is.na(per_ol)) %>%
  mutate(repClass=factor(repClass)) %>%
  mutate(TEstatus=factor(TEstatus, levels = c("TE_peak","not_TE_peak")))%>%
  dplyr::filter(mrc != "not_mrc") %>%
  mutate(mrc=factor(mrc, levels = c("EAR_open","EAR_close","ESR_open", "ESR_close","ESR_OC", "LR_open","LR_close","NR","all_peaks"))) %>%
  ggplot(., aes(x=mrc, fill= TEstatus))+
  geom_bar(position="fill", col="black")+
  theme_classic()+
  ggtitle(paste("TE status for eight MRCs and Family > 50 %"))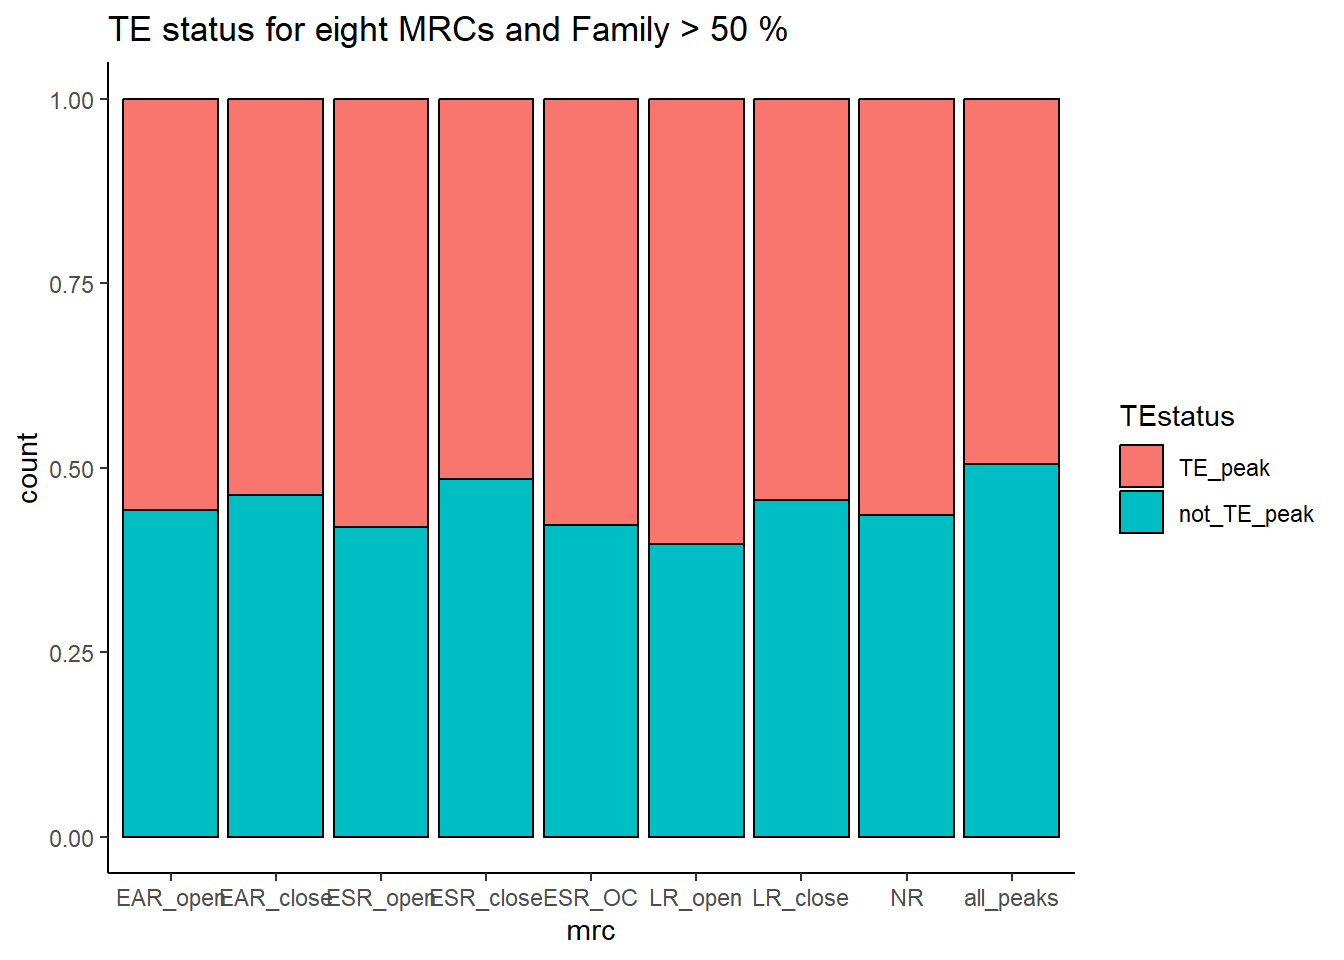
Eight_group_TE %>%
   mutate(repClass_org = repClass) %>%
   # dplyr::filter(!repClass %in% notinterested_list) %>%
  dplyr::filter(is.na(repClass)|repClass !="Other") %>%
  dplyr::select(Peakid,repName,repClass,repFamily,width,TEstatus, mrc, per_ol) %>%
  distinct(Peakid, .keep_all = TRUE) %>%
  rbind(Lines_Etc) %>%
  dplyr::filter(is.na(repClass)|repClass != "Other") %>%
  dplyr::filter(per_ol>per_cov|is.na(per_ol)) %>%
  mutate(repClass=factor(repClass)) %>%
  mutate(TEstatus=factor(TEstatus, levels = c("TE_peak","not_TE_peak")))%>%
  dplyr::filter(mrc != "not_mrc") %>%
  mutate(mrc=factor(mrc, levels = c("EAR_open","EAR_close","ESR_open", "ESR_close","ESR_OC", "LR_open","LR_close","NR","all_peaks"))) %>%
  ggplot(., aes(x=mrc, fill= TEstatus))+
  geom_bar(position="fill", col="black")+
  theme_classic()+
  ggtitle(paste("TE status for eight MRCs and Family > 50 %"), subtitle = "Just LINEs, SINEs,LTRs, DNAs, Retroposons, and all peaks in the MRC families")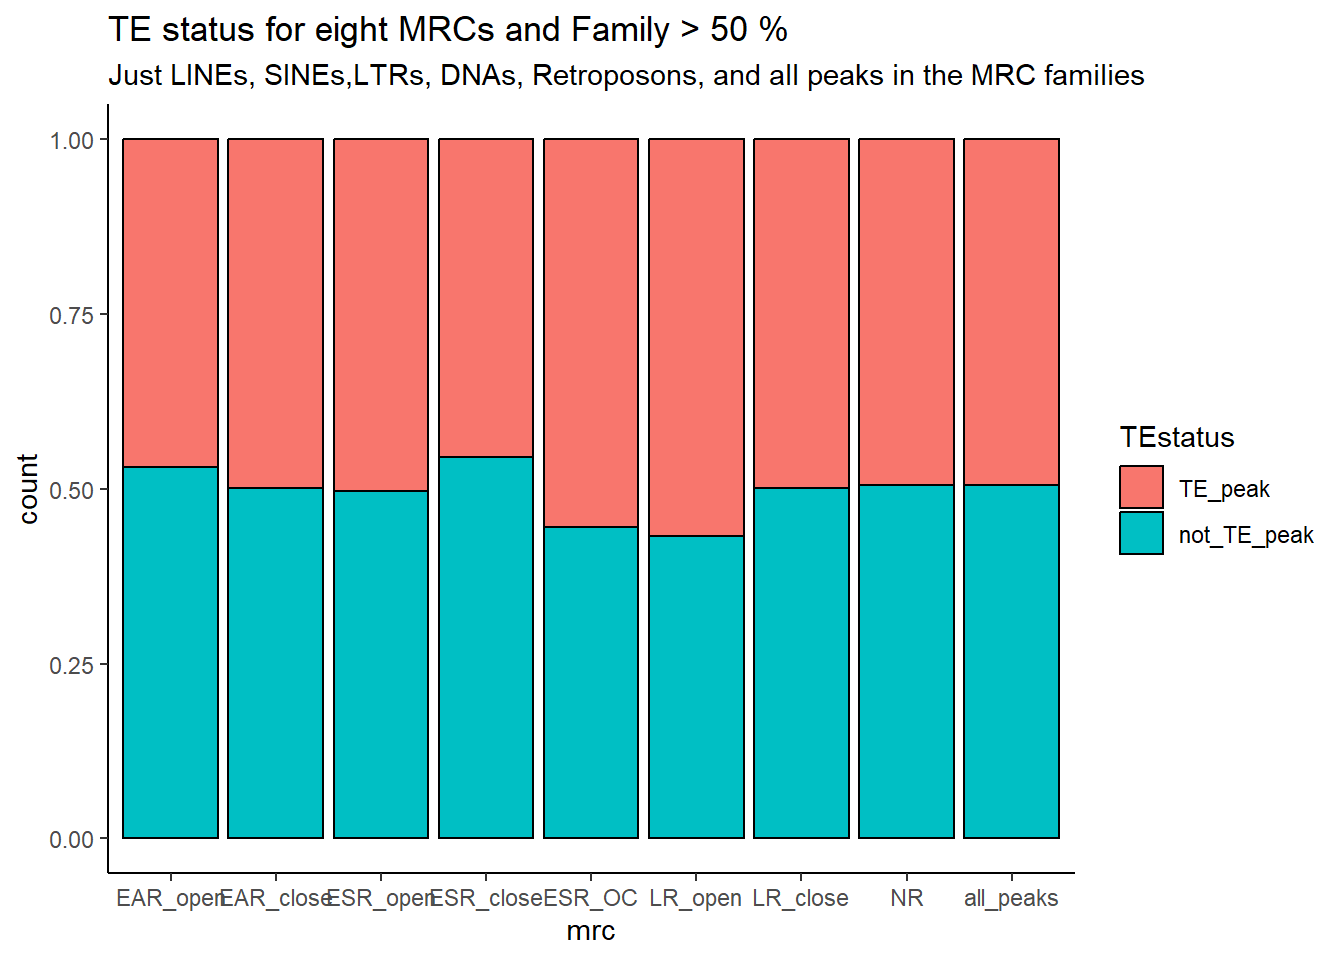
Eight_group_TE %>%
  mutate(repClass_org = repClass) %>%
  dplyr::filter(is.na(repClass)|repClass != "Other") %>%
  dplyr::select(Peakid,repName,repClass,repFamily,width,TEstatus, mrc, per_ol) %>%
  distinct(Peakid, .keep_all = TRUE) %>%
  rbind(Lines_Etc) %>%
  dplyr::filter(is.na(repClass)|repClass !="Other") %>%
  dplyr::filter(per_ol>per_cov|is.na(per_ol)) %>%
  dplyr::filter(mrc != "not_mrc") %>%
  group_by(TEstatus, mrc) %>%
  tally %>%
  pivot_wider(., id_cols = mrc, names_from = TEstatus, values_from = n) %>%
  kable(., caption = "Unique Peak TE status counts for each MRC\nLINEs, SINEs,LTRs, DNAs, Retroposons only using >50% of TE") %>%
  kable_paper("striped", full_width = TRUE) %>%
  kable_styling(full_width = FALSE, font_size = 14)%>%
scroll_box(height = "500px")| mrc | TE_peak | not_TE_peak |
|---|---|---|
| EAR_close | 1442 | 1447 |
| EAR_open | 945 | 1072 |
| ESR_OC | 435 | 350 |
| ESR_close | 2780 | 3335 |
| ESR_open | 1736 | 1714 |
| LR_close | 4695 | 4726 |
| LR_open | 10783 | 8216 |
| NR | 27301 | 27863 |
| all_peaks | 55171 | 56334 |
This code is for Chi analysis
####### LOoKing at the results from TE counts across clusters##### with cutoff

chi_TE_nine <- Eight_group_TE %>%
  dplyr::filter(is.na(per_ol)|per_ol>.5) %>%
  dplyr::select(Peakid,TEstatus, mrc)%>%
  distinct(Peakid, .keep_all = TRUE) %>%
  group_by(mrc,TEstatus) %>%
  tally %>%
  ungroup() %>%
  pivot_wider(., id_cols = mrc, names_from = TEstatus, values_from = n) %>%
  column_to_rownames("mrc")

chi_TE_nine_mat <- chi_TE_nine %>% as.matrix

EARopenvNR <- matrix(c(chi_TE_nine_mat[2,1],chi_TE_nine_mat[2,2],chi_TE_nine_mat[8,1],chi_TE_nine_mat[8,2]),ncol=2, byrow=TRUE)%>% chisq.test(.)

EARclosevNR <- matrix(c(chi_TE_nine_mat[1,1],chi_TE_nine_mat[1,2],chi_TE_nine_mat[8,1],chi_TE_nine_mat[8,2]),ncol=2, byrow=TRUE)%>% chisq.test(.)

ESRopenvNR <- matrix(c(chi_TE_nine_mat[5,1],chi_TE_nine_mat[5,2],chi_TE_nine_mat[8,1],chi_TE_nine_mat[8,2]),ncol=2, byrow=TRUE)%>% chisq.test(.)

ESRclosevNR <- matrix(c(chi_TE_nine_mat[4,1],chi_TE_nine_mat[4,2],chi_TE_nine_mat[8,1],chi_TE_nine_mat[8,2]),ncol=2, byrow=TRUE)%>% chisq.test(.)

ESROCvNR <- matrix(c(chi_TE_nine_mat[3,1],chi_TE_nine_mat[3,2],chi_TE_nine_mat[8,1],chi_TE_nine_mat[8,2]),ncol=2, byrow=TRUE)%>% chisq.test(.)


LRopenvNR <- matrix(c(chi_TE_nine_mat[7,1],chi_TE_nine_mat[7,2],chi_TE_nine_mat[8,1],chi_TE_nine_mat[8,2]),ncol=2, byrow=TRUE) %>% chisq.test(.)

LRclosevNR <- matrix(c(chi_TE_nine_mat[6,1],chi_TE_nine_mat[6,2],chi_TE_nine_mat[8,1],chi_TE_nine_mat[8,2]),ncol=2, byrow=TRUE)%>% chisq.test(.)

pvalue <- c(EARclosevNR$p.value,
            EARopenvNR$p.value,
            ESROCvNR$p.value,
            ESRclosevNR$p.value,
            ESRopenvNR$p.value,
            LRclosevNR$p.value,
            LRopenvNR$p.value,
            "na",
            "not checked")

chi_TE_nine %>%
  cbind(pvalue) %>%
  mutate(pvalue= as.numeric(pvalue)) %>%
  mutate(signif=if_else(pvalue<0.005,"***",if_else(pvalue<0.01,"**",if_else(pvalue<0.05,"*","ns")))) %>%
  mutate(per_TE=TE_peak/(TE_peak+not_TE_peak)*100) %>%
  mutate(per_TE=sprintf("%.2f%% ",per_TE)) %>%
    kable(., caption = "Unique Peak TE status with all TEs for each MRC, >50% TE coverage") %>%
   kable_paper("striped", full_width = TRUE) %>%
  kable_styling(full_width = FALSE, font_size = 14) %>%
scroll_box(height = "500px")| TE_peak | not_TE_peak | pvalue | signif | per_TE | |
|---|---|---|---|---|---|
| EAR_close | 2040 | 1447 | 0.0074714 | ** | 58.50% |
| EAR_open | 1604 | 1072 | 0.3909488 | ns | 59.94% |
| ESR_OC | 605 | 350 | 0.1140091 | ns | 63.35% |
| ESR_close | 4273 | 3335 | 0.0000000 | *** | 56.16% |
| ESR_open | 2829 | 1714 | 0.0482116 |
|
62.27% |
| LR_close | 6822 | 4726 | 0.0005100 | *** | 59.08% |
| LR_open | 15370 | 8216 | 0.0000000 | *** | 65.17% |
| NR | 43188 | 27863 | NA | NA | 60.78% |
| not_mrc | 6996 | 7611 | NA | NA | 47.89% |
sub-Class breakdown
per_cov <- 0.5

ggline_df <-
Line_repeats %>%
  as.data.frame() %>%
 tidyr::unite(Peakid,seqnames:end, sep= ".") %>%
  dplyr::select(Peakid,repName,repClass, repFamily,width) %>%
   mutate(repClass_org=repClass) %>%
   mutate(repClass=if_else(##relable repClass with other
    repClass_org=="LINE", repClass_org,
    if_else(repClass_org=="SINE",repClass_org,
            if_else(repClass_org=="LTR", repClass_org,
                    if_else(repClass_org=="DNA", repClass_org,
                            if_else(repClass_org=="Retroposon",repClass_org,
                                    if_else(is.na(repClass_org), repClass_org,"Other"))))))) %>%
  mutate(TEstatus ="TE_peak", mrc="h.genome", per_ol = "NA") %>%
    rbind(TE_mrc_status_list %>% dplyr::filter(repClass=="LINE"&per_ol>per_cov) %>% mutate(mrc="all_peaks") %>%  mutate(repClass_org=repClass))


ggsine_df <-
  Sine_repeats %>%
  as.data.frame() %>%
 tidyr::unite(Peakid,seqnames:end, sep= ".") %>%
  dplyr::select(Peakid,repName,repClass, repFamily,width) %>%
  mutate(TEstatus ="TE_peak", mrc="h.genome",per_ol = "NA") %>%
  mutate(repClass_org=repClass) %>%
   mutate(repClass=if_else(##relable repClass with other
    repClass_org=="LINE", repClass_org,
    if_else(repClass_org=="SINE",repClass_org,
            if_else(repClass_org=="LTR", repClass_org,
                    if_else(repClass_org=="DNA", repClass_org,
                            if_else(repClass_org=="Retroposon",repClass_org,
                                    if_else(is.na(repClass_org), repClass_org,"Other"))))))) %>%
    rbind(TE_mrc_status_list %>% dplyr::filter(repClass=="SINE"&per_ol>per_cov) %>% mutate(mrc="all_peaks") %>% mutate(repClass_org=repClass))

ggLTR_df <-LTR_repeats %>%
  as.data.frame() %>%
 tidyr::unite(Peakid,seqnames:end, sep= ".") %>%
  dplyr::select(Peakid,repName,repClass, repFamily,width) %>%
  mutate(TEstatus ="TE_peak", mrc="h.genome",per_ol = "NA")%>%
    rbind(TE_mrc_status_list %>% dplyr::filter(repClass=="LTR"&per_ol>per_cov) %>% mutate(mrc="all_peaks")) %>%  mutate(repClass_org=repClass)


ggDNA_df <-DNA_repeats %>%
  as.data.frame() %>%
 tidyr::unite(Peakid,seqnames:end, sep= ".") %>%
  dplyr::select(Peakid,repName,repClass, repFamily,width) %>%
  mutate(TEstatus ="TE_peak", mrc="h.genome",per_ol = "NA")%>%
    rbind(TE_mrc_status_list %>% dplyr::filter(repClass=="DNA"&per_ol>per_cov) %>% mutate(mrc="all_peaks")) %>% mutate(repClass_org=repClass)


ggretroposon_df <-retroposon_repeats %>%
  as.data.frame() %>%
 tidyr::unite(Peakid,seqnames:end, sep= ".") %>%
  dplyr::select(Peakid,repName,repClass, repFamily,width) %>%
  mutate(TEstatus ="TE_peak", mrc="h.genome",per_ol = "NA")%>%
    rbind(TE_mrc_status_list %>% dplyr::filter(repClass=="Retroposon"&per_ol>per_cov) %>% mutate(mrc="all_peaks")) %>%  mutate(repClass_org=repClass)
Eight group by subset TE type
eight_lines <- Eight_group_TE %>%
    dplyr::filter(repClass=="LINE"&per_ol>per_cov) %>%
  # distinct(mrc)
  dplyr::filter(mrc != "not_mrc") %>%
  rbind(., ggline_df) %>%
  mutate(repFamily=factor(repFamily)) %>%
  mutate(mrc=factor(mrc, levels = c("EAR_open","EAR_close","ESR_open", "ESR_close","ESR_OC", "LR_open","LR_close","NR","all_peaks","h.genome"))) %>%
  dplyr::filter(mrc != "h.genome")

eight_lines %>%
  ggplot(., aes(x=mrc, fill= repFamily))+
  geom_bar(position="fill", col="black")+
  theme_bw()+
  ggtitle(paste("LINE breakdown by eight-clusters and Family", per_cov))+
  scale_fill_lines()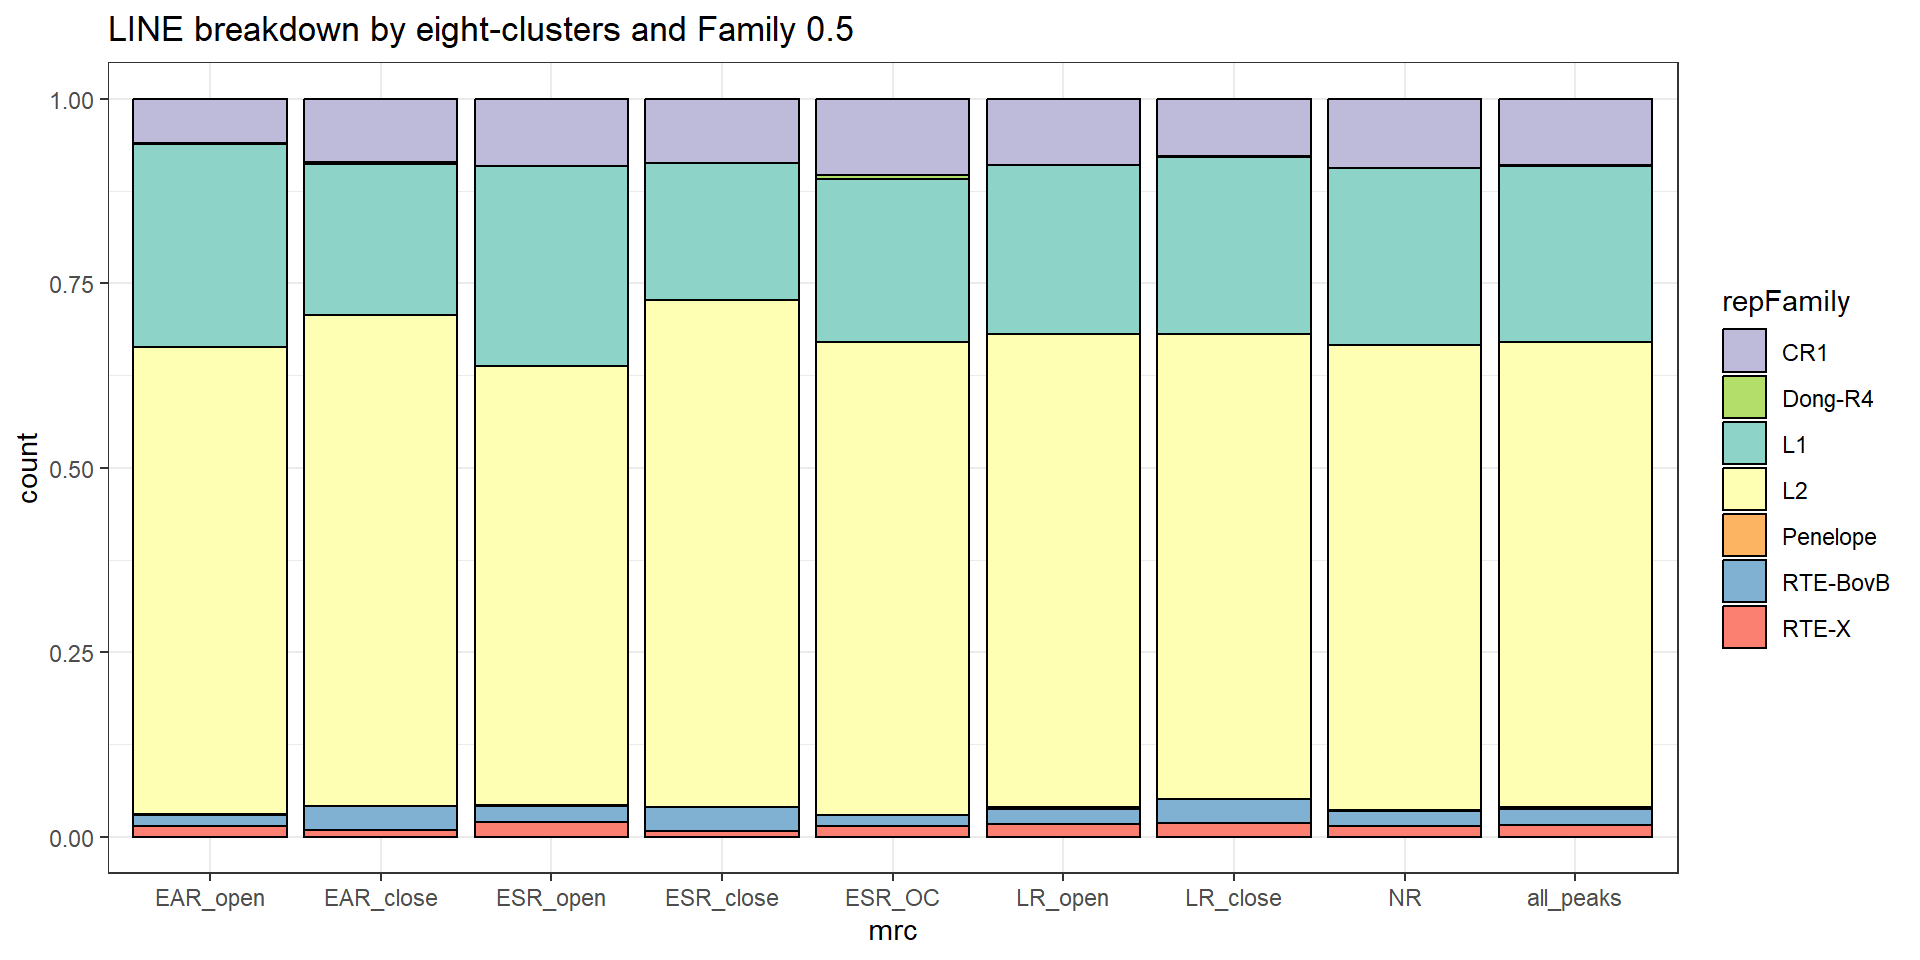
eight_lines %>%
  group_by(mrc,repFamily) %>%
  tally %>%
  pivot_wider(., id_cols = mrc, names_from = repFamily, values_from = n) %>%
  rowwise() %>%
 mutate(total= sum(c_across("CR1":"RTE-X"),na.rm =TRUE)) %>%
  kable(., caption="Breakdown of SINE counts by Family") %>%
kable_paper("striped", full_width = TRUE) %>%
  kable_styling(full_width = FALSE, font_size = 14) %>%
scroll_box(height = "500px")| mrc | CR1 | Dong-R4 | L1 | L2 | Penelope | RTE-BovB | RTE-X | total |
|---|---|---|---|---|---|---|---|---|
| EAR_open | 29 | 1 | 134 | 308 | 1 | 7 | 7 | 487 |
| EAR_close | 56 | 1 | 133 | 431 | NA | 21 | 6 | 648 |
| ESR_open | 85 | NA | 254 | 555 | 1 | 21 | 18 | 934 |
| ESR_close | 113 | NA | 241 | 890 | 1 | 41 | 10 | 1296 |
| ESR_OC | 21 | 1 | 45 | 130 | NA | 3 | 3 | 203 |
| LR_open | 486 | 5 | 1242 | 3477 | 9 | 116 | 90 | 5425 |
| LR_close | 176 | 3 | 549 | 1435 | 1 | 73 | 42 | 2279 |
| NR | 1205 | 1 | 3089 | 8112 | 26 | 253 | 189 | 12875 |
| all_peaks | 2376 | 12 | 6273 | 16555 | 45 | 593 | 396 | 26250 |
eight_sines <- Eight_group_TE %>%
  dplyr::filter(repClass=="SINE"&per_ol>per_cov) %>%
  dplyr::filter(mrc != "not_mrc") %>%
  rbind(., ggsine_df) %>%
  mutate(repFamily=factor(repFamily)) %>%
 mutate(mrc=factor(mrc, levels = c("EAR_open","EAR_close","ESR_open", "ESR_close","ESR_OC", "LR_open","LR_close","NR","all_peaks","h.genome"))) %>%
  dplyr::filter(mrc != "h.genome")

eight_sines %>%
  ggplot(., aes(x=mrc, fill= repFamily))+
  geom_bar(position="fill", col="black")+
  theme_bw()+
  ggtitle(paste("SINE breakdown by breakdown by eight-clusters and Family",per_cov))+
  scale_fill_sines()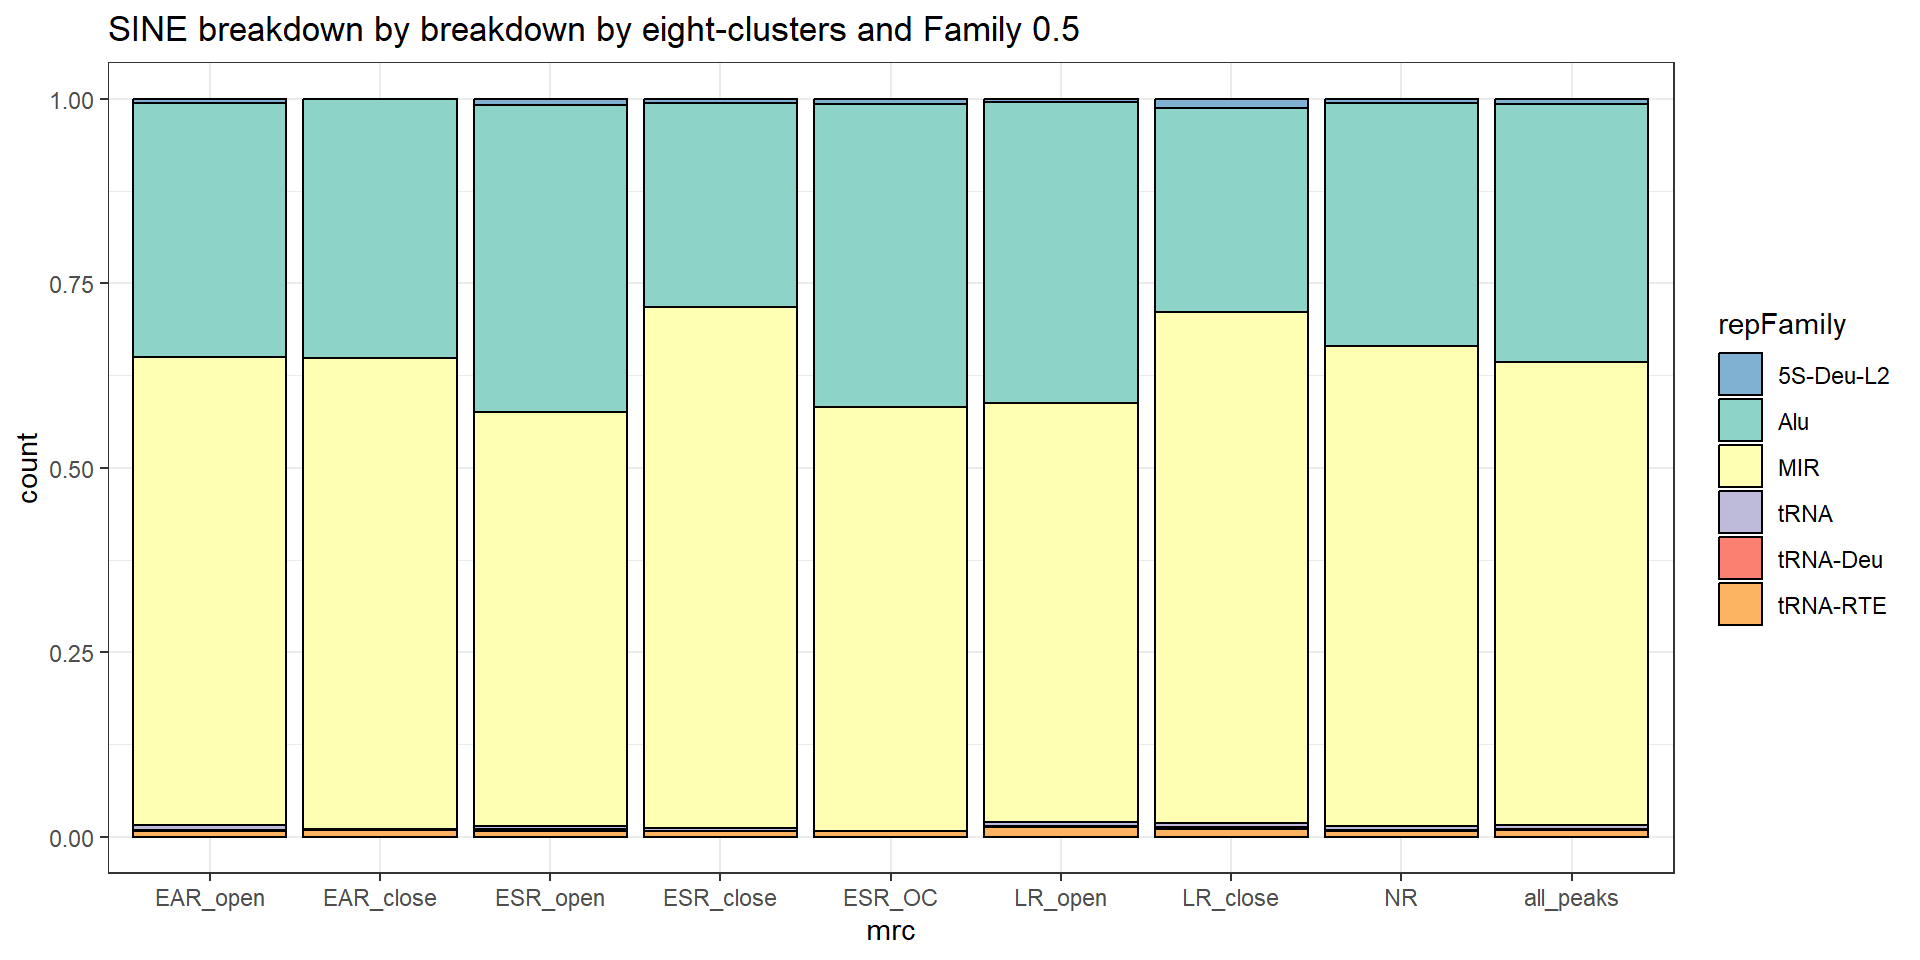
eight_sines %>%
  group_by(mrc,repFamily) %>%
  tally %>%
  pivot_wider(., id_cols = mrc, names_from = repFamily, values_from = n) %>%
  rowwise() %>%
 mutate(total= sum(c_across(1:6),na.rm =TRUE)) %>%
  kable(., caption="Breakdown of SINE counts by Family") %>%
kable_paper("striped", full_width = TRUE) %>%
  kable_styling(full_width = FALSE, font_size = 14)%>%
scroll_box(height = "500px")| mrc | 5S-Deu-L2 | Alu | MIR | tRNA | tRNA-Deu | tRNA-RTE | total |
|---|---|---|---|---|---|---|---|
| EAR_open | 4 | 219 | 403 | 4 | 1 | 5 | 636 |
| EAR_close | 1 | 322 | 586 | 1 | NA | 8 | 918 |
| ESR_open | 10 | 474 | 640 | 4 | 3 | 9 | 1140 |
| ESR_close | 9 | 457 | 1165 | 7 | NA | 12 | 1650 |
| ESR_OC | 2 | 111 | 155 | NA | NA | 2 | 270 |
| LR_open | 35 | 2716 | 3794 | 29 | 11 | 87 | 6672 |
| LR_close | 31 | 690 | 1726 | 13 | 6 | 26 | 2492 |
| NR | 108 | 5492 | 10855 | 74 | 26 | 131 | 16686 |
| all_peaks | 223 | 11509 | 20691 | 142 | 53 | 302 | 32920 |
eight_LTRs <- Eight_group_TE %>%
  dplyr::filter(repClass=="LTR"&per_ol>per_cov) %>%
  dplyr::filter(mrc != "not_mrc") %>%
  rbind(., ggLTR_df) %>%
  mutate(repFamily=factor(repFamily)) %>%
 mutate(mrc=factor(mrc, levels = c("EAR_open","EAR_close","ESR_open", "ESR_close","ESR_OC", "LR_open","LR_close","NR","all_peaks","h.genome"))) %>%
  dplyr::filter(mrc != "h.genome")

eight_LTRs %>%
  ggplot(., aes(x=mrc, fill= repFamily))+
  geom_bar(position="fill", col="black")+
  theme_bw()+
  ggtitle(paste("LTR breakdown by breakdown by eight-clusters and Family",per_cov))+
  scale_fill_LTRs()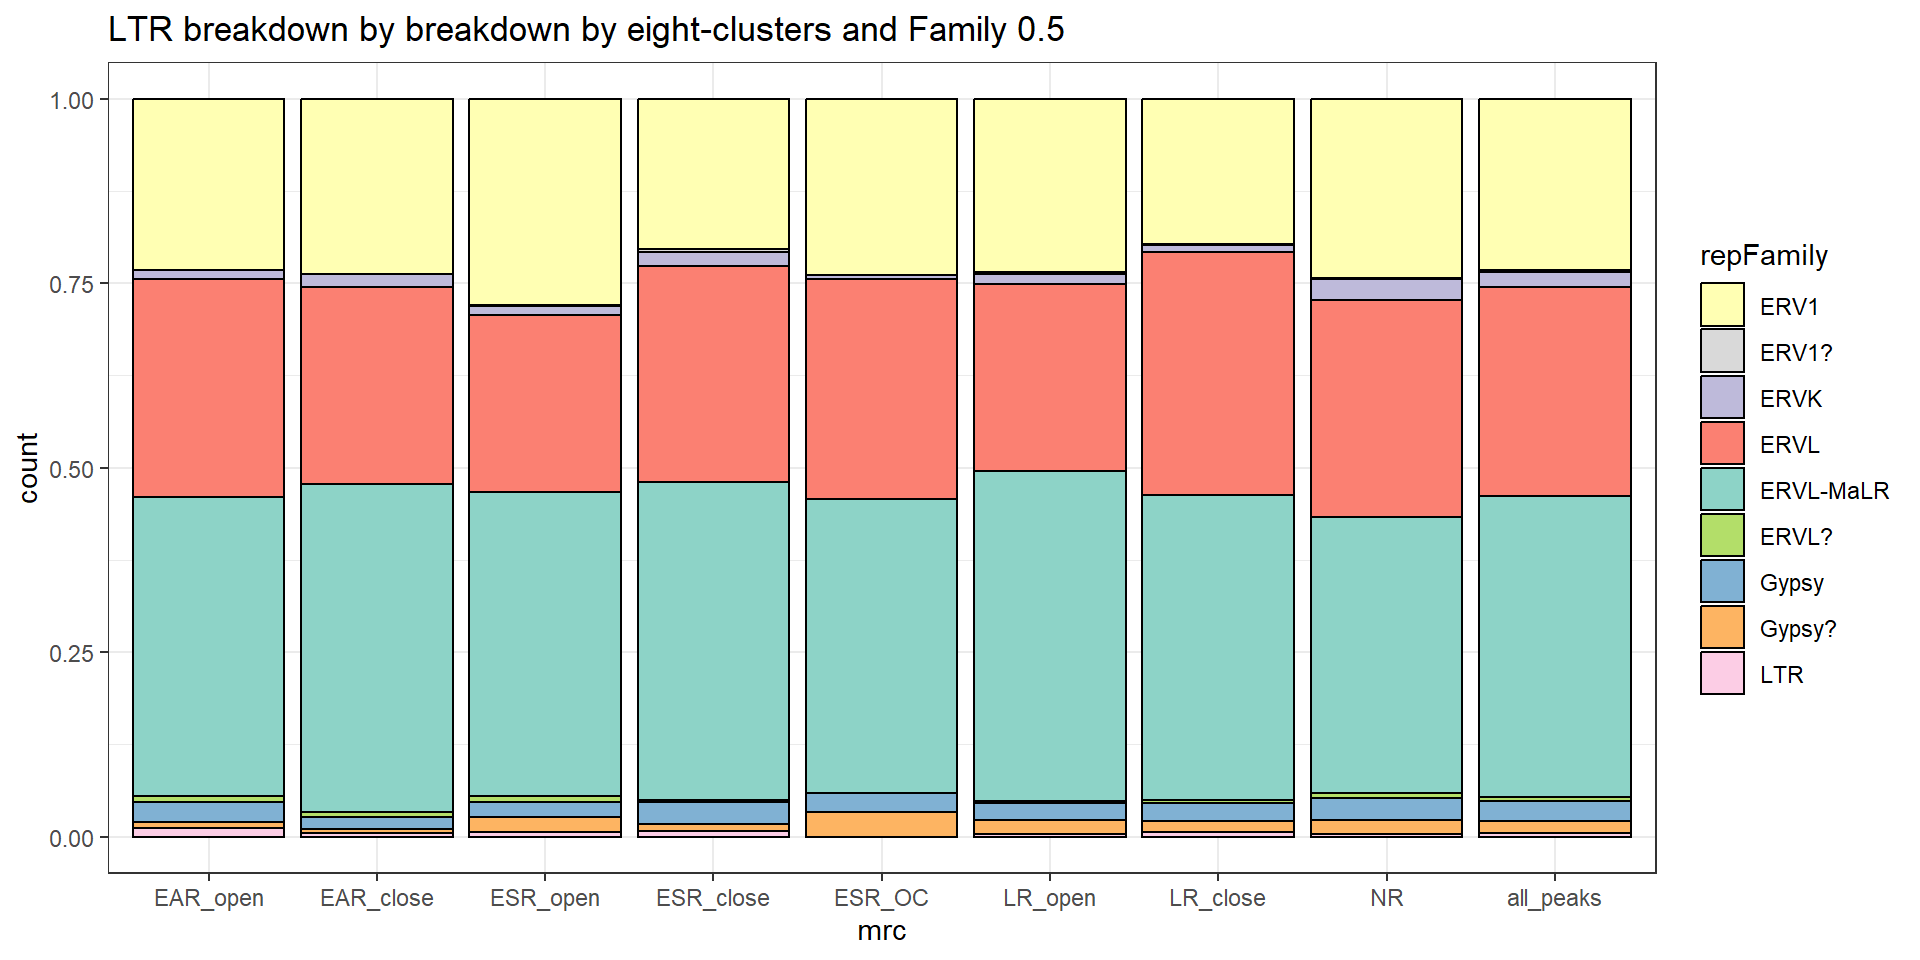
eight_LTRs %>%
  group_by(mrc,repFamily) %>%
  tally %>%
  pivot_wider(., id_cols = mrc, names_from = repFamily, values_from = n) %>%
  rowwise() %>%
 mutate(total= sum(c_across(1:9),na.rm =TRUE)) %>%
  kable(., caption="Breakdown of LTR counts by Family") %>%
kable_paper("striped", full_width = TRUE) %>%
  kable_styling(full_width = FALSE, font_size = 14)%>%
scroll_box(height = "500px")| mrc | ERV1 | ERVK | ERVL | ERVL-MaLR | ERVL? | Gypsy | Gypsy? | LTR | ERV1? | total |
|---|---|---|---|---|---|---|---|---|---|---|
| EAR_open | 59 | 3 | 75 | 103 | 2 | 7 | 2 | 3 | NA | 254 |
| EAR_close | 115 | 9 | 129 | 216 | 3 | 8 | 3 | 2 | NA | 485 |
| ESR_open | 148 | 6 | 127 | 218 | 4 | 11 | 11 | 3 | 1 | 529 |
| ESR_close | 190 | 18 | 273 | 401 | 3 | 27 | 9 | 7 | 3 | 931 |
| ESR_OC | 36 | 1 | 45 | 60 | NA | 4 | 5 | NA | NA | 151 |
| LR_open | 935 | 54 | 1008 | 1780 | 12 | 90 | 75 | 15 | 8 | 3977 |
| LR_close | 336 | 15 | 564 | 707 | 8 | 41 | 26 | 10 | 4 | 1711 |
| NR | 2241 | 264 | 2697 | 3451 | 61 | 276 | 168 | 37 | 13 | 9208 |
| all_peaks | 4407 | 390 | 5363 | 7725 | 100 | 506 | 319 | 86 | 33 | 18929 |
eight_DNA <- Eight_group_TE %>%
  dplyr::filter(repClass=="DNA"&per_ol>per_cov) %>%
  dplyr::filter(mrc != "not_mrc") %>%
  rbind(., ggDNA_df) %>%
  mutate(repFamily=factor(repFamily)) %>%
mutate(mrc=factor(mrc, levels = c("EAR_open","EAR_close","ESR_open", "ESR_close","ESR_OC", "LR_open","LR_close","NR","all_peaks","h.genome"))) %>%
  dplyr::filter(mrc != "h.genome")

eight_DNA %>%
  ggplot(., aes(x=mrc, fill= repFamily))+
  geom_bar(position="fill", col="black")+
  theme_bw()+
  ggtitle(paste("DNA breakdown by breakdown by eight-clusters and Family",per_cov))+
  scale_fill_DNAs()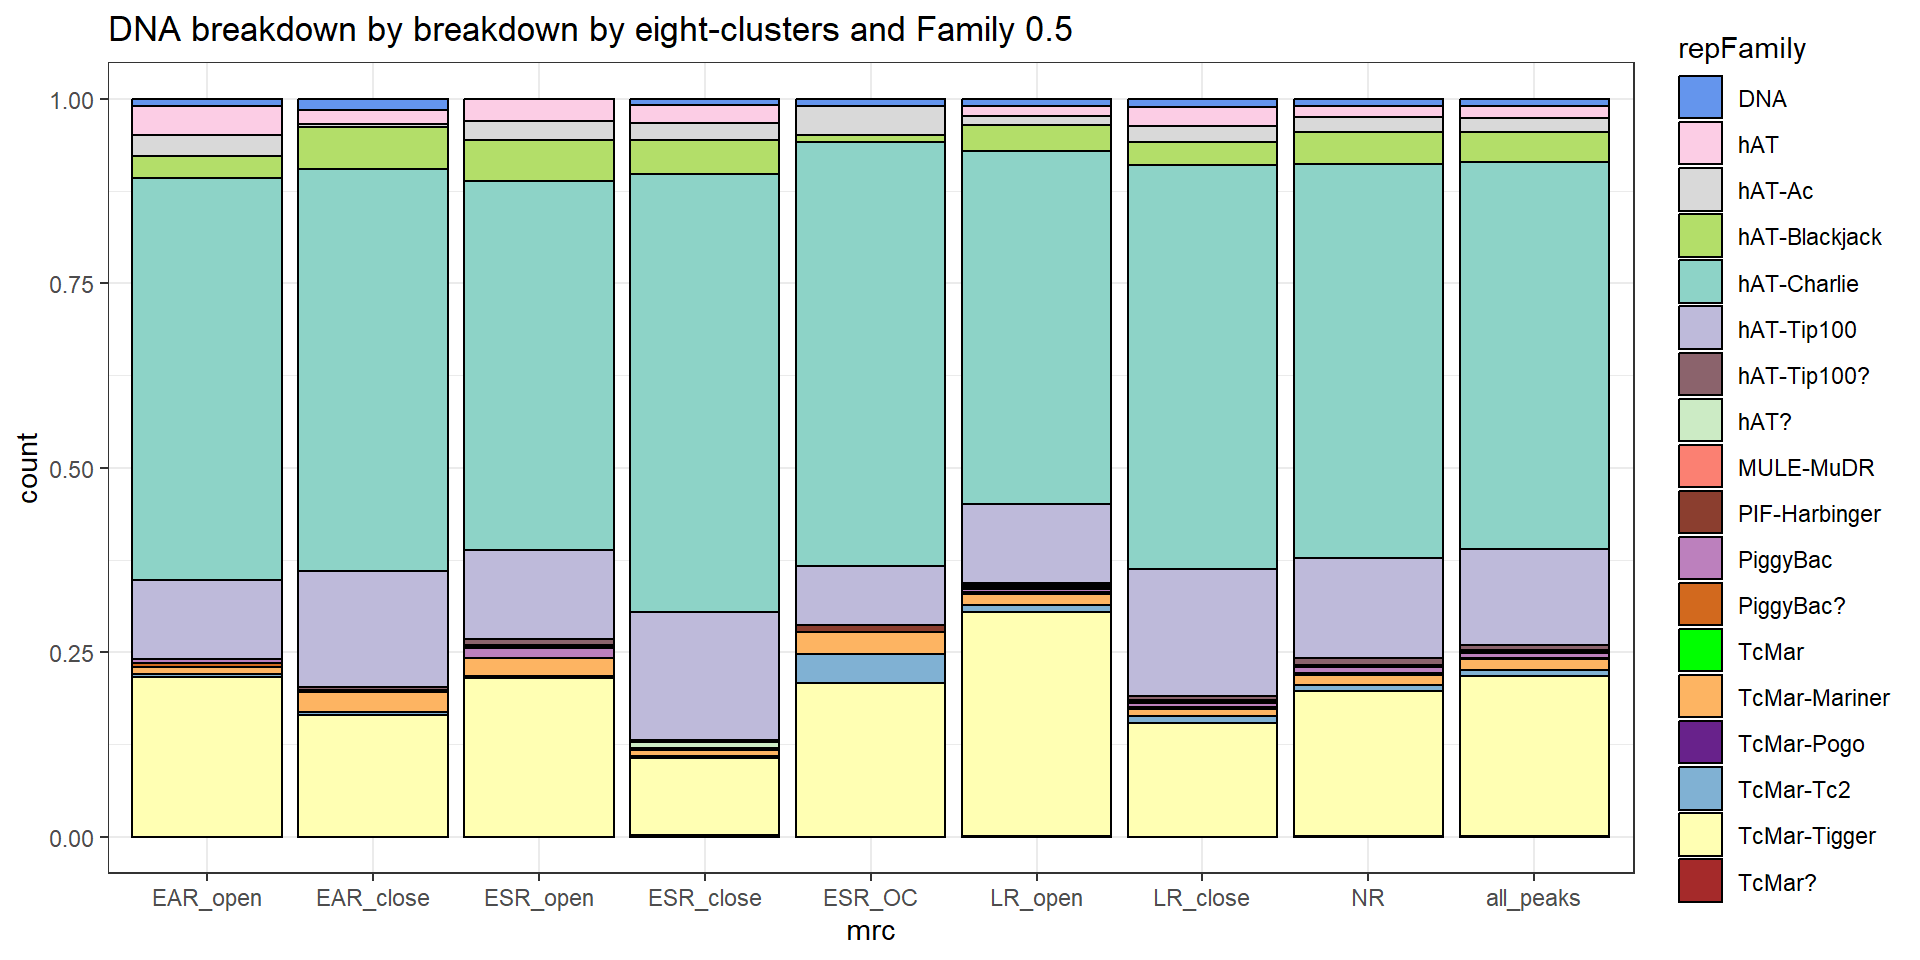
eight_DNA %>%
  group_by(mrc,repFamily) %>%
  tally %>%
  pivot_wider(., id_cols = mrc, names_from = repFamily, values_from = n) %>%
  rowwise() %>%
 mutate(total= sum(c_across(1:18),na.rm =TRUE)) %>%
  kable(., caption="Breakdown of DNA counts by Family") %>%
kable_paper("striped", full_width = TRUE) %>%
  kable_styling(full_width = FALSE, font_size = 14)%>%
scroll_box(height = "500px")| mrc | DNA | hAT | hAT-Ac | hAT-Blackjack | hAT-Charlie | hAT-Tip100 | PiggyBac | PiggyBac? | TcMar-Mariner | TcMar-Tc2 | TcMar-Tigger | hAT-Tip100? | hAT? | MULE-MuDR | TcMar? | PIF-Harbinger | TcMar | TcMar-Pogo | total |
|---|---|---|---|---|---|---|---|---|---|---|---|---|---|---|---|---|---|---|---|
| EAR_open | 2 | 8 | 6 | 6 | 111 | 22 | 1 | 1 | 2 | 1 | 44 | NA | NA | NA | NA | NA | NA | NA | 204 |
| EAR_close | 4 | 5 | 1 | 15 | 142 | 41 | NA | 1 | 7 | 1 | 43 | 1 | NA | NA | NA | NA | NA | NA | 261 |
| ESR_open | NA | 12 | 10 | 22 | 198 | 48 | 5 | NA | 10 | 1 | 85 | 3 | 1 | 1 | NA | NA | NA | NA | 396 |
| ESR_close | 5 | 13 | 13 | 26 | 330 | 96 | NA | NA | 4 | 2 | 58 | 2 | 4 | 2 | 1 | NA | NA | NA | 556 |
| ESR_OC | 1 | NA | 4 | 1 | 58 | 8 | NA | NA | 3 | 4 | 21 | NA | NA | NA | NA | 1 | NA | NA | 101 |
| LR_open | 28 | 34 | 32 | 94 | 1258 | 279 | 13 | 4 | 40 | 26 | 797 | 8 | 7 | 7 | 2 | NA | 1 | NA | 2630 |
| LR_close | 11 | 25 | 22 | 31 | 539 | 170 | 6 | 1 | 10 | 9 | 152 | 5 | 2 | 2 | NA | NA | 1 | NA | 986 |
| NR | 56 | 95 | 121 | 259 | 3206 | 813 | 50 | 9 | 83 | 53 | 1175 | 52 | 15 | 5 | 5 | 2 | 1 | 1 | 6001 |
| all_peaks | 119 | 202 | 219 | 495 | 6311 | 1559 | 81 | 20 | 174 | 103 | 2603 | 75 | 30 | 18 | 10 | 3 | 3 | 1 | 12026 |
eight_retro <- Eight_group_TE %>%
  dplyr::filter(repClass=="Retroposon"&per_ol>per_cov) %>%
  dplyr::filter(mrc != "not_mrc") %>%
  rbind(., ggretroposon_df) %>%
  mutate(repName=factor(repName)) %>%
mutate(mrc=factor(mrc, levels = c("EAR_open","EAR_close","ESR_open", "ESR_close","ESR_OC", "LR_open","LR_close","NR","all_peaks","h.genome"))) %>%
  dplyr::filter(mrc != "h.genome")

eight_retro %>%
  ggplot(., aes(x=mrc, fill= repName))+
  geom_bar(position="fill", col="black")+
  theme_classic()+
  ggtitle(paste("Retroposon breakdown by by eight-clusters and Family",per_cov))+
  scale_fill_retroposons()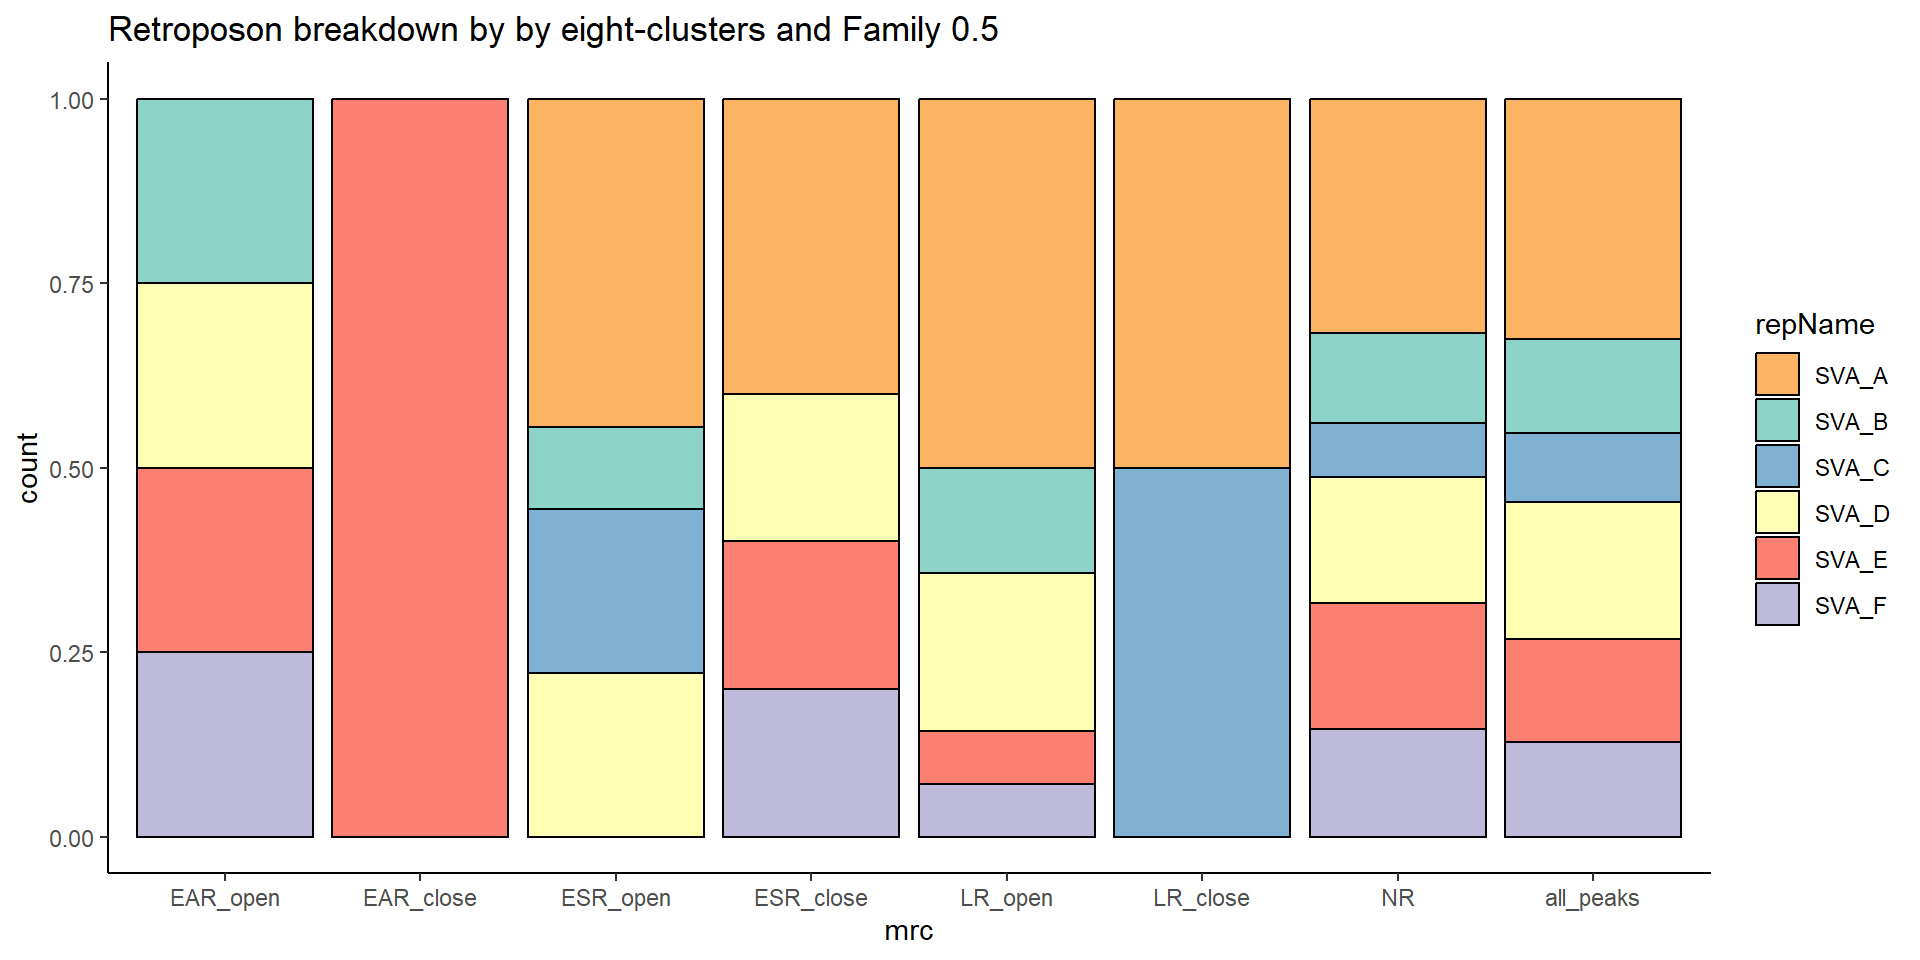
eight_retro %>%
  group_by(mrc,repName) %>%
  tally %>%
  pivot_wider(., id_cols = mrc, names_from = repName, values_from = n) %>%
  rowwise() %>%
 mutate(total= sum(c_across(1:6),na.rm =TRUE)) %>%
  kable(., caption="Breakdown of Retroposon counts by Name") %>%
kable_paper("striped", full_width = TRUE) %>%
  kable_styling(full_width = FALSE, font_size = 14)%>%
scroll_box(height = "500px")| mrc | SVA_B | SVA_D | SVA_E | SVA_F | SVA_A | SVA_C | total |
|---|---|---|---|---|---|---|---|
| EAR_open | 1 | 1 | 1 | 1 | NA | NA | 4 |
| EAR_close | NA | NA | 1 | NA | NA | NA | 1 |
| ESR_open | 1 | 2 | NA | NA | 4 | 2 | 9 |
| ESR_close | NA | 1 | 1 | 1 | 2 | NA | 5 |
| LR_open | 2 | 3 | 1 | 1 | 7 | NA | 14 |
| LR_close | NA | NA | NA | NA | 2 | 2 | 4 |
| NR | 5 | 7 | 7 | 6 | 13 | 3 | 41 |
| all_peaks | 11 | 16 | 12 | 11 | 28 | 8 | 86 |
CG islands!
cpgislands_df <- read.delim("data/other_papers/cpg_islands.tsv")
cpg_cCREs_df <- read_delim("data/other_papers/cpg_cCREs.tsv", delim="\t")
# aligncre <- genomation::readBed("data/enhancerdata/ENCFF867HAD_ENCFF152PBB_ENCFF352YYH_ENCFF252IVK.7group.bed") %>% as.data.frame

CPG_promoters_gr <- cpg_cCREs_df %>%
    dplyr::rename(.,"seqnames"=X1,"start"=X2,"end"=X3,"promotor_name"=X4,"length"=X5,"strand"=X6,"color"=X9) %>%
  dplyr::filter(color ==25500) %>%
  dplyr::select(seqnames:strand,color) %>%
  GRanges()


Peaks_v_cpgpromo <- join_overlap_intersect(CPG_promoters_gr,Col_TSS_data_gr) %>% as.data.frame

cpg_island_gr <- cpgislands_df %>%
 makeGRangesFromDataFrame(., keep.extra.columns = TRUE, seqnames.field = "chrom", start.field = "chromStart", end.field = "chromEnd",starts.in.df.are.0based=TRUE)
Col_TSS_data_gr$peak_width <- width(Col_TSS_data_gr)
cpg_island_gr$cpg_width <- width(cpg_island_gr)
Col_fullDF_cug_overlap <- join_overlap_intersect(Col_TSS_data_gr,cpg_island_gr)
Col_fullDF_cug_overlap <-Col_fullDF_cug_overlap %>%
as.data.frame %>%
mutate(per_ol=width/cpg_width)
Col_fullDF_cug_overlap %>%
as.data.frame() %>%
# group_by(name) %>%
distinct(Peakid) %>%
tally %>%
kable(., caption="Count of peaks with CG islands") %>%
kable_paper("striped", full_width = TRUE) %>%
kable_styling(full_width = FALSE, font_size = 14)%>%
scroll_box(height = "500px")| n |
|---|
| 18320 |
Col_fullDF_cug_overlap %>%
  as.data.frame() %>%
  dplyr::filter(per_ol>0.5) %>%
  distinct(Peakid) %>%
  tally %>%
  kable(., caption="Count of peaks with >50% of CG islands") %>%
  kable_paper("striped", full_width = TRUE) %>%
  kable_styling(full_width = FALSE, font_size = 14)%>%
scroll_box(height = "500px")| n |
|---|
| 14843 |
# CUG_mrc_status_list <-
# Col_TSS_data_gr%>%
#   as.data.frame() %>%
#   left_join(., (Col_fullDF_cug_overlap %>% as.data.frame(.)), by =c("seqnames"="seqnames","start"="start","end"="end","Peakid"="Peakid", "NCBI_gene"="NCBI_gene", "ensembl_ID"="ensembl_ID","dist_to_NG"="dist_to_NG",  "SYMBOL" = "SYMBOL", "peak_width"="peak_width")) %>%
#   left_join(., (Peaks_v_cpgpromo %>% dplyr::select(promotor_name,Peakid,peak_width)), by=c("peak_width"="peak_width","Peakid"="Peakid")) %>%
#   dplyr::select(Peakid, name,cpgNum:promotor_name) %>%
#   mutate(cugstatus=if_else(is.na(cpgNum),"not_CGi_peak","CGi_peak")) %>%
#   mutate(prom_status= if_else(is.na(promotor_name),"not_CpGpromo","CpGpromo")) %>%
#    mutate(mrc=if_else(Peakid %in% EAR_df$id, "EAR",
#                      if_else(Peakid %in% ESR_df$id,"ESR",
#                              if_else(Peakid %in% LR_df$id,"LR",
#                                      if_else(Peakid %in% NR_df$id,"NR","not_mrc"))))) %>% distinct()
#


CUG_mrc_nine_list <-
Col_TSS_data_gr%>% as.data.frame() %>%
  left_join(., (Col_fullDF_cug_overlap %>% as.data.frame(.)), by =c("seqnames"="seqnames","start"="start","end"="end","Peakid"="Peakid", "NCBI_gene"="NCBI_gene", "ensembl_ID"="ensembl_ID","dist_to_NG"="dist_to_NG",  "SYMBOL" = "SYMBOL", "peak_width"="peak_width")) %>%
  left_join(., (Peaks_v_cpgpromo %>% dplyr::select(promotor_name,Peakid,peak_width)), by=c("peak_width"="peak_width","Peakid"="Peakid")) %>%
  dplyr::select(Peakid, name,cpgNum:promotor_name) %>%
  mutate(cugstatus=if_else(is.na(cpgNum),"not_CGi_peak","CGi_peak")) %>%
  mutate(prom_status= if_else(is.na(promotor_name),"not_CpGpromo","CpGpromo")) %>%
   mutate(mrc=if_else(Peakid %in% EAR_open$Peakid, "EAR_open",
                      if_else(Peakid %in% EAR_close$Peakid, "EAR_close",
                              if_else(Peakid %in% ESR_open$Peakid,"ESR_open",
                                      if_else(Peakid %in% ESR_close$Peakid,"ESR_close",
                                              if_else(Peakid %in% ESR_OC$Peakid,"ESR_OC",
                                                      if_else(Peakid %in% LR_open$Peakid,"LR_open",
                                                                      if_else(Peakid %in% LR_close$Peakid,"LR_close",
                                                                              if_else(Peakid %in% NR_df$Peakid,"NR","not_mrc"))))))))) %>%
  distinct()

#
# CUG_mrc_status_list %>%
#  group_by(cugstatus, mrc) %>%
#   distinct(Peakid) %>%
#  count %>%
#   pivot_wider(., id_cols = mrc, names_from = cugstatus, values_from = n) %>%
#   kable(., caption="Breakdown of CG islands overlap four groups") %>%
# kable_paper("striped", full_width = TRUE) %>%
#   kable_styling(full_width = FALSE, font_size = 14)

# CUG_mrc_status_list %>%
#   mutate(mrc=factor(mrc, levels = c("NR", "EAR", "ESR","LR","not_mrc"))) %>%
#   group_by(cugstatus, mrc) %>%
#   ggplot(., aes(x = mrc,  fill = cugstatus)) +
#   geom_bar(position="fill",color = "black")+
#   theme_bw()+
#   ggtitle("CG islands by mrc")
          # subtitle=paste((CUG_mrc_status_list %>% dplyr::filter(cugstatus=="CGi_peak") %>% count(cugstatus))$n))

CUG_mrc_nine_list %>%
  distinct(Peakid,.keep_all = TRUE) %>%
  mutate(mrc="full_list") %>%
  rbind(., (CUG_mrc_nine_list %>% distinct(Peakid,.keep_all = TRUE))) %>%
   mutate(mrc=factor(mrc, levels=c("EAR_open","EAR_close","ESR_open","ESR_close","ESR_OC","LR_open","LR_close","NR","not-mrc","full_list"))) %>%
  dplyr::filter(mrc !="not_mrc") %>%
  group_by(cugstatus, mrc) %>%
  ggplot(., aes(x = mrc,  fill = cugstatus)) +
  geom_bar(position="fill",color = "black")+
  theme_bw()+
  ggtitle("CG islands by mrc")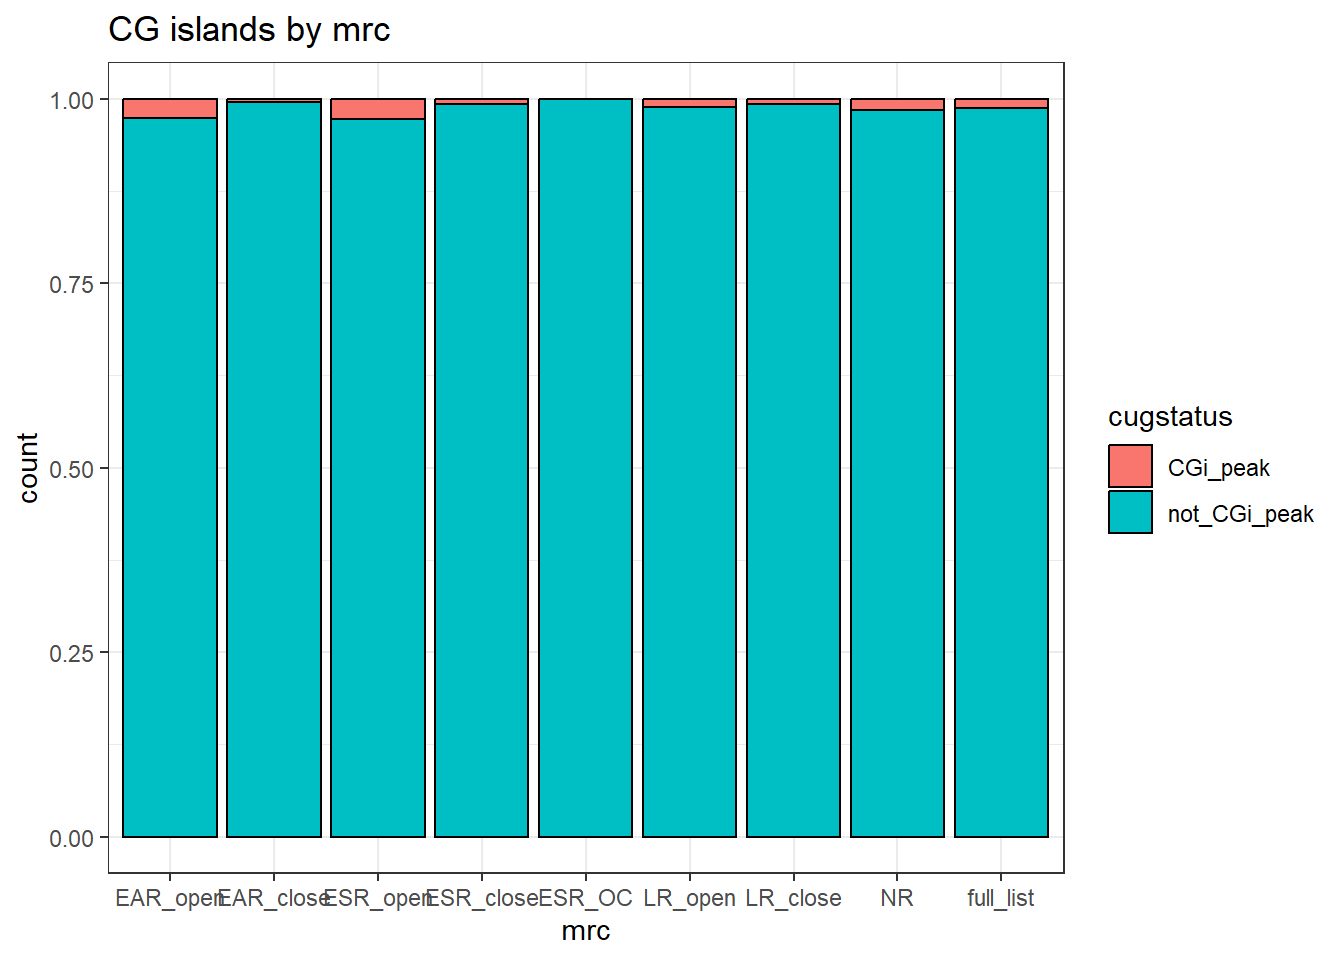
# subtitle=paste((CUG_mrc_nine_list %>% dplyr::filter(cugstatus=="CGi_peak") %>% count(cugstatus))$n, "CG island peaks"))

CUG_mrc_nine_list %>%
  distinct(Peakid,.keep_all = TRUE) %>%
  dplyr::filter(mrc != "not_mrc") %>%
  mutate(mrc="full_list") %>%
  rbind(., (CUG_mrc_nine_list %>% distinct(Peakid,.keep_all = TRUE))) %>%
   mutate(mrc=factor(mrc, levels=c("EAR_open","EAR_close","ESR_open","ESR_close","ESR_OC","LR_open","LR_close","NR","not-mrc","full_list"))) %>%
  dplyr::filter(mrc !="not_mrc") %>%
  group_by(cugstatus, mrc) %>%
  tally %>%
  pivot_wider(., id_cols = mrc, names_from = cugstatus, values_from = n) %>%
  kable(., caption="Breakdown of CG islands overlap with not_mrc removed") %>%
kable_paper("striped", full_width = TRUE) %>%
  kable_styling(full_width = FALSE, font_size = 14)%>%
scroll_box(height = "500px")| mrc | CGi_peak | not_CGi_peak |
|---|---|---|
| EAR_open | 79 | 2987 |
| EAR_close | 17 | 4161 |
| ESR_open | 139 | 5013 |
| ESR_close | 70 | 9011 |
| LR_open | 295 | 27268 |
| LR_close | 100 | 13548 |
| NR | 1231 | 82042 |
| full_list | 1931 | 145158 |
| ESR_OC | NA | 1128 |
Col_fullDF_cug_overlap %>%
        as.data.frame %>%
        ggplot(., aes (x = width))+
        geom_density(color="darkblue",fill="lightblue",aes(alpha = 0.5))+
  theme_classic()+
  ggtitle("Distribution of CGisland overlap widths",subtitle = " limited x axis")+
  coord_cartesian(xlim= c(0,2500))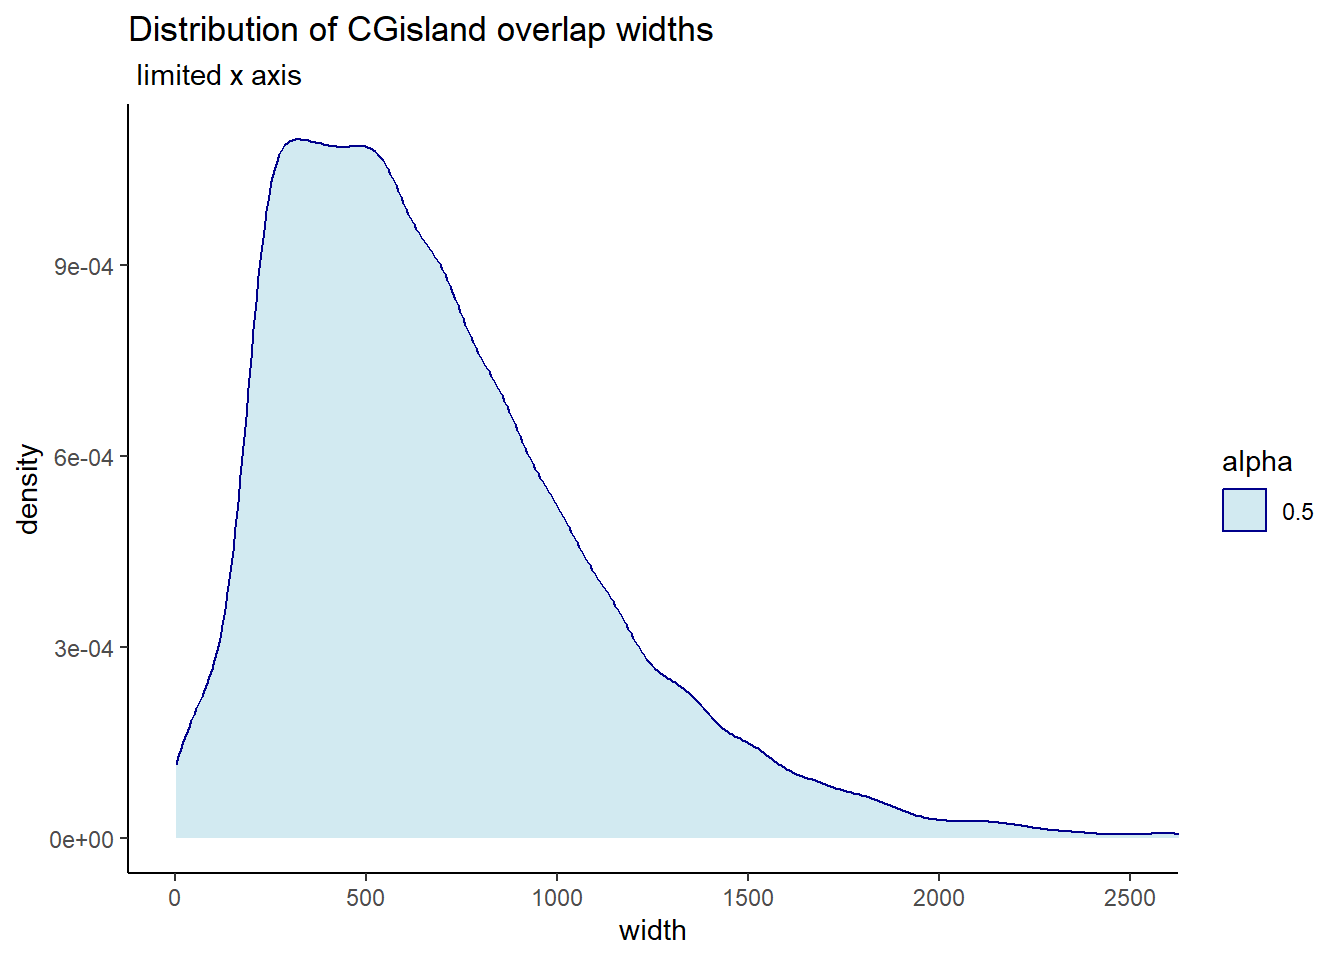
cpg_island_gr %>%
  as.data.frame() %>%
  ggplot(., aes (x = cpg_width))+
        geom_density(aes(alpha = 0.5))+
  theme_classic()+
  ggtitle("Distribution of overlap widths of CGislands ",subtitle = " limited x axis")+
  coord_cartesian(xlim= c(0,2500))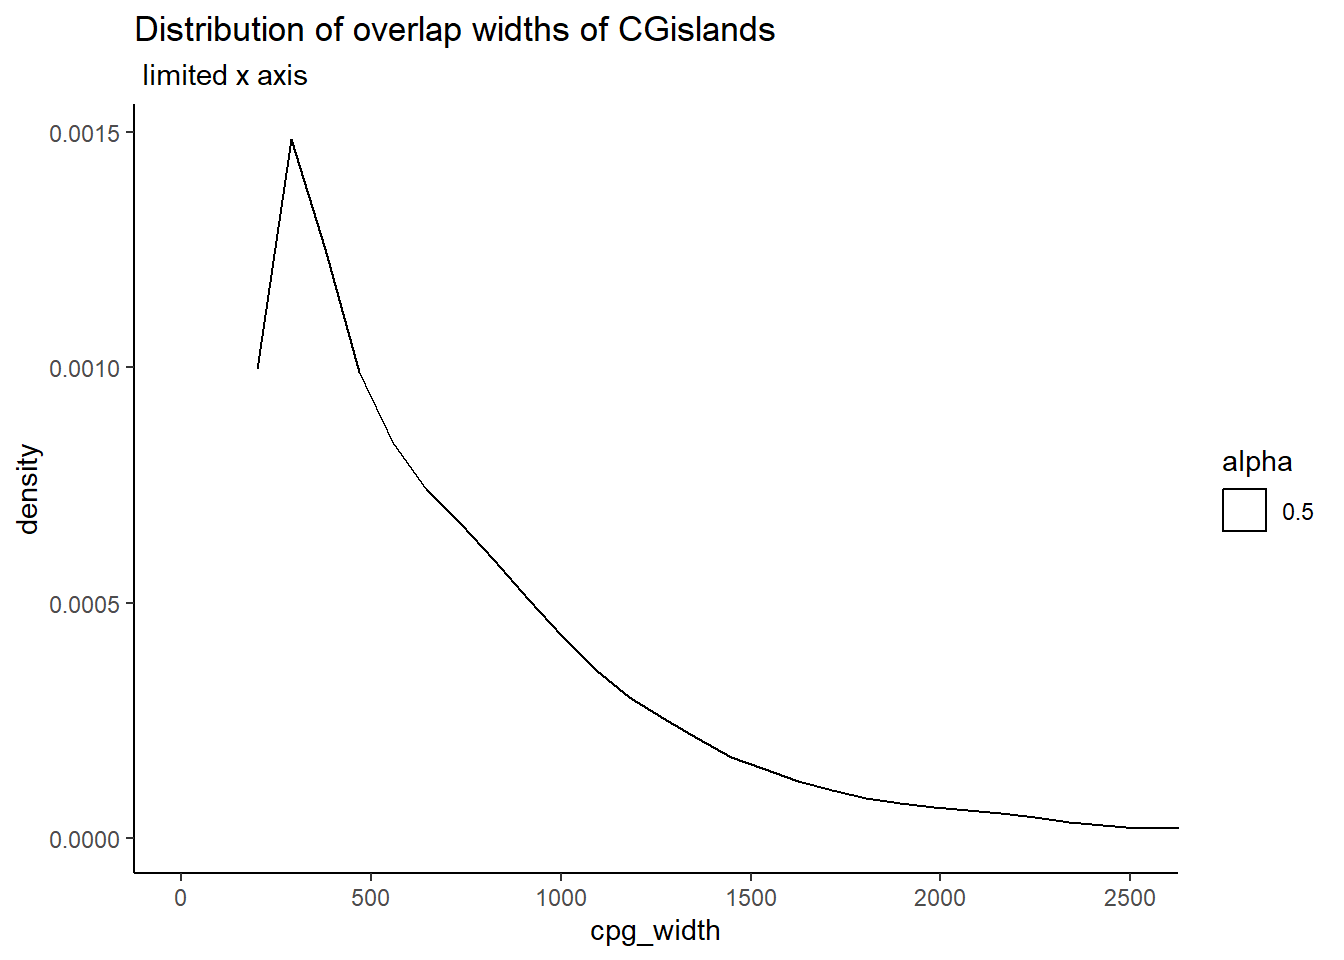
# CUG_mrc_status_list %>%
#    mutate(mrc="full_list") %>%
#   rbind(., CUG_mrc_status_list) %>%
#    mutate(mrc=factor(mrc, levels=c("EAR","ESR","LR","NR","not-mrc","full_list"))) %>%
#   dplyr::filter(mrc !="not_mrc") %>%
#   dplyr::filter(cugstatus=="CGi_peak") %>%
#   ggplot(., aes(x = mrc,  fill = prom_status)) +
#   geom_bar(position="fill",color = "black")+
#   theme_bw()+
#   ggtitle("CG islands promotors vs non-promotor CpGi by mrc", subtitle=paste(length(CUG_mrc_status_list$Peakid )))


promo_count_list <- CUG_mrc_nine_list %>%
  dplyr::filter(mrc !="not_mrc") %>%
  dplyr::filter(cugstatus=="CGi_peak")  %>%
  group_by(prom_status) %>%
  tally()


CUG_mrc_nine_list %>%
   mutate(mrc="full_list") %>%
  rbind(., CUG_mrc_nine_list) %>%
   mutate(mrc=factor(mrc, levels=c("EAR_open","EAR_close","ESR_open","ESR_close","ESR_OC","LR_open","LR_close","NR","not-mrc","full_list"))) %>%
  dplyr::filter(mrc !="not_mrc") %>%
  dplyr::filter(cugstatus=="CGi_peak") %>%
  ggplot(., aes(x = mrc,  fill = prom_status)) +
  geom_bar(position="fill",color = "black")+
  theme_bw()+
  ggtitle("CG islands promotors vs non-promotor CpGi by mrc", subtitle=paste(promo_count_list[1,1],promo_count_list[1,2],"\n", promo_count_list [2,1],promo_count_list [2,2]))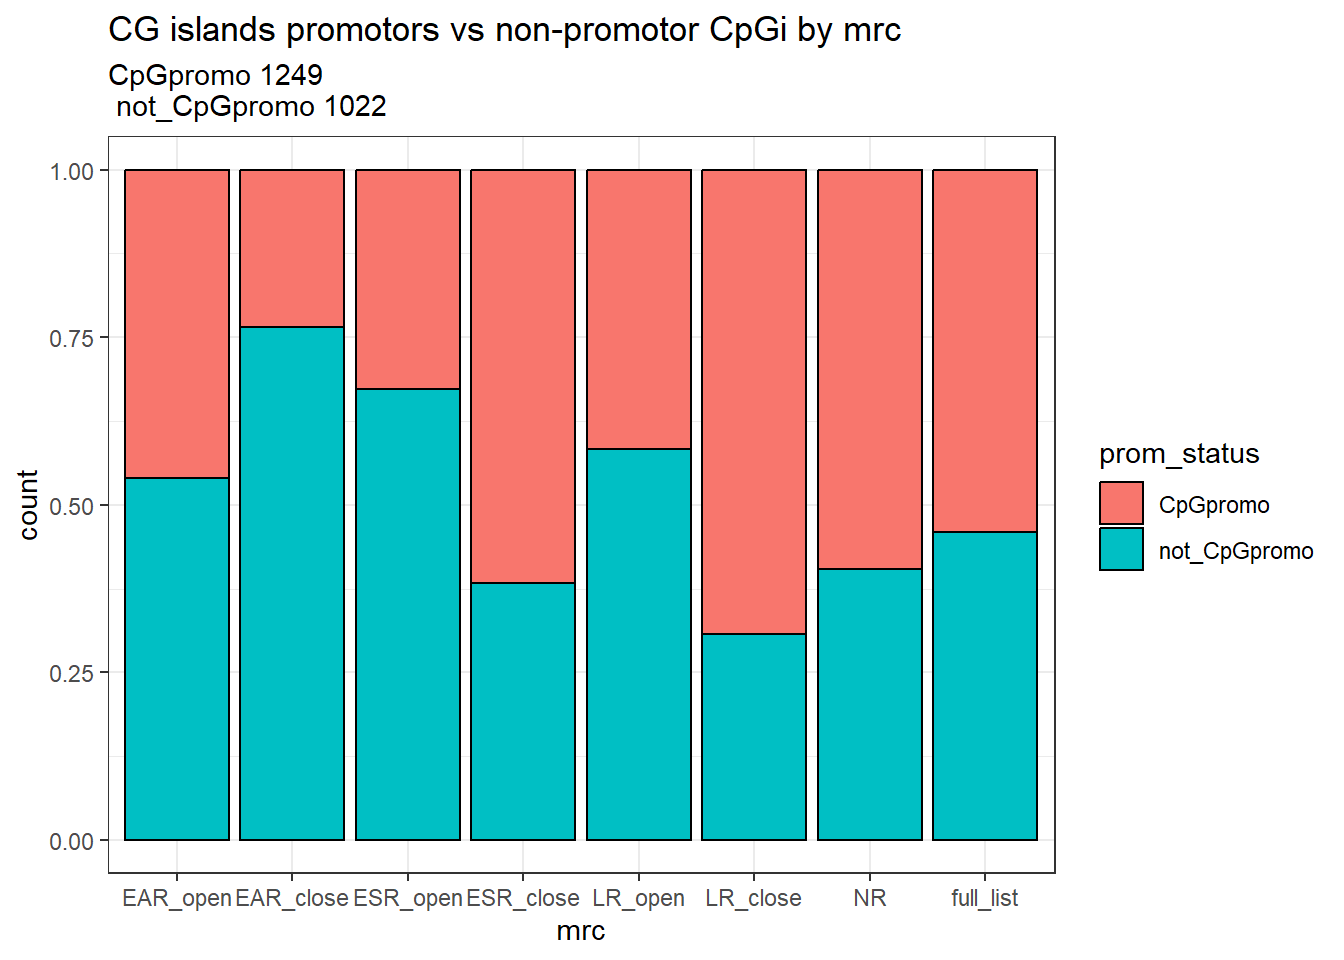
SNP
gwas_ACtox <- readRDS("data/gwas_1_dataframe.RDS")
gwas_ARR <- readRDS("data/gwas_2_dataframe.RDS")
gwas_ACresp <- readRDS("data/gwas_3_dataframe.RDS")
gwas_HD <- readRDS("data/gwas_4_dataframe.RDS")
gwas_HF <- readRDS("data/gwas_5_dataframe.RDS")
gwas_CAD <- readRDS( "data/CAD_gwas_dataframe.RDS")
gwas_MI <- readRDS("data/MI_gwas.RDS")

gwas_snp_list <- gwas_ACtox %>%
  distinct(SNPS,.keep_all = TRUE) %>%
  dplyr::select(CHR_ID, CHR_POS,SNPS) %>%
  mutate(gwas="ACtox") %>%
  rbind(gwas_ARR %>%
          distinct(SNPS,.keep_all = TRUE) %>%
          dplyr::select(CHR_ID, CHR_POS,SNPS) %>%
          mutate(gwas="ARR")) %>%
  rbind(gwas_ACresp %>%
          distinct(SNPS,.keep_all = TRUE) %>%
          dplyr::select(CHR_ID, CHR_POS,SNPS) %>%
          mutate(gwas="ACresp")) %>%
  rbind(gwas_HD %>%
          distinct(SNPS,.keep_all = TRUE) %>%
          dplyr::select(CHR_ID, CHR_POS,SNPS) %>%
          mutate(gwas="HD")) %>%
  rbind(gwas_HF %>%
          distinct(SNPS,.keep_all = TRUE) %>%
          dplyr::select(CHR_ID, CHR_POS,SNPS) %>%
          mutate(gwas="HF")) %>%
  rbind(gwas_CAD %>%
          distinct(SNPS,.keep_all = TRUE) %>%
          dplyr::select(CHR_ID, CHR_POS,SNPS) %>%
          mutate(gwas="CAD")) %>%
  rbind(gwas_MI %>%
          distinct(SNPS,.keep_all = TRUE) %>%
          dplyr::select(CHR_ID, CHR_POS,SNPS) %>%
          mutate(gwas="MI")) %>%
  separate_longer_delim(.,col= c(CHR_ID,CHR_POS,SNPS), delim= ";")

gwas_snp_gr <- gwas_snp_list %>%
   mutate(CHR_ID=as.numeric(CHR_ID), CHR_POS=as.numeric(CHR_POS)) %>%
  na.omit() %>%
   mutate(start=CHR_POS, end=CHR_POS, chr=paste0("chr",CHR_ID)) %>%
  GRanges()

# rtracklayer::export.bed(gwas_snp_gr,con="data/full_bedfiles/GWAS_SNP.bed",format="bed")

findOverlaps(gwas_snp_gr, all_TEs_gr)
Hits object with 3432 hits and 0 metadata columns:
queryHits subjectHits
<integer> <integer>
[1] 1 4910496
[2] 4 1047158
[3] 7 4718029
[4] 11 116853
[5] 12 4826568
... ... ...
[3428] 7804 5009192
[3429] 7805 3904058
[3430] 7807 4735830
[3431] 7809 4615754
[3432] 7812 1872218
-------
queryLength: 7816 / subjectLength: 5683690test <- join_overlap_intersect(gwas_snp_gr, all_TEs_gr) %>% GRanges
##3413- (#3432 after separate)
test_new <- test %>%
as.data.frame %>%
dplyr::select(seqnames:gwas,repName:repFamily) %>%
GRanges()
peaks <-
Collapsed_peaks %>%
dplyr::select(chr:Peakid) %>%
GRanges()
peak_test <- join_overlap_intersect(test_new, peaks)
# peak_test 135
Col_fullDF_overlap %>%
as.data.frame %>%
dplyr::select(seqnames:Peakid,repName:repFamily) %>%
GRanges() %>%
join_overlap_intersect(.,gwas_snp_gr)GRanges object with 135 ranges and 8 metadata columns:
seqnames ranges strand | Peakid repName
<Rle> <IRanges> <Rle> | <character> <character>
[1] chr1 16012818 * | chr1.16012567.16013729 MIRb
[2] chr1 55055640 * | chr1.55055575.55055793 MLT2D
[3] chr1 55055640 * | chr1.55055575.55055793 MLT2D
[4] chr1 170224718 * | chr1.170224576.17022.. L1MA7
[5] chr1 170224718 * | chr1.170224576.17022.. L1MA7
... ... ... ... . ... ...
[131] chr8 124847608 * | chr8.124847104.12484.. MamTip2
[132] chr8 124847608 * | chr8.124847104.12484.. MamTip2
[133] chr9 107755513 * | chr9.107755276.10775.. Charlie13a
[134] chr9 107755513 * | chr9.107755276.10775.. Charlie13a
[135] chr9 123933491 * | chr9.123933461.12393.. MLT1J
repClass repFamily CHR_ID CHR_POS SNPS gwas
<character> <character> <numeric> <numeric> <character> <character>
[1] SINE MIR 1 16012818 rs10927886 HD
[2] LTR ERVL 1 55055640 rs472495 HD
[3] LTR ERVL 1 55055640 rs472495 CAD
[4] LINE L1 1 170224718 rs12122060 ARR
[5] LINE L1 1 170224718 rs12122060 HD
... ... ... ... ... ... ...
[131] DNA hAT-Tip100 8 124847608 rs34866937 HD
[132] DNA hAT-Tip100 8 124847608 rs34866937 HF
[133] DNA hAT-Charlie 9 107755513 rs944172 HD
[134] DNA hAT-Charlie 9 107755513 rs944172 CAD
[135] LTR ERVL-MaLR 9 123933491 rs10818894 ACresp
-------
seqinfo: 22 sequences from an unspecified genome; no seqlengthstest2 <- join_overlap_intersect(peaks, gwas_snp_gr)
test2 %>%
join_overlap_intersect(., all_TEs_gr) %>%
as.data.frame %>%
dplyr::select(seqnames:gwas,repName:repFamily) %>%
mutate(mrc=if_else(Peakid %in% EAR_open$Peakid, "EAR_open",
if_else(Peakid %in% EAR_close$Peakid, "EAR_close",
if_else(Peakid %in% ESR_open$Peakid,"ESR_open",
if_else(Peakid %in% ESR_close$Peakid,"ESR_close",
if_else(Peakid %in% ESR_OC$Peakid,"ESR_OC",
if_else(Peakid %in% LR_open$Peakid,"LR_open",
if_else(Peakid %in% LR_close$Peakid,"LR_close",
if_else(Peakid %in% NR_df$Peakid,"NR","not_mrc"))))))))) %>%
# distinct(Peakid, .keep_all = TRUE) %>%
group_by(gwas,mrc) %>%
tally# A tibble: 24 × 3
# Groups: gwas [6]
gwas mrc n
<chr> <chr> <int>
1 ACresp LR_open 2
2 ARR ESR_close 2
3 ARR LR_close 4
4 ARR LR_open 3
5 ARR NR 12
6 ARR not_mrc 1
7 CAD EAR_close 1
8 CAD EAR_open 1
9 CAD ESR_close 2
10 CAD LR_close 4
# ℹ 14 more rowsSNP_df <- test2 %>%
join_overlap_intersect(., all_TEs_gr) %>%
as.data.frame %>%
dplyr::select(seqnames:gwas,repName:repFamily) %>%
mutate(mrc=if_else(Peakid %in% EAR_open$Peakid, "EAR_open",
if_else(Peakid %in% EAR_close$Peakid, "EAR_close",
if_else(Peakid %in% ESR_open$Peakid,"ESR_open",
if_else(Peakid %in% ESR_close$Peakid,"ESR_close",
if_else(Peakid %in% ESR_OC$Peakid,"ESR_OC",
if_else(Peakid %in% LR_open$Peakid,"LR_open",
if_else(Peakid %in% LR_close$Peakid,"LR_close",
if_else(Peakid %in% NR_df$Peakid,"NR","not_mrc")))))))))
SNP_df %>% group_by(Peakid) %>%
summarise(snp_id=paste(unique(SNPS), collapse = ","),
gwas=paste(unique(gwas),collapse=","),
repName = paste(unique(repName),collapse=","),
mrc =paste(unique(mrc),collapse=","),
repFamily= paste(unique(repFamily),collapse = ","),
location_chr= paste(unique(CHR_ID),collapse = ",") ,
location= paste(unique(CHR_POS),collapse = ",") ,
) %>%
kable(., caption = "The output of all SNPs and their SNP category followed by location and peak") %>%
kable_paper("striped", full_width = TRUE) %>%
kable_styling(full_width = FALSE, font_size = 14) %>%
scroll_box(height = "500px")| Peakid | snp_id | gwas | repName | mrc | repFamily | location_chr | location |
|---|---|---|---|---|---|---|---|
| chr1.16012567.16013729 | rs10927886 | HD | MIRb | ESR_close | MIR | 1 | 16012818 |
| chr1.170224576.170224916 | rs12122060 | ARR,HD | L1MA7 | LR_close | L1 | 1 | 170224718 |
| chr1.55055575.55055793 | rs472495 | HD,CAD | MLT2D | not_mrc | ERVL | 1 | 55055640 |
| chr10.103712814.103713354 | rs10509768 | ARR,HD | MIRb | NR | MIR | 10 | 103713072 |
| chr10.121155583.121156319 | rs17101521 | HD,CAD | LTR16A2 | NR | ERVL | 10 | 121156039 |
| chr10.20953148.20953475 | rs7910227 | ARR,HD | MLT1B | LR_close | ERVL-MaLR | 10 | 20953453 |
| chr11.100753128.100753902 | rs7947761 | HD,CAD | L1PBa | NR | L1 | 11 | 100753868 |
| chr11.118911506.118912630 | rs11606719 | HD,CAD | MIRb | NR | MIR | 11 | 118911765 |
| chr11.128759383.128760154 | rs672149 | HD | L2 | NR | L2 | 11 | 128759487 |
| chr11.19988504.19989024 | rs4757877,rs2625322 | ARR,HD | AmnSINE1 | LR_close | 5S-Deu-L2 | 11 | 19988745,19988805 |
| chr11.90455310.90455981 | rs534128177 | HD,CAD | LTR14B | NR | ERVK | 11 | 90455679 |
| chr11.9748359.9748943 | rs472109 | HD,CAD | LTR41 | LR_close | ERVL | 11 | 9748771 |
| chr12.106865628.106866040 | rs7977247 | HD,HF | L2a | LR_close | L2 | 12 | 106865692 |
| chr12.109538192.109538640 | rs75524776 | HD,CAD | MIRb | LR_close | MIR | 12 | 109538471 |
| chr12.111171885.111172119 | rs3809297 | ARR,HD | (TGCGTG)n | not_mrc | Simple_repeat | 12 | 111171923 |
| chr12.111569574.111570394 | rs653178 | HD,MI | MER3 | NR | hAT-Charlie | 12 | 111569952 |
| chr12.20004923.20005338 | rs11044977 | HD,MI | L2a | NR | L2 | 12 | 20005226 |
| chr12.24561685.24562685 | rs2291437 | ARR,HD | (CCACCTC)n | NR | Simple_repeat | 12 | 24562114 |
| chr13.110301444.110302036 | rs4773141 | HD,CAD | L2 | NR | L2 | 13 | 110302006 |
| chr13.21536977.21537596 | rs11841562 | ARR,HD | L2 | LR_open | L2 | 13 | 21537382 |
| chr13.22794559.22794879 | rs9506925 | ARR,HD | OldhAT1 | NR | hAT-Ac | 13 | 22794804 |
| chr13.30740138.30740672 | rs3885907 | ACresp | MIR | LR_open | MIR | 13 | 30740318 |
| chr14.58326948.58327320 | rs2145598 | HD,CAD | MER3 | NR | hAT-Charlie | 14 | 58327283 |
| chr15.70171390.70172398 | rs2415081 | ARR,HD | MIRb | NR | MIR | 15 | 70171653 |
| chr15.90885954.90886257 | rs4932373 | HD,CAD | MIR | LR_close | MIR | 15 | 90886057 |
| chr17.17823556.17824258 | rs12936927 | HD,CAD | (CGCCC)n | ESR_close | Simple_repeat | 17 | 17823651 |
| chr17.2867997.2868307 | rs12603284 | ARR,HD | MamRTE1 | NR | RTE-BovB | 17 | 2868218 |
| chr18.35089781.35090661 | rs476348 | HD | L1MB7 | NR | L1 | 18 | 35090057 |
| chr18.45565618.45565968 | rs2852306 | HD | MIR3 | EAR_close | MIR | 18 | 45565696 |
| chr19.18478653.18479216 | rs11670056 | HD,CAD | MER20 | LR_open | hAT-Charlie | 19 | 18479133 |
| chr19.41352378.41354231 | rs1800470 | HD,CAD | (CAGCAG)n | NR | Simple_repeat | 19 | 41353016 |
| chr2.25936965.25937466 | rs6546620 | ARR,HD | MIRb | NR | MIR | 2 | 25937071 |
| chr2.27262237.27263756 | rs6759518 | ARR,HD,HF,CAD | MIRc | NR | MIR | 2 | 27263727 |
| chr2.36922199.36922493 | rs11124554 | HD,HF | AluJr | NR | Alu | 2 | 36922355 |
| chr2.60391661.60392192 | rs243071 | HD,CAD | MIRb | LR_open | MIR | 2 | 60391893 |
| chr2.86367009.86367615 | rs72926475 | ARR,HD | MIR | ESR_close | MIR | 2 | 86367364 |
| chr21.14118943.14119390 | rs57346421 | HD,HF | HERV1_I-int | NR | ERV1 | 21 | 14119015 |
| chr21.29162621.29163485 | rs73193808 | HD,CAD | AluSz6 | NR | Alu | 21 | 29162981 |
| chr21.34746498.34746999 | rs2834618 | ARR,HD | MIRc | ESR_close | MIR | 21 | 34746814 |
| chr22.38435884.38436418 | rs2267386 | HD | MIR | NR | MIR | 22 | 38436107 |
| chr3.123019226.123019547 | rs7632505 | ARR,HD,HF,CAD | AluJb | NR | Alu | 3 | 123019460 |
| chr3.136350085.136351911 | rs667920 | HD,CAD | L1M4b | NR | L1 | 3 | 136350630 |
| chr3.14216199.14216968 | rs62232870 | HD | MLT1K | NR | ERVL-MaLR | 3 | 14216209 |
| chr3.151483988.151484643 | rs4387942 | HD,CAD | L1PA7 | ESR_close | L1 | 3 | 151484399 |
| chr3.169478628.169479748 | rs2421649 | HD | L2b | NR | L2 | 3 | 169479545 |
| chr3.57959935.57960395 | rs1522387 | HD | MLT1K | NR | ERVL-MaLR | 3 | 57960369 |
| chr4.148015916.148016422 | rs10213171 | ARR,HD | AluJr4 | LR_open | Alu | 4 | 148016386 |
| chr4.168766280.168767270 | rs7696431,rs869396 | HD,CAD | L3 | LR_open | CR1 | 4 | 168766574,168766849 |
| chr4.76495482.76496240 | rs2068063 | HD,MI | L2 | not_mrc | L2 | 4 | 76496050 |
| chr5.115543502.115545233 | rs13177180 | HD | G-rich | NR | Low_complexity | 5 | 115544896 |
| chr5.135458929.135459424 | rs899162 | HD,CAD | L2c | NR | L2 | 5 | 135459219 |
| chr5.138068694.138070268 | rs141654122 | ARR,HD | SVA_D | NR | SVA | 5 | 138070140 |
| chr5.52859657.52860199 | rs73102285 | HD,CAD | L3 | NR | CR1 | 5 | 52859808 |
| chr6.118252411.118253042 | rs281868 | ARR,HD | L2b | LR_open | L2 | 6 | 118252898 |
| chr6.134047673.134047938 | rs965652 | HD,CAD | MamRep1894 | NR | hAT | 6 | 134047815 |
| chr6.28269507.28270003 | rs1225600 | HD,CAD | MLT2B4 | LR_open | ERVL | 6 | 28269667 |
| chr6.39166177.39166915 | rs56336142 | HD,CAD | MIRc | NR | MIR | 6 | 39166323 |
| chr7.100243501.100243833 | rs117038461 | HD,CAD | L1M5 | EAR_close | L1 | 7 | 100243731 |
| chr7.36459124.36459918 | rs192407614 | HD,CAD | LTR38B | EAR_open | ERV1 | 7 | 36459695 |
| chr7.836506.836873 | rs11768850 | ARR,HD | MLT2B4 | NR | ERVL | 7 | 836590 |
| chr7.92620778.92621787 | rs42044 | ARR,HD | AluJb | NR | Alu | 7 | 92620826 |
| chr7.93713592.93714106 | rs376825901 | HD,CAD | Tigger1 | NR | TcMar-Tigger | 7 | 93714028 |
| chr7.99822872.99823551 | rs62471956 | HD,CAD | MER52A | LR_close | ERV1 | 7 | 99823462 |
| chr8.124847104.124848853 | rs35006907,rs34866937 | ARR,HD,HF | MamTip2 | NR | hAT-Tip100 | 8 | 124847575,124847608 |
| chr8.20007264.20008372 | rs2083636,rs894211 | HD,CAD | MER34A,LTR48 | NR | ERV1 | 8 | 20007752,20008236 |
| chr9.107755276.107755816 | rs944172 | HD,CAD | Charlie13a | LR_open | hAT-Charlie | 9 | 107755513 |
| chr9.123933461.123933812 | rs10818894 | ACresp | MLT1J | LR_open | ERVL-MaLR | 9 | 123933491 |
# SNP_df %>%  group_by(Peakid) %>%
#     summarise(snp_id=paste(unique(SNPS), collapse = ","),
#               gwas=paste(unique(gwas),collapse=","),
#               repName = paste(unique(repName),collapse=","),
#               mrc =paste(unique(mrc),collapse=","),
#               repFamily= paste(unique(repFamily),collapse = ","),
#               location_chr= paste(unique(CHR_ID),collapse = ";") ,
#               location= paste(unique(CHR_POS),collapse = ";") ,
#               ) %>%
  # write.csv(.,"data/SNP_GWAS_PEAK_MRC_id.csv")
# rtracklayer::export(ESR_A,con = "data/n45_bedfiles/meme_bed/ESR_A.bed", format="bed", ignore.strand = FALSE)
#
# rtracklayer::export(ESR_B,con = "data/n45_bedfiles/meme_bed/ESR_B.bed", format="bed", ignore.strand = FALSE)
#
# rtracklayer::export(ESR_CD,con = "data/n45_bedfiles/meme_bed/ESR_CD.bed", format="bed", ignore.strand = FALSE)
# rtracklayer::export(EAR_hyper,con = "data/n45_bedfiles/meme_bed/EAR_hyper.bed", format="bed", ignore.strand = FALSE)
# rtracklayer::export(EAR_hypo,con = "data/n45_bedfiles/meme_bed/EAR_hypo.bed", format="bed", ignore.strand = FALSE)
#
# rtracklayer::export(LR_hyper,con = "data/n45_bedfiles/meme_bed/LR_hyper.bed", format="bed", ignore.strand = FALSE)
# rtracklayer::export(LR_hypo,con = "data/n45_bedfiles/meme_bed/LR_hypo.bed", format="bed", ignore.strand = FALSE)
#
# rtracklayer::export(NR_df,con = "data/n45_bedfiles/meme_bed/NR_df.bed", format="bed", ignore.strand = FALSE)
#####SNP annotation file
SNPanno <-
  test2 %>%
  as.data.frame() %>%
  dplyr::select(Peakid,SNPS,gwas) %>%
 mutate(mrc=if_else(Peakid %in% EAR_open$Peakid, "EAR_open",
                      if_else(Peakid %in% EAR_close$Peakid, "EAR_close",
                              if_else(Peakid %in% ESR_open$Peakid,"ESR_open",
                                      if_else(Peakid %in% ESR_close$Peakid,"ESR_close",
                                              if_else(Peakid %in% ESR_OC$Peakid,"ESR_OC",
                                                      if_else(Peakid %in% LR_open$Peakid,"LR_open",
                                                                      if_else(Peakid %in% LR_close$Peakid,"LR_close",
                                                                              if_else(Peakid %in% NR_df$Peakid,"NR","not_mrc"))))))))) %>%
  left_join(Col_fullDF_cug_overlap) %>%
  mutate(has_cpg= if_else(is.na(name),"not_CpGi","CpGi")) %>%
  dplyr::select(Peakid:mrc,has_cpg,name,per_ol) %>%
  dplyr::rename("CpG"="has_cpg","cpg_per_ol"="per_ol","CpG_name"="name") %>%
  left_join(., Peaks_v_cpgpromo, by=c("Peakid"="Peakid"))%>%
    dplyr::select(Peakid:cpg_per_ol,promotor_name) %>%
    mutate(CpG_promo=if_else(is.na(promotor_name),"not_CpGpromo","CpGpromo")) %>%
  left_join(.,Filter_TE_list, by=c(Peakid="Peakid"))%>%
  dplyr::select(SNPS, Peakid,gwas:CpG_promo,repName:repFamily, per_ol) %>%
  dplyr::rename("TE_per_ol"="per_ol") %>%
    group_by(SNPS) %>%
    summarise(Peakid=paste(unique(Peakid), collapse = ","),
              gwas=paste(unique(gwas),collapse=","),
              mrc=paste(unique(mrc),collapse=","),
               CpG=paste(unique(CpG),collapse=","),
               CpG_name=paste(unique(CpG_name),collapse=","),
               cpg_per_ol=paste(unique(cpg_per_ol),collapse=","),
               promotor_name=paste(unique(promotor_name),collapse=","),
               CpG_promo=paste(unique(CpG_promo),collapse=","),
               repName=paste(unique(repName),collapse=","),
               repClass=paste(unique(repClass),collapse=","),
               repFamily=paste(unique(repFamily),collapse=","),
               TE_per_ol=paste(unique(TE_per_ol),collapse=";"))

# write.csv(SNPanno,"data/Final_four_data/annotated_gwas_SNPS.csv")

SNPanno %>%
  kable(., caption = "SNPs and their annotations from my data") %>%
  kable_paper("striped", full_width = TRUE) %>%
  kable_styling(full_width = FALSE, font_size = 14) %>%
scroll_box(height = "500px")| SNPS | Peakid | gwas | mrc | CpG | CpG_name | cpg_per_ol | promotor_name | CpG_promo | repName | repClass | repFamily | TE_per_ol |
|---|---|---|---|---|---|---|---|---|---|---|---|---|
| rs10083696 | chr15.78830933.78832028 | HD,CAD | LR_open | CpGi | CpG: 122 | 0.692356285533797 | NA | not_CpGpromo | NA | NA | NA | NA |
| rs10083697 | chr15.78830933.78832028 | HD,CAD | LR_open | CpGi | CpG: 122 | 0.692356285533797 | NA | not_CpGpromo | NA | NA | NA | NA |
| rs10121140 | chr9.14292492.14292732 | HD,CAD | not_mrc | not_CpGi | NA | NA | NA | not_CpGpromo | MIR3 | SINE | MIR | 1 |
| rs10213171 | chr4.148015916.148016422 | ARR,HD | LR_open | not_CpGi | NA | NA | NA | not_CpGpromo | AluJr4 | SINE | Alu | 0.673400673400673 |
| rs10213376 | chr4.148015002.148015341 | ARR,HD | NR | not_CpGi | NA | NA | NA | not_CpGpromo | (TCTCCTG)n,MIR3 | Simple_repeat,SINE | Simple_repeat,MIR | 1;0.135714285714286 |
| rs1032763 | chr5.17118580.17119099 | HD,CAD | LR_open | not_CpGi | NA | NA | NA | not_CpGpromo | NA | NA | NA | NA |
| rs10456100 | chr6.39214962.39215733 | HD,CAD | LR_close | not_CpGi | NA | NA | NA | not_CpGpromo | MIR3 | SINE | MIR | 0.820809248554913 |
| rs1049334 | chr7.116560073.116560553 | ARR,HD | NR | not_CpGi | NA | NA | NA | not_CpGpromo | NA | NA | NA | NA |
| rs10509768 | chr10.103712814.103713354 | ARR,HD | NR | not_CpGi | NA | NA | NA | not_CpGpromo | MIRb,MIR3 | SINE | MIR | 1;0.0384615384615385 |
| rs1052586 | chr17.46940653.46941215 | HD,MI | LR_close | not_CpGi | NA | NA | NA | not_CpGpromo | NA | NA | NA | NA |
| rs10734649 | chr11.9758098.9760569 | HD,CAD | NR | CpGi | CpG: 72 | 1 | NA | not_CpGpromo | (GTGGC)n,MIR,GA-rich,L2c | Simple_repeat,SINE,Low_complexity,LINE | Simple_repeat,MIR,Low_complexity,L2 | 1 |
| rs10786662 | chr10.102229686.102230890 | ARR,HD | NR | CpGi | CpG: 141 | 0.268564356435644 | NA | not_CpGpromo | MIR3,(GGC)n,(GCCCGG)n | SINE,Simple_repeat | MIR,Simple_repeat | 1 |
| rs10811650 | chr9.22067279.22067652 | HD,CAD | not_mrc | not_CpGi | NA | NA | NA | not_CpGpromo | (AC)n | Simple_repeat | Simple_repeat | 1 |
| rs10818576 | chr9.121650071.121650712 | HD,CAD | ESR_close | not_CpGi | NA | NA | NA | not_CpGpromo | MER30,MIR3 | DNA,SINE | hAT-Charlie,MIR | 0.256198347107438;1 |
| rs10818579 | chr9.121651049.121653070 | HD,MI | NR | CpGi | CpG: 78 | 1 | EH38E2724036 | CpGpromo | GA-rich,MIRb,L3 | Low_complexity,SINE,LINE | Low_complexity,MIR,CR1 | 1 |
| rs10818894 | chr9.123933461.123933812 | ACresp | LR_open | not_CpGi | NA | NA | NA | not_CpGpromo | MLT1J | LTR | ERVL-MaLR | 0.698412698412698 |
| rs10821415 | chr9.94950339.94951513 | ARR,HD | NR | not_CpGi | NA | NA | NA | not_CpGpromo | MIRc,MIRb | SINE | MIR | 0.746543778801843;1;0.633484162895928 |
| rs10824026 | chr10.73660865.73661568 | ARR,HD | LR_open | not_CpGi | NA | NA | NA | not_CpGpromo | AluY,L1MA4A,AluSz | SINE,LINE | Alu,L1 | 0.342948717948718;1;0.164634146341463 |
| rs10871753 | chr18.58289003.58291154 | HD,HF | LR_open | not_CpGi | NA | NA | NA | not_CpGpromo | L2a,MLT1I | LINE,LTR | L2,ERVL-MaLR | 1 |
| rs10927886 | chr1.16012567.16013729 | HD | ESR_close | not_CpGi | NA | NA | NA | not_CpGpromo | MIRb,MIR3,L2b | SINE,LINE | MIR,L2 | 1;0.686567164179104 |
| rs10931898 | chr2.200305915.200307710 | ARR,HD | NR | CpGi | CpG: 150 | 0.954334365325077 | EH38E2065239 | CpGpromo | (GGCG)n,(CGGCCC)n,(CGCCCG)n | Simple_repeat | Simple_repeat | 1 |
| rs11038225 | chr11.44955010.44955513 | HD | LR_open | not_CpGi | NA | NA | NA | not_CpGpromo | MIRb | SINE | MIR | 0.121848739495798 |
| rs11044977 | chr12.20004923.20005338 | HD,MI | NR | not_CpGi | NA | NA | NA | not_CpGpromo | MER85,L2a | DNA,LINE | PiggyBac,L2 | 1 |
| rs11054833 | chr12.12349737.12350701 | HD,CAD | NR | CpGi | CpG: 61 | 1 | EH38E1593399 | CpGpromo | L1ME4b | LINE | L1 | 1 |
| rs11124554 | chr2.36922199.36922493 | HD,HF | NR | not_CpGi | NA | NA | NA | not_CpGpromo | L1MC4,AluJr | LINE,SINE | L1,Alu | 0.0381231671554252;0.842622950819672 |
| rs11180610 | chr12.75646380.75646944 | HD | NR | not_CpGi | NA | NA | NA | not_CpGpromo | Tigger19b | DNA | TcMar-Tigger | 0.802083333333333 |
| rs1122608 | chr19.11052376.11052994 | HD,CAD,MI | NR | not_CpGi | NA | NA | NA | not_CpGpromo | AluJr | SINE | Alu | 0.244897959183673 |
| rs11235604 | chr11.72821745.72822900 | HD,CAD | NR | CpGi | CpG: 111 | 0.847676419965577 | NA | not_CpGpromo | NA | NA | NA | NA |
| rs11242465 | chr5.139426247.139426836 | HD,HF | LR_open | not_CpGi | NA | NA | NA | not_CpGpromo | Alu,AluSz6 | SINE | Alu | 1;0.72463768115942 |
| rs112577387 | chr4.22625204.22625843 | HD,HF | LR_open | not_CpGi | NA | NA | NA | not_CpGpromo | MIRc | SINE | MIR | 0.811188811188811 |
| rs112941079 | chr5.9544368.9546915 | HD,CAD | NR | CpGi | CpG: 138,CpG: 25 | 1 | NA | not_CpGpromo | (GGAGCGG)n,(CCG)n,(GCCCC)n | Simple_repeat | Simple_repeat | 1 |
| rs112941127 | chr2.217868752.217869273 | HD,CAD | LR_open | not_CpGi | NA | NA | NA | not_CpGpromo | MIRb | SINE | MIR | 0.220883534136546 |
| rs112949822 | chr5.108747709.108749572 | HD,CAD | NR | CpGi | CpG: 110 | 1 | NA | not_CpGpromo | L2c | LINE | L2 | 1 |
| rs113140904 | chr5.9544368.9546915 | HD,CAD | NR | CpGi | CpG: 138,CpG: 25 | 1 | NA | not_CpGpromo | (GGAGCGG)n,(CCG)n,(GCCCC)n | Simple_repeat | Simple_repeat | 1 |
| rs113452171 | chr7.91784539.91784870 | HD | NR | not_CpGi | NA | NA | NA | not_CpGpromo | NA | NA | NA | NA |
| rs113716316 | chr1.27601871.27602613 | HD,CAD,MI | NR | not_CpGi | NA | NA | NA | not_CpGpromo | (CCAGC)n,(TCCCGC)n | Simple_repeat | Simple_repeat | 1 |
| rs113819537 | chr12.26194928.26196665 | ARR,HD,HF | NR | CpGi | CpG: 74 | 1 | EH38E1600228 | CpGpromo | AluJr,(CACC)n,(CTG)n | SINE,Simple_repeat | Alu,Simple_repeat | 0.229452054794521;1 |
| rs113920486 | chr10.52539479.52540028 | HD | ESR_open | not_CpGi | NA | NA | NA | not_CpGpromo | MamGypLTR1d | LTR | Gypsy | 0.175572519083969 |
| rs11398961 | chr15.78830933.78832028 | HD,CAD | LR_open | CpGi | CpG: 122 | 0.692356285533797 | NA | not_CpGpromo | NA | NA | NA | NA |
| rs114192718 | chr2.128027137.128028647 | HD,CAD | NR | CpGi | CpG: 165 | 0.86441647597254 | EH38E2031716,EH38E2031718 | CpGpromo | (CGG)n,(CCGC)n,G-rich | Simple_repeat,Low_complexity | Simple_repeat,Low_complexity | 1;0.780487804878049 |
| rs11465228 | chr5.157575011.157576352 | HD,CAD | NR | CpGi | CpG: 95 | 1 | EH38E2424756 | CpGpromo | MIR3,(AG)n,(T)n | SINE,Simple_repeat | MIR,Simple_repeat | 0.191489361702128;1 |
| rs114782882 | chr12.75895398.75895669 | HD,HF | NR | not_CpGi | NA | NA | NA | not_CpGpromo | NA | NA | NA | NA |
| rs11554495 | chr12.52903311.52905516 | HD | NR | CpGi | CpG: 41 | 1 | NA | not_CpGpromo | MIRb,(CCACC)n,(A)n | SINE,Simple_repeat | MIR,Simple_repeat | 0.311827956989247;1 |
| rs11591147 | chr1.55039222.55040233 | HD,CAD,MI | NR | CpGi | CpG: 85 | 0.88586387434555 | EH38E1349458,EH38E1349459 | CpGpromo | (GCT)n,MIR3 | Simple_repeat,SINE | Simple_repeat,MIR | 1 |
| rs11606719 | chr11.118911506.118912630 | HD,CAD | NR | not_CpGi | NA | NA | NA | not_CpGpromo | MIRb | SINE | MIR | 1 |
| rs11631816 | chr15.73353612.73354309 | HD,CAD | LR_open | not_CpGi | NA | NA | NA | not_CpGpromo | NA | NA | NA | NA |
| rs11642015 | chr16.53768577.53768944 | HD,HF | LR_open | not_CpGi | NA | NA | NA | not_CpGpromo | UCON8 | DNA | DNA | 1 |
| rs11643207 | chr16.75463626.75465107 | HD | NR | CpGi | CpG: 113 | 1 | EH38E1828262,EH38E1828263,EH38E1828264 | CpGpromo | NA | NA | NA | NA |
| rs11670056 | chr19.18478653.18479216 | HD,CAD | LR_open | not_CpGi | NA | NA | NA | not_CpGpromo | MER20 | DNA | hAT-Charlie | 0.552941176470588 |
| rs11677932 | chr2.237315068.237315792 | HD,CAD | LR_close | not_CpGi | NA | NA | NA | not_CpGpromo | NA | NA | NA | NA |
| rs116843064 | chr19.8363631.8364760 | HD,CAD,MI | NR | CpGi | CpG: 52 | 1 | NA | not_CpGpromo | AluSz,(CCCCGAAT)n | SINE,Simple_repeat | Alu,Simple_repeat | 0.869747899159664;1 |
| rs117038461 | chr7.100243501.100243833 | HD,CAD | EAR_close | not_CpGi | NA | NA | NA | not_CpGpromo | MIRc,L1M5 | SINE,LINE | MIR,L1 | 0.521276595744681;1 |
| rs11705555 | chr22.27810496.27811281 | HD | NR | not_CpGi | NA | NA | NA | not_CpGpromo | (TGCACA)n | Simple_repeat | Simple_repeat | 0.95 |
| rs11713141 | chr3.138347976.138349043 | HD,CAD | NR | CpGi | CpG: 132 | 0.979225684608121 | EH38E2241845,EH38E2241846 | CpGpromo | NA | NA | NA | NA |
| rs117299725 | chr9.76808694.76808955 | ACtox,ACresp,HD | LR_open | not_CpGi | NA | NA | NA | not_CpGpromo | NA | NA | NA | NA |
| rs11759102 | chr6.19836789.19839260 | HD,CAD | NR | CpGi | CpG: 247 | 0.997826086956522 | EH38E2452004 | CpGpromo | AmnSINE2 | SINE | tRNA-Deu | 1 |
| rs11768850 | chr7.836506.836873 | ARR,HD | NR | not_CpGi | NA | NA | NA | not_CpGpromo | MLT2B4 | LTR | ERVL | 0.651612903225806 |
| rs11838267 | chr12.7068459.7069322 | HD,CAD | NR | not_CpGi | NA | NA | NA | not_CpGpromo | MIRb | SINE | MIR | 1 |
| rs11838776 | chr13.110387344.110389032 | HD,CAD | NR | not_CpGi | NA | NA | NA | not_CpGpromo | NA | NA | NA | NA |
| rs11841562 | chr13.21536977.21537596 | ARR,HD | LR_open | not_CpGi | NA | NA | NA | not_CpGpromo | L2,AluSq2 | LINE,SINE | L2,Alu | 0.176470588235294;1;0.440251572327044 |
| rs12122060 | chr1.170224576.170224916 | ARR,HD | LR_close | not_CpGi | NA | NA | NA | not_CpGpromo | MER53,MIRb,L1MA7 | DNA,SINE,LINE | hAT,MIR,L1 | 0.0173913043478261;1;0.288571428571429 |
| rs12150051 | chr17.12584681.12585327 | HD,CAD | LR_close | not_CpGi | NA | NA | NA | not_CpGpromo | L1M7 | LINE | L1 | 0.331269349845201 |
| rs12155623 | chr8.48898785.48899940 | ARR,HD | NR | not_CpGi | NA | NA | NA | not_CpGpromo | (CA)n | Simple_repeat | Simple_repeat | 0.787037037037037 |
| rs1225600 | chr6.28269507.28270003 | HD,CAD | LR_open | not_CpGi | NA | NA | NA | not_CpGpromo | MLT2B4,AluSc8 | LTR,SINE | ERVL,Alu | 0.82565130260521;0.259259259259259 |
| rs12440045 | chr15.41490412.41490650 | HD,CAD | LR_open | not_CpGi | NA | NA | NA | not_CpGpromo | NA | NA | NA | NA |
| rs1250258 | chr2.215435176.215436848 | HD,MI | NR | CpGi | CpG: 43 | 1 | EH38E2072836 | CpGpromo | (CCCG)n,G-rich | Simple_repeat,Low_complexity | Simple_repeat,Low_complexity | 1 |
| rs1250259 | chr2.215435176.215436848 | HD,CAD | NR | CpGi | CpG: 43 | 1 | EH38E2072836 | CpGpromo | (CCCG)n,G-rich | Simple_repeat,Low_complexity | Simple_repeat,Low_complexity | 1 |
| rs1250566 | chr10.79286266.79286796 | HD | LR_open | not_CpGi | NA | NA | NA | not_CpGpromo | NA | NA | NA | NA |
| rs12603284 | chr17.2867997.2868307 | ARR,HD | NR | not_CpGi | NA | NA | NA | not_CpGpromo | MamRTE1 | LINE | RTE-BovB | 1 |
| rs12640611 | chr4.10102598.10102907 | ARR,HD | ESR_open | not_CpGi | NA | NA | NA | not_CpGpromo | MSTD,MIRb | LTR,SINE | ERVL-MaLR,MIR | 0.197707736389685;1 |
| rs12712649 | chr2.39631404.39632344 | HD,CAD | LR_open | not_CpGi | NA | NA | NA | not_CpGpromo | MER5A,MLT1O | DNA,LTR | hAT-Charlie,ERVL-MaLR | 1;0.738095238095238 |
| rs12724121 | chr1.236688731.236689166 | HD,HF | LR_close | not_CpGi | NA | NA | NA | not_CpGpromo | NA | NA | NA | NA |
| rs12740374 | chr1.109274953.109276202 | HD,CAD,MI | LR_open | not_CpGi | NA | NA | NA | not_CpGpromo | (TCCTC)n | Simple_repeat | Simple_repeat | 1 |
| rs12893887 | chr14.99644968.99645471 | HD,CAD | NR | CpGi | CpG: 93 | 0.641221374045801 | EH38E1741629,EH38E1741630 | CpGpromo | NA | NA | NA | NA |
| rs12906125 | chr15.90884159.90884726 | HD,MI | not_mrc | CpGi | CpG: 45 | 1 | EH38E1787901 | CpGpromo | G-rich | Low_complexity | Low_complexity | 1 |
| rs12936927 | chr17.17823556.17824258 | HD,CAD | ESR_close | CpGi | CpG: 47 | 0.967213114754098 | NA | not_CpGpromo | (CGCCC)n,MIRb | Simple_repeat,SINE | Simple_repeat,MIR | 1 |
| rs12980942 | chr19.41324959.41326640 | HD,CAD | ESR_close | not_CpGi | NA | NA | NA | not_CpGpromo | (CTCC)n,(CCCTG)n | Simple_repeat | Simple_repeat | 1 |
| rs12983897 | chr19.17747415.17747946 | HD,MI | LR_close | CpGi | CpG: 64 | 0.738461538461539 | EH38E1943617 | CpGpromo | MIRb | SINE | MIR | 0.0130718954248366 |
| rs13176353 | chr5.1800893.1802029 | HD | NR | CpGi | CpG: 185 | 0.367839607201309 | EH38E2353141 | CpGpromo | NA | NA | NA | NA |
| rs13177180 | chr5.115543502.115545233 | HD | NR | CpGi | CpG: 65 | 1 | EH38E2400588 | CpGpromo | G-rich,THE1B | Low_complexity,LTR | Low_complexity,ERVL-MaLR | 1;0.304093567251462 |
| rs1333042 | chr9.22102751.22103879 | HD,CAD | NR | not_CpGi | NA | NA | NA | not_CpGpromo | MIR3,(TG)n | SINE,Simple_repeat | MIR,Simple_repeat | 1 |
| rs13346603 | chr19.41439501.41440141 | HD,HF | NR | CpGi | CpG: 18 | 1 | NA | not_CpGpromo | AluJr | SINE | Alu | 0.148936170212766 |
| rs13402621 | chr2.43231283.43231596 | HD,MI | LR_close | not_CpGi | NA | NA | NA | not_CpGpromo | NA | NA | NA | NA |
| rs141654122 | chr5.138068694.138070268 | ARR,HD | NR | not_CpGi | NA | NA | NA | not_CpGpromo | MIR3,U6,MamTip2,AluSp,SVA_D | SINE,snRNA,DNA,Retroposon | MIR,snRNA,hAT-Tip100,Alu,SVA | 1;0.177004538577912 |
| rs145306069 | chr1.203795403.203796608 | HD,CAD | NR | CpGi | CpG: 57 | 1 | EH38E1413938 | CpGpromo | NA | NA | NA | NA |
| rs1468498 | chr10.114306394.114306913 | HD | NR | not_CpGi | NA | NA | NA | not_CpGpromo | NA | NA | NA | NA |
| rs147288039 | chr9.95006342.95007055 | ARR,HD | NR | not_CpGi | NA | NA | NA | not_CpGpromo | AluSc8 | SINE | Alu | 0.516778523489933 |
| rs147631684 | chr16.83599141.83599350 | ACtox,ACresp,HD | LR_close | not_CpGi | NA | NA | NA | not_CpGpromo | MLT1K | LTR | ERVL-MaLR | 0.0246045694200351 |
| rs148241618 | chr18.45879810.45880598 | HD,CAD | NR | not_CpGi | NA | NA | NA | not_CpGpromo | NA | NA | NA | NA |
| rs148416395 | chr22.46417011.46418228 | HD,HF | LR_close | not_CpGi | NA | NA | NA | not_CpGpromo | MIRc,MIRb,AluSx1 | SINE | MIR,Alu | 1;0.0946372239747634 |
| rs1522387 | chr3.57959935.57960395 | HD | NR | not_CpGi | NA | NA | NA | not_CpGpromo | MLT1K | LTR | ERVL-MaLR | 0.677083333333333 |
| rs1522388 | chr3.57959935.57960395 | HD | NR | not_CpGi | NA | NA | NA | not_CpGpromo | MLT1K | LTR | ERVL-MaLR | 0.677083333333333 |
| rs1537372 | chr9.22102751.22103879 | HD,CAD | NR | not_CpGi | NA | NA | NA | not_CpGpromo | MIR3,(TG)n | SINE,Simple_repeat | MIR,Simple_repeat | 1 |
| rs1537373 | chr9.22102751.22103879 | HD,CAD | NR | not_CpGi | NA | NA | NA | not_CpGpromo | MIR3,(TG)n | SINE,Simple_repeat | MIR,Simple_repeat | 1 |
| rs16866933 | chr2.179701478.179702086 | ARR,HD | LR_open | not_CpGi | NA | NA | NA | not_CpGpromo | MIR | SINE | MIR | 0.367741935483871 |
| rs170041 | chr17.2266828.2267276 | HD,CAD | NR | not_CpGi | NA | NA | NA | not_CpGpromo | AluJb | SINE | Alu | 0.222996515679443 |
| rs17101521 | chr10.121155583.121156319 | HD,CAD | NR | not_CpGi | NA | NA | NA | not_CpGpromo | L3,LTR16A2 | LINE,LTR | CR1,ERVL | 0.363247863247863;1 |
| rs17118812 | chr5.140322792.140323772 | ARR,HD | NR | not_CpGi | NA | NA | NA | not_CpGpromo | NA | NA | NA | NA |
| rs17228212 | chr15.67165920.67166678 | HD,CAD | LR_open | not_CpGi | NA | NA | NA | not_CpGpromo | L2b | LINE | L2 | 1 |
| rs17375901 | chr1.11792123.11792871 | ARR,HD | ESR_close | not_CpGi | NA | NA | NA | not_CpGpromo | L2c,MIRc | LINE,SINE | L2,MIR | 0.3625;0.56 |
| rs17458018 | chr2.215420519.215420812 | HD,CAD | NR | not_CpGi | NA | NA | NA | not_CpGpromo | NA | NA | NA | NA |
| rs175040 | chr14.75002369.75003794 | HD,CAD | NR | CpGi | CpG: 53 | 1 | EH38E1728281 | CpGpromo | NA | NA | NA | NA |
| rs17608766 | chr17.46935408.46936158 | HD,CAD | EAR_close | not_CpGi | NA | NA | NA | not_CpGpromo | NA | NA | NA | NA |
| rs1769758 | chr10.79139073.79139940 | ARR,HD | LR_close | not_CpGi | NA | NA | NA | not_CpGpromo | NA | NA | NA | NA |
| rs17782904 | chr18.44733224.44733992 | HD,CAD | LR_open | not_CpGi | NA | NA | NA | not_CpGpromo | NA | NA | NA | NA |
| rs1788826 | chr18.23574050.23574545 | HD,HF | NR | not_CpGi | NA | NA | NA | not_CpGpromo | NA | NA | NA | NA |
| rs1800449 | chr5.122076732.122078641 | HD,CAD | LR_open | CpGi | CpG: 137 | 1 | NA | not_CpGpromo | NA | NA | NA | NA |
| rs1800470 | chr19.41352378.41354231 | HD,CAD | NR | CpGi | CpG: 139 | 1 | EH38E1954757,EH38E1954758 | CpGpromo | (CAGCAG)n,(TCC)n | Simple_repeat | Simple_repeat | 1 |
| rs1800797 | chr7.22726398.22726697 | HD | NR | not_CpGi | NA | NA | NA | not_CpGpromo | NA | NA | NA | NA |
| rs1800978 | chr9.104903653.104904005 | HD,CAD | LR_open | not_CpGi | NA | NA | NA | not_CpGpromo | NA | NA | NA | NA |
| rs1822273 | chr11.19988504.19989024 | ARR,HD | LR_close | not_CpGi | NA | NA | NA | not_CpGpromo | AmnSINE1 | SINE | 5S-Deu-L2 | 1 |
| rs190258023 | chr22.46417011.46418228 | HD,HF | LR_close | not_CpGi | NA | NA | NA | not_CpGpromo | MIRc,MIRb,AluSx1 | SINE | MIR,Alu | 1;0.0946372239747634 |
| rs191615952 | chr19.2235309.2237165 | HD,CAD | NR | CpGi | CpG: 157 | 1 | EH38E1932153,EH38E1932154 | CpGpromo | MLT1C,AluJr | LTR,SINE | ERVL-MaLR,Alu | 0.0374149659863946;0.102040816326531 |
| rs192407614 | chr7.36459124.36459918 | HD,CAD | EAR_open | not_CpGi | NA | NA | NA | not_CpGpromo | LTR38B | LTR | ERV1 | 1 |
| rs1926032 | chr10.103069381.103070029 | HD,CAD | NR | not_CpGi | NA | NA | NA | not_CpGpromo | L1ME3A | LINE | L1 | 0.2 |
| rs1962412 | chr17.48892152.48893499 | HD,CAD | NR | CpGi | CpG: 35 | 1 | EH38E1868507 | CpGpromo | AluSx | SINE | Alu | 0.0487012987012987 |
| rs2052923 | chr2.43184483.43184778 | HD,CAD | LR_open | not_CpGi | NA | NA | NA | not_CpGpromo | MIRb,Cheshire | SINE,DNA | MIR,hAT-Charlie | 1;0.100917431192661 |
| rs2068063 | chr4.76495482.76496240 | HD,MI | not_mrc | not_CpGi | NA | NA | NA | not_CpGpromo | LTR16A1,L2 | LTR,LINE | ERVL,L2 | 0.337264150943396;0.889583333333333 |
| rs2071502 | chr17.7510984.7512510 | ARR,HD | ESR_open | not_CpGi | NA | NA | NA | not_CpGpromo | AluSx | SINE | Alu | 0.902654867256637 |
| rs2073533 | chr7.13989380.13991798 | HD,CAD | NR | CpGi | CpG: 18,CpG: 21 | 1 | EH38E2535294 | CpGpromo | (AACA)n | Simple_repeat | Simple_repeat | 1 |
| rs2076380 | chr20.38164364.38165984 | HD | NR | CpGi | CpG: 35 | 1 | EH38E2111384 | CpGpromo | MIRc,(AC)n | SINE,Simple_repeat | MIR,Simple_repeat | 1 |
| rs2083636 | chr8.20007264.20008372 | HD,CAD | NR | not_CpGi | NA | NA | NA | not_CpGpromo | LTR32,MER34A,LTR48 | LTR | ERVL,ERV1 | 0.875294117647059;1 |
| rs2099684 | chr1.161530078.161531531 | HD | NR | CpGi | CpG: 32 | 1 | NA | not_CpGpromo | tRNA-Leu-CTG,tRNA-Gly-GGA,(TTCC)n,Charlie5 | tRNA,Simple_repeat,DNA | tRNA,Simple_repeat,hAT-Charlie | 1;0.204301075268817 |
| rs2145274 | chr20.6590860.6591642 | ARR,HD | LR_open | not_CpGi | NA | NA | NA | not_CpGpromo | Penelope1_Vert | LINE | Penelope | 1 |
| rs2145598 | chr14.58326948.58327320 | HD,CAD | NR | not_CpGi | NA | NA | NA | not_CpGpromo | L2c,MER3 | LINE,DNA | L2,hAT-Charlie | 0.219123505976096;1 |
| rs216172 | chr17.2222861.2223544 | HD,CAD | LR_close | not_CpGi | NA | NA | NA | not_CpGpromo | NA | NA | NA | NA |
| rs2220127 | chr2.178846382.178846751 | HD,HF | LR_open | not_CpGi | NA | NA | NA | not_CpGpromo | MIRc | SINE | MIR | 0.38655462184874 |
| rs2220427 | chr4.110793293.110793943 | ARR,HD | LR_open | not_CpGi | NA | NA | NA | not_CpGpromo | NA | NA | NA | NA |
| rs2267386 | chr22.38435884.38436418 | HD | NR | not_CpGi | NA | NA | NA | not_CpGpromo | MIR | SINE | MIR | 1 |
| rs2269001 | chr7.150954727.150956459 | ARR,HD | ESR_close | CpGi | CpG: 23 | 1 | EH38E2600998 | CpGpromo | NA | NA | NA | NA |
| rs2281727 | chr17.2214040.2216112 | HD,CAD | NR | not_CpGi | NA | NA | NA | not_CpGpromo | (AC)n,GA-rich | Simple_repeat,Low_complexity | Simple_repeat,Low_complexity | 1 |
| rs2286466 | chr16.1963596.1965464 | ARR,HD | NR | CpGi | CpG: 122 | 1 | EH38E1796197,EH38E1796198,EH38E1796199 | CpGpromo | AluSx3,(CCCCGG)n,(CTGACCC)n | SINE,Simple_repeat | Alu,Simple_repeat | 0.0114068441064639;1 |
| rs2291437 | chr12.24561685.24562685 | ARR,HD | NR | CpGi | CpG: 92 | 0.495515695067265 | EH38E1599170,EH38E1599171 | CpGpromo | G-rich,(CCACCTC)n,(TG)n,(TCGC)n | Low_complexity,Simple_repeat | Low_complexity,Simple_repeat | 1 |
| rs2306363 | chr11.65637814.65638912 | HD,CAD | NR | CpGi | CpG: 36 | 1 | EH38E1545418 | CpGpromo | MIRb | SINE | MIR | 0.252873563218391 |
| rs2306374 | chr3.138400627.138401136 | HD,CAD | NR | not_CpGi | NA | NA | NA | not_CpGpromo | NA | NA | NA | NA |
| rs2359171 | chr16.73018778.73020183 | ARR,HD | NR | not_CpGi | NA | NA | NA | not_CpGpromo | (GCGTGT)n | Simple_repeat | Simple_repeat | 1 |
| rs2410859 | chr17.75844492.75845572 | HD,CAD | LR_close | not_CpGi | NA | NA | NA | not_CpGpromo | (GTGGG)n | Simple_repeat | Simple_repeat | 1 |
| rs2415081 | chr15.70171390.70172398 | ARR,HD | NR | not_CpGi | NA | NA | NA | not_CpGpromo | MER102c,MIRb,MIR3 | DNA,SINE | hAT-Charlie,MIR | 0.788793103448276;1 |
| rs2421649 | chr3.169478628.169479748 | HD | NR | not_CpGi | NA | NA | NA | not_CpGpromo | L2b,(A)n | LINE,Simple_repeat | L2,Simple_repeat | 1 |
| rs243071 | chr2.60391661.60392192 | HD,CAD | LR_open | not_CpGi | NA | NA | NA | not_CpGpromo | MIRb | SINE | MIR | 1 |
| rs2452600 | chr4.94575665.94576013 | HD,CAD | EAR_open | not_CpGi | NA | NA | NA | not_CpGpromo | NA | NA | NA | NA |
| rs2493298 | chr1.3408398.3409463 | HD,CAD | LR_open | CpGi | CpG: 37 | 1 | NA | not_CpGpromo | NA | NA | NA | NA |
| rs2507 | chr15.73983047.73983757 | HD,CAD | NR | not_CpGi | NA | NA | NA | not_CpGpromo | (CCTTC)n | Simple_repeat | Simple_repeat | 1 |
| rs2540949 | chr2.65055695.65057220 | ARR,HD | NR | CpGi | CpG: 132 | 1 | EH38E2004398 | CpGpromo | NA | NA | NA | NA |
| rs2595104 | chr4.110631655.110632575 | ARR,HD | NR | CpGi | CpG: 100 | 0.576480990274094 | NA | not_CpGpromo | NA | NA | NA | NA |
| rs2625322 | chr11.19988504.19989024 | ARR,HD | LR_close | not_CpGi | NA | NA | NA | not_CpGpromo | AmnSINE1 | SINE | 5S-Deu-L2 | 1 |
| rs2660739 | chr3.78644690.78645022 | HD | not_mrc | not_CpGi | NA | NA | NA | not_CpGpromo | L2c | LINE | L2 | 1 |
| rs281868 | chr6.118252411.118253042 | ARR,HD | LR_open | not_CpGi | NA | NA | NA | not_CpGpromo | L2a,L2b | LINE | L2 | 0.492152466367713;0.26080476900149 |
| rs2834618 | chr21.34746498.34746999 | ARR,HD | ESR_close | not_CpGi | NA | NA | NA | not_CpGpromo | AluSx,MIRc,(CTCC)n | SINE,Simple_repeat | Alu,MIR,Simple_repeat | 0.201320132013201;1;0.526315789473684 |
| rs2852306 | chr18.45565618.45565968 | HD | EAR_close | not_CpGi | NA | NA | NA | not_CpGpromo | MIR3 | SINE | MIR | 0.614814814814815 |
| rs295114 | chr2.200330546.200331118 | ARR,HD | NR | not_CpGi | NA | NA | NA | not_CpGpromo | NA | NA | NA | NA |
| rs3176326 | chr6.36678380.36679788 | ARR,HD,HF | ESR_open | CpGi | CpG: 204 | 0.594777127420081 | EH38E2463466 | CpGpromo | NA | NA | NA | NA |
| rs3213420 | chr16.72008437.72009100 | HD,CAD | LR_close | CpGi | CpG: 50 | 1 | EH38E1826130 | CpGpromo | NA | NA | NA | NA |
| rs326 | chr8.19961869.19963021 | HD,CAD | NR | not_CpGi | NA | NA | NA | not_CpGpromo | NA | NA | NA | NA |
| rs328 | chr8.19961869.19963021 | HD,CAD | NR | not_CpGi | NA | NA | NA | not_CpGpromo | NA | NA | NA | NA |
| rs337711 | chr5.114412835.114413212 | ARR,HD | not_mrc | not_CpGi | NA | NA | NA | not_CpGpromo | NA | NA | NA | NA |
| rs34292822 | chr1.154839629.154839995 | ARR,HD | ESR_close | not_CpGi | NA | NA | NA | not_CpGpromo | NA | NA | NA | NA |
| rs34774090 | chr19.11142349.11143639 | HD,CAD | EAR_close | not_CpGi | NA | NA | NA | not_CpGpromo | MIR1_Amn,G-rich,MER20 | SINE,Low_complexity,DNA | MIR,Low_complexity,hAT-Charlie | 1 |
| rs34866937 | chr8.124847104.124848853 | HD,HF | NR | not_CpGi | NA | NA | NA | not_CpGpromo | MamTip2,AluSx | DNA,SINE | hAT-Tip100,Alu | 1 |
| rs34871776 | chr3.12773796.12774087 | HD | NR | not_CpGi | NA | NA | NA | not_CpGpromo | NA | NA | NA | NA |
| rs34969716 | chr6.18209665.18210014 | ARR,HD | NR | not_CpGi | NA | NA | NA | not_CpGpromo | AluJr,MER5B | SINE,DNA | Alu,hAT-Charlie | 0.636904761904762;1 |
| rs35006907 | chr8.124847104.124848853 | ARR,HD | NR | not_CpGi | NA | NA | NA | not_CpGpromo | MamTip2,AluSx | DNA,SINE | hAT-Tip100,Alu | 1 |
| rs35176054 | chr10.103720444.103721025 | ARR,HD | ESR_close | not_CpGi | NA | NA | NA | not_CpGpromo | NA | NA | NA | NA |
| rs35267671 | chr1.37931148.37932171 | HD,MI | NR | CpGi | CpG: 53 | 1 | EH38E1338382 | CpGpromo | MIR3 | SINE | MIR | 1 |
| rs35620480 | chr8.11641900.11643102 | ARR,HD | LR_close | not_CpGi | NA | NA | NA | not_CpGpromo | MLT1K,MIRb,(C)n | LTR,SINE,Simple_repeat | ERVL-MaLR,MIR,Simple_repeat | 0.588832487309645;1 |
| rs35946663 | chr14.96362201.96364292 | HD | NR | CpGi | CpG: 101 | 1 | EH38E1739803,EH38E1739804 | CpGpromo | (CGGCTC)n,MIR | Simple_repeat,SINE | Simple_repeat,MIR | 1;0.248780487804878 |
| rs360153 | chr11.9740217.9740734 | HD,CAD | LR_open | not_CpGi | NA | NA | NA | not_CpGpromo | NA | NA | NA | NA |
| rs360801 | chr2.62727824.62728333 | HD,MI | NR | not_CpGi | NA | NA | NA | not_CpGpromo | LTR35,L1MB8 | LTR,LINE | ERV1,L1 | 0.886917960088692;0.107569721115538 |
| rs3731748 | chr2.178547784.178549172 | ARR,HD | ESR_OC | not_CpGi | NA | NA | NA | not_CpGpromo | OldhAT1 | DNA | hAT-Ac | 1 |
| rs3734634 | chr6.125789773.125791822 | HD | NR | CpGi | CpG: 107 | 1 | EH38E2500543,EH38E2500544 | CpGpromo | (CCT)n,(CGC)n | Simple_repeat | Simple_repeat | 1 |
| rs376825901 | chr7.93713592.93714106 | HD,CAD | NR | not_CpGi | NA | NA | NA | not_CpGpromo | Tigger1 | DNA | TcMar-Tigger | 0.213959285417532 |
| rs3787662 | chr21.29151834.29152614 | ARR,HD | NR | not_CpGi | NA | NA | NA | not_CpGpromo | L2b | LINE | L2 | 1 |
| rs3803802 | chr17.7718045.7718289 | ARR,HD,HF,CAD | EAR_open | not_CpGi | NA | NA | NA | not_CpGpromo | NA | NA | NA | NA |
| rs3807989 | chr7.116545872.116546373 | ARR,HD | ESR_close | not_CpGi | NA | NA | NA | not_CpGpromo | NA | NA | NA | NA |
| rs3809297 | chr12.111171885.111172119 | ARR,HD | not_mrc | not_CpGi | NA | NA | NA | not_CpGpromo | (TGCGTG)n | Simple_repeat | Simple_repeat | 0.72280701754386 |
| rs3813127 | chr18.22457586.22457998 | HD,CAD | LR_close | not_CpGi | NA | NA | NA | not_CpGpromo | MIRb | SINE | MIR | 0.418439716312057 |
| rs3814864 | chr14.72893758.72895206 | ARR,HD | NR | CpGi | CpG: 165 | 0.218648018648019 | EH38E1726798,EH38E1726799 | CpGpromo | GA-rich | Low_complexity | Low_complexity | 1 |
| rs3822127 | chr4.173529475.173530537 | ARR,HD | EAR_open | CpGi | CpG: 120 | 0.593113141250878 | EH38E2344608,EH38E2344610 | CpGpromo | (CCGGCT)n,(CCCTC)n | Simple_repeat | Simple_repeat | 1 |
| rs3822259 | chr4.10115366.10117581 | ARR,HD | NR | CpGi | CpG: 136 | 1 | EH38E2280769,EH38E2280771,EH38E2280772 | CpGpromo | MIRc,5S,(GGCAG)n,G-rich,(CCGGCC)n | SINE,rRNA,Simple_repeat,Low_complexity | MIR,rRNA,Simple_repeat,Low_complexity | 1 |
| rs3853445 | chr4.110840197.110840561 | ARR,HD | not_mrc | not_CpGi | NA | NA | NA | not_CpGpromo | NA | NA | NA | NA |
| rs3885907 | chr13.30740138.30740672 | ACresp | LR_open | not_CpGi | NA | NA | NA | not_CpGpromo | L3,MIR,(TC)n,L2 | LINE,SINE,Simple_repeat | CR1,MIR,Simple_repeat,L2 | 0.385869565217391;1;0.27319587628866 |
| rs3895874 | chr17.48970223.48970597 | HD,CAD | NR | not_CpGi | NA | NA | NA | not_CpGpromo | NA | NA | NA | NA |
| rs3904323 | chr13.22794559.22794879 | ARR,HD | NR | not_CpGi | NA | NA | NA | not_CpGpromo | OldhAT1 | DNA | hAT-Ac | 1 |
| rs42044 | chr7.92620778.92621787 | ARR,HD | NR | not_CpGi | NA | NA | NA | not_CpGpromo | AluJb,MamRTE1 | SINE,LINE | Alu,RTE-BovB | 0.506802721088435;0.298449612403101 |
| rs4234323 | chr3.151479569.151479846 | HD,CAD | NR | not_CpGi | NA | NA | NA | not_CpGpromo | NA | NA | NA | NA |
| rs4234324 | chr3.151479569.151479846 | HD,CAD | NR | not_CpGi | NA | NA | NA | not_CpGpromo | NA | NA | NA | NA |
| rs4387942 | chr3.151483988.151484643 | HD,CAD | ESR_close | not_CpGi | NA | NA | NA | not_CpGpromo | L1PA7 | LINE | L1 | 0.101516558341071 |
| rs472109 | chr11.9748359.9748943 | HD,CAD | LR_close | not_CpGi | NA | NA | NA | not_CpGpromo | LTR41,MIRb | LTR,SINE | ERVL,MIR | 0.61864406779661;1;0.703703703703704 |
| rs472495 | chr1.55055575.55055793 | HD,CAD | not_mrc | not_CpGi | NA | NA | NA | not_CpGpromo | MLT2D | LTR | ERVL | 0.562982005141388 |
| rs4757877 | chr11.19988504.19989024 | ARR,HD | LR_close | not_CpGi | NA | NA | NA | not_CpGpromo | AmnSINE1 | SINE | 5S-Deu-L2 | 1 |
| rs476348 | chr18.35089781.35090661 | HD | NR | not_CpGi | NA | NA | NA | not_CpGpromo | L1MB7,L1MA6,AluSx1 | LINE,SINE | L1,Alu | 0.478102189781022;1;0.67948717948718 |
| rs4773140 | chr13.110301444.110302036 | HD,CAD | NR | not_CpGi | NA | NA | NA | not_CpGpromo | L2 | LINE | L2 | 0.210682492581602 |
| rs4773141 | chr13.110301444.110302036 | HD,CAD | NR | not_CpGi | NA | NA | NA | not_CpGpromo | L2 | LINE | L2 | 0.210682492581602 |
| rs4773144 | chr13.110305804.110309074 | HD,CAD | NR | CpGi | CpG: 178,CpG: 19 | 1 | EH38E1697729,EH38E1697730 | CpGpromo | (AAGAAC)n,(GGC)n | Simple_repeat | Simple_repeat | 1 |
| rs4871397 | chr8.123622558.123623378 | ARR,HD | NR | not_CpGi | NA | NA | NA | not_CpGpromo | NA | NA | NA | NA |
| rs4894803 | chr3.172082306.172082889 | HD,CAD | NR | not_CpGi | NA | NA | NA | not_CpGpromo | MIR3 | SINE | MIR | 1 |
| rs4896104 | chr6.134797479.134798124 | ARR,HD | NR | not_CpGi | NA | NA | NA | not_CpGpromo | NA | NA | NA | NA |
| rs4932373 | chr15.90885954.90886257 | HD,CAD | LR_close | not_CpGi | NA | NA | NA | not_CpGpromo | MIR,MER58A | SINE,DNA | MIR,hAT-Charlie | 1;0.0588235294117647 |
| rs494207 | chr10.44245450.44245918 | HD,CAD | NR | not_CpGi | NA | NA | NA | not_CpGpromo | L1MB2 | LINE | L1 | 0.566343042071197 |
| rs4951261 | chr1.205748526.205750556 | ARR,HD | NR | CpGi | CpG: 100 | 1 | NA | not_CpGpromo | NA | NA | NA | NA |
| rs4977575 | chr9.22124697.22124840 | HD,CAD | not_mrc | not_CpGi | NA | NA | NA | not_CpGpromo | MARNA | DNA | TcMar-Mariner | 0.0555555555555556 |
| rs4999127 | chr1.154741375.154741854 | ARR,HD | NR | not_CpGi | NA | NA | NA | not_CpGpromo | NA | NA | NA | NA |
| rs518594 | chr10.44261009.44262169 | HD,CAD | ESR_close | not_CpGi | NA | NA | NA | not_CpGpromo | NA | NA | NA | NA |
| rs523297 | chr10.44261009.44262169 | HD,CAD | ESR_close | not_CpGi | NA | NA | NA | not_CpGpromo | NA | NA | NA | NA |
| rs534128177 | chr11.90455310.90455981 | HD,CAD | NR | not_CpGi | NA | NA | NA | not_CpGpromo | L1PA16,LTR14B | LINE,LTR | L1,ERVK | 0.0403825717321998;1;0.10625 |
| rs55734480 | chr7.14331921.14332483 | ARR,HD | NR | not_CpGi | NA | NA | NA | not_CpGpromo | (GTTT)n,MIR,MER113 | Simple_repeat,SINE,DNA | Simple_repeat,MIR,hAT-Charlie | 1;0.00966183574879227 |
| rs56210063 | chr11.8767540.8768078 | HD,CAD | NR | not_CpGi | NA | NA | NA | not_CpGpromo | L2a,L3 | LINE | L2,CR1 | 0.422077922077922;1 |
| rs56281979 | chr3.14232390.14233136 | HD,HF | LR_close | not_CpGi | NA | NA | NA | not_CpGpromo | MIR3,L3,AluSz6 | SINE,LINE | MIR,CR1,Alu | 0.72;1;0.130281690140845 |
| rs56336142 | chr6.39166177.39166915 | HD,CAD | NR | not_CpGi | NA | NA | NA | not_CpGpromo | MIRc | SINE | MIR | 1 |
| rs564427867 | chr1.55039222.55040233 | HD,CAD | NR | CpGi | CpG: 85 | 0.88586387434555 | EH38E1349458,EH38E1349459 | CpGpromo | (GCT)n,MIR3 | Simple_repeat,SINE | Simple_repeat,MIR | 1 |
| rs57346421 | chr21.14118943.14119390 | HD,HF | NR | not_CpGi | NA | NA | NA | not_CpGpromo | HERV1_I-int | LTR | ERV1 | 0.0510483135824977 |
| rs582384 | chr2.45668749.45669787 | HD,CAD | LR_open | not_CpGi | NA | NA | NA | not_CpGpromo | MIRc,L1M5,AluSx1 | SINE,LINE | MIR,L1,Alu | 0.260869565217391;1;0.196013289036545 |
| rs585967 | chr2.21047256.21047719 | HD,CAD | NR | not_CpGi | NA | NA | NA | not_CpGpromo | (CA)n | Simple_repeat | Simple_repeat | 1 |
| rs5867305 | chr5.36156365.36157193 | HD,CAD | EAR_open | not_CpGi | NA | NA | NA | not_CpGpromo | MER5A,MER112 | DNA | hAT-Charlie | 1 |
| rs587606498 | chr1.121213617.121213779 | HD,HF | not_mrc | not_CpGi | NA | NA | NA | not_CpGpromo | NA | NA | NA | NA |
| rs588136 | chr15.58437614.58438322 | HD,CAD | not_mrc | not_CpGi | NA | NA | NA | not_CpGpromo | NA | NA | NA | NA |
| rs590121 | chr11.75561990.75564409 | HD,CAD | NR | CpGi | CpG: 53 | 0.873873873873874 | EH38E1553275 | CpGpromo | G-rich | Low_complexity | Low_complexity | 1 |
| rs60280851 | chr15.68666479.68666914 | HD | not_mrc | not_CpGi | NA | NA | NA | not_CpGpromo | 5S | rRNA | rRNA | 1 |
| rs604723 | chr11.100739719.100740030 | HD,CAD | NR | not_CpGi | NA | NA | NA | not_CpGpromo | NA | NA | NA | NA |
| rs62042066 | chr16.86664502.86665119 | HD,MI | LR_open | not_CpGi | NA | NA | NA | not_CpGpromo | AmnSINE1,LTR16A2 | SINE,LTR | 5S-Deu-L2,ERVL | 1 |
| rs62139062 | chr2.65271531.65272160 | HD | NR | not_CpGi | NA | NA | NA | not_CpGpromo | AluSp | SINE | Alu | 0.385665529010239 |
| rs62232870 | chr3.14216199.14216968 | HD | NR | not_CpGi | NA | NA | NA | not_CpGpromo | MLT1K,MER117,MIRb | LTR,DNA,SINE | ERVL-MaLR,hAT-Charlie,MIR | 0.767313019390582;1;0.248587570621469 |
| rs62471956 | chr7.99822872.99823551 | HD,CAD | LR_close | not_CpGi | NA | NA | NA | not_CpGpromo | MER52A | LTR | ERV1 | 0.416922133660331 |
| rs62568141 | chr9.77011996.77012519 | HD,CAD | NR | not_CpGi | NA | NA | NA | not_CpGpromo | NA | NA | NA | NA |
| rs629301 | chr1.109274953.109276202 | ARR,HD,HF,CAD | LR_open | not_CpGi | NA | NA | NA | not_CpGpromo | (TCCTC)n | Simple_repeat | Simple_repeat | 1 |
| rs6426551 | chr1.226353539.226354600 | HD,CAD | NR | not_CpGi | NA | NA | NA | not_CpGpromo | LTR78,Charlie4z,MLT1L | LTR,DNA | ERV1,hAT-Charlie,ERVL-MaLR | 0.652284263959391;1;0.0392156862745098 |
| rs646776 | chr1.109274953.109276202 | HD,CAD,MI | LR_open | not_CpGi | NA | NA | NA | not_CpGpromo | (TCCTC)n | Simple_repeat | Simple_repeat | 1 |
| rs653178 | chr12.111569574.111570394 | HD,MI | NR | not_CpGi | NA | NA | NA | not_CpGpromo | AluJb,(CAC)n,MER3,L3,L1MC5 | SINE,Simple_repeat,DNA,LINE | Alu,Simple_repeat,hAT-Charlie,CR1,L1 | 0.534798534798535;1;0.768707482993197 |
| rs6542647 | chr2.4898614.4899128 | HD | NR | not_CpGi | NA | NA | NA | not_CpGpromo | L1PB3,MER113B | LINE,DNA | L1,hAT-Charlie | 0.0321543408360129;1 |
| rs6546620 | chr2.25936965.25937466 | ARR,HD | NR | not_CpGi | NA | NA | NA | not_CpGpromo | MIRb,(GGCAGT)n | SINE,Simple_repeat | MIR,Simple_repeat | 0.691176470588235;0.0487804878048781 |
| rs6597292 | chr6.7974642.7975583 | HD,CAD | NR | not_CpGi | NA | NA | NA | not_CpGpromo | NA | NA | NA | NA |
| rs6598541 | chr15.98727491.98728563 | ARR,HD | NR | not_CpGi | NA | NA | NA | not_CpGpromo | (T)n,LTR12F | Simple_repeat,LTR | Simple_repeat,ERV1 | 1 |
| rs660240 | chr1.109274953.109276202 | HD,HF,CAD | LR_open | not_CpGi | NA | NA | NA | not_CpGpromo | (TCCTC)n | Simple_repeat | Simple_repeat | 1 |
| rs667920 | chr3.136350085.136351911 | HD,CAD | NR | not_CpGi | NA | NA | NA | not_CpGpromo | AluSz,L1M4b,L1MA9,L1M4a2 | SINE,LINE | Alu,L1 | 0.25;1;0.300291545189504 |
| rs6702619 | chr1.99580395.99580980 | HD | LR_open | not_CpGi | NA | NA | NA | not_CpGpromo | NA | NA | NA | NA |
| rs672149 | chr11.128759383.128760154 | HD | NR | not_CpGi | NA | NA | NA | not_CpGpromo | L2 | LINE | L2 | 0.927433628318584 |
| rs6730157 | chr2.135149084.135149706 | ARR,HD,CAD | NR | not_CpGi | NA | NA | NA | not_CpGpromo | MIR,AluY | SINE | MIR,Alu | 1;0.152542372881356 |
| rs6759518 | chr2.27262237.27263756 | ARR,HD,HF,CAD | NR | CpGi | CpG: 257 | 0.479192938209332 | EH38E1982668 | CpGpromo | MIRc | SINE | MIR | 0.84297520661157 |
| rs6801957 | chr3.38725644.38726351 | ARR,HD | LR_close | not_CpGi | NA | NA | NA | not_CpGpromo | MIRb | SINE | MIR | 0.15668202764977 |
| rs6807275 | chr3.14232390.14233136 | HD | LR_close | not_CpGi | NA | NA | NA | not_CpGpromo | MIR3,L3,AluSz6 | SINE,LINE | MIR,CR1,Alu | 0.72;1;0.130281690140845 |
| rs6909752 | chr6.22612314.22612576 | HD,CAD | NR | not_CpGi | NA | NA | NA | not_CpGpromo | NA | NA | NA | NA |
| rs6982502 | chr8.125466567.125467336 | HD,CAD | NR | not_CpGi | NA | NA | NA | not_CpGpromo | NA | NA | NA | NA |
| rs7090277 | chr10.12234804.12236216 | HD,CAD | NR | not_CpGi | NA | NA | NA | not_CpGpromo | AluSp,MER117 | SINE,DNA | Alu,hAT-Charlie | 0.678787878787879;1 |
| rs7115242 | chr11.117037235.117037719 | ARR,HD,HF,CAD | LR_open | not_CpGi | NA | NA | NA | not_CpGpromo | NA | NA | NA | NA |
| rs7157599 | chr14.100158874.100160055 | ARR,HD | NR | CpGi | CpG: 131 | 0.939579684763573 | EH38E1742143 | CpGpromo | G-rich | Low_complexity | Low_complexity | 1 |
| rs7165042 | chr15.78830933.78832028 | HD,CAD,MI | LR_open | CpGi | CpG: 122 | 0.692356285533797 | NA | not_CpGpromo | NA | NA | NA | NA |
| rs7165081 | chr15.78830933.78832028 | HD,CAD | LR_open | CpGi | CpG: 122 | 0.692356285533797 | NA | not_CpGpromo | NA | NA | NA | NA |
| rs7165733 | chr15.78830933.78832028 | HD,CAD | LR_open | CpGi | CpG: 122 | 0.692356285533797 | NA | not_CpGpromo | NA | NA | NA | NA |
| rs7166764 | chr15.78830933.78832028 | HD,CAD | LR_open | CpGi | CpG: 122 | 0.692356285533797 | NA | not_CpGpromo | NA | NA | NA | NA |
| rs7172038 | chr15.73374622.73375198 | ARR,HD | ESR_close | not_CpGi | NA | NA | NA | not_CpGpromo | NA | NA | NA | NA |
| rs7178084 | chr15.73375634.73376745 | ARR,HD | NR | not_CpGi | NA | NA | NA | not_CpGpromo | L2c,(CAAGCCC)n | LINE,Simple_repeat | L2,Simple_repeat | 1 |
| rs7181432 | chr15.78830933.78832028 | HD,CAD | LR_open | CpGi | CpG: 122 | 0.692356285533797 | NA | not_CpGpromo | NA | NA | NA | NA |
| rs7182103 | chr15.78830933.78832028 | HD,CAD | LR_open | CpGi | CpG: 122 | 0.692356285533797 | NA | not_CpGpromo | NA | NA | NA | NA |
| rs7182529 | chr15.78830933.78832028 | HD,CAD | LR_open | CpGi | CpG: 122 | 0.692356285533797 | NA | not_CpGpromo | NA | NA | NA | NA |
| rs7182716 | chr15.78830933.78832028 | HD,CAD | LR_open | CpGi | CpG: 122 | 0.692356285533797 | NA | not_CpGpromo | NA | NA | NA | NA |
| rs7183206 | chr15.73375634.73376745 | ARR,HD | NR | not_CpGi | NA | NA | NA | not_CpGpromo | L2c,(CAAGCCC)n | LINE,Simple_repeat | L2,Simple_repeat | 1 |
| rs7189462 | chr16.81873989.81874357 | HD,CAD | NR | not_CpGi | NA | NA | NA | not_CpGpromo | MER102a | DNA | hAT-Charlie | 1 |
| rs7197197 | chr16.72877300.72877905 | ARR,HD | LR_open | not_CpGi | NA | NA | NA | not_CpGpromo | (TGT)n | Simple_repeat | Simple_repeat | 1 |
| rs7234864 | chr18.60067561.60068151 | HD,HF | LR_open | not_CpGi | NA | NA | NA | not_CpGpromo | L2c | LINE | L2 | 0.0103092783505155 |
| rs7246865 | chr19.17107804.17108454 | HD,CAD | NR | not_CpGi | NA | NA | NA | not_CpGpromo | MLT1C,MER20 | LTR,DNA | ERVL-MaLR,hAT-Charlie | 0.321867321867322;0.541666666666667 |
| rs72654473 | chr19.44911105.44911471 | HD,CAD | ESR_close | not_CpGi | NA | NA | NA | not_CpGpromo | MIRc | SINE | MIR | 0.393939393939394 |
| rs72658867 | chr19.11119936.11120563 | HD,CAD | NR | not_CpGi | NA | NA | NA | not_CpGpromo | AluSq,(AAAC)n | SINE,Simple_repeat | Alu,Simple_repeat | 0.135231316725979;1 |
| rs72664335 | chr1.56521199.56521723 | HD,CAD | LR_open | not_CpGi | NA | NA | NA | not_CpGpromo | AluSz6,(TG)n,FLAM_C,(CTCC)n | SINE,Simple_repeat | Alu,Simple_repeat | 0.205787781350482;1;0.219178082191781 |
| rs72671655 | chr8.105335411.105336052 | HD | NR | not_CpGi | NA | NA | NA | not_CpGpromo | NA | NA | NA | NA |
| rs72700114 | chr1.170224576.170224916 | ARR,HD | LR_close | not_CpGi | NA | NA | NA | not_CpGpromo | MER53,MIRb,L1MA7 | DNA,SINE,LINE | hAT,MIR,L1 | 0.0173913043478261;1;0.288571428571429 |
| rs72926475 | chr2.86367009.86367615 | ARR,HD | ESR_close | not_CpGi | NA | NA | NA | not_CpGpromo | MIR | SINE | MIR | 0.407608695652174;1 |
| rs72935945 | chr6.110334421.110335161 | HD,CAD | ESR_open | not_CpGi | NA | NA | NA | not_CpGpromo | NA | NA | NA | NA |
| rs729743 | chr17.80795708.80796334 | HD,CAD | ESR_close | not_CpGi | NA | NA | NA | not_CpGpromo | THE1D,MLT2A2 | LTR | ERVL-MaLR,ERVL | 1 |
| rs73045269 | chr19.41318885.41319481 | HD,CAD | ESR_open | not_CpGi | NA | NA | NA | not_CpGpromo | NA | NA | NA | NA |
| rs73102285 | chr5.52859657.52860199 | HD,CAD | NR | not_CpGi | NA | NA | NA | not_CpGpromo | L3 | LINE | CR1 | 0.763713080168776 |
| rs73123536 | chr4.22630084.22630437 | HD,HF | not_mrc | not_CpGi | NA | NA | NA | not_CpGpromo | MIRc | SINE | MIR | 0.32258064516129 |
| rs73193808 | chr21.29162621.29163485 | HD,CAD | NR | not_CpGi | NA | NA | NA | not_CpGpromo | AluSq2,AluSz6 | SINE | Alu | 0.263333333333333;1 |
| rs7333991 | chr13.110455785.110456535 | HD,CAD | NR | not_CpGi | NA | NA | NA | not_CpGpromo | NA | NA | NA | NA |
| rs733701 | chr6.39203639.39204133 | HD,CAD | NR | not_CpGi | NA | NA | NA | not_CpGpromo | MER5B | DNA | hAT-Charlie | 1 |
| rs7403708 | chr15.78830933.78832028 | HD,CAD | LR_open | CpGi | CpG: 122 | 0.692356285533797 | NA | not_CpGpromo | NA | NA | NA | NA |
| rs74181299 | chr2.65055695.65057220 | ARR,HD | NR | CpGi | CpG: 132 | 1 | EH38E2004398 | CpGpromo | NA | NA | NA | NA |
| rs7433206 | chr3.38615932.38616880 | HD | LR_close | not_CpGi | NA | NA | NA | not_CpGpromo | NA | NA | NA | NA |
| rs7440763 | chr4.155512047.155512545 | HD,CAD | LR_close | not_CpGi | NA | NA | NA | not_CpGpromo | Charlie4z | DNA | hAT-Charlie | 0.42483660130719 |
| rs7486169 | chr12.74338024.74338393 | HD | LR_open | not_CpGi | NA | NA | NA | not_CpGpromo | NA | NA | NA | NA |
| rs75112503 | chr11.110366109.110367343 | HD,MI | NR | not_CpGi | NA | NA | NA | not_CpGpromo | AluY,L1MB3,L2b,AluSx | SINE,LINE | Alu,L1,L2 | 0.277227722772277;1;0.598425196850394 |
| rs75190942 | chr11.128894447.128895096 | ARR,HD | NR | not_CpGi | NA | NA | NA | not_CpGpromo | NA | NA | NA | NA |
| rs7529220 | chr1.21955557.21956277 | ARR,HD | NR | not_CpGi | NA | NA | NA | not_CpGpromo | MIRb | SINE | MIR | 1 |
| rs75524776 | chr12.109538192.109538640 | HD,CAD | LR_close | not_CpGi | NA | NA | NA | not_CpGpromo | MIRb | SINE | MIR | 1 |
| rs7568458 | chr2.85560977.85561973 | HD,CAD | NR | CpGi | CpG: 37 | 1 | EH38E2013886 | CpGpromo | AluJr | SINE | Alu | 0.0138888888888889 |
| rs7580831 | chr2.237310830.237311051 | HD,CAD | LR_open | not_CpGi | NA | NA | NA | not_CpGpromo | NA | NA | NA | NA |
| rs759098931 | chr14.99644968.99645471 | HD,CAD | NR | CpGi | CpG: 93 | 0.641221374045801 | EH38E1741629,EH38E1741630 | CpGpromo | NA | NA | NA | NA |
| rs7604403 | chr2.111897773.111899676 | HD,CAD | NR | CpGi | CpG: 137 | 1 | EH38E2024982 | CpGpromo | AluSc | SINE | Alu | 0.533783783783784 |
| rs76064792 | chr16.719886.721785 | HD,HF | LR_close | CpGi | CpG: 169 | 0.757477243172952 | EH38E1795024,EH38E1795025 | CpGpromo | (GCAGG)n | Simple_repeat | Simple_repeat | 1 |
| rs76097649 | chr11.128894447.128895096 | ARR,HD | NR | not_CpGi | NA | NA | NA | not_CpGpromo | NA | NA | NA | NA |
| rs7612445 | chr3.179454943.179455262 | ARR,HD | NR | not_CpGi | NA | NA | NA | not_CpGpromo | NA | NA | NA | NA |
| rs7617480 | chr3.49173142.49174143 | HD,HF | ESR_close | not_CpGi | NA | NA | NA | not_CpGpromo | (CCATCT)n | Simple_repeat | Simple_repeat | 1 |
| rs7617773 | chr3.48151277.48152429 | HD,CAD | LR_close | not_CpGi | NA | NA | NA | not_CpGpromo | MamTip1 | DNA | hAT-Tip100 | 1 |
| rs7632505 | chr3.123019226.123019547 | ARR,HD,HF,CAD | NR | not_CpGi | NA | NA | NA | not_CpGpromo | MIR,AluJb | SINE | MIR,Alu | 0.771929824561403;0.829787234042553 |
| rs7633770 | chr3.46646587.46647198 | HD,CAD | LR_open | not_CpGi | NA | NA | NA | not_CpGpromo | MER74A | LTR | ERVL | 0.641025641025641 |
| rs76600480 | chr7.128909544.128910271 | HD | NR | not_CpGi | NA | NA | NA | not_CpGpromo | L2 | LINE | L2 | 0.1875 |
| rs7690530 | chr4.40629425.40630609 | HD,CAD | NR | CpGi | CpG: 66 | 1 | EH38E2292822 | CpGpromo | G-rich | Low_complexity | Low_complexity | 1 |
| rs7696431 | chr4.168766280.168767270 | HD,CAD | LR_open | not_CpGi | NA | NA | NA | not_CpGpromo | MER41A,L3,MIRc | LTR,LINE,SINE | ERV1,CR1,MIR | 0.842105263157895;1;0.883018867924528 |
| rs77316573 | chr16.2214289.2215681 | ARR,HD | LR_close | CpGi | CpG: 162 | 0.75131926121372 | NA | not_CpGpromo | (CCG)n,L1ME3,AluY | Simple_repeat,LINE,SINE | Simple_repeat,L1,Alu | 1;0.205787781350482 |
| rs7873551 | chr9.116482574.116483181 | HD,CAD | LR_close | not_CpGi | NA | NA | NA | not_CpGpromo | NA | NA | NA | NA |
| rs7910227 | chr10.20953148.20953475 | ARR,HD | LR_close | not_CpGi | NA | NA | NA | not_CpGpromo | MLT1B | LTR | ERVL-MaLR | 0.824120603015075 |
| rs7947761 | chr11.100753128.100753902 | HD,CAD | NR | not_CpGi | NA | NA | NA | not_CpGpromo | L1PBa | LINE | L1 | 0.395206527281999 |
| rs79661299 | chr6.42087754.42088697 | HD,HF | NR | not_CpGi | NA | NA | NA | not_CpGpromo | MIRb,AluSc | SINE | MIR,Alu | 0.706666666666667;1 |
| rs79717953 | chr6.73694726.73695115 | HD,CAD,MI | EAR_open | not_CpGi | NA | NA | NA | not_CpGpromo | MER5A1 | DNA | hAT-Charlie | 0.264367816091954 |
| rs7977247 | chr12.106865628.106866040 | HD,HF | LR_close | not_CpGi | NA | NA | NA | not_CpGpromo | L2a | LINE | L2 | 0.568870523415978 |
| rs79825511 | chr11.69700398.69700987 | HD | ESR_close | not_CpGi | NA | NA | NA | not_CpGpromo | MER113B,(CCAGG)n | DNA,Simple_repeat | hAT-Charlie,Simple_repeat | 0.713235294117647;1 |
| rs8003602 | chr14.99682572.99684938 | HD,CAD | NR | CpGi | CpG: 127 | 1 | EH38E1741669,EH38E1741670 | CpGpromo | MER50,MamGypLTR3,MamGypLTR2b,(CCCGG)n,G-rich,MIR | LTR,Simple_repeat,Low_complexity,SINE | ERV1,Gypsy,Simple_repeat,Low_complexity,MIR | 0.0142857142857143;1 |
| rs8096658 | chr18.79396485.79396813 | ARR,HD | NR | CpGi | CpG: 544 | 0.0474336793540946 | NA | not_CpGpromo | NA | NA | NA | NA |
| rs869396 | chr4.168766280.168767270 | HD,CAD | LR_open | not_CpGi | NA | NA | NA | not_CpGpromo | MER41A,L3,MIRc | LTR,LINE,SINE | ERV1,CR1,MIR | 0.842105263157895;1;0.883018867924528 |
| rs880315 | chr1.10736684.10737808 | ARR,HD | ESR_close | not_CpGi | NA | NA | NA | not_CpGpromo | L2c | LINE | L2 | 0.931034482758621;1 |
| rs894211 | chr8.20007264.20008372 | HD,CAD | NR | not_CpGi | NA | NA | NA | not_CpGpromo | LTR32,MER34A,LTR48 | LTR | ERVL,ERV1 | 0.875294117647059;1 |
| rs899162 | chr5.135458929.135459424 | HD,CAD | NR | not_CpGi | NA | NA | NA | not_CpGpromo | L2c | LINE | L2 | 1 |
| rs899997 | chr15.78726891.78727425 | HD,CAD | ESR_close | not_CpGi | NA | NA | NA | not_CpGpromo | NA | NA | NA | NA |
| rs9388813 | chr6.130602114.130602839 | HD,CAD | NR | not_CpGi | NA | NA | NA | not_CpGpromo | MamSINE1 | SINE | tRNA-RTE | 1 |
| rs944172 | chr9.107755276.107755816 | HD,CAD | LR_open | not_CpGi | NA | NA | NA | not_CpGpromo | Charlie13a,MLT2C1 | DNA,LTR | hAT-Charlie,ERVL | 0.71658615136876;0.307420494699647 |
| rs9469890 | chr6.34796116.34796383 | HD,CAD | NR | not_CpGi | NA | NA | NA | not_CpGpromo | L2a | LINE | L2 | 0.528089887640449 |
| rs9506925 | chr13.22794559.22794879 | ARR,HD | NR | not_CpGi | NA | NA | NA | not_CpGpromo | OldhAT1 | DNA | hAT-Ac | 1 |
| rs9556903 | chr13.98207008.98208056 | HD,CAD | LR_close | not_CpGi | NA | NA | NA | not_CpGpromo | (CA)n | Simple_repeat | Simple_repeat | 1 |
| rs965652 | chr6.134047673.134047938 | HD,CAD | NR | not_CpGi | NA | NA | NA | not_CpGpromo | MamRep1894 | DNA | hAT | 1 |
| rs9899183 | chr17.7548665.7550717 | ARR,HD | NR | CpGi | CpG: 50 | 1 | EH38E1844469 | CpGpromo | MER21A,G-rich,MIRc,MER94 | LTR,Low_complexity,SINE,DNA | ERVL,Low_complexity,MIR,hAT-Blackjack | 0.748815165876777;1 |
| rs9906944 | chr17.49012959.49014932 | HD,CAD | NR | CpGi | CpG: 48,CpG: 18 | 1 | EH38E1868609 | CpGpromo | MIRc | SINE | MIR | 1 |
| rs9912587 | chr17.43021036.43021565 | HD,CAD | NR | not_CpGi | NA | NA | NA | not_CpGpromo | NA | NA | NA | NA |
Peak annotation file
sessionInfo()R version 4.4.1 (2024-06-14 ucrt)
Platform: x86_64-w64-mingw32/x64
Running under: Windows 10 x64 (build 19045)
Matrix products: default
locale:
[1] LC_COLLATE=English_United States.utf8
[2] LC_CTYPE=English_United States.utf8
[3] LC_MONETARY=English_United States.utf8
[4] LC_NUMERIC=C
[5] LC_TIME=English_United States.utf8
time zone: America/Chicago
tzcode source: internal
attached base packages:
[1] grid stats4 stats graphics grDevices utils datasets
[8] methods base
other attached packages:
[1] ggrepel_0.9.5
[2] plyranges_1.24.0
[3] ggsignif_0.6.4
[4] genomation_1.36.0
[5] smplot2_0.2.4
[6] eulerr_7.0.2
[7] biomaRt_2.60.1
[8] devtools_2.4.5
[9] usethis_3.0.0
[10] ggpubr_0.6.0
[11] BiocParallel_1.38.0
[12] scales_1.3.0
[13] VennDiagram_1.7.3
[14] futile.logger_1.4.3
[15] gridExtra_2.3
[16] ggfortify_0.4.17
[17] edgeR_4.2.1
[18] limma_3.60.4
[19] rtracklayer_1.64.0
[20] org.Hs.eg.db_3.19.1
[21] TxDb.Hsapiens.UCSC.hg38.knownGene_3.18.0
[22] GenomicFeatures_1.56.0
[23] AnnotationDbi_1.66.0
[24] Biobase_2.64.0
[25] GenomicRanges_1.56.1
[26] GenomeInfoDb_1.40.1
[27] IRanges_2.38.1
[28] S4Vectors_0.42.1
[29] BiocGenerics_0.50.0
[30] ChIPseeker_1.40.0
[31] RColorBrewer_1.1-3
[32] broom_1.0.6
[33] kableExtra_1.4.0
[34] lubridate_1.9.3
[35] forcats_1.0.0
[36] stringr_1.5.1
[37] dplyr_1.1.4
[38] purrr_1.0.2
[39] readr_2.1.5
[40] tidyr_1.3.1
[41] tibble_3.2.1
[42] ggplot2_3.5.1
[43] tidyverse_2.0.0
[44] workflowr_1.7.1
loaded via a namespace (and not attached):
[1] fs_1.6.4
[2] matrixStats_1.3.0
[3] bitops_1.0-8
[4] enrichplot_1.24.2
[5] HDO.db_0.99.1
[6] httr_1.4.7
[7] profvis_0.3.8
[8] tools_4.4.1
[9] backports_1.5.0
[10] utf8_1.2.4
[11] R6_2.5.1
[12] lazyeval_0.2.2
[13] urlchecker_1.0.1
[14] withr_3.0.1
[15] prettyunits_1.2.0
[16] cli_3.6.3
[17] formatR_1.14
[18] scatterpie_0.2.3
[19] labeling_0.4.3
[20] sass_0.4.9
[21] Rsamtools_2.20.0
[22] systemfonts_1.1.0
[23] yulab.utils_0.1.5
[24] foreign_0.8-87
[25] DOSE_3.30.2
[26] svglite_2.1.3
[27] sessioninfo_1.2.2
[28] plotrix_3.8-4
[29] BSgenome_1.72.0
[30] pwr_1.3-0
[31] impute_1.78.0
[32] rstudioapi_0.16.0
[33] RSQLite_2.3.7
[34] generics_0.1.3
[35] gridGraphics_0.5-1
[36] TxDb.Hsapiens.UCSC.hg19.knownGene_3.2.2
[37] BiocIO_1.14.0
[38] vroom_1.6.5
[39] gtools_3.9.5
[40] car_3.1-2
[41] GO.db_3.19.1
[42] Matrix_1.7-0
[43] fansi_1.0.6
[44] abind_1.4-5
[45] lifecycle_1.0.4
[46] whisker_0.4.1
[47] yaml_2.3.10
[48] carData_3.0-5
[49] SummarizedExperiment_1.34.0
[50] BiocFileCache_2.12.0
[51] gplots_3.1.3.1
[52] qvalue_2.36.0
[53] SparseArray_1.4.8
[54] blob_1.2.4
[55] promises_1.3.0
[56] crayon_1.5.3
[57] miniUI_0.1.1.1
[58] lattice_0.22-6
[59] cowplot_1.1.3
[60] KEGGREST_1.44.1
[61] pillar_1.9.0
[62] knitr_1.48
[63] fgsea_1.30.0
[64] rjson_0.2.21
[65] boot_1.3-30
[66] codetools_0.2-20
[67] fastmatch_1.1-4
[68] glue_1.7.0
[69] getPass_0.2-4
[70] ggfun_0.1.5
[71] data.table_1.15.4
[72] remotes_2.5.0
[73] vctrs_0.6.5
[74] png_0.1-8
[75] treeio_1.28.0
[76] gtable_0.3.5
[77] cachem_1.1.0
[78] xfun_0.46
[79] S4Arrays_1.4.1
[80] mime_0.12
[81] tidygraph_1.3.1
[82] statmod_1.5.0
[83] ellipsis_0.3.2
[84] nlme_3.1-165
[85] ggtree_3.12.0
[86] bit64_4.0.5
[87] filelock_1.0.3
[88] progress_1.2.3
[89] rprojroot_2.0.4
[90] bslib_0.8.0
[91] rpart_4.1.23
[92] KernSmooth_2.23-24
[93] Hmisc_5.1-3
[94] colorspace_2.1-1
[95] DBI_1.2.3
[96] seqPattern_1.36.0
[97] nnet_7.3-19
[98] tidyselect_1.2.1
[99] processx_3.8.4
[100] bit_4.0.5
[101] compiler_4.4.1
[102] curl_5.2.1
[103] git2r_0.33.0
[104] httr2_1.0.2
[105] htmlTable_2.4.3
[106] xml2_1.3.6
[107] DelayedArray_0.30.1
[108] shadowtext_0.1.4
[109] checkmate_2.3.2
[110] caTools_1.18.2
[111] callr_3.7.6
[112] rappdirs_0.3.3
[113] digest_0.6.36
[114] rmarkdown_2.27
[115] XVector_0.44.0
[116] base64enc_0.1-3
[117] htmltools_0.5.8.1
[118] pkgconfig_2.0.3
[119] MatrixGenerics_1.16.0
[120] highr_0.11
[121] dbplyr_2.5.0
[122] fastmap_1.2.0
[123] rlang_1.1.4
[124] htmlwidgets_1.6.4
[125] UCSC.utils_1.0.0
[126] shiny_1.9.1
[127] farver_2.1.2
[128] jquerylib_0.1.4
[129] zoo_1.8-12
[130] jsonlite_1.8.8
[131] GOSemSim_2.30.0
[132] RCurl_1.98-1.16
[133] magrittr_2.0.3
[134] Formula_1.2-5
[135] GenomeInfoDbData_1.2.12
[136] ggplotify_0.1.2
[137] patchwork_1.2.0
[138] munsell_0.5.1
[139] Rcpp_1.0.13
[140] ape_5.8
[141] viridis_0.6.5
[142] stringi_1.8.4
[143] ggraph_2.2.1
[144] zlibbioc_1.50.0
[145] MASS_7.3-61
[146] plyr_1.8.9
[147] pkgbuild_1.4.4
[148] parallel_4.4.1
[149] Biostrings_2.72.1
[150] graphlayouts_1.1.1
[151] splines_4.4.1
[152] hms_1.1.3
[153] locfit_1.5-9.10
[154] ps_1.7.7
[155] igraph_2.0.3
[156] reshape2_1.4.4
[157] pkgload_1.4.0
[158] futile.options_1.0.1
[159] XML_3.99-0.17
[160] evaluate_0.24.0
[161] lambda.r_1.2.4
[162] tzdb_0.4.0
[163] tweenr_2.0.3
[164] httpuv_1.6.15
[165] polyclip_1.10-7
[166] gridBase_0.4-7
[167] ggforce_0.4.2
[168] xtable_1.8-4
[169] restfulr_0.0.15
[170] tidytree_0.4.6
[171] rstatix_0.7.2
[172] later_1.3.2
[173] viridisLite_0.4.2
[174] aplot_0.2.3
[175] memoise_2.0.1
[176] GenomicAlignments_1.40.0
[177] cluster_2.1.6
[178] timechange_0.3.0