Seoane_chromatin
ERM
2023-06-16
Last updated: 2023-06-16
Checks: 7 0
Knit directory: Cardiotoxicity/
This reproducible R Markdown analysis was created with workflowr (version 1.7.0). The Checks tab describes the reproducibility checks that were applied when the results were created. The Past versions tab lists the development history.
Great! Since the R Markdown file has been committed to the Git repository, you know the exact version of the code that produced these results.
Great job! The global environment was empty. Objects defined in the global environment can affect the analysis in your R Markdown file in unknown ways. For reproduciblity it’s best to always run the code in an empty environment.
The command set.seed(20230109) was run prior to running
the code in the R Markdown file. Setting a seed ensures that any results
that rely on randomness, e.g. subsampling or permutations, are
reproducible.
Great job! Recording the operating system, R version, and package versions is critical for reproducibility.
Nice! There were no cached chunks for this analysis, so you can be confident that you successfully produced the results during this run.
Great job! Using relative paths to the files within your workflowr project makes it easier to run your code on other machines.
Great! You are using Git for version control. Tracking code development and connecting the code version to the results is critical for reproducibility.
The results in this page were generated with repository version eab6c68. See the Past versions tab to see a history of the changes made to the R Markdown and HTML files.
Note that you need to be careful to ensure that all relevant files for
the analysis have been committed to Git prior to generating the results
(you can use wflow_publish or
wflow_git_commit). workflowr only checks the R Markdown
file, but you know if there are other scripts or data files that it
depends on. Below is the status of the Git repository when the results
were generated:
Ignored files:
    Ignored:    .RData
    Ignored:    .Rhistory
    Ignored:    .Rproj.user/
    Ignored:    data/41588_2018_171_MOESM3_ESMeQTL_ST2_for paper.csv
    Ignored:    data/Arr_GWAS.txt
    Ignored:    data/Arr_geneset.RDS
    Ignored:    data/BC_cell_lines.csv
    Ignored:    data/CADGWASgene_table.csv
    Ignored:    data/CAD_geneset.RDS
    Ignored:    data/Clamp_Summary.csv
    Ignored:    data/Cormotif_24_k1-5_raw.RDS
    Ignored:    data/DAgostres24.RDS
    Ignored:    data/DAtable1.csv
    Ignored:    data/DDEMresp_list.csv
    Ignored:    data/DDE_reQTL.txt
    Ignored:    data/DDEresp_list.csv
    Ignored:    data/DEG-GO/
    Ignored:    data/DEG_cormotif.RDS
    Ignored:    data/DF_Plate_Peak.csv
    Ignored:    data/DRC48hoursdata.csv
    Ignored:    data/Da24counts.txt
    Ignored:    data/Dx24counts.txt
    Ignored:    data/Dx_reQTL_specific.txt
    Ignored:    data/Ep24counts.txt
    Ignored:    data/GOIsig.csv
    Ignored:    data/GOplots.R
    Ignored:    data/GTEX_setsimple.csv
    Ignored:    data/GTEx_gene_list.csv
    Ignored:    data/HFGWASgene_table.csv
    Ignored:    data/HF_geneset.RDS
    Ignored:    data/Heart_Left_Ventricle.v8.egenes.txt
    Ignored:    data/Hf_GWAS.txt
    Ignored:    data/K_cluster
    Ignored:    data/K_cluster_kisthree.csv
    Ignored:    data/K_cluster_kistwo.csv
    Ignored:    data/LDH48hoursdata.csv
    Ignored:    data/Mt24counts.txt
    Ignored:    data/RINsamplelist.txt
    Ignored:    data/Seonane2019supp1.txt
    Ignored:    data/TOP2Bi-24hoursGO_analysis.csv
    Ignored:    data/TR24counts.txt
    Ignored:    data/Top2biresp_cluster24h.csv
    Ignored:    data/Viabilitylistfull.csv
    Ignored:    data/allexpressedgenes.txt
    Ignored:    data/allgenes.txt
    Ignored:    data/allmatrix.RDS
    Ignored:    data/avgLD50.RDS
    Ignored:    data/backGL.txt
    Ignored:    data/cormotif_3hk1-8.RDS
    Ignored:    data/cormotif_initalK5.RDS
    Ignored:    data/cormotif_initialK5.RDS
    Ignored:    data/cormotif_initialall.RDS
    Ignored:    data/counts24hours.RDS
    Ignored:    data/cpmcount.RDS
    Ignored:    data/cpmnorm_counts.csv
    Ignored:    data/crispr_genes.csv
    Ignored:    data/cvd_GWAS.txt
    Ignored:    data/dat_cpm.RDS
    Ignored:    data/data_outline.txt
    Ignored:    data/efit2.RDS
    Ignored:    data/efit2results.RDS
    Ignored:    data/ensembl_backup.RDS
    Ignored:    data/ensgtotal.txt
    Ignored:    data/filenameonly.txt
    Ignored:    data/filtered_cpm_counts.csv
    Ignored:    data/filtered_raw_counts.csv
    Ignored:    data/filtermatrix_x.RDS
    Ignored:    data/folder_05top/
    Ignored:    data/geneDoxonlyQTL.csv
    Ignored:    data/gene_corr_frame.RDS
    Ignored:    data/gene_prob_tran3h.RDS
    Ignored:    data/gene_probabilityk5.RDS
    Ignored:    data/gostresTop2bi_ER.RDS
    Ignored:    data/gostresTop2bi_LR
    Ignored:    data/gostresTop2bi_LR.RDS
    Ignored:    data/gostresTop2bi_TI.RDS
    Ignored:    data/gostrescoNR
    Ignored:    data/gtex/
    Ignored:    data/heartgenes.csv
    Ignored:    data/individualDRCfile.RDS
    Ignored:    data/individual_DRC48.RDS
    Ignored:    data/individual_LDH48.RDS
    Ignored:    data/knowfig4.csv
    Ignored:    data/knowfig5.csv
    Ignored:    data/mymatrix.RDS
    Ignored:    data/nonresponse_cluster24h.csv
    Ignored:    data/norm_LDH.csv
    Ignored:    data/norm_counts.csv
    Ignored:    data/old_sets/
    Ignored:    data/plan2plot.png
    Ignored:    data/raw_counts.csv
    Ignored:    data/response_cluster24h.csv
    Ignored:    data/sigVDA24.txt
    Ignored:    data/sigVDA3.txt
    Ignored:    data/sigVDX24.txt
    Ignored:    data/sigVDX3.txt
    Ignored:    data/sigVEP24.txt
    Ignored:    data/sigVEP3.txt
    Ignored:    data/sigVMT24.txt
    Ignored:    data/sigVMT3.txt
    Ignored:    data/sigVTR24.txt
    Ignored:    data/sigVTR3.txt
    Ignored:    data/siglist.RDS
    Ignored:    data/slope_table.csv
    Ignored:    data/table3a.omar
    Ignored:    data/toplistall.RDS
    Ignored:    data/tvl24hour.txt
    Ignored:    data/tvl24hourw.txt
    Ignored:    data/venn_code.R

Untracked files:
    Untracked:  .RDataTmp
    Untracked:  .RDataTmp1
    Untracked:  .RDataTmp2
    Untracked:  OmicNavigator_learn.R
    Untracked:  code/DRC_plotfigure1.png
    Untracked:  code/cpm_boxplot.R
    Untracked:  code/fig1plot.png
    Untracked:  code/figurelegeddrc.png
    Untracked:  cormotif_probability_genelist.csv
    Untracked:  individual-legenddark2.png
    Untracked:  installed_old.rda
    Untracked:  motif_ER.txt
    Untracked:  motif_LR.txt
    Untracked:  motif_NR.txt
    Untracked:  motif_TI.txt
    Untracked:  output/daplot.RDS
    Untracked:  output/dxplot.RDS
    Untracked:  output/epplot.RDS
    Untracked:  output/mtplot.RDS
    Untracked:  output/output-old/
    Untracked:  output/trplot.RDS
    Untracked:  output/veplot.RDS
    Untracked:  reneebasecode.R
Note that any generated files, e.g. HTML, png, CSS, etc., are not included in this status report because it is ok for generated content to have uncommitted changes.
These are the previous versions of the repository in which changes were
made to the R Markdown (analysis/Seoane_chrom.Rmd) and HTML
(docs/Seoane_chrom.html) files. If you’ve configured a
remote Git repository (see ?wflow_git_remote), click on the
hyperlinks in the table below to view the files as they were in that
past version.
| File | Version | Author | Date | Message |
|---|---|---|---|---|
| Rmd | eab6c68 | reneeisnowhere | 2023-06-16 | update on code moving |
| Rmd | 3d4ca64 | reneeisnowhere | 2023-06-16 | updates on Friday |
## R Markdown
library(ComplexHeatmap)
library(tidyverse)
library(ggsignif)
library(biomaRt)
library(RColorBrewer)
library(cowplot)
library(ggpubr)
library(scales)
library(sjmisc)
library(kableExtra)
library(broom)
library(ggstats)
##DEG list sig and not sig
toplistall <- read.csv("output/toplistall.csv", row.names = 1)
col_fun = circlize::colorRamp2(c(0, 2), c("white", "purple"))
col_fun1 = circlize::colorRamp2(c(-1, 3), c("white", "purple"))
col_fun5 = circlize::colorRamp2(c(0, 5), c("white", "purple"))
col_fun4= circlize::colorRamp2(c(-1, 4), c("white", "purple"))
toplist24hr <- toplistall %>%
mutate(id = as.factor(id)) %>%
mutate(time=factor(time, levels=c("3_hours","24_hours"))) %>%
filter(time=="24_hours")
toplist3hr <- toplistall %>%
mutate(id = as.factor(id)) %>%
mutate(time=factor(time, levels=c("3_hours","24_hours"))) %>%
filter(time=="3_hours")
siglist <- readRDS("data/siglist.RDS")
list2env(siglist,envir=.GlobalEnv)<environment: R_GlobalEnv>DEG_cormotif <- readRDS("data/DEG_cormotif.RDS")
list2env(DEG_cormotif,envir=.GlobalEnv)<environment: R_GlobalEnv>backGL <- read_csv("data/backGL.txt",
col_types = cols(...1 = col_skip()))
cpmcounts <- read.csv("data/filtered_cpm_counts.csv", row.names = 1)
##sup1()
chrom_reg_Seoane <- read_csv(file = "data/Seonane2019supp1.txt",col_types = cols(...1 = col_skip()))
Seoane_2019 <- chrom_reg_Seoane[,2]
names(Seoane_2019) <- "ENTREZID"
chrom_genes <- (unique(Seoane_2019$ENTREZID))
## sup4
backGL <- read.csv("data/backGL.txt", row.names =1)
drug_palNoVeh <- c("#8B006D","#DF707E","#F1B72B", "#3386DD","#707031")
drug_palc <- c("#8B006D","#DF707E","#F1B72B", "#3386DD","#707031","#41B333")Seoane 2019
Seoane, Jose Chromatin gene comparison: comes from supp data NAT. MED 2019 #### 24 hours in Pairwise with supplemental data 1
toplist24hr %>%
mutate(id = as.factor(id)) %>%
mutate(sigcount = if_else(adj.P.Val <0.05,'sig','notsig'))%>%
mutate(chrom=if_else(ENTREZID %in%chrom_genes,"y","no")) %>%
group_by(id,sigcount,chrom) %>%
summarize(chromcount=n()) %>%
pivot_wider(id_cols = c(id,sigcount), names_from=c(chrom), values_from=chromcount) %>%
mutate(chromprop=(y/(y+no)*100)) %>%
ggplot(., aes(x=id, y=chromprop)) +
geom_col()+
geom_text(aes(x=id, label = sprintf("%.2f",chromprop), vjust=-.2))+
#geom_text(aes(label = expression(paste0("number"~a,"out of",~b))))+
facet_wrap(~sigcount)+
ggtitle("non-significant and significant enrichment proportions of chromatin gene set ")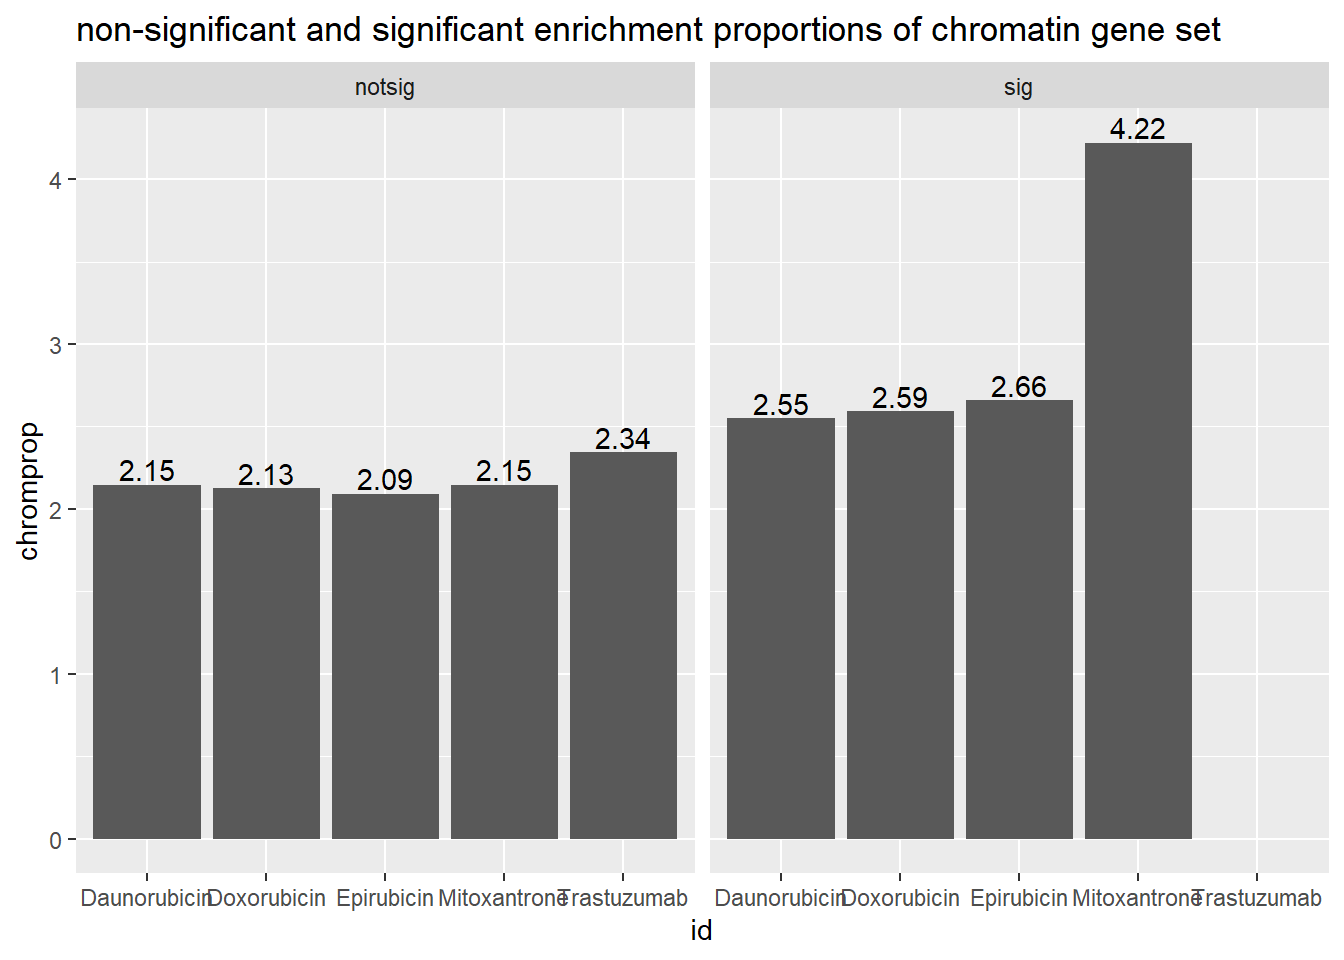
dataframchrom <- toplist24hr %>%
mutate(id = as.factor(id)) %>%
mutate(sigcount = if_else(adj.P.Val <0.05,'sig','notsig'))%>%
mutate(chrom=if_else(ENTREZID %in%chrom_genes,"y","no")) %>%
group_by(id,sigcount,chrom) %>%
summarize(chromcount=n()) %>%
as.data.frame()
dataframchrom %>%
pivot_wider(., names_from=c('sigcount','chrom'), values_from = 'chromcount') %>%
kable(., caption= "Significant (adj. P value of <0.05) and non-sig gene counts in Seoane geneset") %>%
kable_paper("striped", full_width = FALSE) %>%
kable_styling(full_width = FALSE, position = "left",bootstrap_options = c("striped"),font_size = 18) %>%
scroll_box(width = "60%", height = "400px")| id | notsig_no | notsig_y | sig_no | sig_y |
|---|---|---|---|---|
| Daunorubicin | 7065 | 155 | 6689 | 175 |
| Doxorubicin | 7407 | 161 | 6347 | 169 |
| Epirubicin | 7717 | 165 | 6037 | 165 |
| Mitoxantrone | 12483 | 274 | 1271 | 56 |
| Trastuzumab | 13754 | 330 | NA | NA |
toplist24hr %>%
mutate(id = as.factor(id)) %>%
dplyr::filter(id!="Trastuzumab") %>%
mutate(sigcount = if_else(adj.P.Val <0.05,'sig','notsig'))%>%
mutate(chrom=if_else(ENTREZID %in%chrom_genes,"y","no")) %>%
group_by(id) %>%
summarise(pvalue= chisq.test(chrom, sigcount)$p.value) # A tibble: 4 × 2
id pvalue
<fct> <dbl>
1 Daunorubicin 0.128
2 Doxorubicin 0.0771
3 Epirubicin 0.0314
4 Mitoxantrone 0.000003263 hours data Pairwise
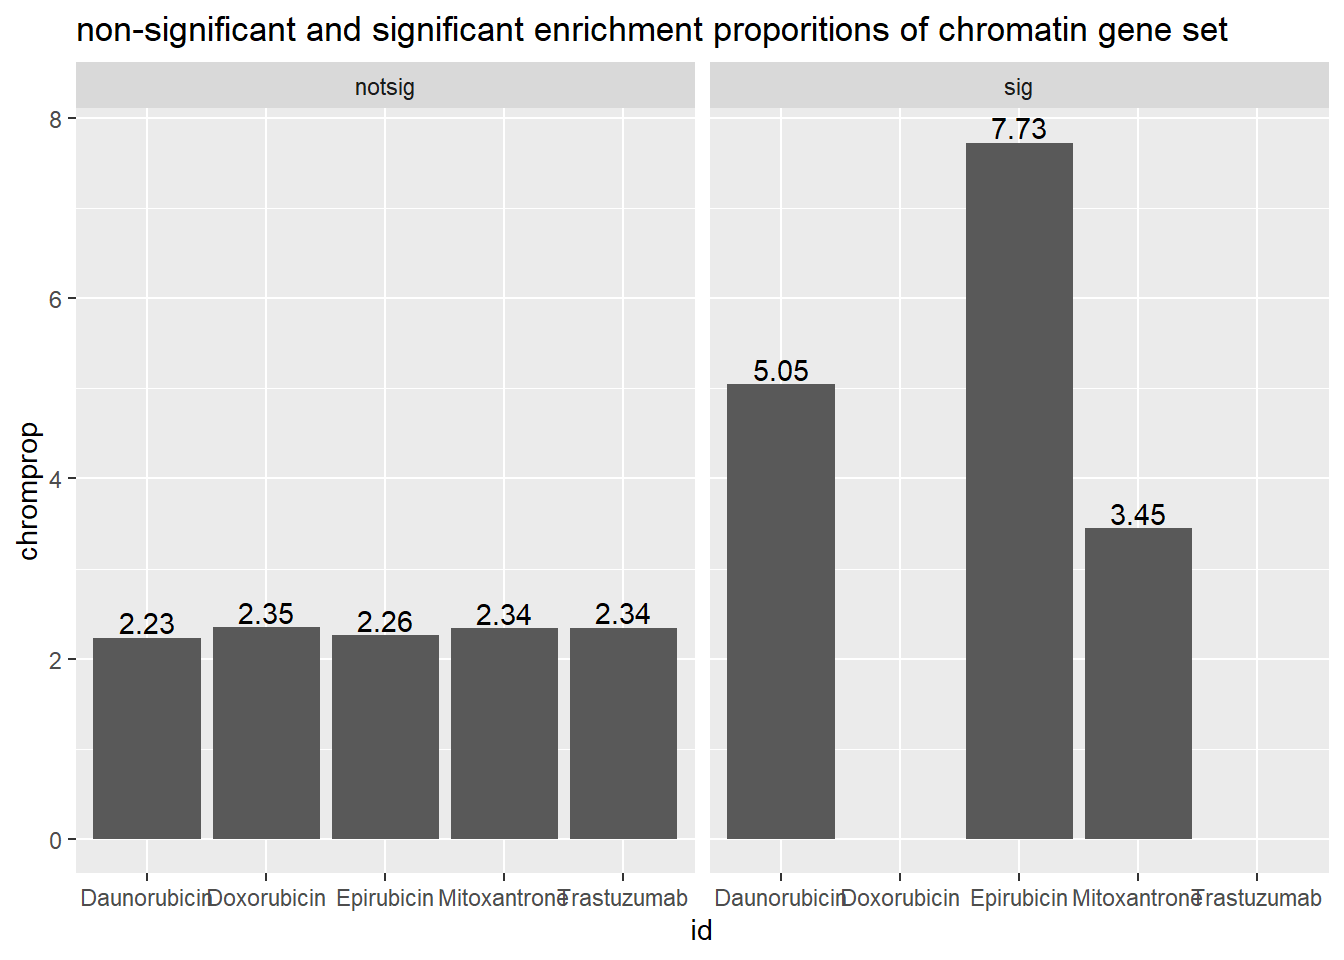
| id | notsig_no | notsig_y | sig_no | sig_y |
|---|---|---|---|---|
| Daunorubicin | 13227 | 302 | 527 | 28 |
| Doxorubicin | 13738 | 330 | 16 | NA |
| Epirubicin | 13551 | 313 | 203 | 17 |
| Mitoxantrone | 13698 | 328 | 56 | 2 |
| Trastuzumab | 13754 | 330 | NA | NA |
chi square test Seaone
##remove Trastuzumab in order to perform chi square tests by time and drug between DE and non DE enrichment
chi_fun <- toplistall %>%
mutate(id = as.factor(id)) %>%
dplyr::filter(id!="Trastuzumab") %>%
mutate(sigcount = if_else(adj.P.Val <0.05,'sig','notsig'))%>%
mutate(chrom=if_else(ENTREZID %in%chrom_genes,"y","no")) %>%
group_by(id,time) %>%
summarise(pvalue= chisq.test(chrom, sigcount)$p.value)
chi_fun%>%
kable(., caption= "after performing chi square test between DEgenes, and non DE genes") %>%
kable_paper("striped", full_width = FALSE) %>%
kable_styling(full_width = FALSE,font_size = 18) %>%
scroll_box(width = "60%", height = "400px")| id | time | pvalue |
|---|---|---|
| Daunorubicin | 24_hours | 0.1276264 |
| Daunorubicin | 3_hours | 0.0000332 |
| Doxorubicin | 24_hours | 0.0770694 |
| Doxorubicin | 3_hours | 1.0000000 |
| Epirubicin | 24_hours | 0.0313650 |
| Epirubicin | 3_hours | 0.0000003 |
| Mitoxantrone | 24_hours | 0.0000033 |
| Mitoxantrone | 3_hours | 0.9023793 |
Supplemental 4 Seoane 3 hours followed by 24 hours
Sup4seoane <- read.csv("output/Sup4seoane.csv", row.names = 1)
Sup4genes <- Sup4seoane %>%
filter(pval.expAnth<0.05) %>%
distinct(entrez, .keep_all = TRUE) %>%
dplyr::select(entrez)
Sup4seoane %>%
filter(pval.expAnth<0.05) %>%
distinct(entrez, .keep_all = TRUE) %>%
dplyr::select(entrez,gene,pval.exp,pval.anthr,pval.expAnth,adjpval) %>%
kable(., caption = "List of Seoane Supplemental 4 genes") %>%
kable_paper("striped", full_width = FALSE) %>%
kable_styling(full_width = FALSE, position = "left",bootstrap_options = c("striped","hover")) %>%
scroll_box(width = "100%", height = "400px")| entrez | gene | pval.exp | pval.anthr | pval.expAnth | adjpval |
|---|---|---|---|---|---|
| 11176 | BAZ2A | 0.0020064 | 0.0000768 | 0.0004553 | 0.1299006 |
| 10284 | SAP18 | 0.0013141 | 0.0000648 | 0.0006081 | 0.1299006 |
| 8819 | SAP30 | 0.0023742 | 0.0000576 | 0.0007455 | 0.1299006 |
| 23522 | KAT6B | 0.0050327 | 0.0001601 | 0.0012776 | 0.1343691 |
| 7786 | MAP3K12 | 0.0062822 | 0.0001296 | 0.0014816 | 0.1343691 |
| 2146 | EZH2 | 0.0075650 | 0.0001626 | 0.0020478 | 0.1343691 |
| 4297 | KMT2A | 0.0096126 | 0.0001301 | 0.0023292 | 0.1343691 |
| 79913 | ACTR5 | 0.0087568 | 0.0001883 | 0.0035210 | 0.1373866 |
| 8242 | KDM5C | 0.0139853 | 0.0001783 | 0.0036176 | 0.1373866 |
| 51780 | KDM3B | 0.0155602 | 0.0001675 | 0.0039239 | 0.1373866 |
| 6872 | TAF1 | 0.0105527 | 0.0001952 | 0.0043619 | 0.1447734 |
| 23135 | KDM6B | 0.0074796 | 0.0001950 | 0.0047811 | 0.1514738 |
| 6877 | TAF5 | 0.0233826 | 0.0002047 | 0.0067329 | 0.1624738 |
| 23030 | KDM4B | 0.0239951 | 0.0004270 | 0.0069023 | 0.1624738 |
| 64324 | NSD1 | 0.0164702 | 0.0003839 | 0.0069286 | 0.1624738 |
| 79885 | HDAC11 | 0.0256039 | 0.0002383 | 0.0071964 | 0.1624738 |
| 10847 | SRCAP | 0.0174738 | 0.0003660 | 0.0077132 | 0.1624738 |
| 7404 | UTY | 0.0114041 | 0.0002112 | 0.0078450 | 0.1624738 |
| 51773 | RSF1 | 0.0283587 | 0.0001948 | 0.0080182 | 0.1624738 |
| 5253 | PHF2 | 0.0119978 | 0.0002989 | 0.0093089 | 0.1624738 |
| 9126 | SMC3 | 0.0347884 | 0.0002127 | 0.0095907 | 0.1624738 |
| 3054 | HCFC1 | 0.0317868 | 0.0003159 | 0.0097354 | 0.1624738 |
| 9734 | HDAC9 | 0.0353794 | 0.0001985 | 0.0103307 | 0.1649465 |
| 53335 | BCL11A | 0.0063102 | 0.0004723 | 0.0105391 | 0.1649465 |
| 83444 | INO80B | 0.0255912 | 0.0003477 | 0.0112276 | 0.1701220 |
| 27350 | APOBEC3C | 0.0051330 | 0.0004220 | 0.0122160 | 0.1745980 |
| 6601 | SMARCC2 | 0.0336512 | 0.0003435 | 0.0122745 | 0.1745980 |
| 1108 | CHD4 | 0.0238388 | 0.0003994 | 0.0127656 | 0.1778779 |
| 8289 | ARID1A | 0.0492112 | 0.0004149 | 0.0146053 | 0.1870798 |
| 890 | CCNA2 | 0.0444477 | 0.0004539 | 0.0147624 | 0.1870798 |
| 64151 | NCAPG | 0.0003946 | 0.0003956 | 0.0154184 | 0.1919043 |
| 10445 | MCRS1 | 0.0185317 | 0.0003143 | 0.0162352 | 0.1977683 |
| 7150 | TOP1 | 0.0468031 | 0.0003256 | 0.0175446 | 0.2072644 |
| 8110 | DPF3 | 0.0612773 | 0.0004235 | 0.0182917 | 0.2124890 |
| 54531 | MIER2 | 0.0244962 | 0.0004771 | 0.0198964 | 0.2273412 |
| 51409 | HEMK1 | 0.0718548 | 0.0004890 | 0.0223436 | 0.2395917 |
| 27097 | TAF5L | 0.0450661 | 0.0003586 | 0.0237889 | 0.2512251 |
| 9739 | SETD1A | 0.0590016 | 0.0005136 | 0.0245980 | 0.2558930 |
| 6595 | SMARCA2 | 0.0491644 | 0.0005485 | 0.0267793 | 0.2645703 |
| 9555 | H2AFY | 0.0852250 | 0.0004323 | 0.0277200 | 0.2645703 |
| 22823 | MTF2 | 0.0823105 | 0.0005160 | 0.0278843 | 0.2645703 |
| 54556 | ING3 | 0.0701823 | 0.0004542 | 0.0280892 | 0.2645703 |
| 10592 | SMC2 | 0.0788583 | 0.0006366 | 0.0286097 | 0.2658792 |
| 8360 | HIST1H4D | 0.0801302 | 0.0004891 | 0.0300157 | 0.2715200 |
| 7528 | YY1 | 0.1017709 | 0.0005254 | 0.0342873 | 0.2836505 |
| 9031 | BAZ1B | 0.1069563 | 0.0005045 | 0.0354054 | 0.2836505 |
| 51377 | UCHL5 | 0.1048249 | 0.0005627 | 0.0372967 | 0.2954064 |
| 7799 | PRDM2 | 0.0130131 | 0.0006154 | 0.0382200 | 0.2993182 |
| 6602 | SMARCD1 | 0.1110653 | 0.0006993 | 0.0446426 | 0.3241241 |
| 8202 | NCOA3 | 0.1179716 | 0.0006899 | 0.0454845 | 0.3251323 |
| 51564 | HDAC7 | 0.1331938 | 0.0007507 | 0.0463305 | 0.3251323 |
| 26038 | CHD5 | 0.0624026 | 0.0005717 | 0.0477023 | 0.3265622 |
| 79858 | NEK11 | 0.1358428 | 0.0006363 | 0.0490482 | 0.3265622 |
| 10856 | RUVBL2 | 0.1277997 | 0.0007652 | 0.0498579 | 0.3278390 |
toplist3hr %>%
mutate(id = as.factor(id)) %>%
mutate(sigcount = if_else(adj.P.Val <0.05,'sig','notsig'))%>%
mutate(chrom=if_else(ENTREZID %in%Sup4genes$entrez,"y","no")) %>%
group_by(id,sigcount,chrom) %>%
summarize(chromcount=n()) %>%
pivot_wider(id_cols = c(id,sigcount), names_from=c(chrom), values_from=chromcount) %>%
mutate(chromprop=(y/(y+no)*100)) %>%
ggplot(., aes(x=id, y=chromprop)) +
geom_col()+
geom_text(aes(x=id, label = sprintf("%.2f",chromprop), vjust=-.2))+
#geom_text(aes(label = expression(paste0("number"~a,"out of",~b))))+
facet_wrap(~sigcount)+
ggtitle("Seoane supp 4 enrichment proportions found in my pairwise 3 hour data")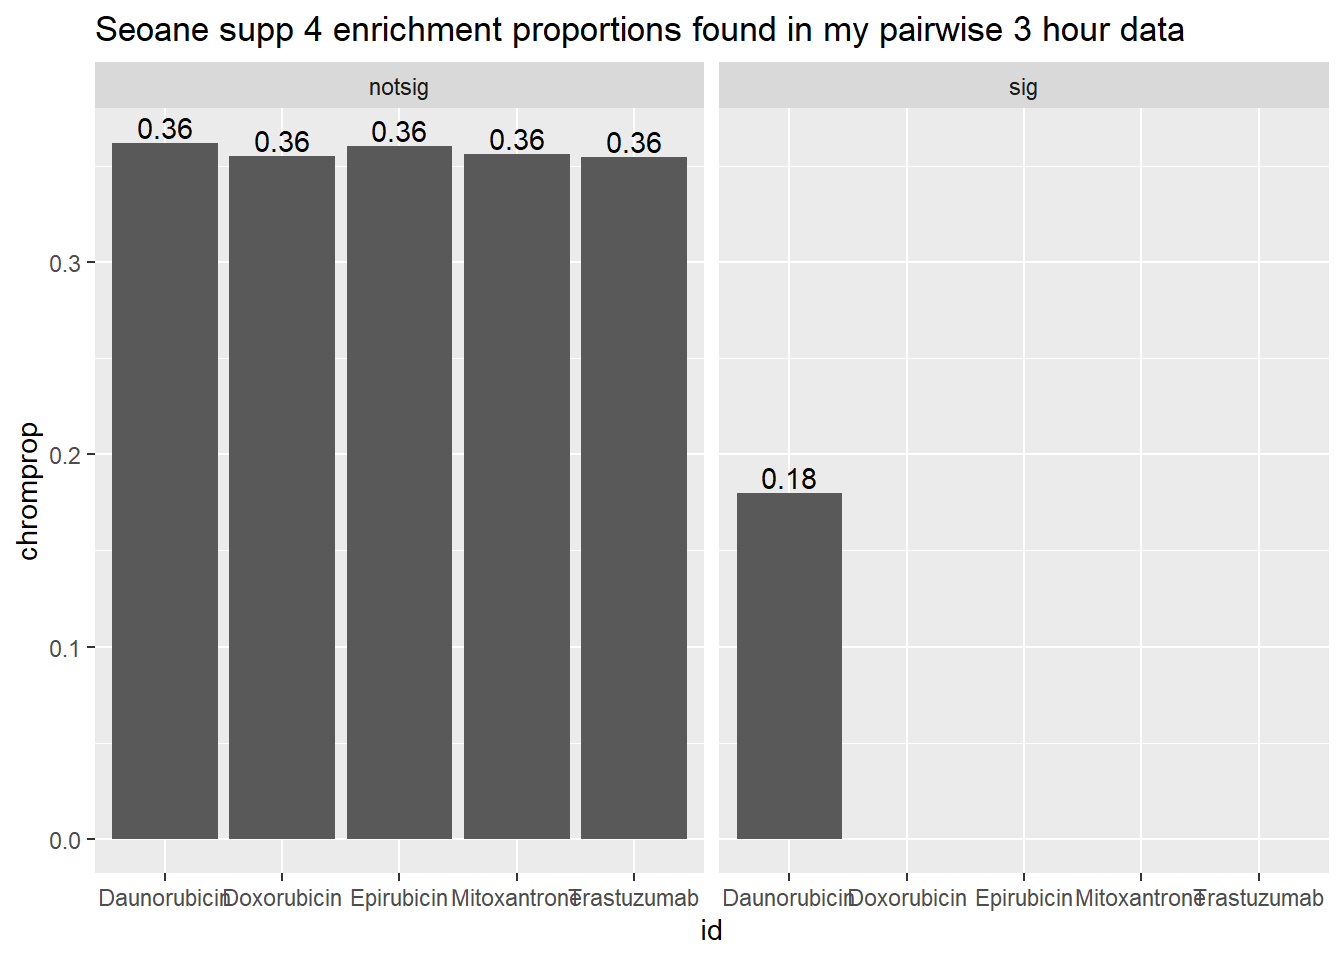
toplist24hr %>%
mutate(id = as.factor(id)) %>%
mutate(sigcount = if_else(adj.P.Val <0.05,'sig','notsig'))%>%
mutate(chrom=if_else(ENTREZID %in%Sup4genes$entrez,"y","no")) %>%
group_by(id,sigcount,chrom) %>%
summarize(chromcount=n()) %>%
pivot_wider(id_cols = c(id,sigcount), names_from=c(chrom), values_from=chromcount) %>%
mutate(chromprop=(y/(y+no)*100)) %>%
ggplot(., aes(x=id, y=chromprop)) +
geom_col()+
geom_text(aes(x=id, label = sprintf("%.2f",chromprop), vjust=-.2))+
#geom_text(aes(label = expression(paste0("number"~a,"out of",~b))))+
facet_wrap(~sigcount)+
ggtitle("Seoane supp 4 enrichment proportions found in my pairwise 24 hour data")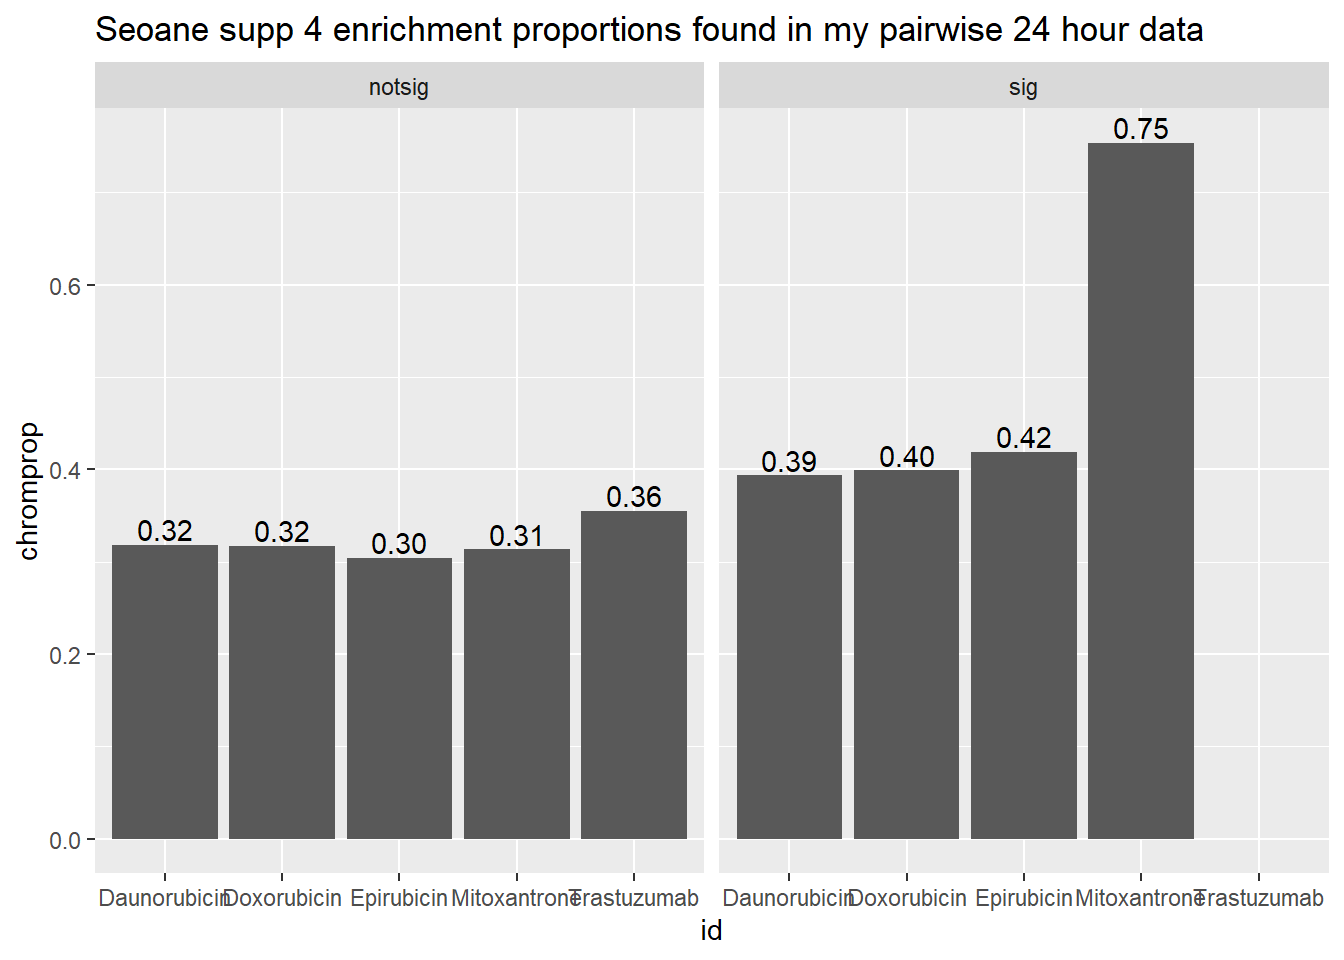
chi_fun2 <-
toplistall %>%
mutate(id = as.factor(id)) %>%
dplyr::filter(id!="Trastuzumab") %>%
mutate(sigcount = if_else(adj.P.Val <0.05,'sig','notsig'))%>%
mutate(chrom=if_else(ENTREZID %in%Sup4genes$entrez,"y","no")) %>%
group_by(id,time) %>%
summarise(pvalue= chisq.test(chrom, sigcount)$p.value)
print("These are the chisquare values from the 54 genes")[1] "These are the chisquare values from the 54 genes"chi_fun2# A tibble: 8 × 3
# Groups: id [4]
id time pvalue
<fct> <chr> <dbl>
1 Daunorubicin 24_hours 0.546
2 Daunorubicin 3_hours 0.732
3 Doxorubicin 24_hours 0.501
4 Doxorubicin 3_hours 1.00
5 Epirubicin 24_hours 0.320
6 Epirubicin 3_hours 0.748
7 Mitoxantrone 24_hours 0.0202
8 Mitoxantrone 3_hours 1.00 pairS14_mat <- chi_fun2 %>%
full_join(chi_fun,by=c("id","time")) %>%
mutate("n = 54"=-log(pvalue.x), "n = 408"=-log(pvalue.y)) %>%
mutate(time= case_match(time,
'3_hours'~'3_hrs',
'24_hours'~'24_hrs',.default = id)) %>%
mutate(id =case_match( id,
'Daunorubicin'~'DNR',
'Doxorubicin'~'DOX' ,
'Epirubicin'~'EPI' ,
'Mitoxantrone' ~ 'MTX',.default = id)) %>%
unite('pairset',time,id ) %>%
dplyr::select(!c(pvalue.x,pvalue.y)) %>%
column_to_rownames('pairset') %>%
as.matrix()
Heatmap( pairS14_mat,
column_title="Pairwise version of Chromatin gene sets \nchi square -log p values", row_order = c(2,4,6,8,1,3,5,7),
name = "-log p values",
cluster_rows = FALSE,
cluster_columns = FALSE,
column_names_rot = 0,
col = col_fun5,
cell_fun = function(j, i, x, y, width, height, fill) {
if(pairS14_mat[i, j] > -log(0.05))
grid.text("*", x, y, gp = gpar(fontsize = 20))
})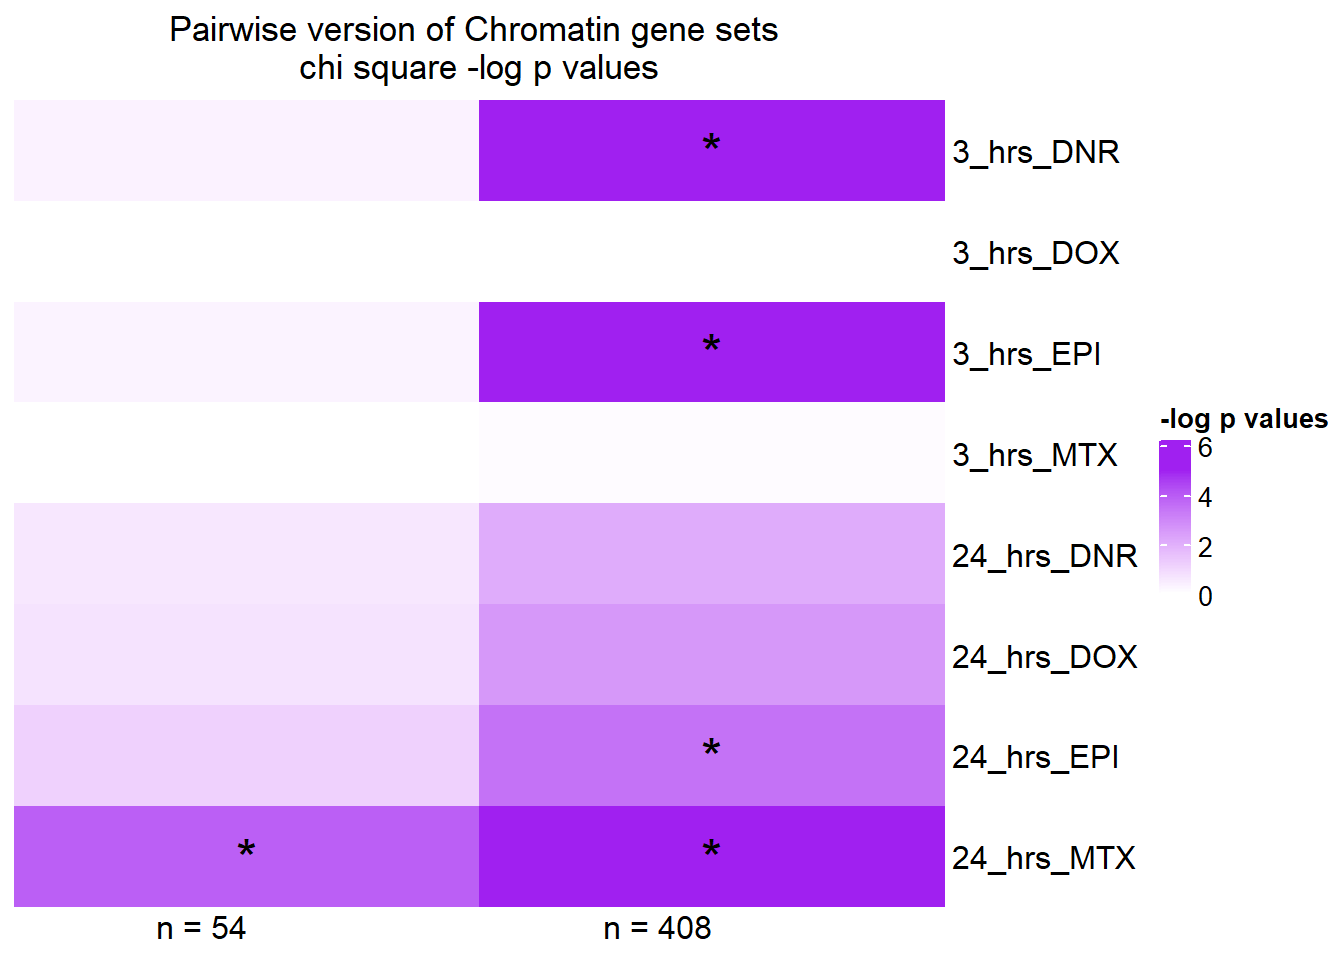
Stars indicate a chi square pvalue < 0.05
Using Baysian gene sets to look at enrichment of Seoane data
Seoane Supplemental 4
DEG_cormotif <- readRDS("data/DEG_cormotif.RDS")
list2env(DEG_cormotif,envir=.GlobalEnv)
<environment: R_GlobalEnv>backGL <- read.csv("data/backGL.txt")##data sets to compare Sup4genes$entrez,"y","no"
motifSeoanesummary4 <- toplist24hr %>%
distinct(ENTREZID) %>%
mutate(ER=if_else(ENTREZID %in% motif_ER,"y","no")) %>%
mutate(LR=if_else(ENTREZID %in% motif_LR,"y","no")) %>%
mutate(TI=if_else(ENTREZID %in% motif_TI,"y","no")) %>%
mutate(NR=if_else(ENTREZID %in% motif_NR,"y","no")) %>%
mutate(chrom = if_else(ENTREZID %in% Sup4genes$entrez, "y", "no")) %>%
group_by(chrom,ER,TI,LR,NR) %>%
dplyr::summarize(n=n()) %>%
as.tibble %>%
pivot_wider(id_cols = c(chrom), names_from = c('ER', 'TI', 'LR', 'NR'), values_from= n) %>%
rename(.,c("chrom"=chrom,"none"= 2 , "ER" = 3 , "TI" = 4 , "LR" = 5 ,"NR" = 6))
motifSeoanesummary4 %>% kable(., caption= "Summary of genes from Cormotif that are also in Seoane Supp4" )%>%
kable_paper("striped", full_width = FALSE) %>%
kable_styling(full_width = FALSE, position = "left",bootstrap_options = c("striped"),font_size = 18) %>%
scroll_box(width = "60%", height = "400px")| chrom | none | ER | TI | LR | NR |
|---|---|---|---|---|---|
| no | 63 | 7482 | 5525 | 525 | 439 |
| y | NA | 22 | 20 | 3 | 5 |
    # chisqS4 <-
##making the matrix

chi_list4 <- toplist24hr %>%
  distinct(ENTREZID) %>%
  mutate(ER=if_else(ENTREZID %in%motif_ER,"y","no")) %>%
  mutate(LR=if_else(ENTREZID %in%motif_LR,"y","no")) %>%
  mutate(TI=if_else(ENTREZID %in%motif_TI,"y","no")) %>%
  mutate(NR=if_else(ENTREZID %in%motif_NR,"y","no")) %>%
  mutate(chrom=if_else(ENTREZID %in%Sup4genes$entrez,"y","no")) %>%
  group_by(chrom,ER,TI,LR,NR) %>%
  dplyr::summarize(n=n()) %>%
  as.tibble  %>%
  pivot_wider(id_cols = c(chrom), names_from = c('ER', 'TI', 'LR', 'NR'), values_from= n) %>%
  rename(.,c("chrom"=chrom,"none"= 2 , "ER" = 3 , "TI" = 4 , "LR" = 5 ,"NR" = 6))

chisup4LR <- chisq.test(chi_list4[,c('NR','LR')])
chisup4LR
    Pearson's Chi-squared test with Yates' continuity correction

data:  chi_list4[, c("NR", "LR")]
X-squared = 0.36327, df = 1, p-value = 0.5467
chisup4ER <- chisq.test(chi_list4[,c('NR','ER')])
chisup4ER
    Pearson's Chi-squared test with Yates' continuity correction

data:  chi_list4[, c("NR", "ER")]
X-squared = 6.3065, df = 1, p-value = 0.01203
chisup4TI <- chisq.test(chi_list4[,c('NR','TI')])
chisup4TI
    Pearson's Chi-squared test with Yates' continuity correction

data:  chi_list4[, c("NR", "TI")]
X-squared = 4.099, df = 1, p-value = 0.04291
chisq.test(chi_list4[,c('ER','TI')])
    Pearson's Chi-squared test with Yates' continuity correction

data:  chi_list4[, c("ER", "TI")]
X-squared = 0.26698, df = 1, p-value = 0.6054
chisq.test(chi_list4[,c('ER','LR')])
    Pearson's Chi-squared test with Yates' continuity correction

data:  chi_list4[, c("ER", "LR")]
X-squared = 0.47936, df = 1, p-value = 0.4887
chisq.test(chi_list4[,c('TI','LR')])
    Pearson's Chi-squared test with Yates' continuity correction

data:  chi_list4[, c("TI", "LR")]
X-squared = 0.13763, df = 1, p-value = 0.7107
Seoane Supplemental 1
 motifSeoanesummary1 <- toplist24hr %>%
  distinct(ENTREZID) %>%
  mutate(ER=if_else(ENTREZID %in%motif_ER,"y","no")) %>%
  mutate(LR=if_else(ENTREZID %in%motif_LR,"y","no")) %>%
  mutate(TI=if_else(ENTREZID %in%motif_TI,"y","no")) %>%
  mutate(NR=if_else(ENTREZID %in%motif_NR,"y","no")) %>%
  mutate(chrom = if_else(ENTREZID %in% chrom_genes, "y", "no")) %>%
  group_by(chrom,ER,TI,LR,NR) %>%
  dplyr::summarize(n=n()) %>%
  as.tibble  %>%
  pivot_wider(id_cols = c(chrom), names_from = c('ER', 'TI', 'LR', 'NR'), values_from= n) %>%
  rename(.,c("chrom"=chrom,"none"= 2 , "ER" = 3 , "TI" = 4 , "LR" = 5 ,"NR" = 6))
motifSeoanesummary1 %>% kable(., caption= "Summary of genes from Cormotif that are also in Seoane Supp1" )%>%
  kable_paper("striped", full_width = FALSE) %>%
  kable_styling(full_width = FALSE, position = "left",bootstrap_options = c("striped"),font_size = 18) %>%
scroll_box(width = "60%", height = "400px")| chrom | none | ER | TI | LR | NR |
|---|---|---|---|---|---|
| no | 61 | 7363 | 5406 | 514 | 410 |
| y | 2 | 141 | 139 | 14 | 34 |
    # chisqS4 <-
##making the matrix

chi_list1 <- toplist24hr %>%
  distinct(ENTREZID) %>%
  mutate(ER=if_else(ENTREZID %in%motif_ER,"y","no")) %>%
  mutate(LR=if_else(ENTREZID %in%motif_LR,"y","no")) %>%
  mutate(TI=if_else(ENTREZID %in%motif_TI,"y","no")) %>%
  mutate(NR=if_else(ENTREZID %in%motif_NR,"y","no")) %>%
  mutate(chrom=if_else(ENTREZID %in% chrom_genes,"y","no")) %>%
  group_by(chrom,ER,TI,LR,NR) %>%
  dplyr::summarize(n=n()) %>%
  as.tibble  %>%
  pivot_wider(id_cols = c(chrom), names_from = c('ER', 'TI', 'LR', 'NR'), values_from= n) %>%
  rename(.,c("chrom"=chrom,"none"= 2 , "ER" = 3 , "TI" = 4 , "LR" = 5 ,"NR" = 6))

chisup1LR <- chisq.test(chi_list1[,c('NR','LR')])
chisup1LR
    Pearson's Chi-squared test with Yates' continuity correction

data:  chi_list1[, c("NR", "LR")]
X-squared = 11.832, df = 1, p-value = 0.0005824
chisup1ER <- chisq.test(chi_list1[,c('NR','ER')])
chisup1ER
    Pearson's Chi-squared test with Yates' continuity correction

data:  chi_list1[, c("NR", "ER")]
X-squared = 62.351, df = 1, p-value = 2.873e-15
chisup1TI <- chisq.test(chi_list1[,c('NR','TI')])
chisup1TI
    Pearson's Chi-squared test with Yates' continuity correction

data:  chi_list1[, c("NR", "TI")]
X-squared = 37.066, df = 1, p-value = 1.142e-09
chisq.test(chi_list1[,c('ER','TI')])
    Pearson's Chi-squared test with Yates' continuity correction

data:  chi_list1[, c("ER", "TI")]
X-squared = 5.6896, df = 1, p-value = 0.01707
chisq.test(chi_list1[,c('ER','LR')])
    Pearson's Chi-squared test with Yates' continuity correction

data:  chi_list1[, c("ER", "LR")]
X-squared = 1.1741, df = 1, p-value = 0.2786
chisq.test(chi_list1[,c('TI','LR')])
    Pearson's Chi-squared test with Yates' continuity correction

data:  chi_list1[, c("TI", "LR")]
X-squared = 0.003306, df = 1, p-value = 0.9541
chi square heatmap
supp45X <- NULL
motif <- c('ER','TI','LR')
pval1=c(chisup1ER$p.value,chisup1TI$p.value,chisup1LR$p.value)
pval4=c(chisup4ER$p.value ,chisup4TI$p.value ,chisup4LR$p.value)
supp45X <- tibble("motif"=motif,"pval1"=pval1,"pval4"=pval4)
supp45Xmat <- supp45X %>%
mutate(pval1=(-1*log(pval1))) %>%
mutate(pval4=(-1*log(pval4))) %>%
column_to_rownames('motif') %>%
rename(c("n = 408"= pval1, "n = 54"=pval4)) %>%
as.matrix()
Heatmap(supp45Xmat,
column_title="Chromatin gene sets \nchi square -log p values",
name = "-log (p value)",
cluster_rows = FALSE,
cluster_columns = FALSE,
column_names_rot = 0,
col = col_fun5,
cell_fun = function(j, i, x, y, width, height, fill) {
if(supp45Xmat[i, j] > -log(0.05))
grid.text("*", x, y, gp = gpar(fontsize = 20))
})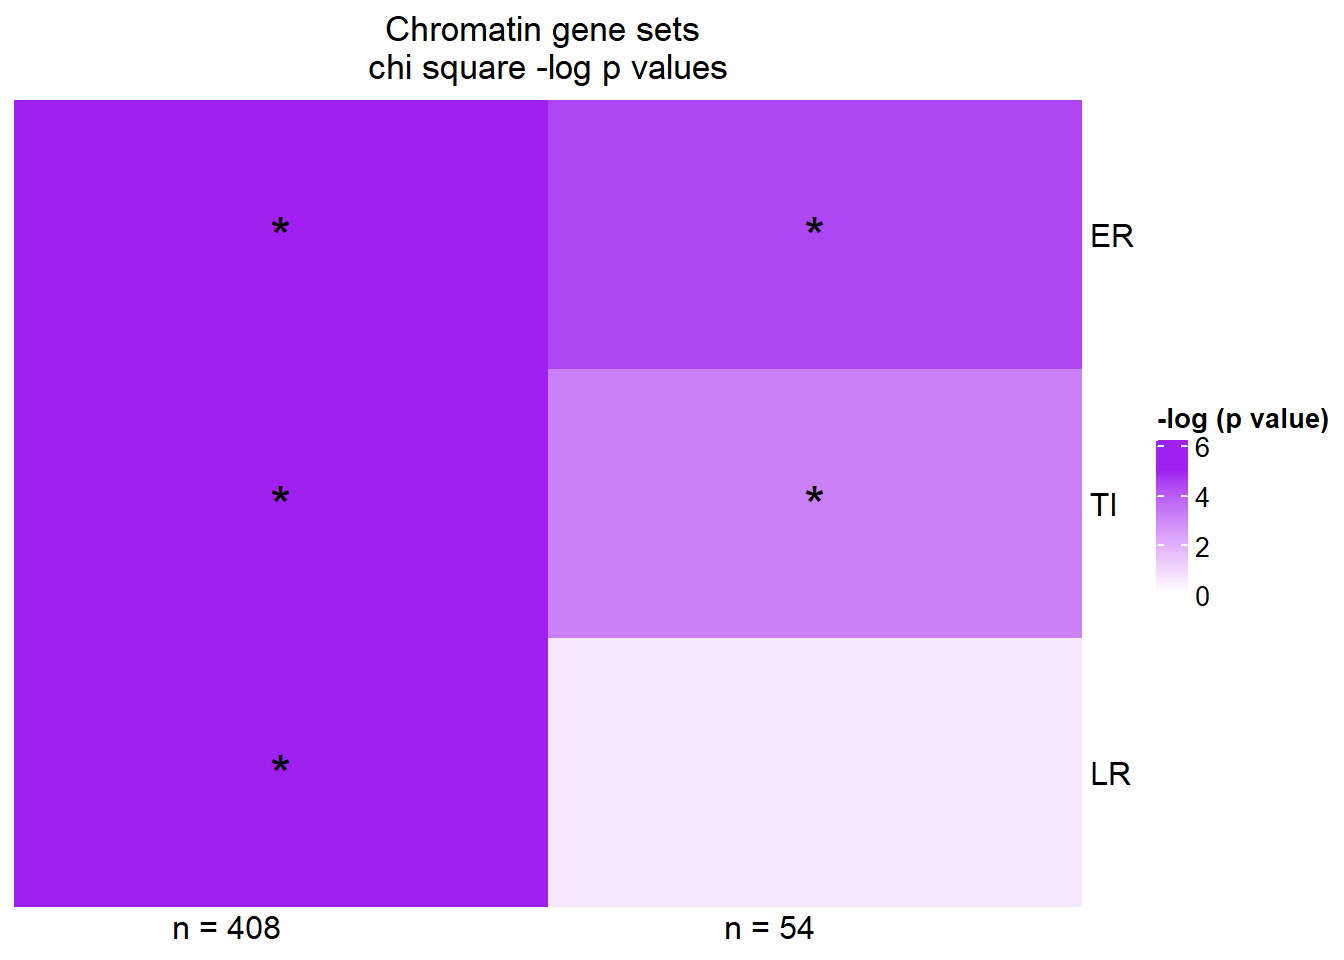 Stars represent chi square p values of < 0.05
sessionInfo()R version 4.2.2 (2022-10-31 ucrt)
Platform: x86_64-w64-mingw32/x64 (64-bit)
Running under: Windows 10 x64 (build 19045)
Matrix products: default
locale:
[1] LC_COLLATE=English_United States.utf8
[2] LC_CTYPE=English_United States.utf8
[3] LC_MONETARY=English_United States.utf8
[4] LC_NUMERIC=C
[5] LC_TIME=English_United States.utf8
attached base packages:
[1] grid stats graphics grDevices utils datasets methods
[8] base
other attached packages:
[1] ggstats_0.3.0 broom_1.0.5 kableExtra_1.3.4
[4] sjmisc_2.8.9 scales_1.2.1 ggpubr_0.6.0
[7] cowplot_1.1.1 RColorBrewer_1.1-3 biomaRt_2.52.0
[10] ggsignif_0.6.4 lubridate_1.9.2 forcats_1.0.0
[13] stringr_1.5.0 dplyr_1.1.2 purrr_1.0.1
[16] readr_2.1.4 tidyr_1.3.0 tibble_3.2.1
[19] ggplot2_3.4.2 tidyverse_2.0.0 ComplexHeatmap_2.12.1
[22] workflowr_1.7.0
loaded via a namespace (and not attached):
[1] colorspace_2.1-0 rjson_0.2.21 sjlabelled_1.2.0
[4] rprojroot_2.0.3 circlize_0.4.15 XVector_0.36.0
[7] GlobalOptions_0.1.2 fs_1.6.2 clue_0.3-64
[10] rstudioapi_0.14 farver_2.1.1 bit64_4.0.5
[13] AnnotationDbi_1.58.0 fansi_1.0.4 xml2_1.3.4
[16] codetools_0.2-19 doParallel_1.0.17 cachem_1.0.8
[19] knitr_1.43 jsonlite_1.8.5 cluster_2.1.4
[22] dbplyr_2.3.2 png_0.1-8 compiler_4.2.2
[25] httr_1.4.6 backports_1.4.1 fastmap_1.1.1
[28] cli_3.6.1 later_1.3.1 htmltools_0.5.5
[31] prettyunits_1.1.1 tools_4.2.2 gtable_0.3.3
[34] glue_1.6.2 GenomeInfoDbData_1.2.8 rappdirs_0.3.3
[37] Rcpp_1.0.10 carData_3.0-5 Biobase_2.56.0
[40] jquerylib_0.1.4 vctrs_0.6.3 Biostrings_2.64.1
[43] svglite_2.1.1 iterators_1.0.14 insight_0.19.2
[46] xfun_0.39 ps_1.7.5 rvest_1.0.3
[49] timechange_0.2.0 lifecycle_1.0.3 rstatix_0.7.2
[52] XML_3.99-0.14 getPass_0.2-2 zlibbioc_1.42.0
[55] vroom_1.6.3 hms_1.1.3 promises_1.2.0.1
[58] parallel_4.2.2 yaml_2.3.7 curl_5.0.1
[61] memoise_2.0.1 sass_0.4.6 stringi_1.7.12
[64] RSQLite_2.3.1 highr_0.10 S4Vectors_0.34.0
[67] foreach_1.5.2 BiocGenerics_0.42.0 filelock_1.0.2
[70] shape_1.4.6 GenomeInfoDb_1.32.4 systemfonts_1.0.4
[73] rlang_1.1.1 pkgconfig_2.0.3 matrixStats_1.0.0
[76] bitops_1.0-7 evaluate_0.21 labeling_0.4.2
[79] bit_4.0.5 processx_3.8.1 tidyselect_1.2.0
[82] magrittr_2.0.3 R6_2.5.1 IRanges_2.30.1
[85] generics_0.1.3 DBI_1.1.3 pillar_1.9.0
[88] whisker_0.4.1 withr_2.5.0 KEGGREST_1.36.3
[91] abind_1.4-5 RCurl_1.98-1.12 crayon_1.5.2
[94] car_3.1-2 utf8_1.2.3 BiocFileCache_2.4.0
[97] tzdb_0.4.0 rmarkdown_2.22 GetoptLong_1.0.5
[100] progress_1.2.2 blob_1.2.4 callr_3.7.3
[103] git2r_0.32.0 webshot_0.5.4 digest_0.6.31
[106] httpuv_1.6.11 stats4_4.2.2 munsell_0.5.0
[109] viridisLite_0.4.2 bslib_0.5.0