H3K27ac TF enrichment
Renee Matthews
2026-02-23
Last updated: 2026-02-23
Checks: 7 0
Knit directory: DXR_continue/
This reproducible R Markdown analysis was created with workflowr (version 1.7.1). The Checks tab describes the reproducibility checks that were applied when the results were created. The Past versions tab lists the development history.
Great! Since the R Markdown file has been committed to the Git repository, you know the exact version of the code that produced these results.
Great job! The global environment was empty. Objects defined in the global environment can affect the analysis in your R Markdown file in unknown ways. For reproduciblity it’s best to always run the code in an empty environment.
The command set.seed(20250701) was run prior to running
the code in the R Markdown file. Setting a seed ensures that any results
that rely on randomness, e.g. subsampling or permutations, are
reproducible.
Great job! Recording the operating system, R version, and package versions is critical for reproducibility.
Nice! There were no cached chunks for this analysis, so you can be confident that you successfully produced the results during this run.
Great job! Using relative paths to the files within your workflowr project makes it easier to run your code on other machines.
Great! You are using Git for version control. Tracking code development and connecting the code version to the results is critical for reproducibility.
The results in this page were generated with repository version 7ca10d1. See the Past versions tab to see a history of the changes made to the R Markdown and HTML files.
Note that you need to be careful to ensure that all relevant files for
the analysis have been committed to Git prior to generating the results
(you can use wflow_publish or
wflow_git_commit). workflowr only checks the R Markdown
file, but you know if there are other scripts or data files that it
depends on. Below is the status of the Git repository when the results
were generated:
Ignored files:
    Ignored:    .Rhistory
    Ignored:    .Rproj.user/
    Ignored:    data/Bed_exports/
    Ignored:    data/Cormotif_data/
    Ignored:    data/DER_data/
    Ignored:    data/Other_paper_data/
    Ignored:    data/RDS_files/
    Ignored:    data/TE_annotation/
    Ignored:    data/alignment_summary.txt
    Ignored:    data/all_peak_final_dataframe.txt
    Ignored:    data/cell_line_info_.tsv
    Ignored:    data/full_summary_QC_metrics.txt
    Ignored:    data/motif_lists/
    Ignored:    data/number_frag_peaks_summary.txt

Untracked files:
    Untracked:  H3K27ac_all_regions_test.bed
    Untracked:  H3K27ac_consensus_clusters_test.bed
    Untracked:  analysis/GREAT_H3K27ac.Rmd
    Untracked:  analysis/H3K27ac_ChromHMM_FC.Rmd
    Untracked:  analysis/H3K27me3_TE_investigation.Rmd
    Untracked:  analysis/H3K36me3_TE_investigation.Rmd
    Untracked:  analysis/Top2a_Top2b_expression.Rmd
    Untracked:  analysis/maps_and_plots.Rmd
    Untracked:  analysis/proteomics.Rmd
    Untracked:  code/For_john.R
    Untracked:  other_analysis/

Unstaged changes:
    Modified:   analysis/H3K27_TE_overlap.Rmd
    Modified:   analysis/H3K27ac_cisRE.Rmd
    Modified:   analysis/H3K27ac_summit_processing.Rmd
    Modified:   analysis/H3K9me3_TE_investigation.Rmd
    Modified:   analysis/H3K9me3_TE_overlap.Rmd
    Modified:   analysis/dual_histone_TE_investigation.Rmd
    Modified:   analysis/summit_files_processing.Rmd
Note that any generated files, e.g. HTML, png, CSS, etc., are not included in this status report because it is ok for generated content to have uncommitted changes.
These are the previous versions of the repository in which changes were
made to the R Markdown (analysis/H3K27ac_TF_motifs.Rmd) and
HTML (docs/H3K27ac_TF_motifs.html) files. If you’ve
configured a remote Git repository (see ?wflow_git_remote),
click on the hyperlinks in the table below to view the files as they
were in that past version.
| File | Version | Author | Date | Message |
|---|---|---|---|---|
| Rmd | 7ca10d1 | reneeisnowhere | 2026-02-23 | filter updated |
| html | e7a3fff | reneeisnowhere | 2026-02-18 | Build site. |
| Rmd | dbe389b | reneeisnowhere | 2026-02-18 | wflow_publish("analysis/H3K27ac_TF_motifs.Rmd") |
| html | 7840a6d | reneeisnowhere | 2026-02-12 | Build site. |
| Rmd | 861a8a2 | reneeisnowhere | 2026-02-12 | wflow_publish("analysis/H3K27ac_TF_motifs.Rmd") |
| html | 4392e80 | reneeisnowhere | 2026-02-09 | Build site. |
| Rmd | 17e4ca3 | reneeisnowhere | 2026-02-09 | wflow_publish("analysis/H3K27ac_TF_motifs.Rmd") |
| html | 1499fd6 | reneeisnowhere | 2026-02-09 | Build site. |
| Rmd | 52b9c95 | reneeisnowhere | 2026-02-09 | wflow_publish("analysis/H3K27ac_TF_motifs.Rmd") |
| html | 78269d9 | reneeisnowhere | 2026-02-09 | Build site. |
| Rmd | b9ad273 | reneeisnowhere | 2026-02-09 | wflow_publish("analysis/H3K27ac_TF_motifs.Rmd") |
| html | 3f3d9a4 | reneeisnowhere | 2026-02-02 | Build site. |
| Rmd | ce17cd1 | reneeisnowhere | 2026-02-02 | wflow_publish("analysis/H3K27ac_TF_motifs.Rmd") |
| html | 4f18ea9 | reneeisnowhere | 2026-01-19 | Build site. |
| Rmd | d435b68 | reneeisnowhere | 2026-01-19 | wflow_publish("analysis/H3K27ac_TF_motifs.Rmd") |
| html | e9fc2a3 | reneeisnowhere | 2026-01-19 | Build site. |
| Rmd | 576fbd4 | reneeisnowhere | 2026-01-19 | wflow_publish("analysis/H3K27ac_TF_motifs.Rmd") |
| html | c560d24 | reneeisnowhere | 2026-01-15 | Build site. |
| Rmd | f7c8242 | reneeisnowhere | 2026-01-15 | wflow_publish(c("analysis/H3K27_TE_overlap_extend.Rmd", "analysis/H3K27ac_summit_topqonly.Rmd", |
library(tidyverse)
library(GenomicRanges)
library(plyranges)
library(genomation)
library(readr)
library(rtracklayer)
library(stringr)
library(DT)
Summit calls method 1
This is actually summit +/- 200 bp (and 300bp for initial investigation)
H3K27ac_Set2_sea_disc_out <-read_delim("C:/Users/renee/Other_projects_data/DXR_data/H3K27ac/H3K27ac_set2_400/sea_disc_out/sea.tsv", delim = "\t", escape_double = FALSE,     trim_ws = TRUE) %>% mutate(source="disc") %>% slice_head(n = length(.$ID)-3)

H3K27ac_Set2_sea_known <-read_delim("C:/Users/renee/Other_projects_data/DXR_data/H3K27ac/H3K27ac_set2_400/sea_out/sea.tsv", delim = "\t", escape_double = FALSE,     trim_ws = TRUE) %>% mutate(source="known") %>% slice_head(n = length(.$ID)-3)

H3K27ac_Set2_xstreme <- read_delim("C:/Users/renee/Other_projects_data/DXR_data/H3K27ac/H3K27ac_set2_400/xstreme.tsv", delim = "\t", escape_double = FALSE,     trim_ws = TRUE) %>% mutate(source="all") %>% slice_head(n = length(.$ID)-3)


H3K27ac_Set2_tomtom <- read_delim("C:/Users/renee/Other_projects_data/DXR_data/H3K27ac/H3K27ac_set2_400/streme_tomtom_out/tomtom.tsv",
    delim = "\t", escape_double = FALSE,
    trim_ws = TRUE)

test_bind <- bind_rows(H3K27ac_Set2_sea_disc_out, H3K27ac_Set2_sea_known) %>%
  dplyr::select(DB:ENR_RATIO) %>%
  group_by(ID,ALT_ID, ENR_RATIO) %>% distinct()
H3K27ac_Set3_sea_disc_out <-read_delim("C:/Users/renee/Other_projects_data/DXR_data/H3K27ac/H3K27ac_set3_400/sea_disc_out/sea.tsv", delim = "\t", escape_double = FALSE, trim_ws = TRUE) %>% mutate(source="disc") %>% slice_head(n = length(.$ID)-3)
H3K27ac_Set3_sea_known <-read_delim("C:/Users/renee/Other_projects_data/DXR_data/H3K27ac/H3K27ac_set3_400/sea_out/sea.tsv", delim = "\t", escape_double = FALSE, trim_ws = TRUE) %>% mutate(source="known") %>% slice_head(n = length(.$ID)-3)
H3K27ac_Set3_xstreme <- read_delim("C:/Users/renee/Other_projects_data/DXR_data/H3K27ac/H3K27ac_set3_400/xstreme.tsv", delim = "\t", escape_double = FALSE, trim_ws = TRUE) %>% mutate(source="all") %>% slice_head(n = length(.$ID)-3)
H3K27ac_Set3_tomtom <- read_delim("C:/Users/renee/Other_projects_data/DXR_data/H3K27ac/H3K27ac_set3_400/streme_tomtom_out/tomtom.tsv",
delim = "\t", escape_double = FALSE,
trim_ws = TRUE)
test_bind3 <-bind_rows(H3K27ac_Set3_sea_disc_out, H3K27ac_Set3_sea_known) %>%
dplyr::select(DB:ENR_RATIO) %>%
group_by(ID,ALT_ID) %>%
distinct()H3K27ac_Set2_data <- H3K27ac_Set2_xstreme %>%
dplyr::select(RANK:CLUSTER,ID:CONSENSUS,EVALUE,SIM_MOTIF,MOTIF_URL) %>%
mutate(MOTIF_URL=str_replace(MOTIF_URL,"https://jaspar2024.elixir.no/matrix/","")) %>%
mutate(motif_name=case_when(
str_detect(SIM_MOTIF, "\\(") ~ str_extract(SIM_MOTIF, "(?<=\\().+?(?=\\))"),
str_detect(SIM_MOTIF, "^MA\\d+\\.\\d+") ~ ALT_ID,
str_detect(SIM_MOTIF, "^\\d+-") ~ str_replace(SIM_MOTIF, "^\\d+-", ""),
TRUE ~ SIM_MOTIF)) %>%
left_join(test_bind) %>%
mutate(diff_per=`TP%` -`FP%`)
H3K27ac_Set3_data <- H3K27ac_Set3_xstreme %>%
dplyr::select(RANK:CLUSTER,ID:CONSENSUS,EVALUE,SIM_MOTIF,MOTIF_URL) %>%
mutate(MOTIF_URL=str_replace(MOTIF_URL,"https://jaspar2024.elixir.no/matrix/","")) %>%
mutate(motif_name=case_when(
str_detect(SIM_MOTIF, "\\(") ~ str_extract(SIM_MOTIF, "(?<=\\().+?(?=\\))"),
str_detect(SIM_MOTIF, "^MA\\d+\\.\\d+") ~ ALT_ID,
str_detect(SIM_MOTIF, "^\\d+-") ~ str_replace(SIM_MOTIF, "^\\d+-", ""),
TRUE ~ SIM_MOTIF)) %>%
left_join(test_bind3, by=c("ID"="ID","ALT_ID"="ALT_ID")) %>%
mutate(diff_per=`TP%` -`FP%`)H3K27ac_Set2_data %>%
dplyr::filter(ENR_RATIO>1.2) %>%
group_by(CLUSTER) %>%
slice_min(EVALUE, with_ties = FALSE) %>%
mutate(log10Evalue= log(EVALUE, base = 10)*(-1)) %>%
ggplot(., aes (y= reorder(motif_name,log10Evalue))) +
geom_col(aes(x=log10Evalue))+
geom_point(aes(x=`TP%`*2), size =4)+
scale_x_continuous(expand=c (0,.125),sec.axis = sec_axis(transform= ~./2,name="Percent of peaks with motif"))+
theme_classic()+
ylab("Enriched TF motif")+
ggtitle(paste("SET2 enrichment over SET1, Enrichment ratio >1.2"))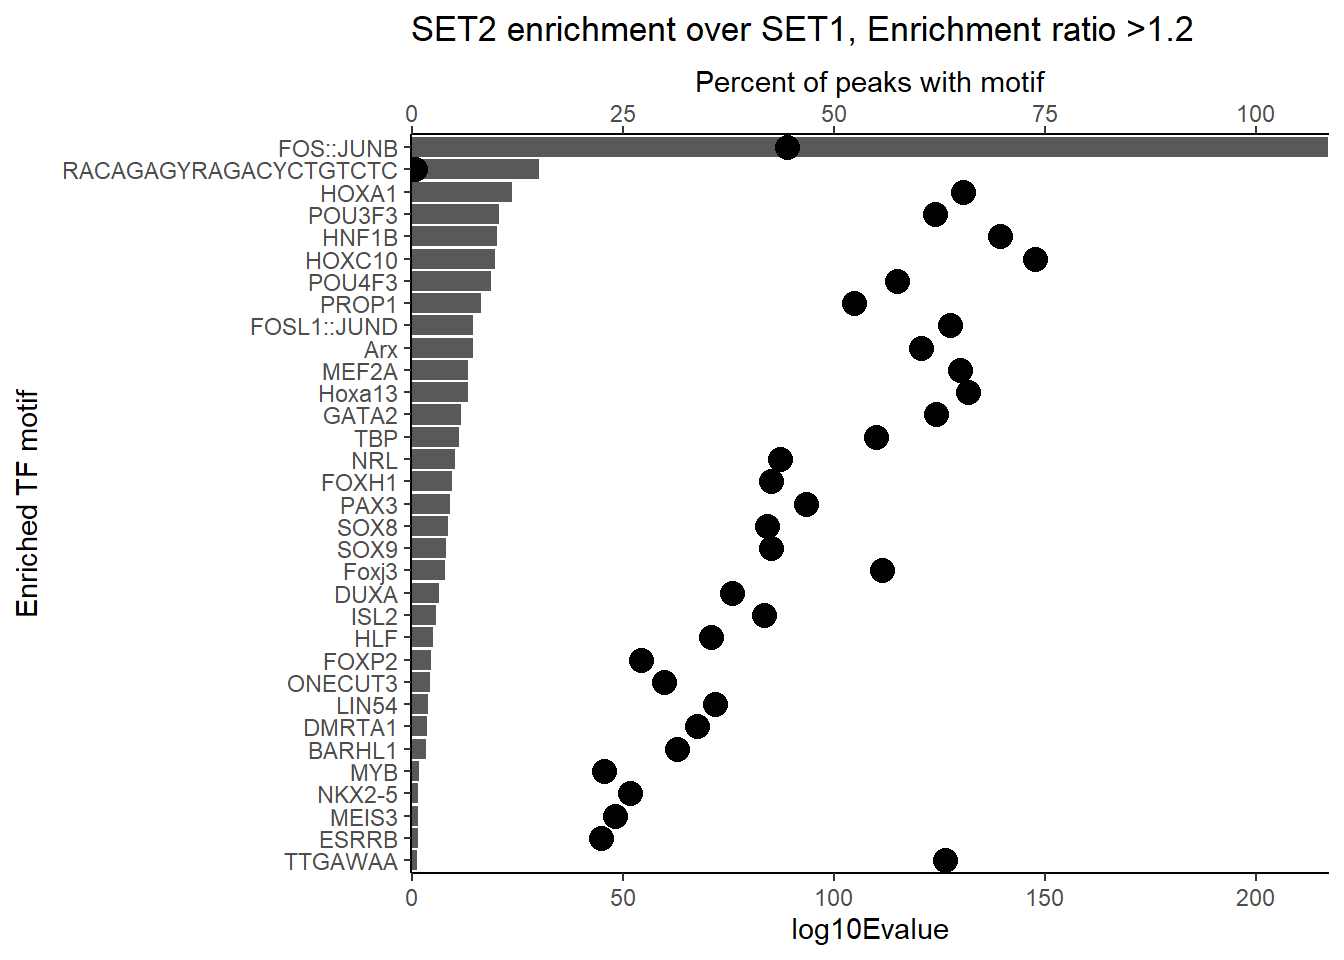
| Version | Author | Date |
|---|---|---|
| c560d24 | reneeisnowhere | 2026-01-15 |
H3K27ac_Set3_data %>%
dplyr::filter(ENR_RATIO>1.2) %>%
group_by(CLUSTER) %>%
slice_min(EVALUE, with_ties = FALSE) %>%
mutate(log10Evalue= log(EVALUE, base = 10)*(-1)) %>%
ggplot(., aes (y= reorder(motif_name,log10Evalue))) +
geom_col(aes(x=log10Evalue))+
geom_point(aes(x=`TP%`*1), size =4)+
scale_x_continuous(expand=c (0,.125),sec.axis = sec_axis(transform= ~./1,name="Percent of peaks with motif"))+
theme_classic()+
ylab("Enriched TF motif")+
ggtitle(paste("SET3 enrichment over SET1, Enrichment ratio > 1.2"))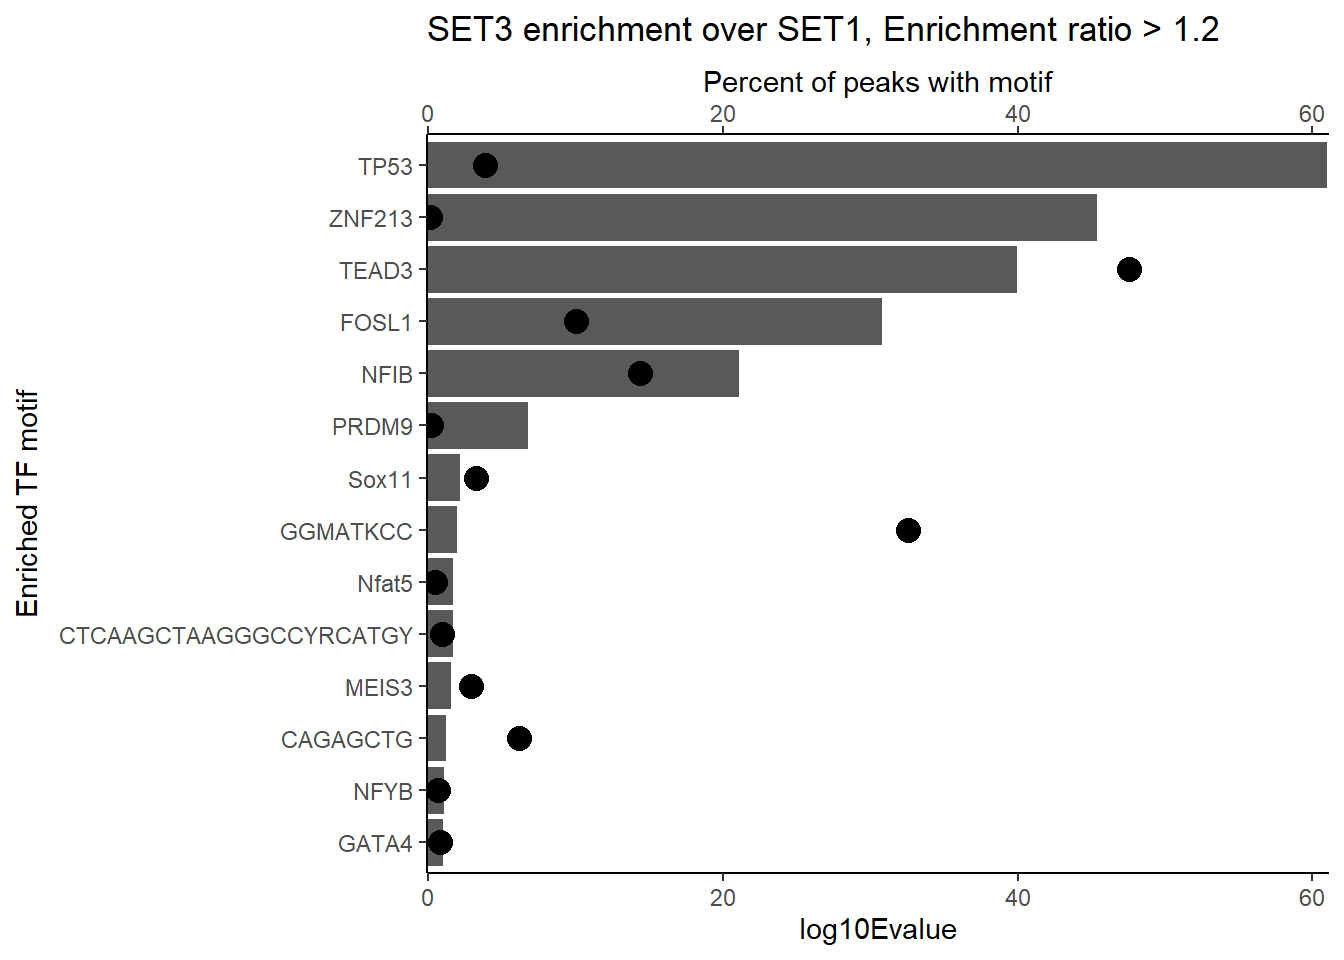
H3K27ac_Set2_data %>%
  dplyr::filter(ENR_RATIO>1.2) %>%
  group_by(CLUSTER) %>%
  slice_min(EVALUE, with_ties = FALSE) %>%
   mutate(log10Evalue= log(EVALUE, base = 10)*(-1)) %>%
  ggplot(., aes (y= reorder(motif_name,log10Evalue))) +
  geom_col(aes(x=log10Evalue))+
  geom_point(aes(x=`TP%`*2), size =4)+
  scale_x_continuous(expand=c (0,.125),sec.axis = sec_axis(transform= ~./2,name="Percent of peaks with motif"))+
  theme_classic()+
  ylab("Enriched TF motif")+
  ggtitle(paste("SET2 enrichment over SET1, Enrichment ratio >1.2"))
| Version | Author | Date |
|---|---|---|
| 3f3d9a4 | reneeisnowhere | 2026-02-02 |
H3K27ac_Set3_data %>%
  dplyr::filter(ENR_RATIO>1.1) %>%
  group_by(CLUSTER) %>%
  slice_min(EVALUE, with_ties = FALSE) %>%
   mutate(log10Evalue= log(EVALUE, base = 10)*(-1)) %>%
  ggplot(., aes (y= reorder(motif_name,log10Evalue))) +
  geom_col(aes(x=log10Evalue))+
  geom_point(aes(x=`TP%`*1), size =4)+
  scale_x_continuous(expand=c (0,.125),sec.axis = sec_axis(transform= ~./1,name="Percent of peaks with motif"))+
  theme_classic()+
  ylab("Enriched TF motif")+
  ggtitle(paste("SET3 enrichment over SET1, Enrichment ratio > 1.1"))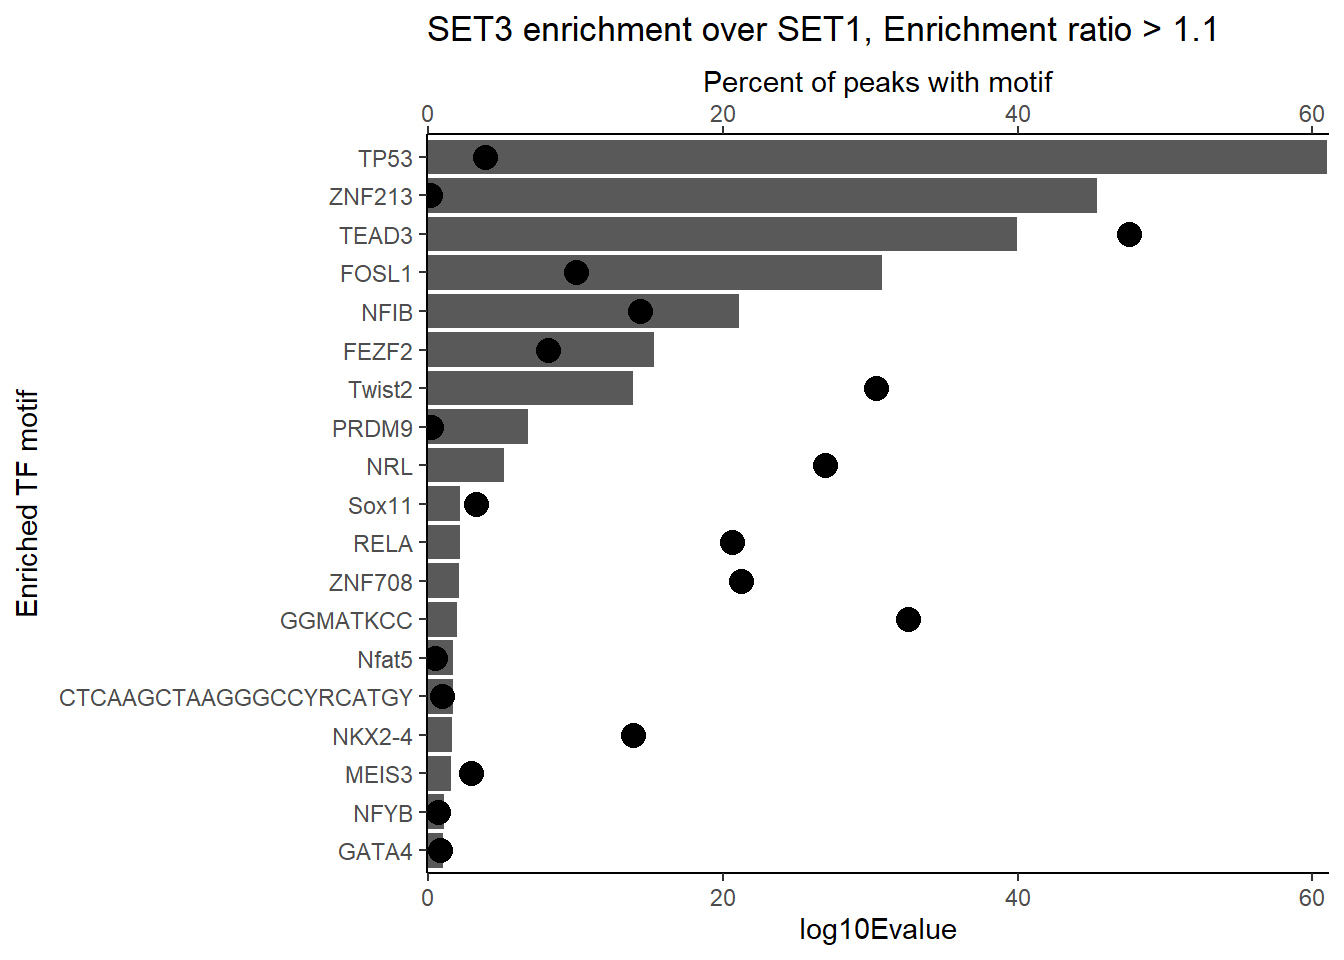
| Version | Author | Date |
|---|---|---|
| 3f3d9a4 | reneeisnowhere | 2026-02-02 |
H3K27ac_Set2_data %>%
  ggplot(., aes (x= ENR_RATIO)) +
  geom_density()+
  # geom_point(aes(x=`TP%`*2), size =4)+
  # scale_x_continuous(expand=c (0,.125),sec.axis = sec_axis(transform= ~./2,name="Percent of peaks with motif"))+
  theme_classic()+
  # ylab("Enriched TF motif")+
  ggtitle(paste("Span of enrichment ratios for Set2"))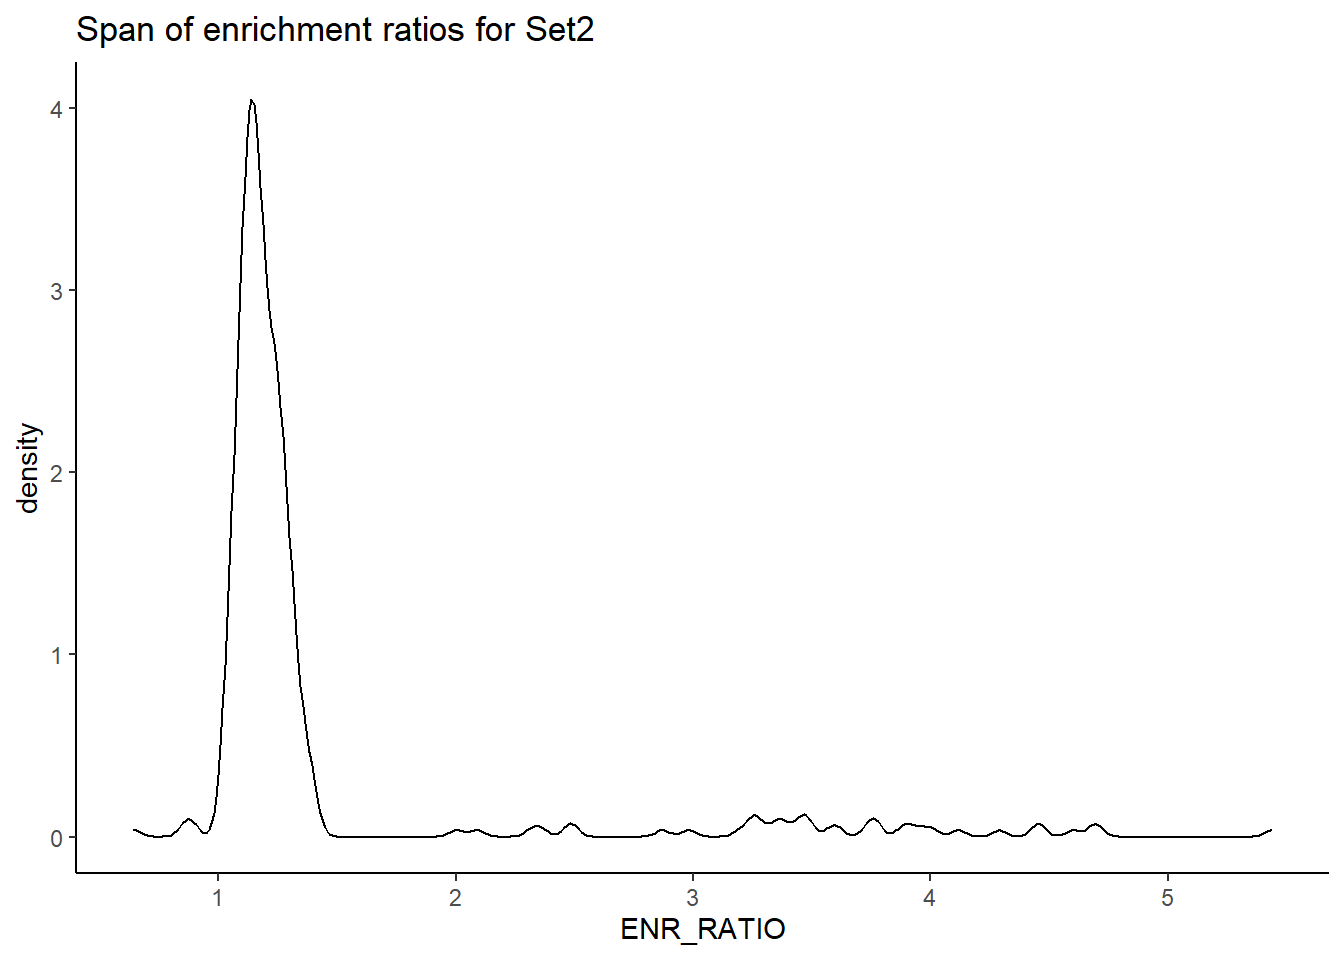
| Version | Author | Date |
|---|---|---|
| c560d24 | reneeisnowhere | 2026-01-15 |
H3K27ac_Set3_data %>%
  ggplot(., aes (x= ENR_RATIO)) +
  geom_density()+
  theme_classic()+
  ggtitle(paste("Span of enrichment ratios for Set3"))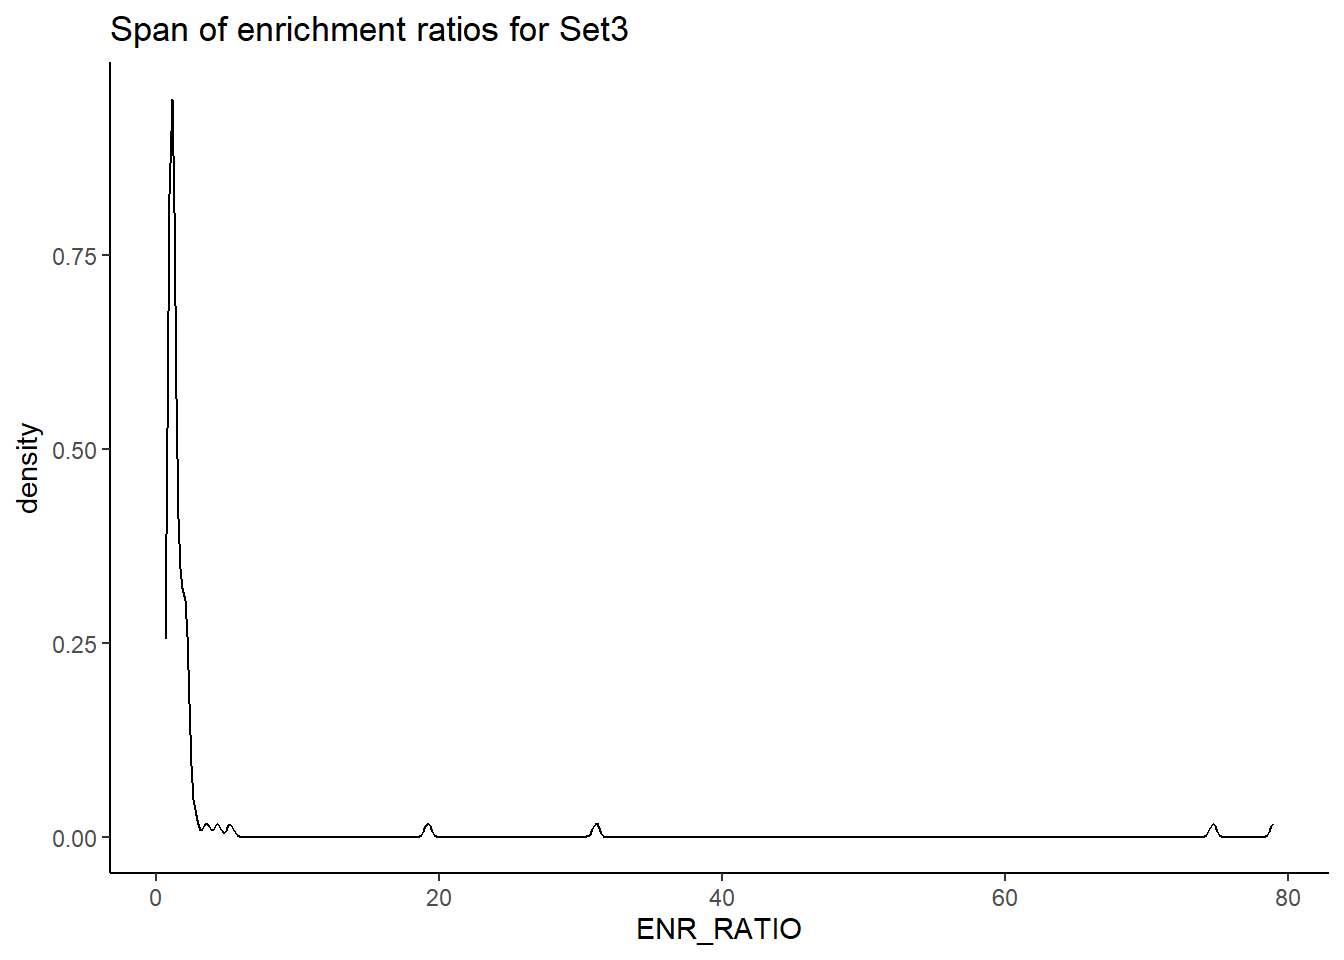
| Version | Author | Date |
|---|---|---|
| c560d24 | reneeisnowhere | 2026-01-15 |
H3K27ac_Set3_data %>%
  ggplot(., aes (x= ENR_RATIO)) +
  geom_density()+
  theme_classic()+
  ggtitle(paste("Span of enrichment ratios for Set3"))+
  coord_cartesian(xlim=c(0,6))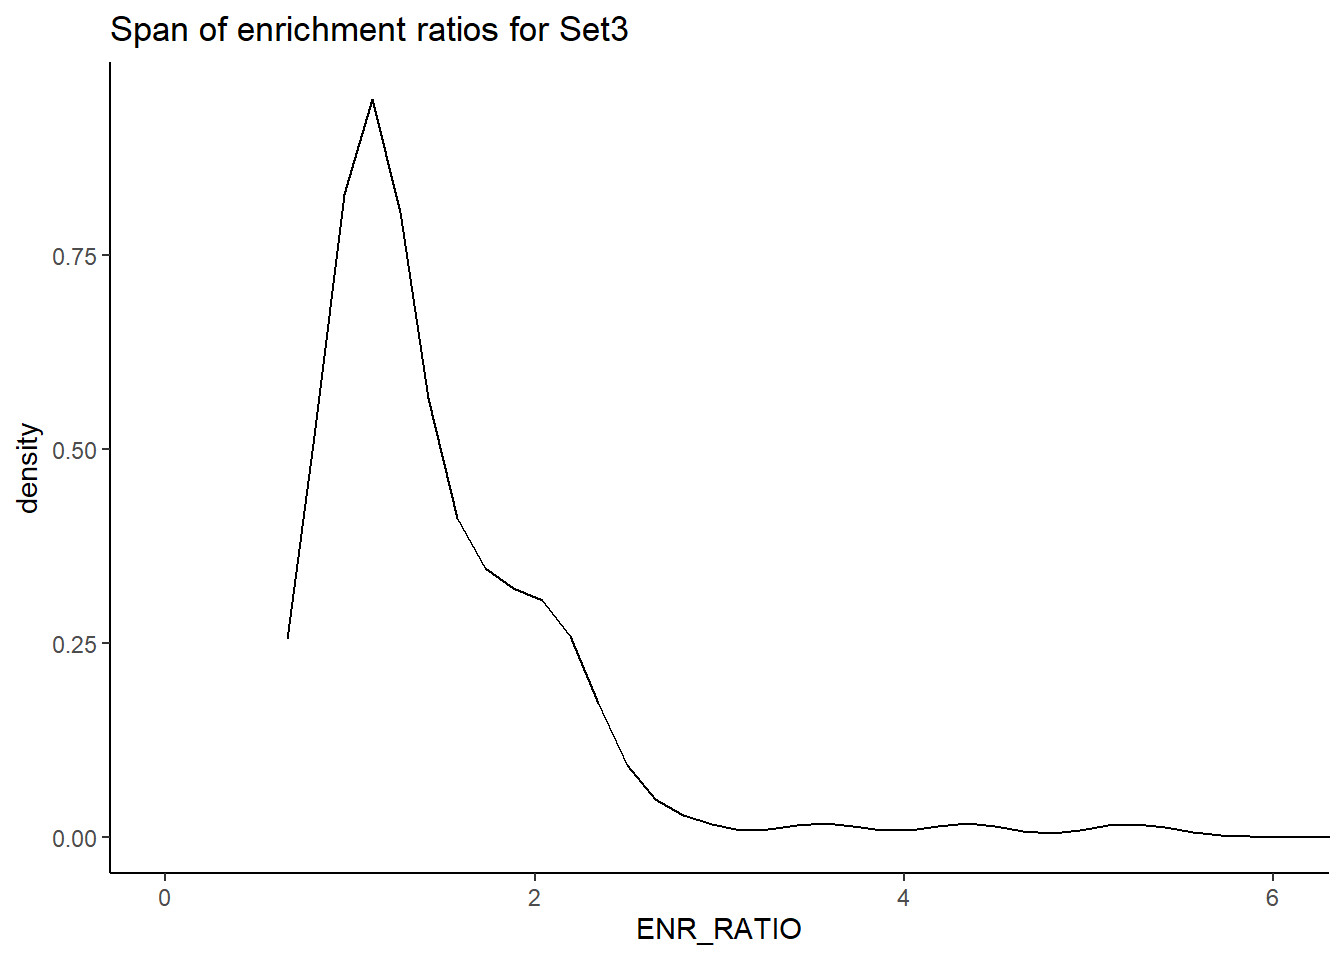
| Version | Author | Date |
|---|---|---|
| c560d24 | reneeisnowhere | 2026-01-15 |
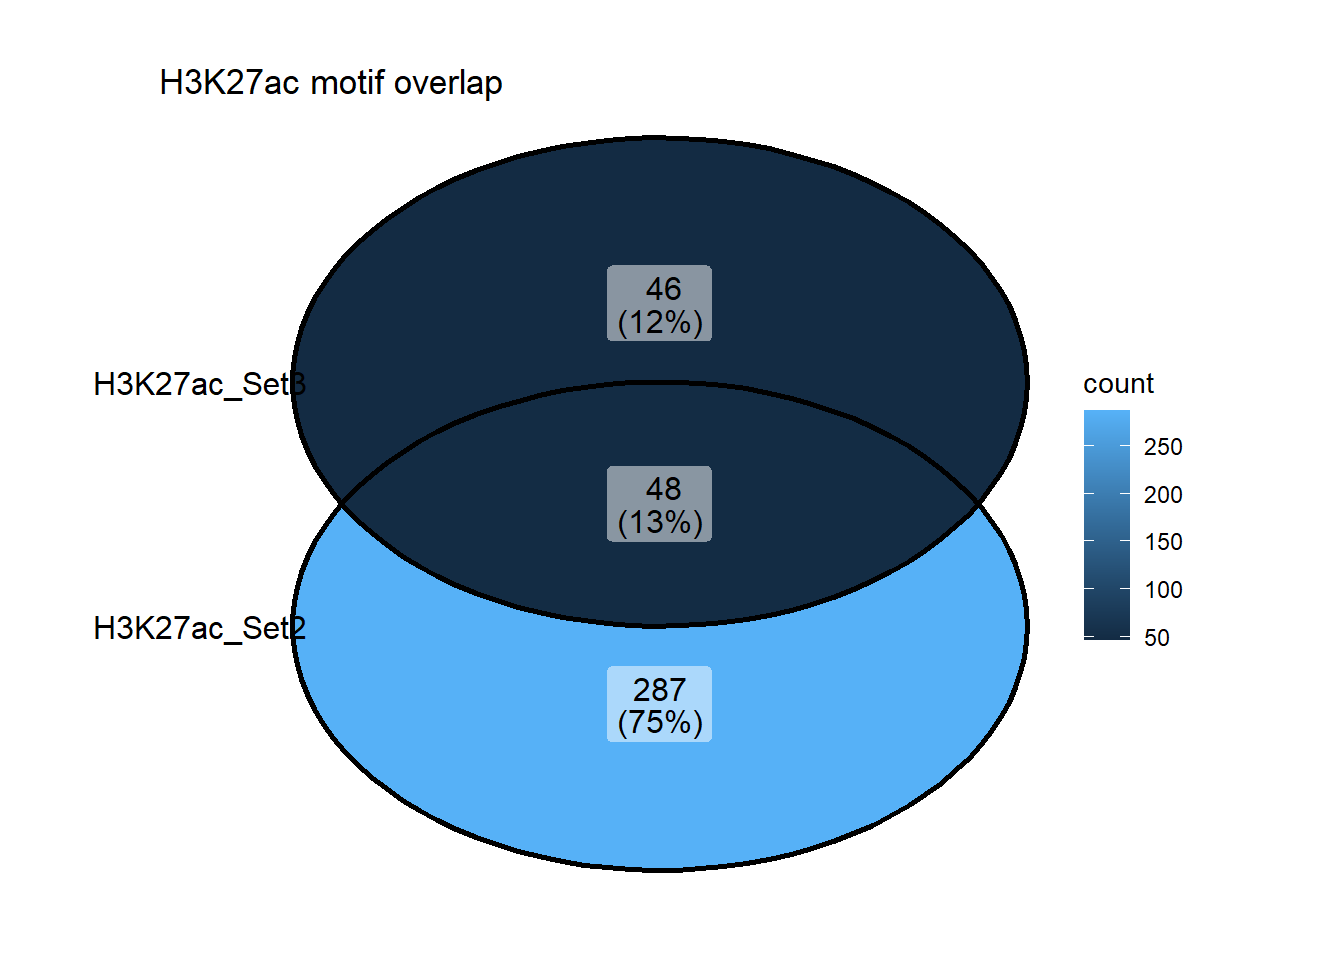
ggVennDiagram::ggVennDiagram(list("H3K27ac_Set2"=H3K27ac_Set2_data$motif_name,"H3K27ac_Set3"=H3K27ac_Set3_data$motif_name))+
  ggtitle("H3K27ac motif overlap")+
  coord_cartesian(clip = "off") +
  theme(
    plot.margin = margin(20, 60, 20, 60)  # top, right, bottom, left
  )
| Version | Author | Date |
|---|---|---|
| c560d24 | reneeisnowhere | 2026-01-15 |
# test_bind
# xstreme_rank_bind
DT::datatable((H3K27ac_Set2_data %>%
  dplyr::select(RANK,CLUSTER,ID,ALT_ID,EVALUE, CONSENSUS)),
  rownames = FALSE,
  caption = htmltools::tags$caption(
    style = "caption-side: top; text-align: left; font-weight: bold;",
    "Method 1: Set 2 H3K27ac"
  ),
  filter = 'top',       # add filter/search boxes
  options = list(
    pageLength = 10,
    autoWidth = FALSE,
    scrollX = TRUE))
DT::datatable((H3K27ac_Set3_data %>%
dplyr::select(RANK,CLUSTER,ID,ALT_ID,EVALUE, CONSENSUS.x)),
rownames = FALSE,
caption = htmltools::tags$caption(
style = "caption-side: top; text-align: left; font-weight: bold;",
"Method 1: Set 3 H3K27ac"
),
filter = 'top', # add filter/search boxes
options = list(
pageLength = 10,
autoWidth = FALSE,
scrollX = TRUE)) H3K27ac_Set2_data %>%
dplyr::filter(EVALUE<0.05) %>%
group_by(CLUSTER) %>%
slice_min(RANK, with_ties = FALSE) %>%
ungroup() %>%
mutate(log10Evalue= log(EVALUE, base = 10)*(-1)) %>%
mutate(Facets=case_when(RANK <15~"A",
log10Evalue >15 & log10Evalue <40~"B",
log10Evalue>40~"C")) %>%
dplyr::filter(Facets=="A") %>%
ggplot(., aes (y= reorder(motif_name, log10Evalue))) +
geom_col(aes(x=log10Evalue))+
geom_point(aes(x=ENR_RATIO*40, color=ENR_RATIO), size =4)+
scale_x_continuous(expand = c(0, .125),
sec.axis = sec_axis(~ . /40, name = "Enrichment Ratio"))+
facet_wrap(~Facets )+
theme_classic()+
ylab("Enriched TF motif")+
ggtitle(paste("SET2 enrichment over SET1\n top Enrichment Ratio by Cluster H3K27ac"))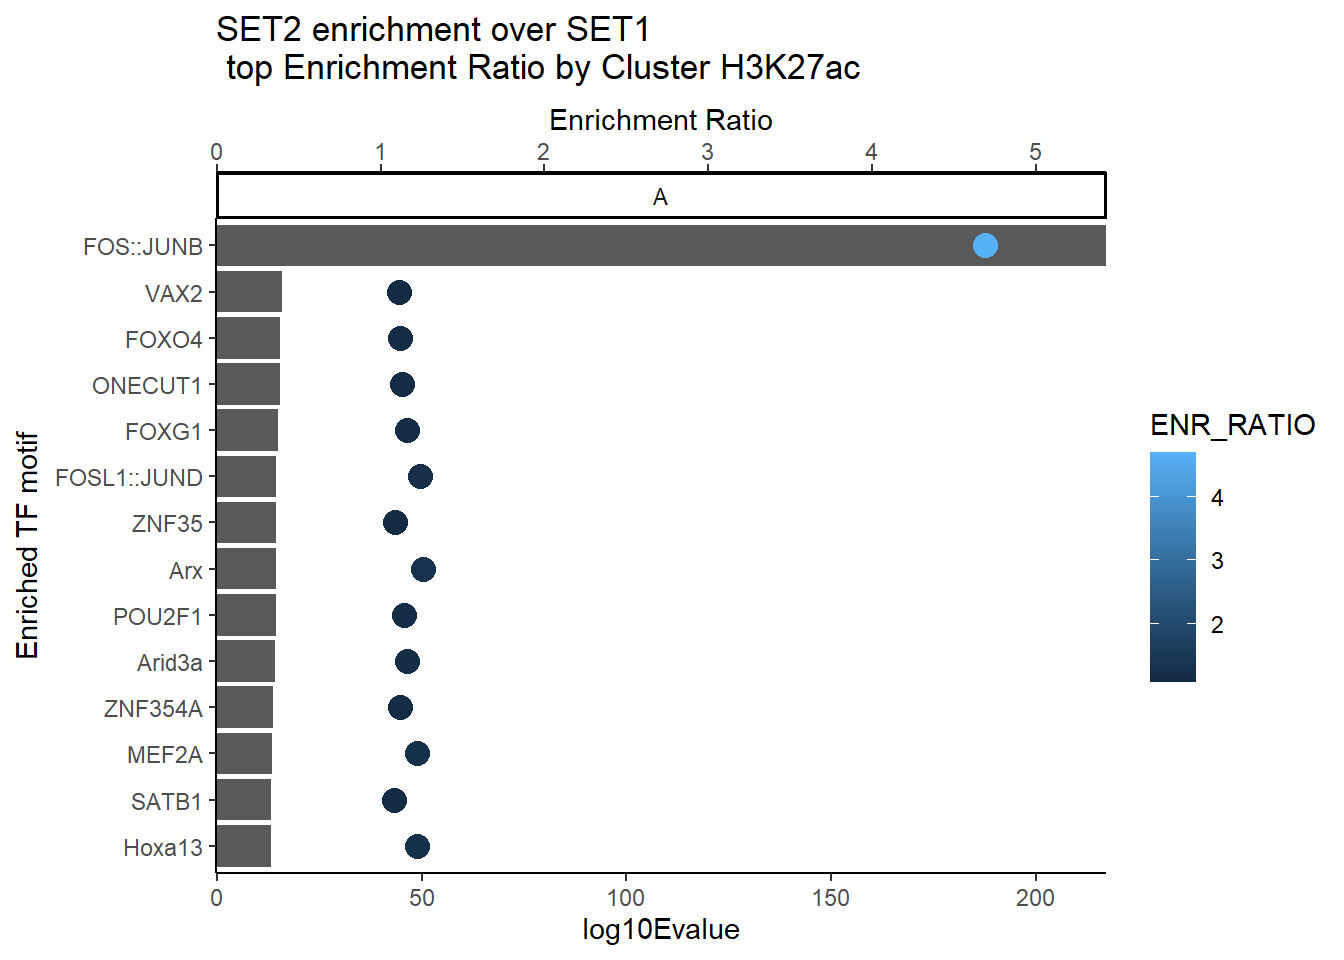
| Version | Author | Date |
|---|---|---|
| 3f3d9a4 | reneeisnowhere | 2026-02-02 |
H3K27ac_Set2_data %>%
dplyr::filter(EVALUE<0.05) %>%
   group_by(CLUSTER) %>%
  slice_min(RANK, with_ties = FALSE) %>%
  ungroup() %>%
   mutate(log10Evalue= log(EVALUE, base = 10)*(-1)) %>%
    mutate(Facets=case_when(RANK <15~"A",
                              log10Evalue >15 & log10Evalue <40~"B",
            log10Evalue>40~"C")) %>%
  dplyr::filter(Facets=="B") %>%
     ggplot(., aes (y= reorder(motif_name, log10Evalue))) +
  geom_col(aes(x=log10Evalue))+
  geom_point(aes(x=ENR_RATIO*10, color=ENR_RATIO), size =4)+

  scale_x_continuous(
  expand = c(0, .125),
  sec.axis = sec_axis(~ . / 10, name = "Enrichment Ratio")
)+
  scale_color_viridis_c(
    name = "Enrichment Ratio",
    option = "plasma") +
  tidytext::scale_y_reordered()+
  facet_wrap(~Facets )+
  theme_classic()+
  ylab("Enriched TF motif")+
  ggtitle(paste("SET2 enrichment over SET1\n top Enrichment Ratio by Cluster H3K27ac"))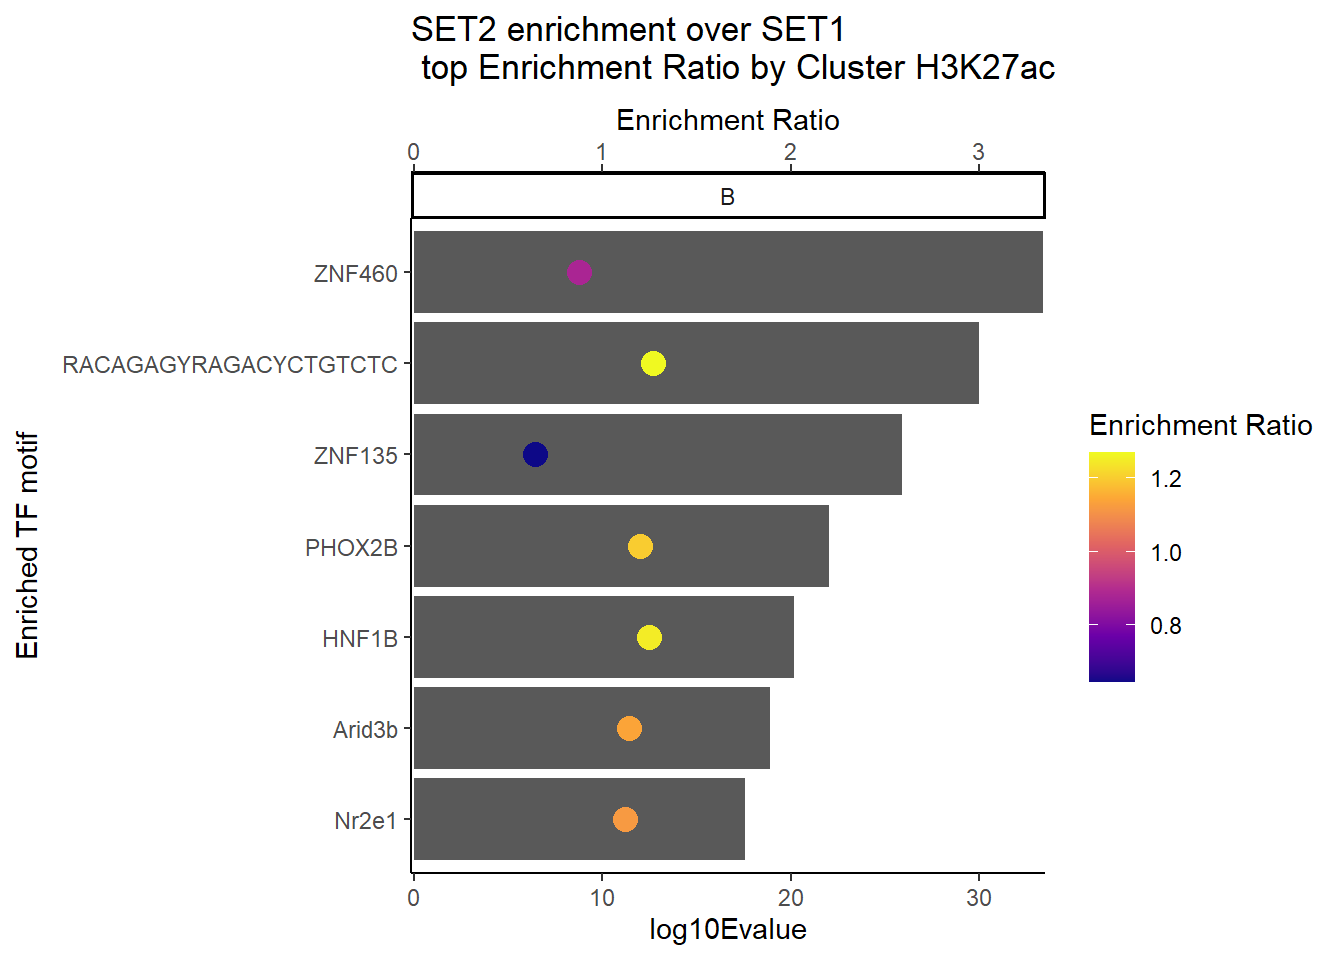
| Version | Author | Date |
|---|---|---|
| 3f3d9a4 | reneeisnowhere | 2026-02-02 |
H3K27ac_Set2_data %>%
dplyr::filter(EVALUE<0.05) %>%
   group_by(CLUSTER) %>%
  slice_min(RANK, with_ties = FALSE) %>%
  ungroup() %>%
   mutate(log10Evalue= log(EVALUE, base = 10)*(-1)) %>%
     mutate(Facets=case_when(RANK <15~"A",
                              log10Evalue >15 & log10Evalue <40~"B",
            log10Evalue>40~"C")) %>%
  dplyr::filter(Facets=="C") %>%
     ggplot(., aes (y= reorder(motif_name, log10Evalue))) +
  geom_col(aes(x=log10Evalue))+
  geom_point(aes(x=ENR_RATIO*.8, color=ENR_RATIO), size =4)+
  scale_x_continuous(
  expand = c(0, .125),
  sec.axis = sec_axis(~ . / .8, name = "Enrichment Ratio")
)+
  scale_color_viridis_c(
    name = "Enrichment Ratio",
    option = "plasma") +
  facet_wrap(~Facets )+
  theme_classic()+
  ylab("Enriched TF motif")+
  ggtitle(paste("SET2 enrichment over SET1\n top Enrichment Ratio by Cluster H3K27ac"))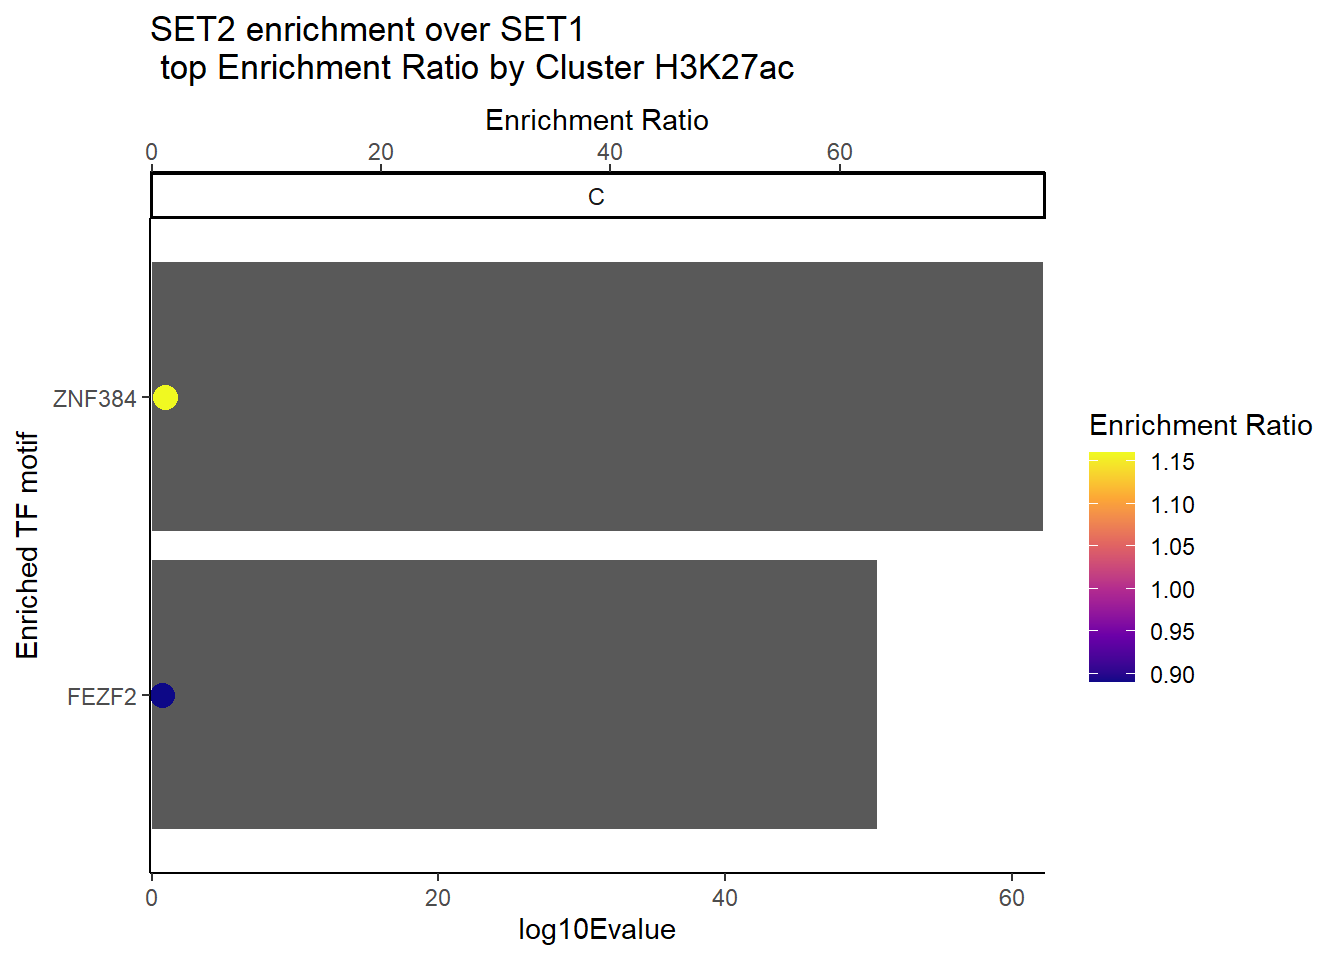
| Version | Author | Date |
|---|---|---|
| 3f3d9a4 | reneeisnowhere | 2026-02-02 |
H3K27ac_Set3_data %>%
dplyr::filter(EVALUE<0.05) %>%
   group_by(CLUSTER) %>%
  slice_min(RANK, with_ties = FALSE) %>%
  ungroup() %>%
   mutate(log10Evalue= log(EVALUE, base = 10)*(-1)) %>%
    mutate(Facets=case_when(log10Evalue >10~"A",
                              log10Evalue <10 & log10Evalue >5~"B",
            log10Evalue<5~"C")) %>%
  dplyr::filter(Facets=="A") %>%
    ggplot(., aes (y= reorder(motif_name, log10Evalue))) +
  geom_col(aes(x=log10Evalue))+
  geom_point(aes(x=ENR_RATIO*10, color=ENR_RATIO), size =4)+
  geom_vline(
  xintercept = 1*10,
  linetype = "dotted",
  linewidth = 1, color="red")+
  scale_x_continuous(
  expand = c(0, .125),
  sec.axis = sec_axis(~ . / 10, name = "Enrichment Ratio")
)+
   scale_color_viridis_c(
    name = "Enrichment Ratio",
    option = "plasma") +
  tidytext::scale_y_reordered()+
  facet_wrap(~Facets )+
  theme_classic()+
  ylab("Enriched TF motif")+
  ggtitle(paste("SET3 enrichment over SET1\n top Enrichment Ratio by Cluster H3K27ac"))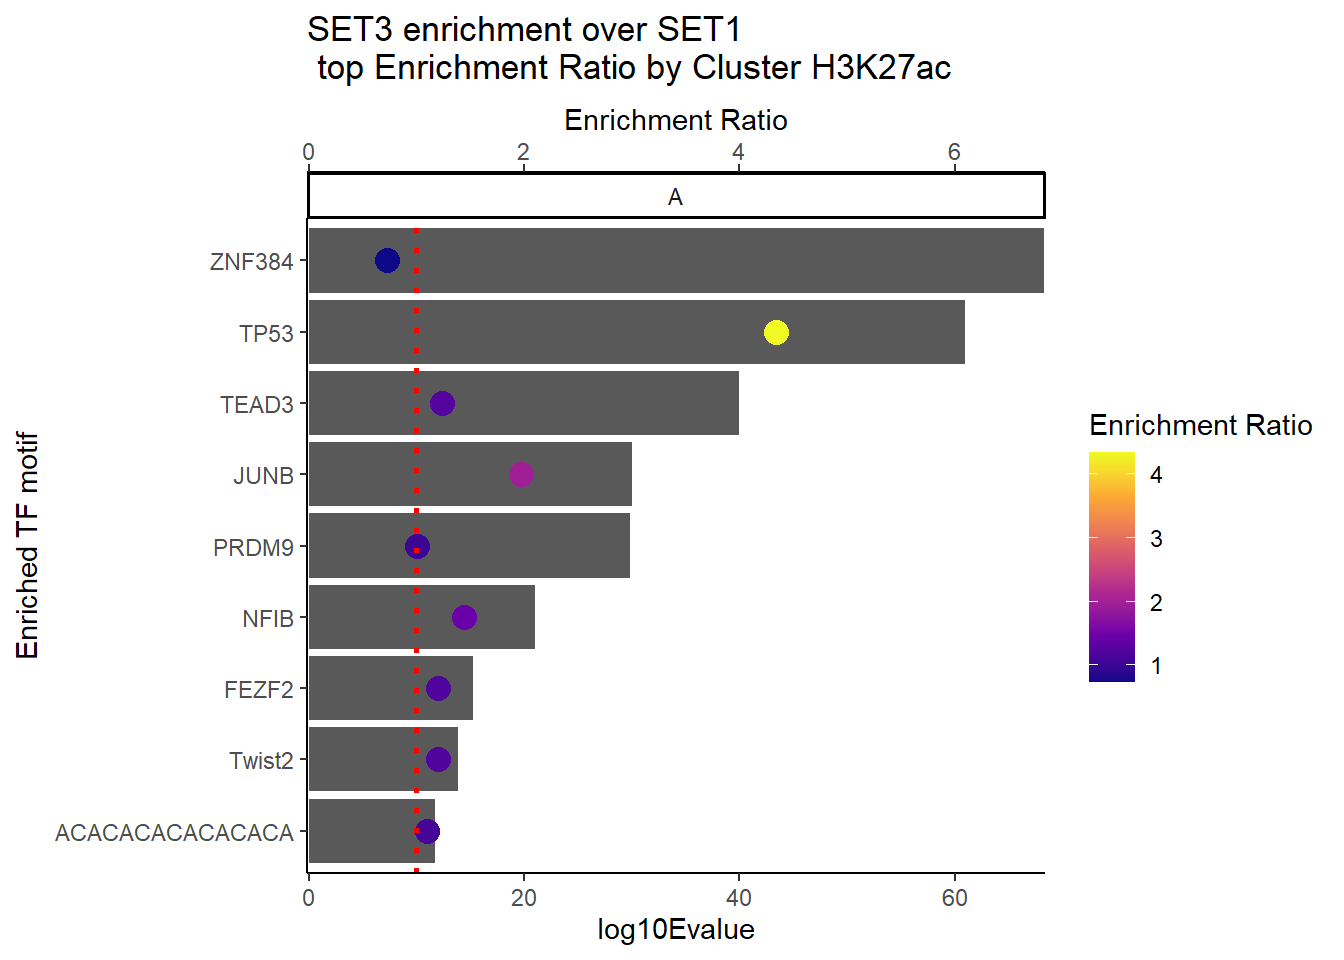
| Version | Author | Date |
|---|---|---|
| 3f3d9a4 | reneeisnowhere | 2026-02-02 |
H3K27ac_Set3_data %>%
  dplyr::filter(EVALUE<0.05) %>%
   group_by(CLUSTER) %>%
  slice_min(RANK, with_ties = FALSE) %>%
  ungroup() %>%
   mutate(log10Evalue= log(EVALUE, base = 10)*(-1)) %>%
    mutate(Facets=case_when(log10Evalue >10~"A",
                              log10Evalue <10 & log10Evalue >5~"B",
            log10Evalue<5~"C")) %>%
  dplyr::filter(Facets=="B") %>%
    ggplot(., aes (y= tidytext::reorder_within(motif_name, log10Evalue, Facets))) +
  geom_col(aes(x=log10Evalue))+
  geom_point(aes(x=ENR_RATIO*5, color=ENR_RATIO), size =4)+
  geom_vline(
  xintercept = 1*5,
  linetype = "dotted",
  linewidth = 1, color="red")+
  scale_x_continuous(
  expand = c(0, .125),
  sec.axis = sec_axis(~ . / 5, name = "Enrichment Ratio")
)+ scale_color_viridis_c(
    name = "Enrichment Ratio",
    option = "plasma"
  ) +
  tidytext::scale_y_reordered()+
  facet_wrap(~Facets )+
  theme_classic()+
  ylab("Enriched TF motif")+
  ggtitle(paste("SET3 enrichment over SET1\n top Enrichment Ratio by Cluster H3K27ac"))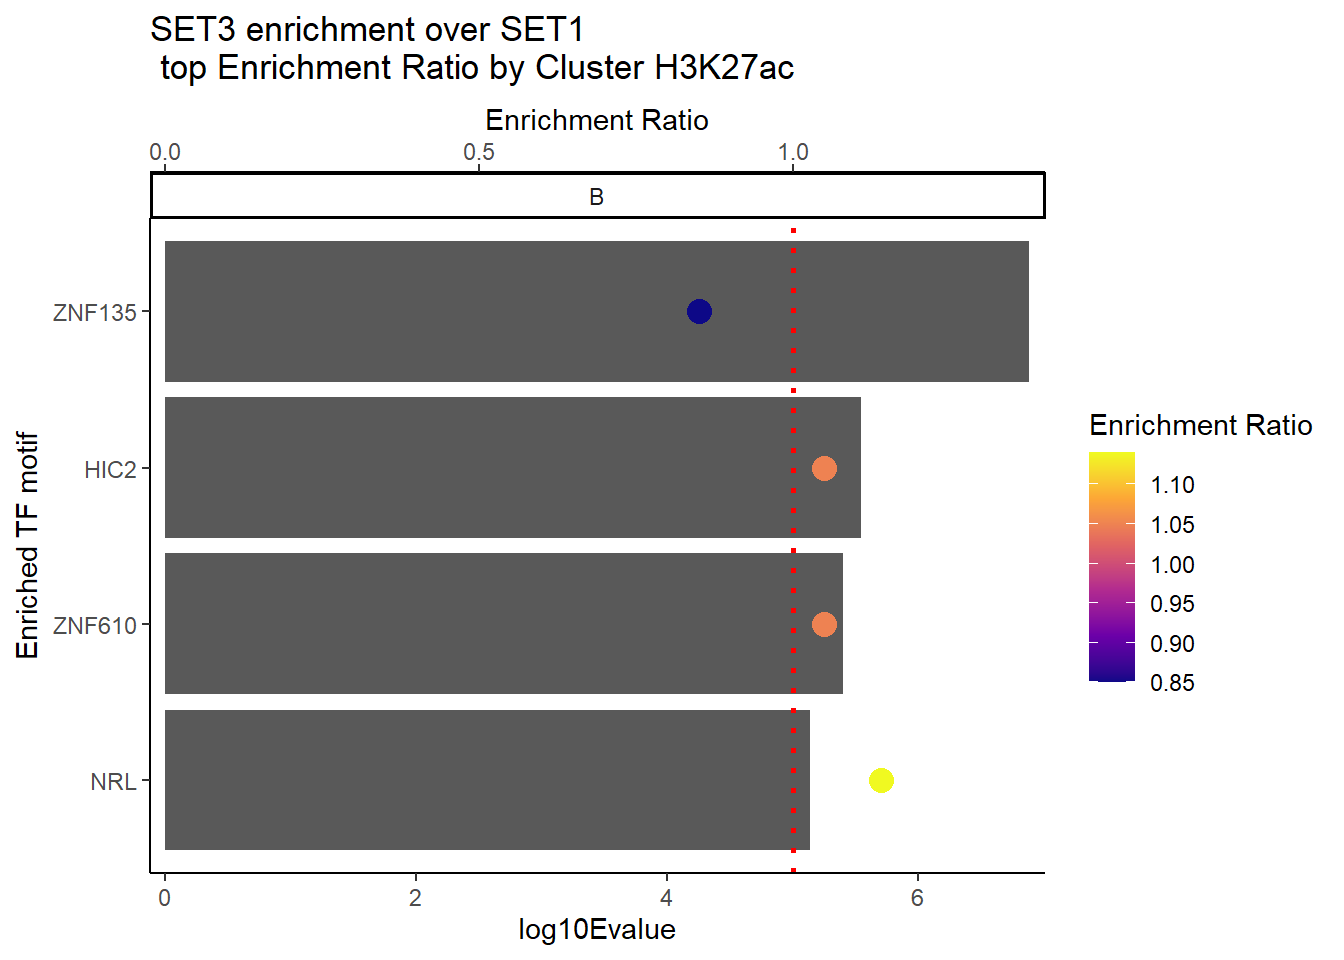
| Version | Author | Date |
|---|---|---|
| 3f3d9a4 | reneeisnowhere | 2026-02-02 |
H3K27ac_Set3_data %>%
dplyr::filter(EVALUE<0.05) %>%
   group_by(CLUSTER) %>%
  slice_min(RANK, with_ties = FALSE) %>%
  ungroup() %>%
   mutate(log10Evalue= log(EVALUE, base = 10)*(-1)) %>%
    mutate(Facets=case_when(log10Evalue >10~"A",
                              log10Evalue <10 & log10Evalue >5~"B",
            log10Evalue<5~"C")) %>%
  dplyr::filter(Facets=="C") %>%
    ggplot(., aes (y= tidytext::reorder_within(motif_name, log10Evalue, Facets))) +
  geom_col(aes(x=log10Evalue))+
  geom_point(aes(x=ENR_RATIO*.05,color= pmin(ENR_RATIO, 5)), size =4)+
  scale_x_continuous(
  expand = c(0, .125),
  sec.axis = sec_axis(~ . /.05, name = "Enrichment Ratio")
)+
   scale_color_viridis_c(
    name = "Enrichment Ratio",
    option = "plasma"
  ) +
  tidytext::scale_y_reordered()+
  facet_wrap(~Facets )+
  theme_classic()+
  ylab("Enriched TF motif")+
  ggtitle(paste("SET3 enrichment over SET1\n top Enrichment Ratio by Cluster H3K27ac"))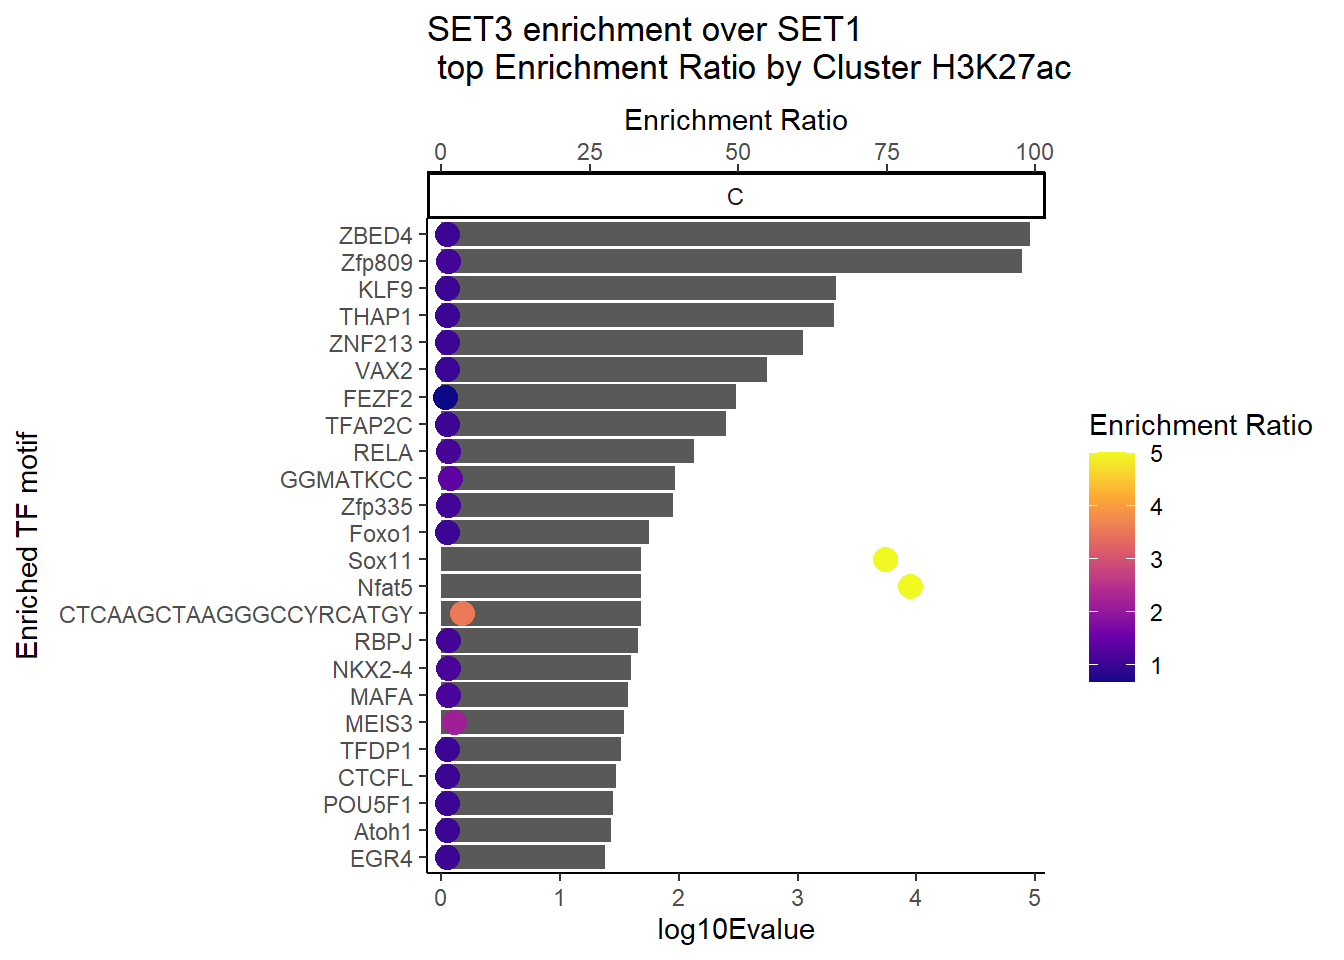
| Version | Author | Date |
|---|---|---|
| 3f3d9a4 | reneeisnowhere | 2026-02-02 |
plot_topnum_ratio_full <- function(df, title = NULL, signif.num = 0.05,top_num=20, color_limits = NULL){

  ### getting the name of the data frame for plotting
 if (is.null(title)) {
    title <- deparse(substitute(df))
 }


  ### Getting the data ready
  plot_df <- df %>%
    dplyr::filter(EVALUE < signif.num) %>%
    group_by(CLUSTER) %>%
    slice_min(RANK, with_ties = FALSE) %>%
    ungroup() %>%
    mutate(log10Evalue = -log10(EVALUE)) %>%
    arrange(desc(log10Evalue)) %>%
    mutate(motif_name_wrapped = stringr::str_wrap(motif_name, width = 10)) %>%
     mutate(
    enr_shape = ifelse(ENR_RATIO > 1, "Enriched", "Depleted")) %>%
    slice_head(., n=top_num)
#
  scaler <- max(plot_df$log10Evalue) / max(plot_df$ENR_RATIO)

  ##plotting the data
   ggplot(plot_df, aes(y = reorder(motif_name_wrapped, log10Evalue))) +
    geom_col(aes(x = log10Evalue)) +
    geom_point(aes(x = ENR_RATIO* scaler, color = ENR_RATIO, shape = enr_shape), size = 4)+
    scale_x_continuous(
      expand = c(0, .125),
      sec.axis = sec_axis(~ . / scaler, name = "Enrichment Ratio")
    ) +
   scale_color_viridis_c(
  name = "Enrichment Ratio",
  option = "plasma",
  limits = color_limits,
  oob = scales::squish
)+
    scale_y_discrete(labels = function(x) stringr::str_wrap(gsub("__.*$", "", x), width = 10)) +
     scale_shape_manual(values = c("Enriched" = 16, "Depleted" = 17))+
    theme_classic() +
    ylab("Enriched TF motif") +
    ggtitle(paste(title, "-", top_num))
}
plot_A <- plot_topnum_ratio_full(H3K27ac_Set3_data,signif.num = 0.05, top_num = 10)
plot_B <- plot_topnum_ratio_full(H3K27ac_Set2_data,signif.num = 0.05, top_num = 10)
aligned_plots <- cowplot::align_plots(plot_A, plot_B, align = "v", axis = "l")
cowplot::plot_grid(aligned_plots[[1]],
aligned_plots[[2]],
ncol = 2)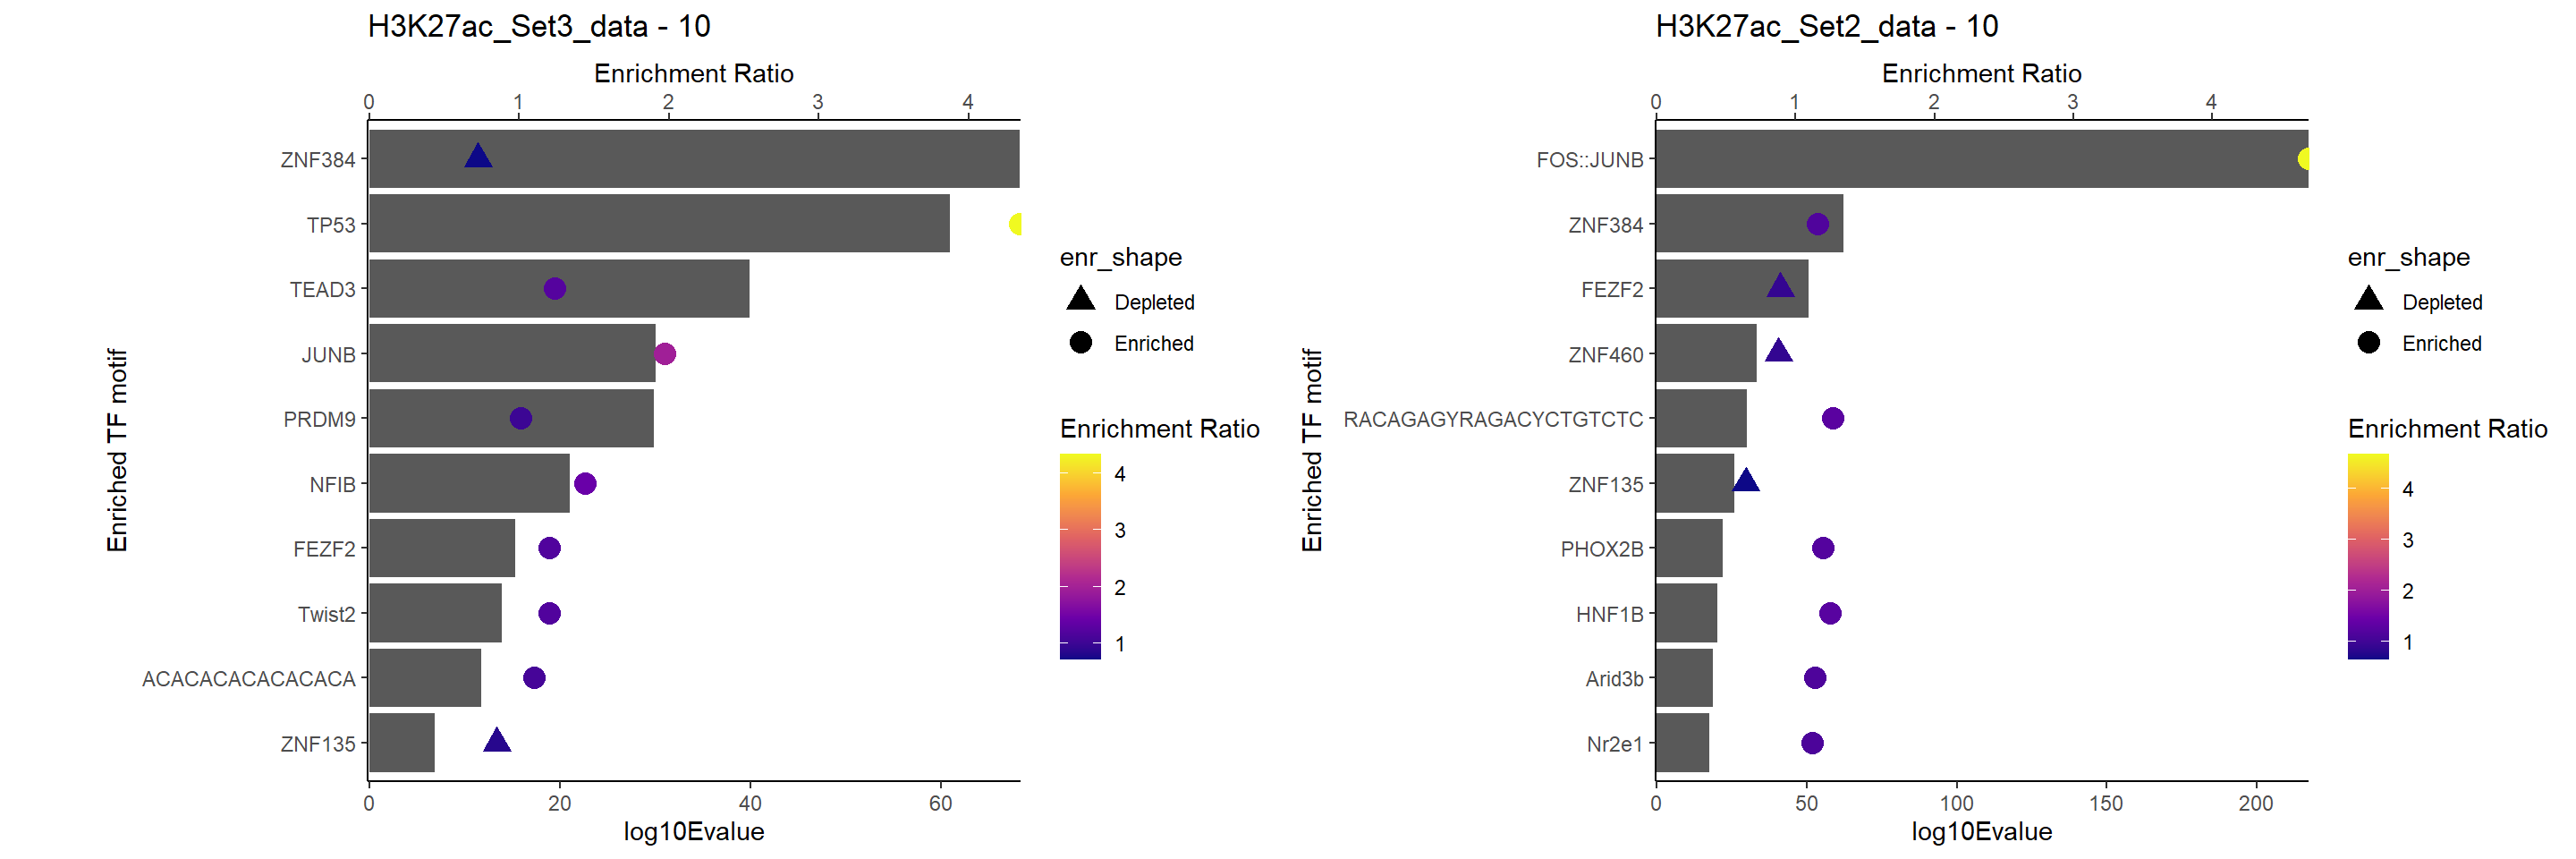
| Version | Author | Date |
|---|---|---|
| 7840a6d | reneeisnowhere | 2026-02-12 |
RNA filtering
RNA_full_toptable <-  readRDS("data/Other_paper_data/RNA_full_toptable.RDS")

RNA_expressed <- RNA_full_toptable %>%
  dplyr::select(Entrez_ID, SYMBOL)

### had to add in a special filter to account for the :: in the names of the motifs
symbols <- str_to_upper(RNA_expressed$SYMBOL)

filtered_H3K27ac_Set3_data <- H3K27ac_Set3_data %>%
  ##create the motif-tokens column so I can keep names where there is a partial match in the RNA Symbols
  mutate(motif_tokens = str_split(str_to_upper(motif_name), "::")) %>%
  ##Because this is a list, now I need to filter using sapply, but then remove the motif token column
  filter(sapply(motif_tokens, function(x) any(x %in% symbols))) %>%
  select(-motif_tokens)


filtered_H3K27ac_Set2_data <- H3K27ac_Set2_data %>%
  mutate(motif_tokens = str_split(str_to_upper(motif_name), "::")) %>%
  filter(sapply(motif_tokens, function(x) any(x %in% symbols))) %>%
  select(-motif_tokens)


## binding both together to get them to set a global limit on the secondary axis using quantiles so color range is identical
global_combo <- bind_rows(filtered_H3K27ac_Set2_data, filtered_H3K27ac_Set3_data)

global_limits <-  quantile(global_combo$ENR_RATIO, probs = c(0.05, 0.95), na.rm = TRUE)
### plot seperately
  filt_A <- plot_topnum_ratio_full(filtered_H3K27ac_Set3_data,signif.num = 0.05, top_num = 10,color_limits = global_limits)

  filt_B <- plot_topnum_ratio_full(filtered_H3K27ac_Set2_data,signif.num = 0.05, top_num = 10,color_limits = global_limits)
 ## Good ole cowplot to align plots vertically
  aligned_filt_plots <- cowplot::align_plots(filt_A, filt_B, align = "v", axis = "l")

cowplot::plot_grid(aligned_filt_plots[[1]],
          aligned_filt_plots[[2]],
          ncol = 2)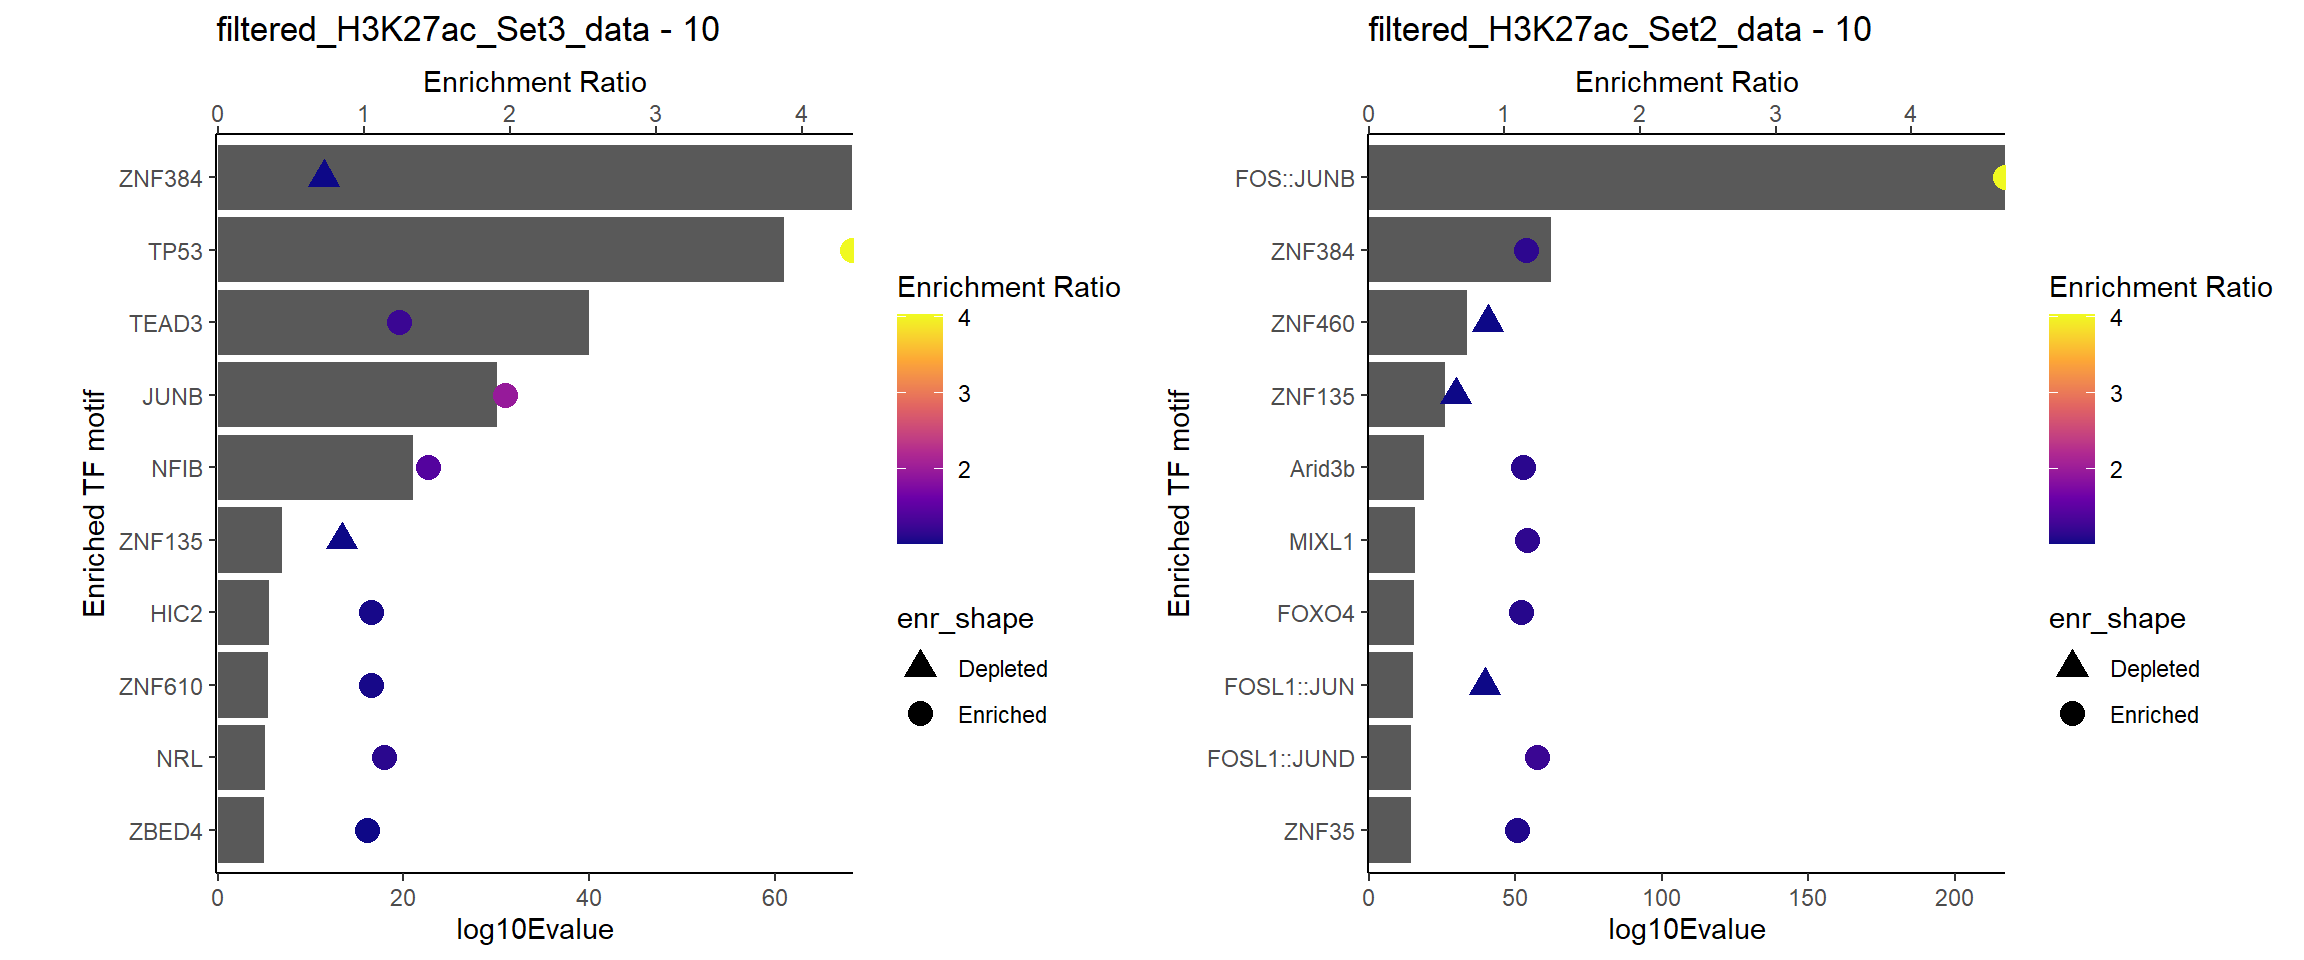
| Version | Author | Date |
|---|---|---|
| e7a3fff | reneeisnowhere | 2026-02-18 |
Case and Summit calls method 1, subset A and B
This section looks at the enrichment of A and B cases of each
Set.
Case A is defined as all ROIs with an LFC > 0 at each timepoint. Case
B is defined as all ROIs with an LFC < 0 at each timepoint. Case C is
defined as all other ROIs. The List of ROI summits was filtered for ROI
that fit these cases, and enrichment was done using xstreme on TACC for
each set-case compared to all of set1.
Because I have so many sets, I am now creating a function to import/visualize each section:
import_function <- function(set_description, base_dir = "C:/Users/renee/Other_projects_data/DXR_data/H3K27ac") {

  sea_disc_out <-read_delim(
    file.path(base_dir, set_description, "sea_disc_out", "sea.tsv"),
    delim = "\t", trim_ws = TRUE
  ) %>%
    mutate(source = "disc") %>%
    slice(1:(dplyr::n() - 3))

  sea_known <-read_delim(
    file.path(base_dir, set_description, "sea_out", "sea.tsv"),
    delim = "\t", trim_ws = TRUE
  ) %>%
    mutate(source = "known") %>%
    slice(1:(dplyr::n() - 3))


  xstreme <- read_delim(
    file.path(base_dir, set_description, "xstreme.tsv"),
    delim = "\t", trim_ws = TRUE
  ) %>%
    mutate(source = "all") %>%
    slice(1:(dplyr::n() - 3))


 #### adding in later fuctions
  tomtom <- read_delim(
    file.path(base_dir, set_description, "streme_tomtom_out", "tomtom.tsv"),
    delim = "\t", trim_ws = TRUE
  )
### function to renormalize dataframes before the join

  clean_consensus <- function(x) {
  stringr::str_remove(x, "^\\d+-")
}
bind_df <- bind_rows(sea_disc_out, sea_known) %>%
   mutate(CONSENSUS = clean_consensus(CONSENSUS)) %>%
  dplyr::select(DB:ENR_RATIO) %>%
  distinct(ID, ALT_ID, ENR_RATIO, .keep_all = TRUE)


set_data <- xstreme %>%
   mutate(CONSENSUS = clean_consensus(CONSENSUS)) %>%
  dplyr::select(RANK:CLUSTER,ID:CONSENSUS,EVALUE,SIM_MOTIF,MOTIF_URL) %>%
  mutate(MOTIF_URL=str_replace(MOTIF_URL,"https://jaspar2024.elixir.no/matrix/","")) %>%
  mutate(motif_name=case_when(
    str_detect(SIM_MOTIF, "\\(") ~ str_extract(SIM_MOTIF, "(?<=\\().+?(?=\\))"),
    str_detect(SIM_MOTIF, "^MA\\d+\\.\\d+") ~ ALT_ID,
    str_detect(SIM_MOTIF, "^\\d+-") ~ str_replace(SIM_MOTIF, "^\\d+-", ""),
  TRUE ~ SIM_MOTIF)) %>%
  left_join(bind_df,by = c("ALT_ID",
                           "ID","CONSENSUS")) %>%
  mutate(diff_per=`TP%` -`FP%`)

return(list(
  sea = bind_df,
  xstreme = set_data))

}
H3K27ac_set2_A<- import_function("H3K27ac_set2_A_400",base_dir = "C:/Users/renee/Other_projects_data/DXR_data/H3K27ac")
H3K27ac_set2_B<- import_function("H3K27ac_set2_B_400",base_dir = "C:/Users/renee/Other_projects_data/DXR_data/H3K27ac")
H3K27ac_set3_A<- import_function("H3K27ac_set3_A_400",base_dir = "C:/Users/renee/Other_projects_data/DXR_data/H3K27ac")
H3K27ac_set3_B<- import_function("H3K27ac_set3_B_400",base_dir = "C:/Users/renee/Other_projects_data/DXR_data/H3K27ac")
DT::datatable((H3K27ac_set2_A$xstreme %>%
dplyr::select(RANK,CLUSTER,ID,ALT_ID,EVALUE, CONSENSUS)),
rownames = FALSE,
caption = htmltools::tags$caption(
style = "caption-side: top; text-align: left; font-weight: bold;",
"Method 1: Set 2A H3K27ac"
),
filter = 'top', # add filter/search boxes
options = list(
pageLength = 10,
autoWidth = FALSE,
scrollX = TRUE)) ###Code below for testing issues in the function. this helped fix the consensus .x .y issue.
# all(rest_test$xstreme$CONSENSUS.x == rest_test$xstreme$CONSENSUS.y, na.rm = TRUE)
#
# rest_test$xstreme%>%
# summarise(
# n_total = dplyr::n(),
# n_match = sum(CONSENSUS.x == CONSENSUS.y, na.rm = TRUE),
# n_diff = sum(CONSENSUS.x != CONSENSUS.y, na.rm = TRUE)
# )
DT::datatable((H3K27ac_set2_B$xstreme %>%
dplyr::select(RANK,CLUSTER,ID,ALT_ID,EVALUE, CONSENSUS)),
rownames = FALSE,
caption = htmltools::tags$caption(
style = "caption-side: top; text-align: left; font-weight: bold;",
"Method 1: Set 2B H3K27ac"
),
filter = 'top', # add filter/search boxes
options = list(
pageLength = 10,
autoWidth = FALSE,
scrollX = TRUE)) DT::datatable((H3K27ac_set3_A$xstreme %>%
dplyr::select(RANK,CLUSTER,ID,ALT_ID,EVALUE, CONSENSUS)),
rownames = FALSE,
caption = htmltools::tags$caption(
style = "caption-side: top; text-align: left; font-weight: bold;",
"Method 1: Set 3A H3K27ac"
),
filter = 'top', # add filter/search boxes
options = list(
pageLength = 10,
autoWidth = FALSE,
scrollX = TRUE)) DT::datatable((H3K27ac_set3_B$xstreme %>%
dplyr::select(RANK,CLUSTER,ID,ALT_ID,EVALUE, CONSENSUS)),
rownames = FALSE,
caption = htmltools::tags$caption(
style = "caption-side: top; text-align: left; font-weight: bold;",
"Method 1: Set 3B H3K27ac"
),
filter = 'top', # add filter/search boxes
options = list(
pageLength = 10,
autoWidth = FALSE,
scrollX = TRUE)) plot_ENR_RATIO <- function(df, title = NULL, signif.num = 0.05, page = 1){
### getting the name of the data frame for plotting
if (is.null(title)) {
title <- deparse(substitute(df))
}
### Getting the data ready
plot_df <- df$xstreme %>%
dplyr::filter(EVALUE < signif.num) %>%
group_by(CLUSTER) %>%
slice_min(RANK, with_ties = FALSE) %>%
ungroup() %>%
mutate(log10Evalue = -log10(EVALUE)) %>%
arrange(desc(log10Evalue)) %>%
mutate(Facets = cut(
log10Evalue,
breaks = quantile(log10Evalue, probs = c(0, 0.33, 0.66, 1), na.rm = TRUE),
labels = c("Low", "Medium", "High"),
include.lowest = TRUE
)) %>%
mutate(motif_name_wrapped = stringr::str_wrap(motif_name, width = 10)) %>%
mutate(
enr_shape = ifelse(ENR_RATIO > 1, "Enriched", "Depleted")
)
scaler <- max(plot_df$log10Evalue) / max(plot_df$ENR_RATIO)
facet_levels <- levels(plot_df$Facets)
if(page > length(facet_levels)) stop("page number exceeds available facets")
facet_name <- facet_levels[page]
##plotting the data
ggplot(plot_df, aes(y = tidytext::reorder_within(motif_name, log10Evalue, Facets))) +
geom_col(aes(x = log10Evalue)) +
geom_point(aes(x = ENR_RATIO * scaler, color = ENR_RATIO, shape = enr_shape), size = 4)+
scale_x_continuous(
expand = c(0, .125),
sec.axis = sec_axis(~ . / scaler, name = "Enrichment Ratio")
) +
scale_color_viridis_c(name = "Enrichment Ratio", option = "plasma") +
scale_y_discrete(labels = function(x) stringr::str_wrap(gsub("__.*$", "", x), width = 10)) +
ggforce::facet_wrap_paginate(
~Facets,
ncol = 1,
nrow = 1,
page = page,
scales = "free_y"
) +
scale_shape_manual(values = c("Enriched" = 16, "Depleted" = 17))+
theme_classic() +
ylab("Enriched TF motif") +
ggtitle(paste(title, "-", facet_name))
}
########################################################
plot_topnum_RATIO <- function(df, title = NULL, signif.num = 0.05,top_num=20){
### getting the name of the data frame for plotting
if (is.null(title)) {
title <- deparse(substitute(df))
}
### Getting the data ready
plot_df <- df$xstreme %>%
dplyr::filter(EVALUE < signif.num) %>%
group_by(CLUSTER) %>%
slice_min(RANK, with_ties = FALSE) %>%
ungroup() %>%
mutate(log10Evalue = -log10(EVALUE)) %>%
arrange(desc(log10Evalue)) %>%
mutate(motif_name_wrapped = stringr::str_wrap(motif_name, width = 10)) %>%
mutate(
enr_shape = ifelse(ENR_RATIO > 1, "Enriched", "Depleted")) %>%
slice_head(., n=top_num)
#
scaler <- max(plot_df$log10Evalue) / max(plot_df$ENR_RATIO)
##plotting the data
ggplot(plot_df, aes(y = reorder(motif_name, log10Evalue))) +
geom_col(aes(x = log10Evalue)) +
geom_point(aes(x = ENR_RATIO* scaler, color = ENR_RATIO, shape = enr_shape), size = 4)+
scale_x_continuous(
expand = c(0, .125),
sec.axis = sec_axis(~ . / scaler, name = "Enrichment Ratio")
) +
scale_color_viridis_c(name = "Enrichment Ratio", option = "plasma") +
scale_y_discrete(labels = function(x) stringr::str_wrap(gsub("__.*$", "", x), width = 10)) +
scale_shape_manual(values = c("Enriched" = 16, "Depleted" = 17))+
theme_classic() +
ylab("Enriched TF motif") +
ggtitle(paste(title, "-", top_num))
}plot_ENR_RATIO(H3K27ac_set2_A, signif.num = 0.05, page = 3)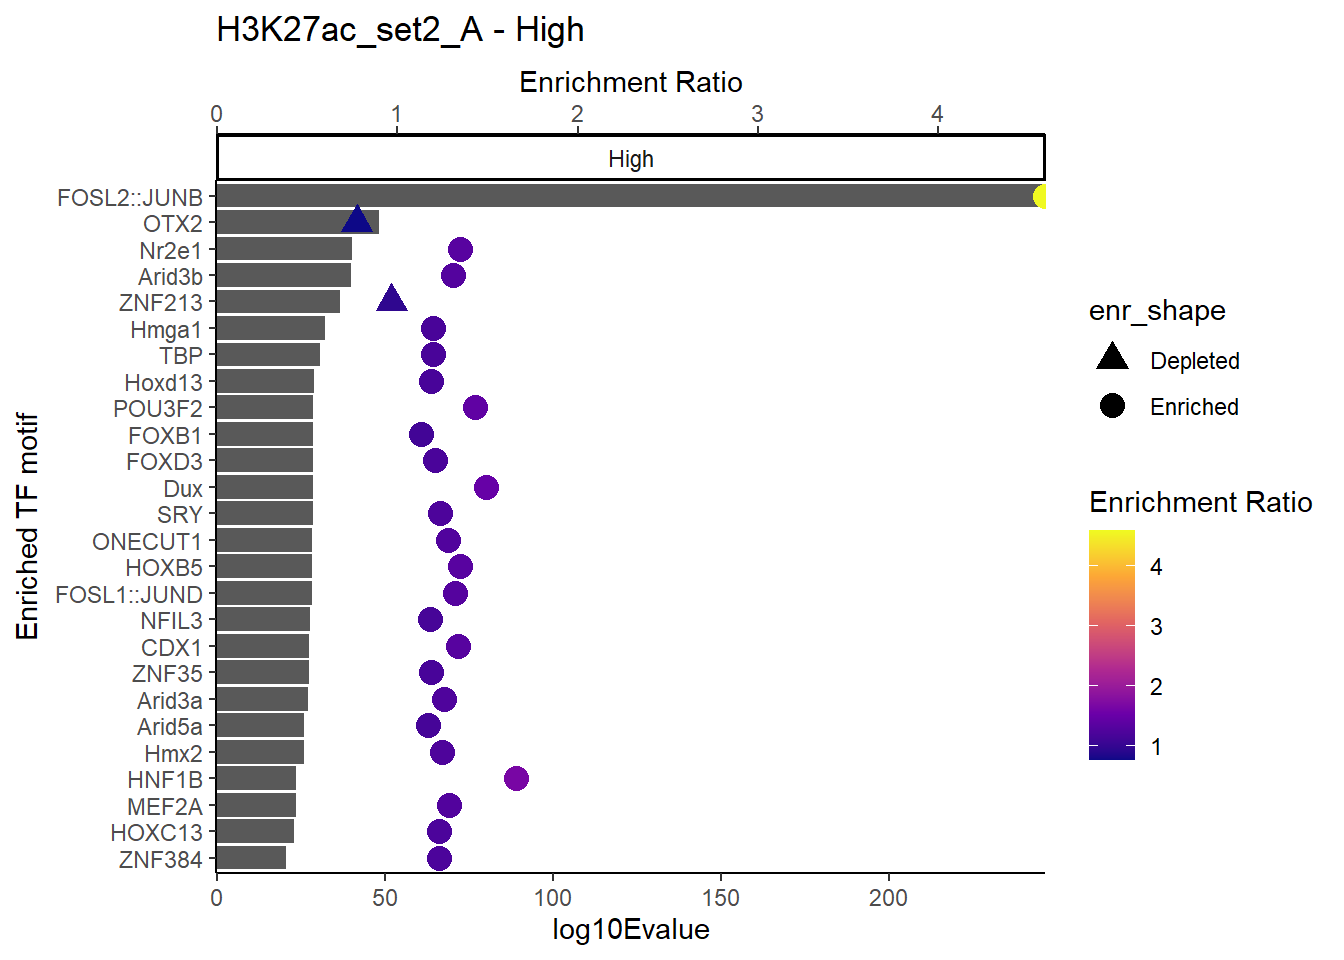
plot_ENR_RATIO(H3K27ac_set2_A, signif.num = 0.05, page = 2)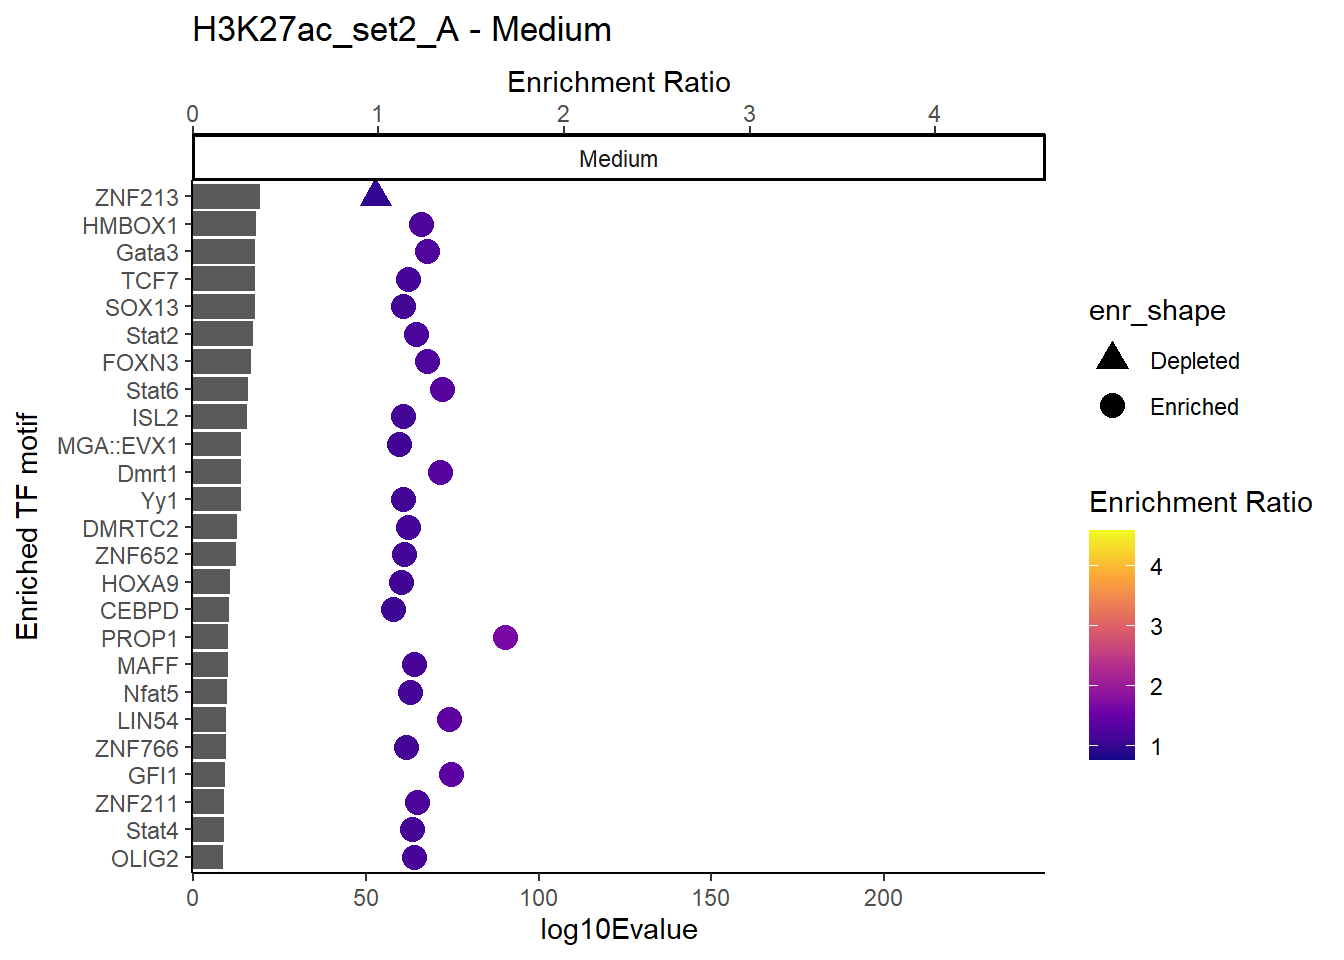
plot_ENR_RATIO(H3K27ac_set2_A, signif.num = 0.05, page = 1)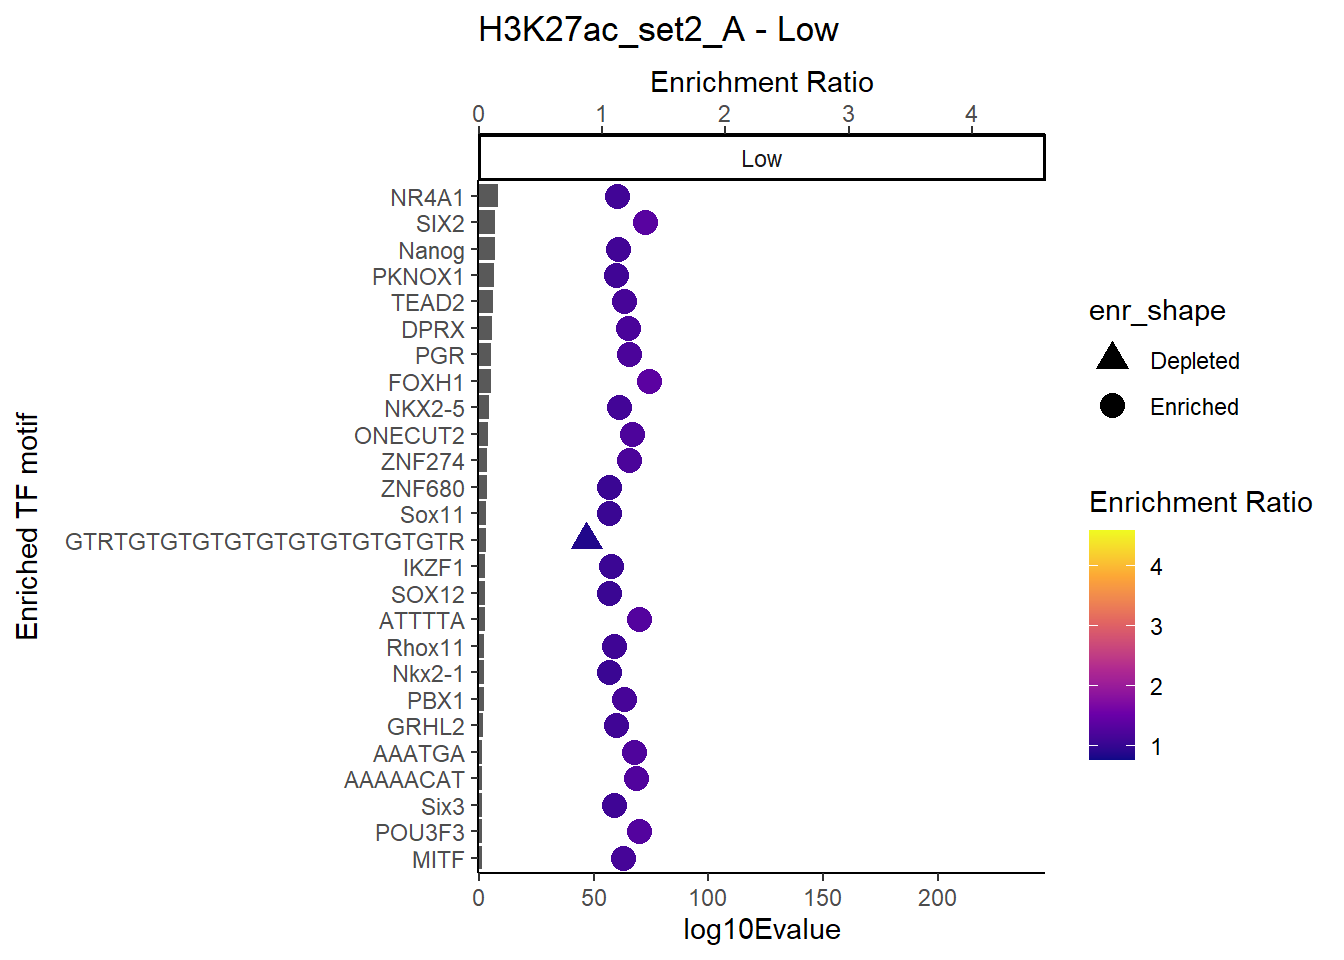
| Version | Author | Date |
|---|---|---|
| 7840a6d | reneeisnowhere | 2026-02-12 |
plot_ENR_RATIO(H3K27ac_set2_B, signif.num = 0.05, page = 3)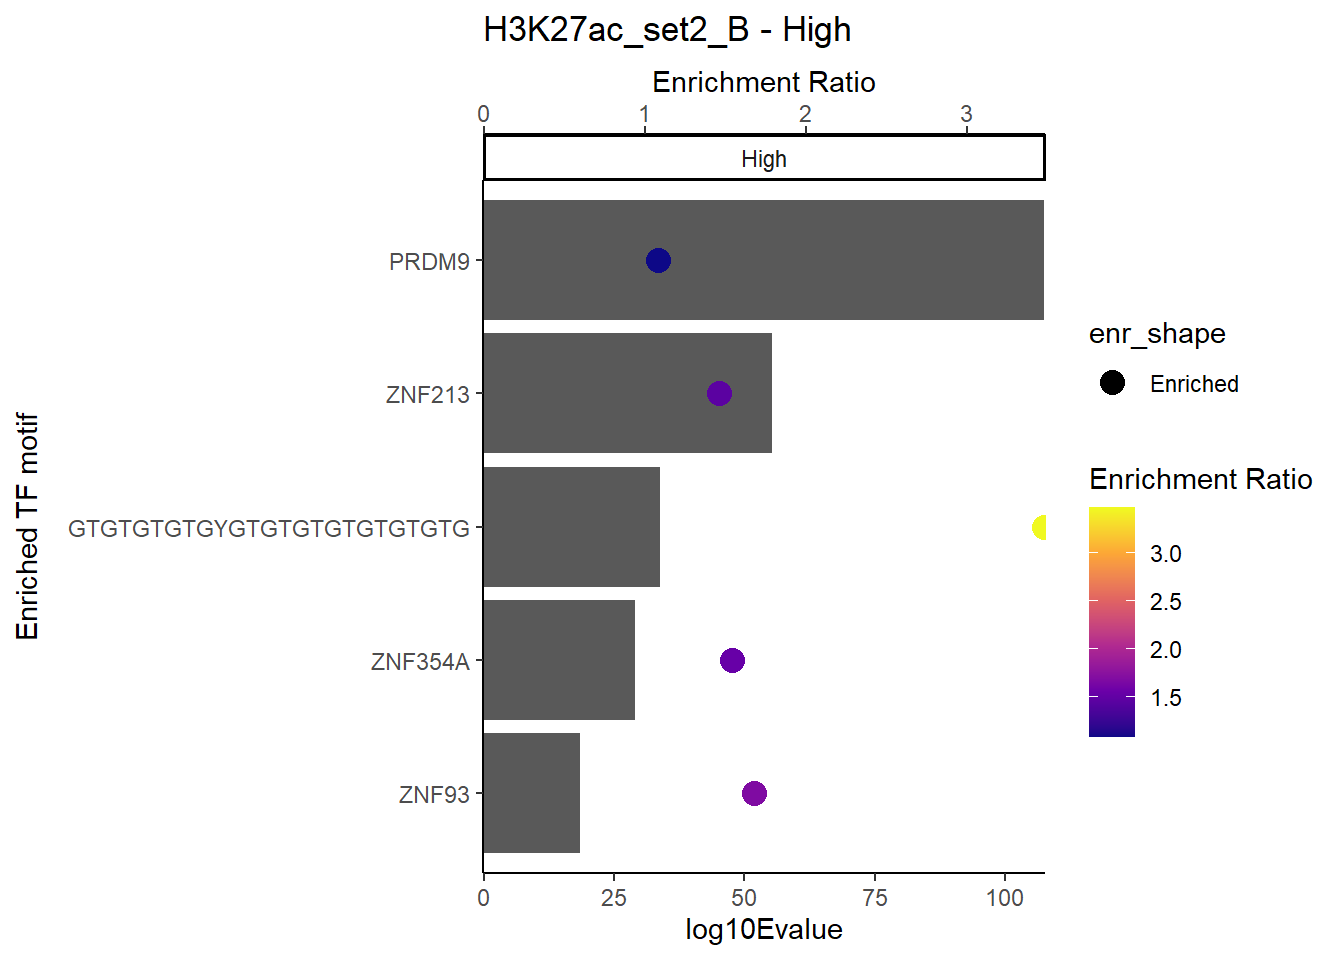
| Version | Author | Date |
|---|---|---|
| 7840a6d | reneeisnowhere | 2026-02-12 |
plot_ENR_RATIO(H3K27ac_set2_B, signif.num = 0.05, page = 2)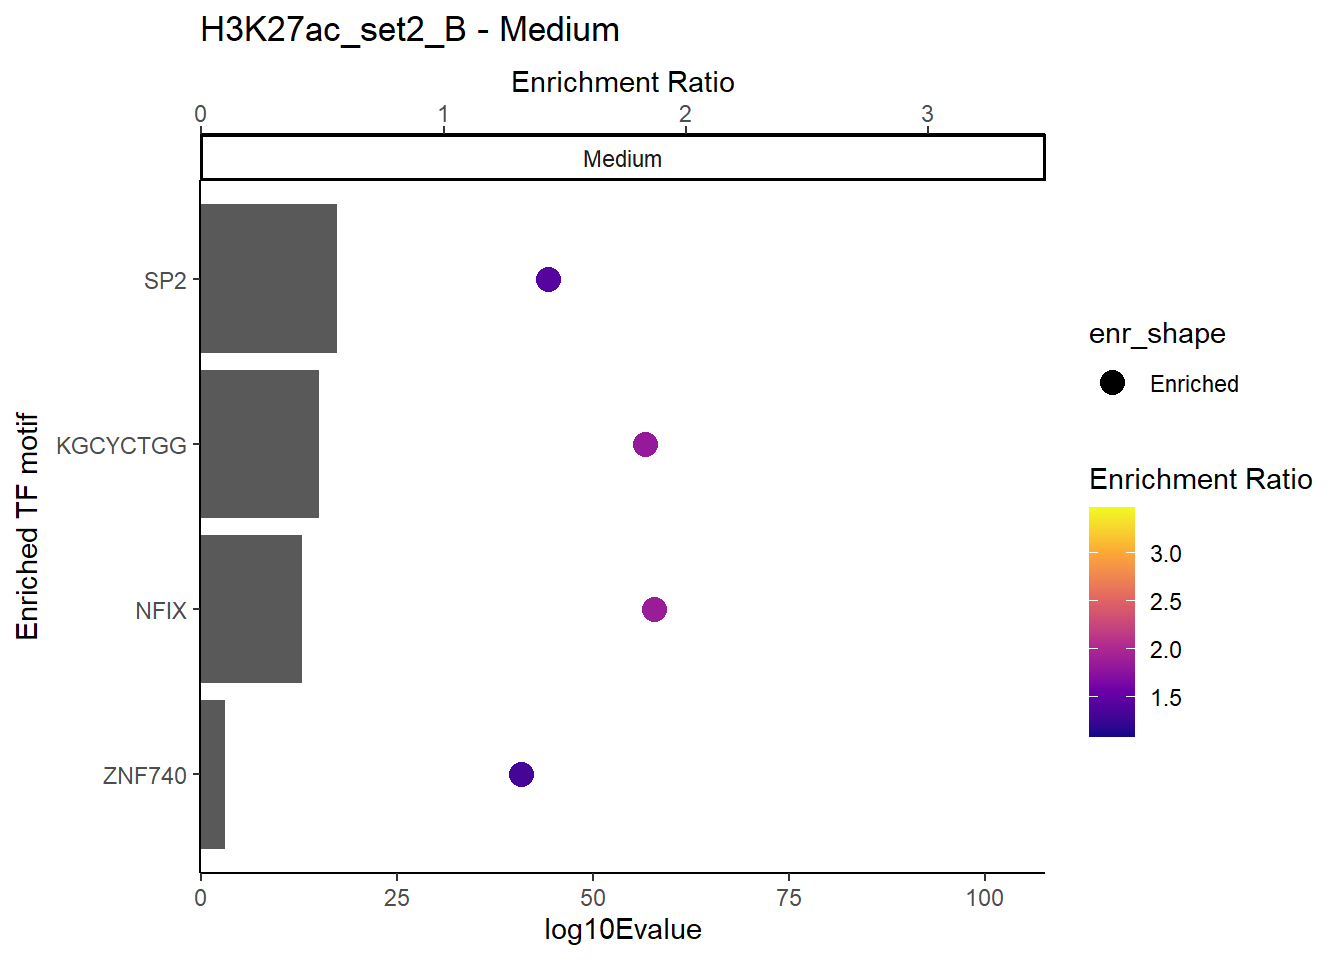
| Version | Author | Date |
|---|---|---|
| 7840a6d | reneeisnowhere | 2026-02-12 |
plot_ENR_RATIO(H3K27ac_set2_B, signif.num = 0.05, page = 1)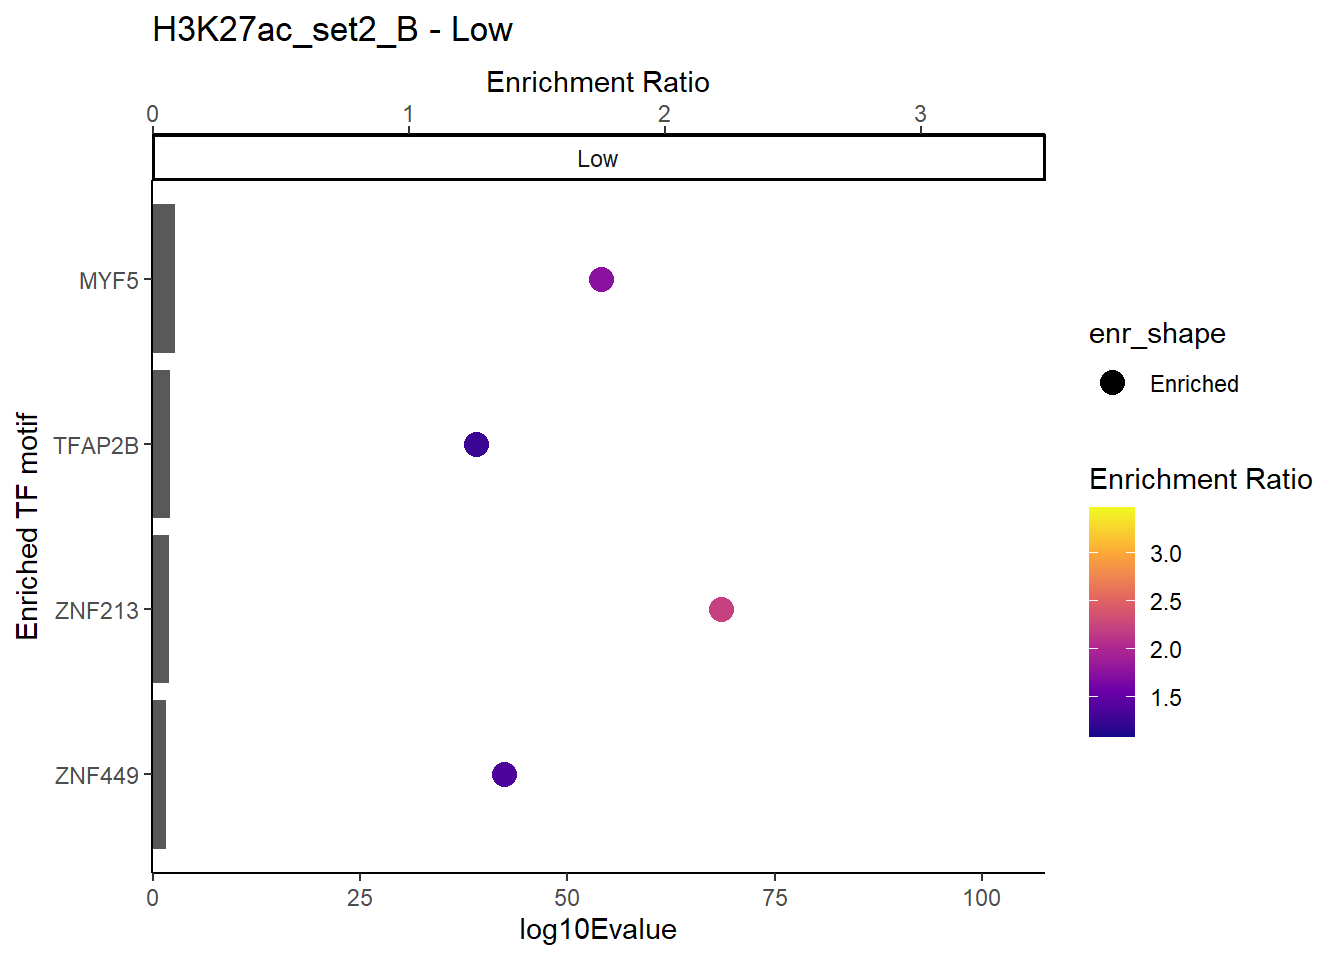
| Version | Author | Date |
|---|---|---|
| 7840a6d | reneeisnowhere | 2026-02-12 |
# plot_topnum_RATIO(H3K27ac_set2_A, signif.num = 0.05, top_num = 10)
#
# plot_topnum_RATIO(H3K27ac_Set3_data,signif.num = 0.05, top_num = 10)
now for plotting Set 3 A and B
plot_ENR_RATIO(H3K27ac_set3_A, signif.num = 0.05, page = 3)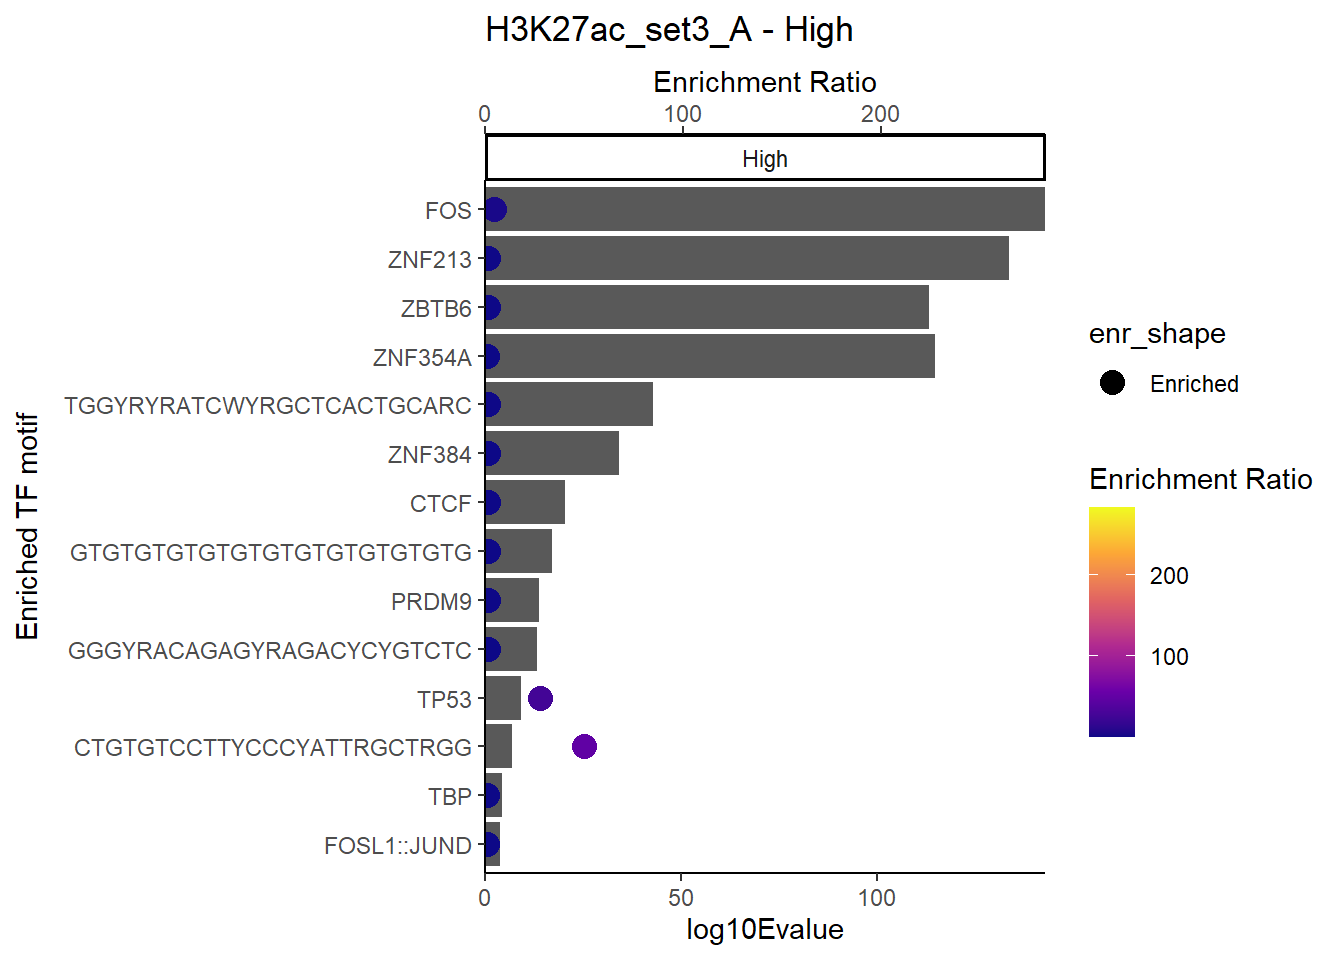
plot_ENR_RATIO(H3K27ac_set3_A, signif.num = 0.05, page = 2)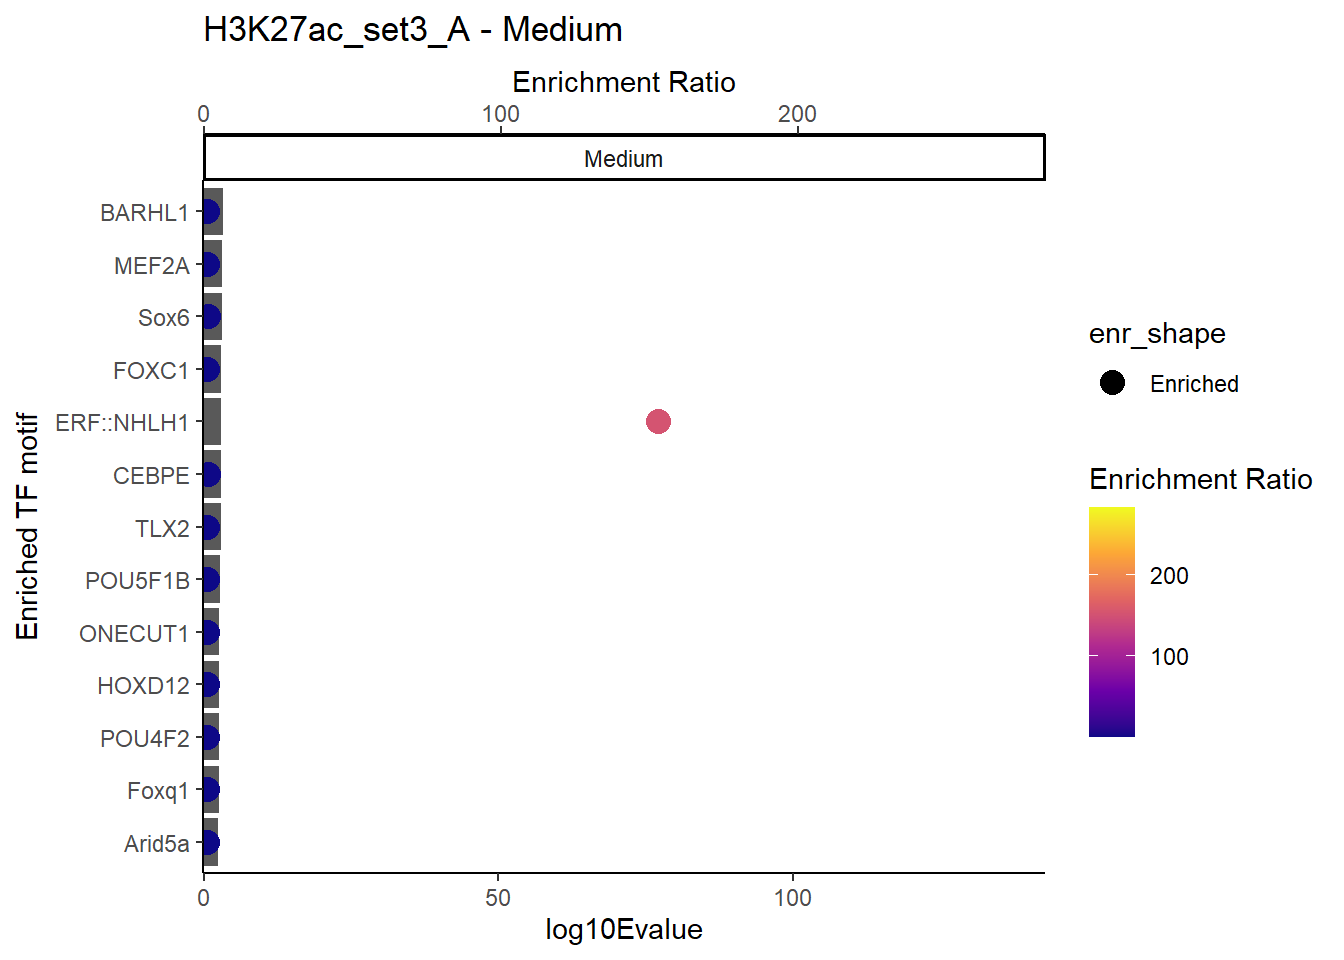
plot_ENR_RATIO(H3K27ac_set3_A, signif.num = 0.05, page = 1)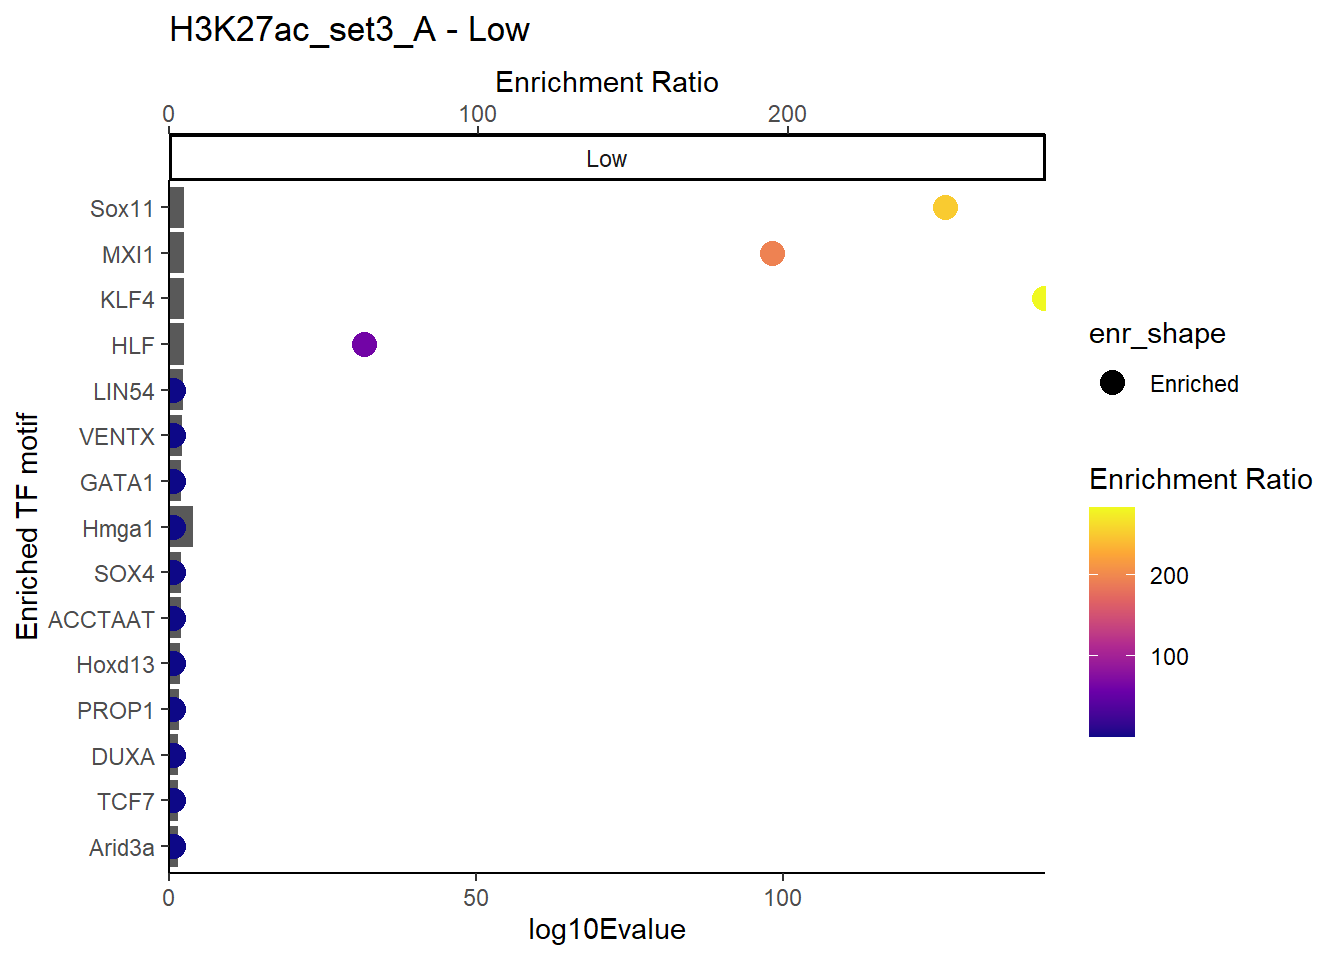
plot_ENR_RATIO(H3K27ac_set3_B, signif.num = 0.05, page = 3)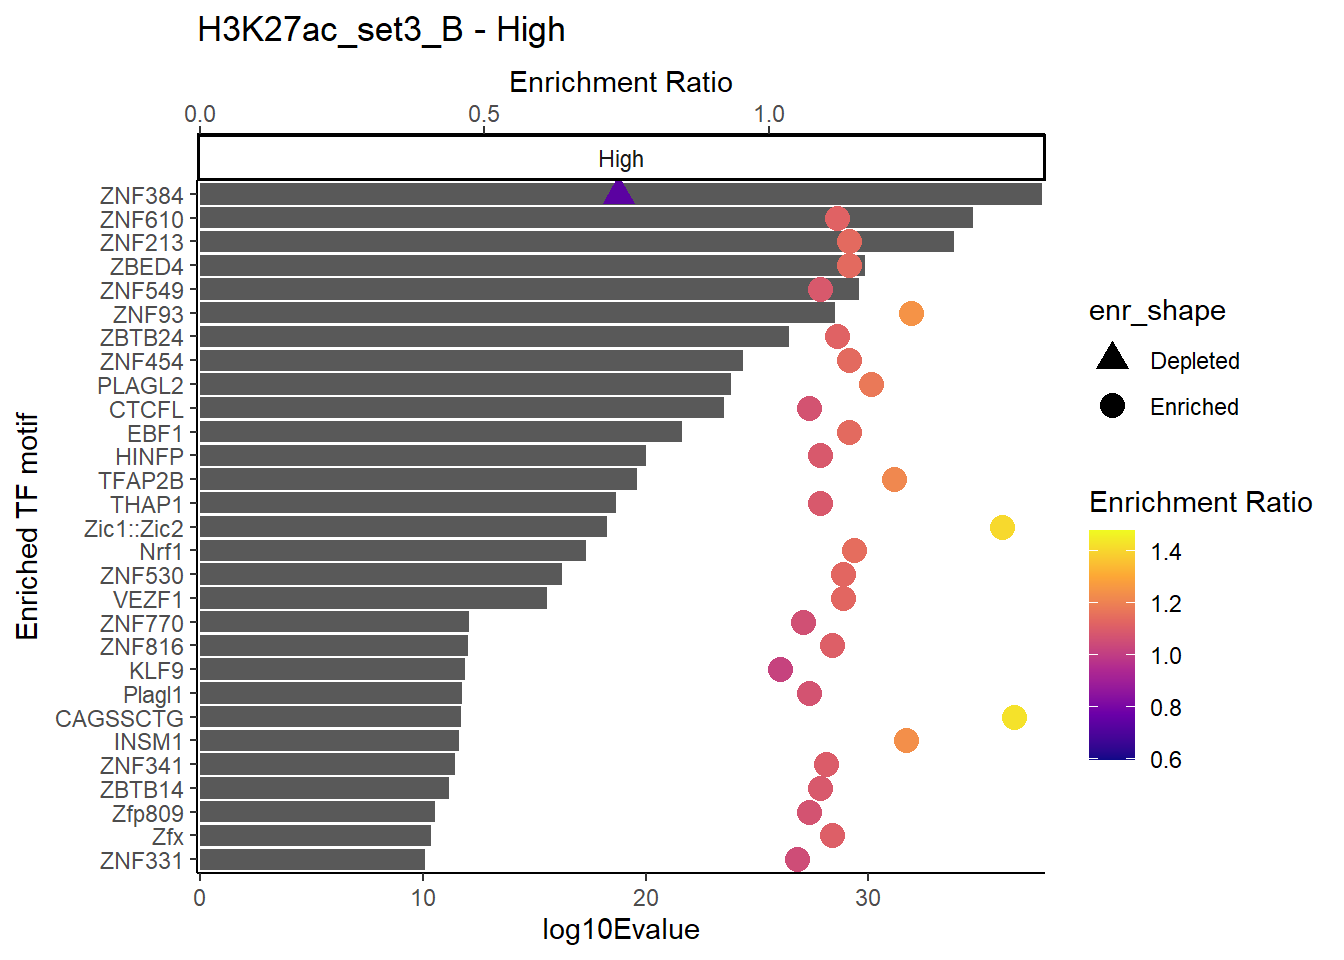
plot_ENR_RATIO(H3K27ac_set3_B, signif.num = 0.05, page = 2)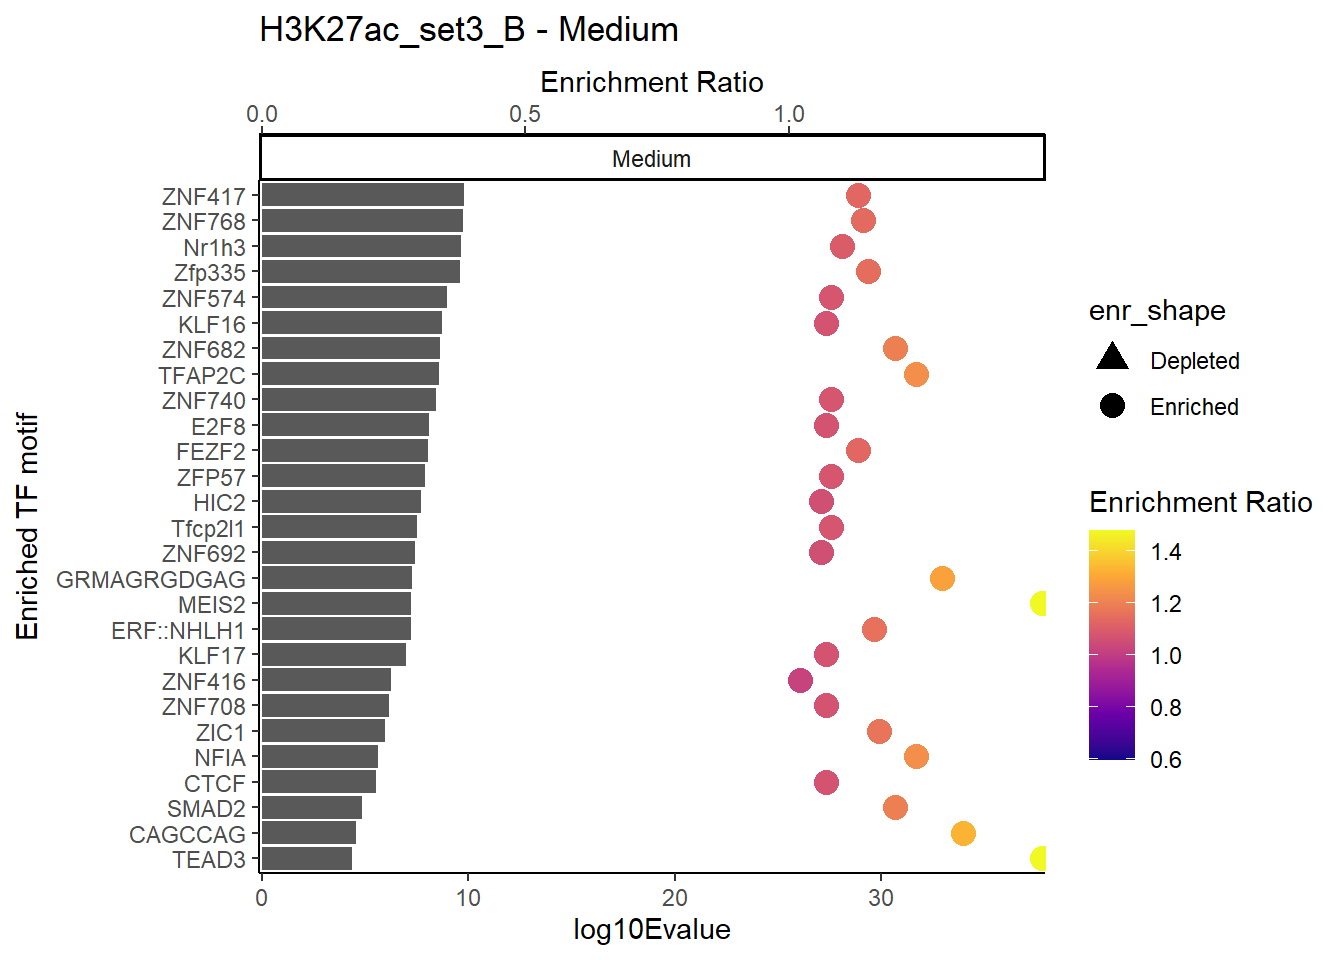
plot_ENR_RATIO(H3K27ac_set3_B, signif.num = 0.05, page = 1)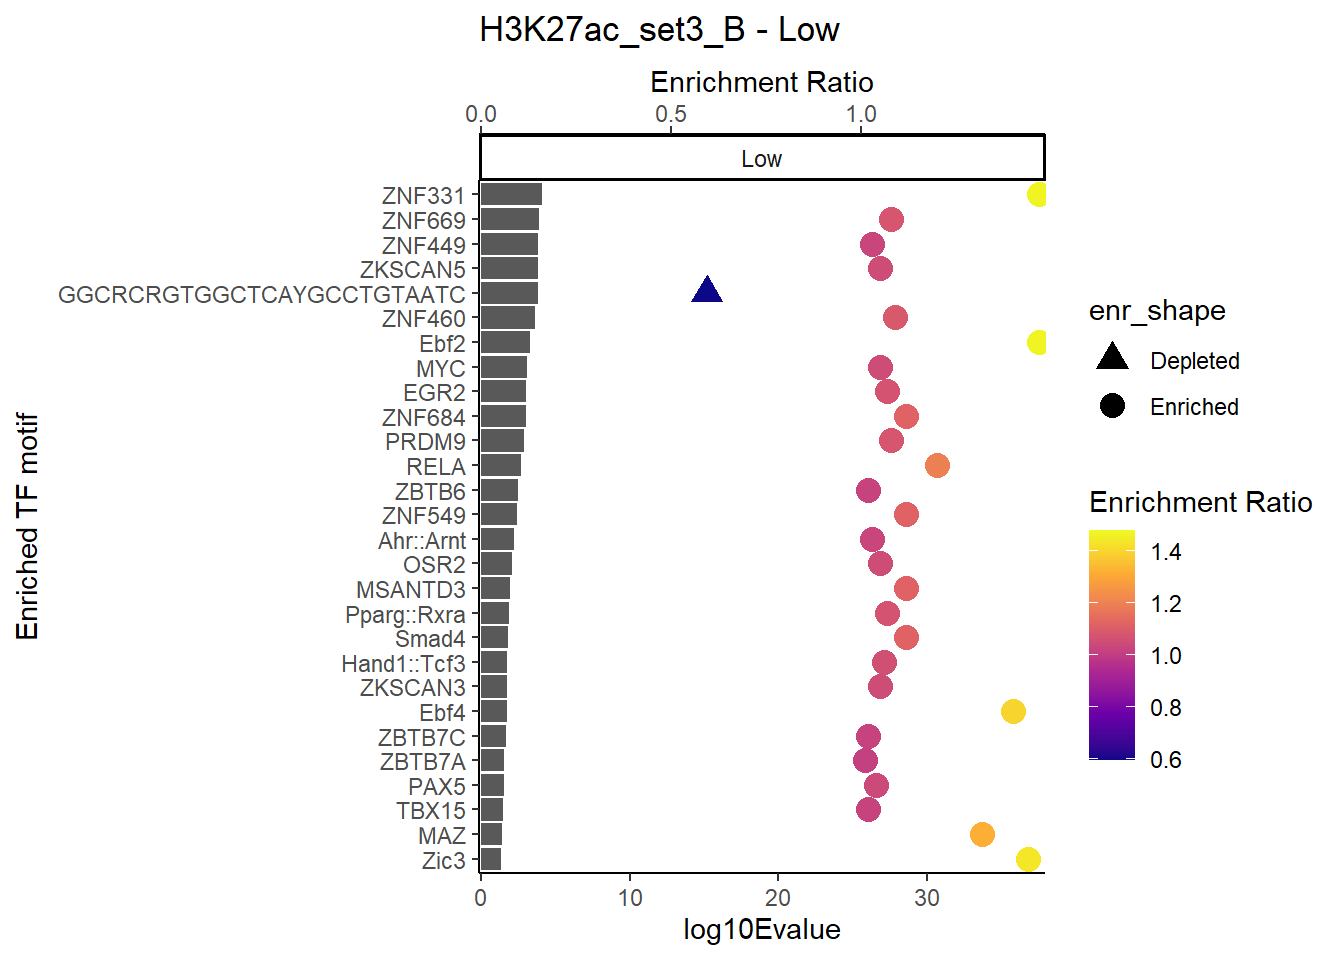
Summit calls method 2
H3K27ac_Set2_met2_sea_disc_out <-read_delim("C:/Users/renee/Other_projects_data/DXR_data/H3K27ac/H3K27ac_set2_400_alt/sea_disc_out/sea.tsv", delim = "\t", escape_double = FALSE,     trim_ws = TRUE) %>% mutate(source="disc") %>% slice_head(n = length(.$ID)-3)

H3K27ac_Set2_met2_sea_known <-read_delim("C:/Users/renee/Other_projects_data/DXR_data/H3K27ac/H3K27ac_set2_400_alt/sea_out/sea.tsv", delim = "\t", escape_double = FALSE,     trim_ws = TRUE) %>% mutate(source="known") %>% slice_head(n = length(.$ID)-3)

H3K27ac_Set2_met2_xstreme <- read_delim("C:/Users/renee/Other_projects_data/DXR_data/H3K27ac/H3K27ac_set2_400_alt/xstreme.tsv", delim = "\t", escape_double = FALSE,     trim_ws = TRUE) %>% mutate(source="all") %>% slice_head(n = length(.$ID)-3)


H3K27ac_Set2_met2_tomtom <- read_delim("C:/Users/renee/Other_projects_data/DXR_data/H3K27ac/H3K27ac_set2_400_alt/streme_tomtom_out/tomtom.tsv",
    delim = "\t", escape_double = FALSE,
    trim_ws = TRUE)

test_bind_met2 <- bind_rows(H3K27ac_Set2_met2_sea_disc_out, H3K27ac_Set2_met2_sea_known) %>%
  dplyr::select(DB:ENR_RATIO) %>%
  group_by(ID,ALT_ID, ENR_RATIO) %>% distinct()
H3K27ac_Set3_met2_sea_disc_out <-read_delim("C:/Users/renee/Other_projects_data/DXR_data/H3K27ac/H3K27ac_set3_400_alt/sea_disc_out/sea.tsv", delim = "\t", escape_double = FALSE, trim_ws = TRUE) %>% mutate(source="disc") %>% slice_head(n = length(.$ID)-3)
H3K27ac_Set3_met2_sea_known <-read_delim("C:/Users/renee/Other_projects_data/DXR_data/H3K27ac/H3K27ac_set3_400_alt/sea_out/sea.tsv", delim = "\t", escape_double = FALSE, trim_ws = TRUE) %>% mutate(source="known") %>% slice_head(n = length(.$ID)-3)
H3K27ac_Set3_met2_xstreme <- read_delim("C:/Users/renee/Other_projects_data/DXR_data/H3K27ac/H3K27ac_set3_400_alt/xstreme.tsv", delim = "\t", escape_double = FALSE, trim_ws = TRUE) %>% mutate(source="all") %>% slice_head(n = length(.$ID)-3)
H3K27ac_Set3_met2_tomtom <- read_delim("C:/Users/renee/Other_projects_data/DXR_data/H3K27ac/H3K27ac_set3_400_alt/streme_tomtom_out/tomtom.tsv",
delim = "\t", escape_double = FALSE,
trim_ws = TRUE)
test_bind3_met2 <-bind_rows(H3K27ac_Set3_met2_sea_disc_out, H3K27ac_Set3_met2_sea_known) %>%
dplyr::select(DB:ENR_RATIO) %>%
group_by(ID,ALT_ID) %>%
distinct()H3K27ac_Set2_data_met2 <- H3K27ac_Set2_met2_xstreme %>%
dplyr::select(RANK:CLUSTER,ID:CONSENSUS,EVALUE,SIM_MOTIF,MOTIF_URL) %>%
mutate(MOTIF_URL=str_replace(MOTIF_URL,"https://jaspar2024.elixir.no/matrix/","")) %>%
mutate(motif_name=case_when(
str_detect(SIM_MOTIF, "\\(") ~ str_extract(SIM_MOTIF, "(?<=\\().+?(?=\\))"),
str_detect(SIM_MOTIF, "^MA\\d+\\.\\d+") ~ ALT_ID,
str_detect(SIM_MOTIF, "^\\d+-") ~ str_replace(SIM_MOTIF, "^\\d+-", ""),
TRUE ~ SIM_MOTIF)) %>%
left_join(test_bind_met2) %>%
mutate(diff_per=`TP%` -`FP%`)
H3K27ac_Set3_data_met2 <- H3K27ac_Set3_met2_xstreme %>%
dplyr::select(RANK:CLUSTER,ID:CONSENSUS,EVALUE,SIM_MOTIF,MOTIF_URL) %>%
mutate(MOTIF_URL=str_replace(MOTIF_URL,"https://jaspar2024.elixir.no/matrix/","")) %>%
mutate(motif_name=case_when(
str_detect(SIM_MOTIF, "\\(") ~ str_extract(SIM_MOTIF, "(?<=\\().+?(?=\\))"),
str_detect(SIM_MOTIF, "^MA\\d+\\.\\d+") ~ ALT_ID,
str_detect(SIM_MOTIF, "^\\d+-") ~ str_replace(SIM_MOTIF, "^\\d+-", ""),
TRUE ~ SIM_MOTIF)) %>%
left_join(test_bind3_met2, by=c("ID"="ID","ALT_ID"="ALT_ID")) %>%
mutate(diff_per=`TP%` -`FP%`)# test_bind
# xstreme_rank_bind
DT::datatable((H3K27ac_Set2_data_met2 %>%
dplyr::select(RANK,CLUSTER,ID,ALT_ID,EVALUE, CONSENSUS)),
rownames = FALSE,
caption = htmltools::tags$caption(
style = "caption-side: top; text-align: left; font-weight: bold;",
"Method 2: Set 2 H3K27ac"
),
filter = 'top', # add filter/search boxes
options = list(
pageLength = 10,
autoWidth = FALSE,
scrollX = TRUE)) DT::datatable((H3K27ac_Set3_data_met2 %>%
dplyr::select(RANK,CLUSTER,ID,ALT_ID,EVALUE, CONSENSUS.x)),
rownames = FALSE,
caption = htmltools::tags$caption(
style = "caption-side: top; text-align: left; font-weight: bold;",
"Method 2: Set 3 H3K27ac"
),
filter = 'top', # add filter/search boxes
options = list(
pageLength = 10,
autoWidth = FALSE,
scrollX = TRUE)) Summit calls method 3
H3K27ac_Set2_met3_sea_disc_out <-read_delim("C:/Users/renee/Other_projects_data/DXR_data/H3K27ac/H3K27ac_set2_400_alt_concat/sea_disc_out/sea.tsv", delim = "\t", escape_double = FALSE,     trim_ws = TRUE) %>% mutate(source="disc") %>% slice_head(n = length(.$ID)-3)

H3K27ac_Set2_met3_sea_known <-read_delim("C:/Users/renee/Other_projects_data/DXR_data/H3K27ac/H3K27ac_set2_400_alt_concat/sea_out/sea.tsv", delim = "\t", escape_double = FALSE,     trim_ws = TRUE) %>% mutate(source="known") %>% slice_head(n = length(.$ID)-3)

H3K27ac_Set2_met3_xstreme <- read_delim("C:/Users/renee/Other_projects_data/DXR_data/H3K27ac/H3K27ac_set2_400_alt_concat/xstreme.tsv", delim = "\t", escape_double = FALSE,     trim_ws = TRUE) %>% mutate(source="all") %>% slice_head(n = length(.$ID)-3)


H3K27ac_Set2_met3_tomtom <- read_delim("C:/Users/renee/Other_projects_data/DXR_data/H3K27ac/H3K27ac_set2_400_alt_concat/streme_tomtom_out/tomtom.tsv",
    delim = "\t", escape_double = FALSE,
    trim_ws = TRUE)

test_bind_met3 <- bind_rows(H3K27ac_Set2_met3_sea_disc_out, H3K27ac_Set2_met3_sea_known) %>%
  dplyr::select(DB:ENR_RATIO) %>%
  group_by(ID,ALT_ID, ENR_RATIO) %>% distinct()
H3K27ac_Set3_met3_sea_disc_out <-read_delim("C:/Users/renee/Other_projects_data/DXR_data/H3K27ac/H3K27ac_set3_400_alt_concat/sea_disc_out/sea.tsv", delim = "\t", escape_double = FALSE, trim_ws = TRUE) %>% mutate(source="disc") %>% slice_head(n = length(.$ID)-3)
H3K27ac_Set3_met3_sea_known <-read_delim("C:/Users/renee/Other_projects_data/DXR_data/H3K27ac/H3K27ac_set3_400_alt_concat/sea_out/sea.tsv", delim = "\t", escape_double = FALSE, trim_ws = TRUE) %>% mutate(source="known") %>% slice_head(n = length(.$ID)-3)
H3K27ac_Set3_met3_xstreme <- read_delim("C:/Users/renee/Other_projects_data/DXR_data/H3K27ac/H3K27ac_set3_400_alt_concat/xstreme.tsv", delim = "\t", escape_double = FALSE, trim_ws = TRUE) %>% mutate(source="all") %>% slice_head(n = length(.$ID)-3)
H3K27ac_Set3_met3_tomtom <- read_delim("C:/Users/renee/Other_projects_data/DXR_data/H3K27ac/H3K27ac_set3_400_alt_concat/streme_tomtom_out/tomtom.tsv",
delim = "\t", escape_double = FALSE,
trim_ws = TRUE)
test_bind3_met3 <-bind_rows(H3K27ac_Set3_met3_sea_disc_out, H3K27ac_Set3_met3_sea_known) %>%
dplyr::select(DB:ENR_RATIO) %>%
group_by(ID,ALT_ID) %>%
distinct()H3K27ac_Set2_data_met3 <- H3K27ac_Set2_met3_xstreme %>%
dplyr::select(RANK:CLUSTER,ID:CONSENSUS,EVALUE,SIM_MOTIF,MOTIF_URL) %>%
mutate(MOTIF_URL=str_replace(MOTIF_URL,"https://jaspar2024.elixir.no/matrix/","")) %>%
mutate(motif_name=case_when(
str_detect(SIM_MOTIF, "\\(") ~ str_extract(SIM_MOTIF, "(?<=\\().+?(?=\\))"),
str_detect(SIM_MOTIF, "^MA\\d+\\.\\d+") ~ ALT_ID,
str_detect(SIM_MOTIF, "^\\d+-") ~ str_replace(SIM_MOTIF, "^\\d+-", ""),
TRUE ~ SIM_MOTIF)) %>%
left_join(test_bind_met3) %>%
mutate(diff_per=`TP%` -`FP%`)
H3K27ac_Set3_data_met3 <- H3K27ac_Set3_met3_xstreme %>%
dplyr::select(RANK:CLUSTER,ID:CONSENSUS,EVALUE,SIM_MOTIF,MOTIF_URL) %>%
mutate(MOTIF_URL=str_replace(MOTIF_URL,"https://jaspar2024.elixir.no/matrix/","")) %>%
mutate(motif_name=case_when(
str_detect(SIM_MOTIF, "\\(") ~ str_extract(SIM_MOTIF, "(?<=\\().+?(?=\\))"),
str_detect(SIM_MOTIF, "^MA\\d+\\.\\d+") ~ ALT_ID,
str_detect(SIM_MOTIF, "^\\d+-") ~ str_replace(SIM_MOTIF, "^\\d+-", ""),
TRUE ~ SIM_MOTIF)) %>%
left_join(test_bind3_met3, by=c("ID"="ID","ALT_ID"="ALT_ID")) %>%
mutate(diff_per=`TP%` -`FP%`)# test_bind
# xstreme_rank_bind
DT::datatable((H3K27ac_Set2_data_met3 %>%
dplyr::select(RANK,CLUSTER,ID,ALT_ID,EVALUE, CONSENSUS)),
rownames = FALSE,
caption = htmltools::tags$caption(
style = "caption-side: top; text-align: left; font-weight: bold;",
"Method 3: Set 2 H3K27ac"
),
filter = 'top', # add filter/search boxes
options = list(
pageLength = 10,
autoWidth = FALSE,
scrollX = TRUE)) DT::datatable((H3K27ac_Set3_data_met3 %>%
dplyr::select(RANK,CLUSTER,ID,ALT_ID,EVALUE, CONSENSUS.x)),
rownames = FALSE,
caption = htmltools::tags$caption(
style = "caption-side: top; text-align: left; font-weight: bold;",
"Method 3: Set 3 H3K27ac"
),
filter = 'top', # add filter/search boxes
options = list(
pageLength = 10,
autoWidth = FALSE,
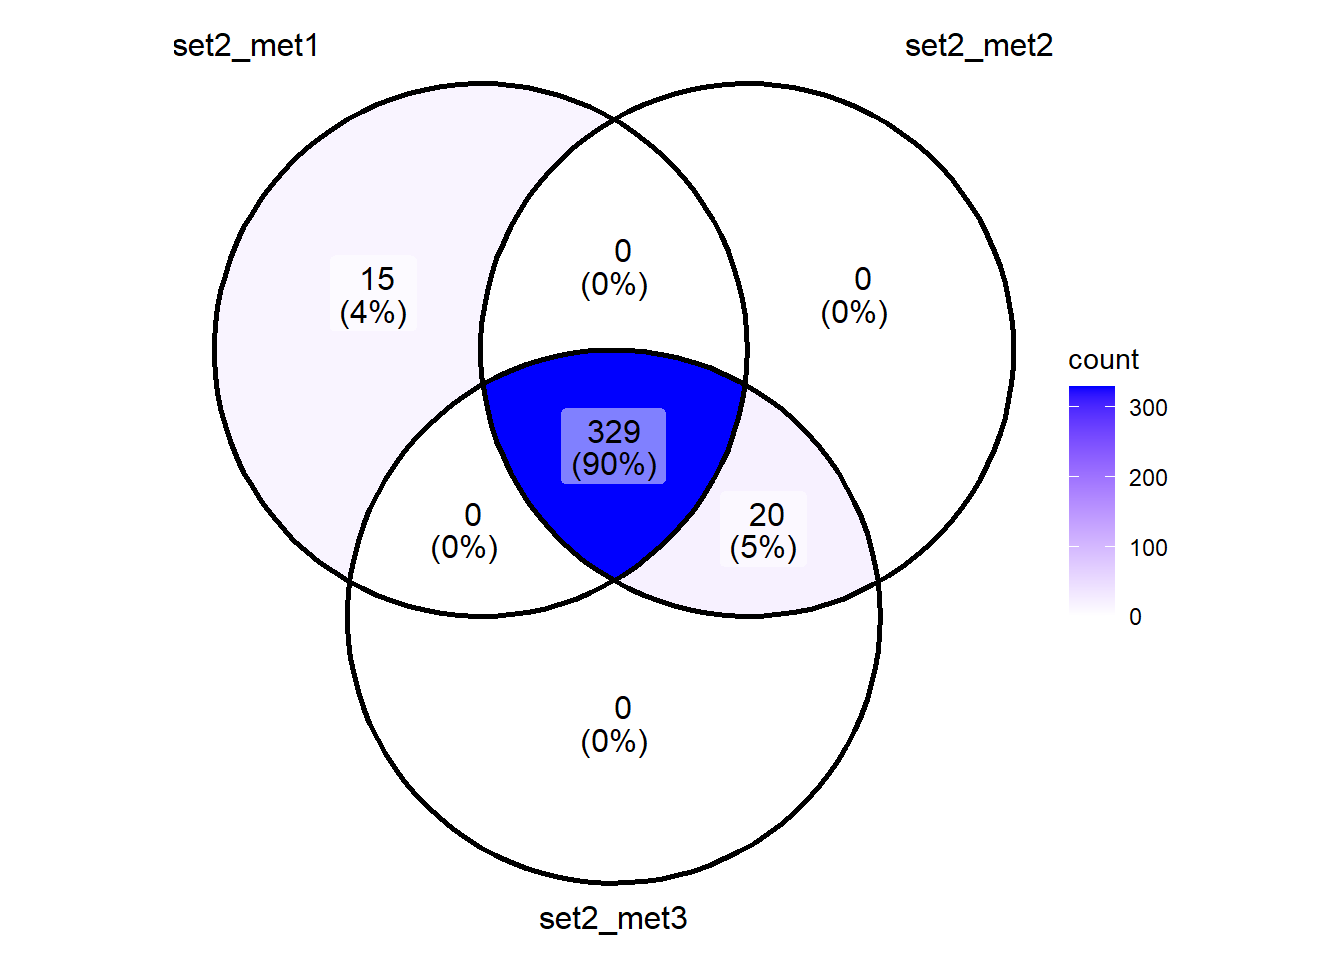
scrollX = TRUE)) toplist_direct_set2 <- list("set2_met1"=H3K27ac_Set2_data$ALT_ID,
"set2_met2"=H3K27ac_Set2_data_met2$ALT_ID,
"set2_met3"=H3K27ac_Set2_data_met3$ALT_ID)
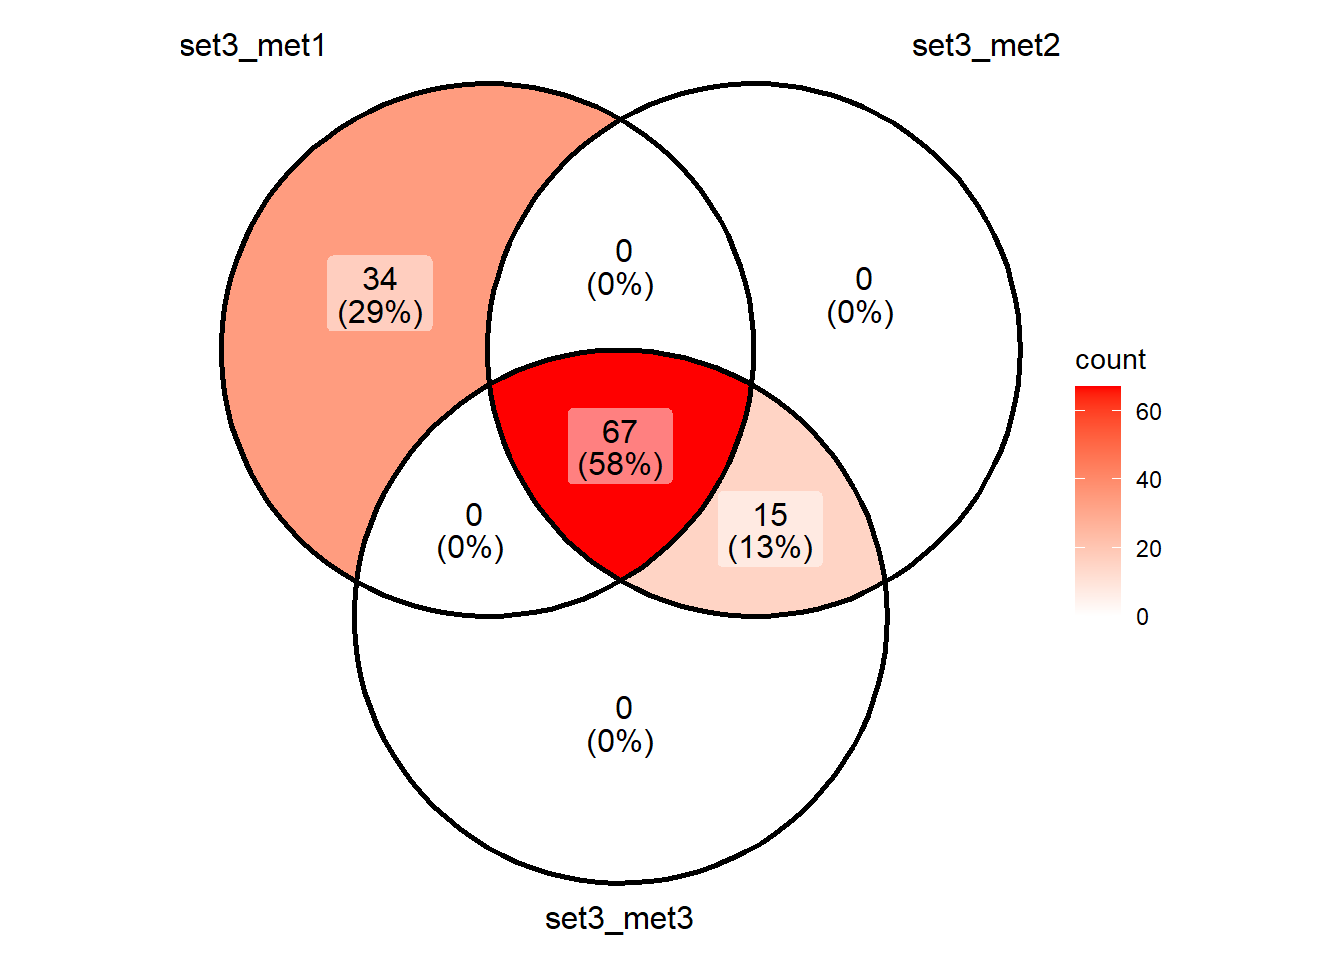
toplist_direct_set3 <- list("set3_met1"=H3K27ac_Set3_data$ALT_ID,
"set3_met2"=H3K27ac_Set3_data_met2$ALT_ID,
"set3_met3"=H3K27ac_Set3_data_met3$ALT_ID) Shared_motifs_set2 <- Reduce(intersect, toplist_direct_set2)
ggVennDiagram::ggVennDiagram(toplist_direct_set2)+scale_fill_gradient(
low = "white",
high = "blue"
)
| Version | Author | Date |
|---|---|---|
| 7840a6d | reneeisnowhere | 2026-02-12 |
 Shared_motifs_set3 <- Reduce(intersect, toplist_direct_set3)
ggVennDiagram::ggVennDiagram(toplist_direct_set3)+scale_fill_gradient(
    low = "white",
    high = "red"
  )
| Version | Author | Date |
|---|---|---|
| 7840a6d | reneeisnowhere | 2026-02-12 |
sessionInfo()R version 4.4.2 (2024-10-31 ucrt)
Platform: x86_64-w64-mingw32/x64
Running under: Windows 11 x64 (build 26200)
Matrix products: default
locale:
[1] LC_COLLATE=English_United States.utf8
[2] LC_CTYPE=English_United States.utf8
[3] LC_MONETARY=English_United States.utf8
[4] LC_NUMERIC=C
[5] LC_TIME=English_United States.utf8
time zone: America/Chicago
tzcode source: internal
attached base packages:
[1] grid stats4 stats graphics grDevices utils datasets
[8] methods base
other attached packages:
[1] DT_0.33 rtracklayer_1.66.0 genomation_1.38.0
[4] plyranges_1.26.0 GenomicRanges_1.58.0 GenomeInfoDb_1.42.3
[7] IRanges_2.40.1 S4Vectors_0.44.0 BiocGenerics_0.52.0
[10] lubridate_1.9.4 forcats_1.0.0 stringr_1.5.1
[13] dplyr_1.1.4 purrr_1.1.0 readr_2.1.5
[16] tidyr_1.3.1 tibble_3.3.0 ggplot2_3.5.2
[19] tidyverse_2.0.0 workflowr_1.7.1
loaded via a namespace (and not attached):
[1] bitops_1.0-9 rlang_1.1.6
[3] magrittr_2.0.3 git2r_0.36.2
[5] gridBase_0.4-7 tidytext_0.4.3
[7] matrixStats_1.5.0 compiler_4.4.2
[9] getPass_0.2-4 callr_3.7.6
[11] vctrs_0.6.5 reshape2_1.4.4
[13] pkgconfig_2.0.3 crayon_1.5.3
[15] fastmap_1.2.0 XVector_0.46.0
[17] labeling_0.4.3 Rsamtools_2.22.0
[19] promises_1.3.3 rmarkdown_2.29
[21] tzdb_0.5.0 UCSC.utils_1.2.0
[23] ps_1.9.1 bit_4.6.0
[25] xfun_0.52 zlibbioc_1.52.0
[27] cachem_1.1.0 jsonlite_2.0.0
[29] SnowballC_0.7.1 later_1.4.2
[31] DelayedArray_0.32.0 tweenr_2.0.3
[33] BiocParallel_1.40.2 parallel_4.4.2
[35] R6_2.6.1 bslib_0.9.0
[37] stringi_1.8.7 RColorBrewer_1.1-3
[39] jquerylib_0.1.4 Rcpp_1.1.0
[41] SummarizedExperiment_1.36.0 knitr_1.50
[43] httpuv_1.6.16 Matrix_1.7-3
[45] timechange_0.3.0 tidyselect_1.2.1
[47] rstudioapi_0.17.1 dichromat_2.0-0.1
[49] abind_1.4-8 yaml_2.3.10
[51] seqPattern_1.38.0 ggVennDiagram_1.5.4
[53] codetools_0.2-20 curl_7.0.0
[55] processx_3.8.6 lattice_0.22-7
[57] plyr_1.8.9 Biobase_2.66.0
[59] withr_3.0.2 evaluate_1.0.5
[61] polyclip_1.10-7 Biostrings_2.74.1
[63] pillar_1.11.0 janeaustenr_1.0.0
[65] MatrixGenerics_1.18.1 whisker_0.4.1
[67] KernSmooth_2.23-26 generics_0.1.4
[69] vroom_1.6.5 rprojroot_2.1.1
[71] RCurl_1.98-1.17 hms_1.1.3
[73] scales_1.4.0 glue_1.8.0
[75] tools_4.4.2 BiocIO_1.16.0
[77] tokenizers_0.3.0 data.table_1.17.8
[79] BSgenome_1.74.0 GenomicAlignments_1.42.0
[81] fs_1.6.6 XML_3.99-0.18
[83] cowplot_1.2.0 impute_1.80.0
[85] plotrix_3.8-4 crosstalk_1.2.2
[87] colorspace_2.1-1 GenomeInfoDbData_1.2.13
[89] ggforce_0.5.0 restfulr_0.0.16
[91] cli_3.6.5 viridisLite_0.4.2
[93] S4Arrays_1.6.0 gtable_0.3.6
[95] sass_0.4.10 digest_0.6.37
[97] SparseArray_1.6.2 htmlwidgets_1.6.4
[99] rjson_0.2.23 farver_2.1.2
[101] htmltools_0.5.8.1 lifecycle_1.0.4
[103] httr_1.4.7 MASS_7.3-65
[105] bit64_4.6.0-1