Fine-mapping
Siming Zhao
2024-01-22
Last updated: 2024-01-23
Checks: 6 1
Knit directory: QBS-statsgen/
This reproducible R Markdown analysis was created with workflowr (version 1.6.2). The Checks tab describes the reproducibility checks that were applied when the results were created. The Past versions tab lists the development history.
The R Markdown is untracked by Git. To know which version of the R
Markdown file created these results, you’ll want to first commit it to
the Git repo. If you’re still working on the analysis, you can ignore
this warning. When you’re finished, you can run
wflow_publish to commit the R Markdown file and build the
HTML.
Great job! The global environment was empty. Objects defined in the global environment can affect the analysis in your R Markdown file in unknown ways. For reproduciblity it’s best to always run the code in an empty environment.
The command set.seed(20231230) was run prior to running
the code in the R Markdown file. Setting a seed ensures that any results
that rely on randomness, e.g. subsampling or permutations, are
reproducible.
Great job! Recording the operating system, R version, and package versions is critical for reproducibility.
Nice! There were no cached chunks for this analysis, so you can be confident that you successfully produced the results during this run.
Great job! Using relative paths to the files within your workflowr project makes it easier to run your code on other machines.
Great! You are using Git for version control. Tracking code development and connecting the code version to the results is critical for reproducibility.
The results in this page were generated with repository version 85e59dd. See the Past versions tab to see a history of the changes made to the R Markdown and HTML files.
Note that you need to be careful to ensure that all relevant files for
the analysis have been committed to Git prior to generating the results
(you can use wflow_publish or
wflow_git_commit). workflowr only checks the R Markdown
file, but you know if there are other scripts or data files that it
depends on. Below is the status of the Git repository when the results
were generated:
Ignored files:
    Ignored:    .Rproj.user/B81CBE6F/bibliography-index/
    Ignored:    .Rproj.user/B81CBE6F/ctx/
    Ignored:    .Rproj.user/B81CBE6F/pcs/
    Ignored:    .Rproj.user/B81CBE6F/presentation/
    Ignored:    .Rproj.user/B81CBE6F/profiles-cache/
    Ignored:    .Rproj.user/B81CBE6F/sources/per/
    Ignored:    .Rproj.user/B81CBE6F/tutorial/
    Ignored:    .Rproj.user/shared/notebooks/1C2AC29C-e1-gwas-power/
    Ignored:    .Rproj.user/shared/notebooks/1EB0B2DC-e1-gwas/1/s/ce0r78nx8keuu/
    Ignored:    .Rproj.user/shared/notebooks/1EB0B2DC-e1-gwas/1/s/csetup_chunk/
    Ignored:    .Rproj.user/shared/notebooks/1EB0B2DC-e1-gwas/1/s/czxn6jf8lsykc/
    Ignored:    .Rproj.user/shared/notebooks/26ED8139-e2-prs/
    Ignored:    .Rproj.user/shared/notebooks/BC66D613-e2-lmm/
    Ignored:    .Rproj.user/shared/notebooks/FCFC3BD0-e2-finemapping/
    Ignored:    data/e2-ori/
    Ignored:    data/e2/
    Ignored:    output/

Untracked files:
    Untracked:  analysis/e2-finemapping.Rmd
    Untracked:  analysis/e2-lmm.Rmd
    Untracked:  analysis/e2-prs.Rmd
    Untracked:  code/Bayesian-linear-regression.R

Unstaged changes:
    Modified:   .Rproj.user/B81CBE6F/persistent-state
    Modified:   .Rproj.user/B81CBE6F/sources/prop/4C8B7780
    Modified:   .Rproj.user/B81CBE6F/sources/prop/BBFFB970
    Modified:   .Rproj.user/B81CBE6F/sources/prop/INDEX
    Modified:   .Rproj.user/B81CBE6F/sources/s-e0e7218a/34A40D3B
    Modified:   .Rproj.user/B81CBE6F/sources/s-e0e7218a/34A40D3B-contents
    Deleted:    .Rproj.user/B81CBE6F/sources/s-e0e7218a/6C1FFABC
    Modified:   .Rproj.user/B81CBE6F/sources/s-e0e7218a/lock_file
    Modified:   .Rproj.user/shared/notebooks/paths
    Modified:   analysis/index.Rmd
    Deleted:    temp.csv
Note that any generated files, e.g. HTML, png, CSS, etc., are not included in this status report because it is ok for generated content to have uncommitted changes.
There are no past versions. Publish this analysis with
wflow_publish() to start tracking its development.
Before the class
Install R package “susieR”
Explore the data we will use the analysis
rm(list=ls())
library(susieR)
data(N3finemapping)
attach(N3finemapping)names(N3finemapping)[1] "X" "chrom" "pos"
[4] "true_coef" "residual_variance" "Y"
[7] "allele_freq" "V" The genotype matrix is X, The phenotype matrix is
Y.
We focus on the first trait, let
y = Y[,1]
b = true_coef[,1]
which(b != 0)
[1] 403 653 773Let’s perform a univariate analysis
sumstats <- univariate_regression(X, y)
z_scores <- sumstats$betahat / sumstats$sebetahat
log10p <- -log10(pchisq(z_scores^2,1,lower.tail=F))
susie_plot(z_scores,y="z",b=b)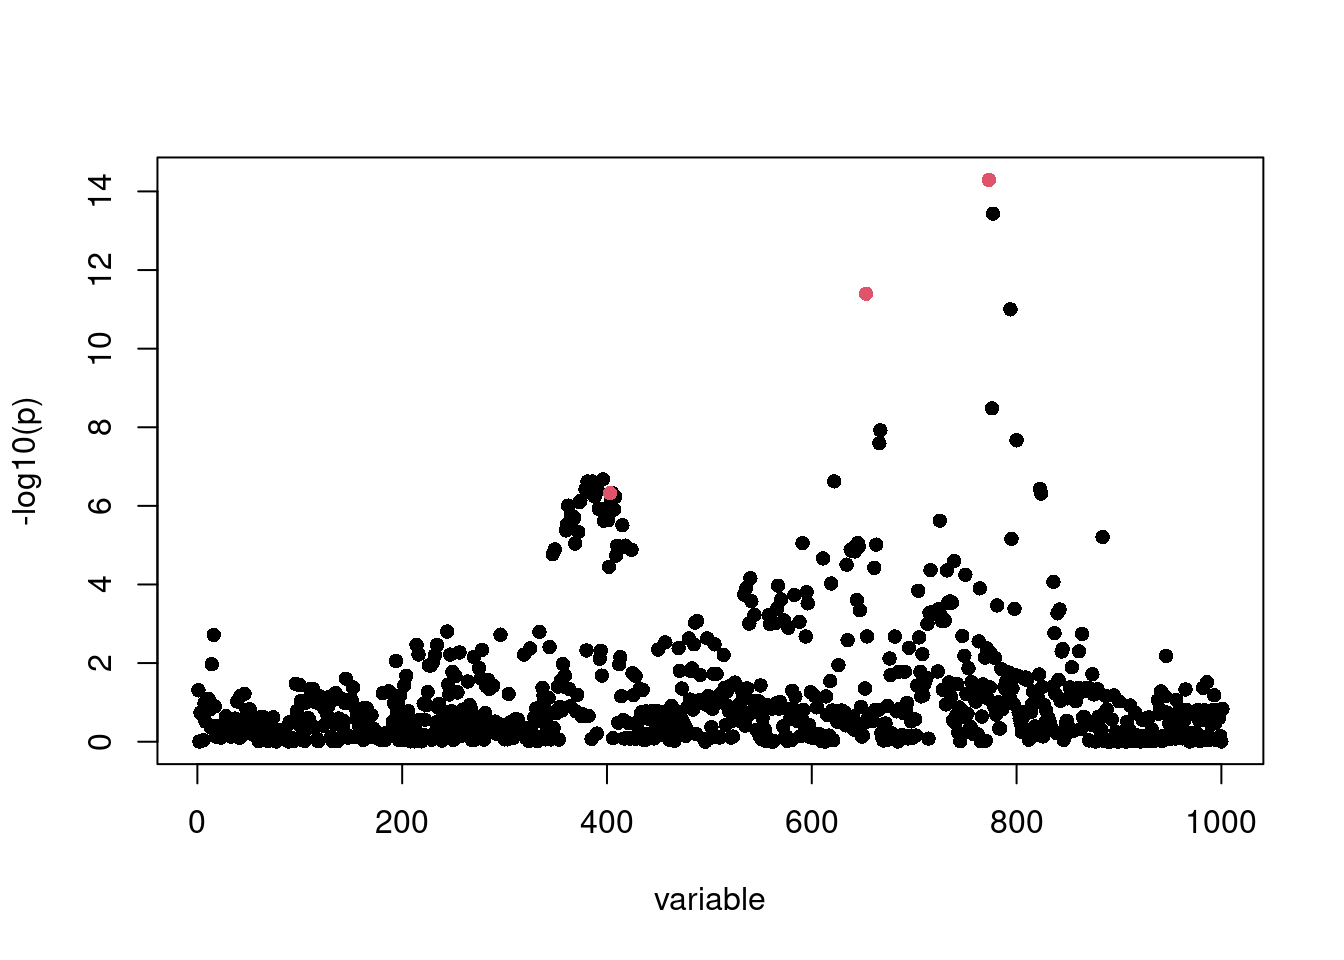
Fine mapping using individual level data
fitted <- susie(X, y, L = 10)By default, susie function computes 95% CS each containing one effect variable,
print(fitted$sets)$cs
$cs$L2
[1] 653
$cs$L1
[1] 773 777
$cs$L3
[1] 362 365 372 373 374 379 381 383 384 386 387 388 389 391 392 396 397 398 399
[20] 400 401 403 404 405 407 408 415
$purity
min.abs.corr mean.abs.corr median.abs.corr
L2 1.0000000 1.0000000 1.0000000
L1 0.9815726 0.9815726 0.9815726
L3 0.8686309 0.9640176 0.9720711
$cs_index
[1] 2 1 3
$coverage
[1] 0.9998236 0.9988858 0.9539811
$requested_coverage
[1] 0.95Plot Posterior Inclusion Probability
susie_plot(fitted, y="PIP", b=b, add_legend=T)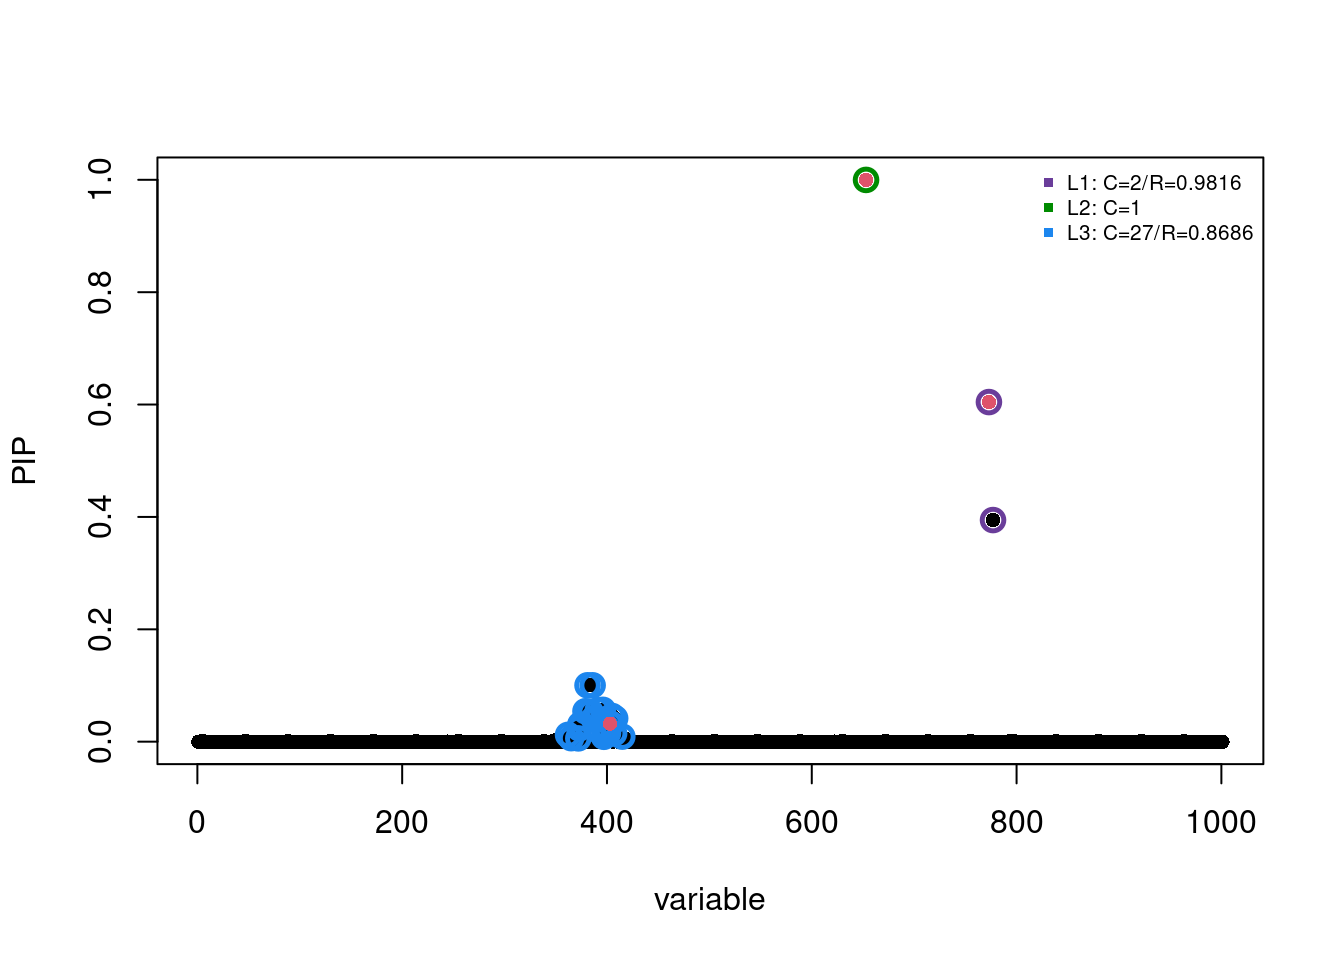
Choice of prior effect size:
fitted2 = susie(X, y, L = 10, estimate_prior_variance = FALSE, scaled_prior_variance = 0.2)
susie_plot(fitted2, y='PIP', b=b, add_legend=T)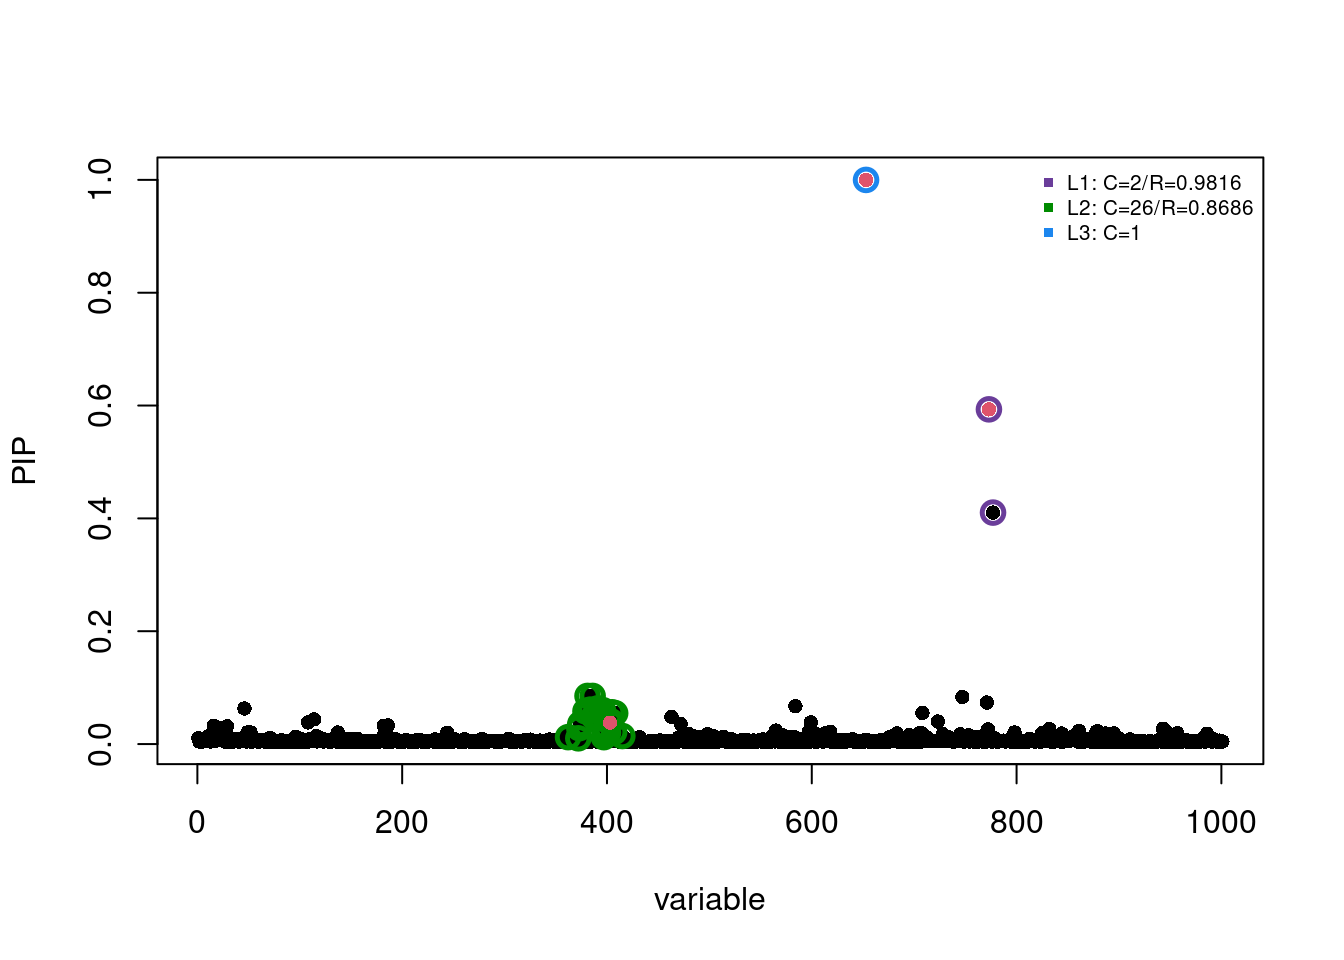
fitted2 = susie(X, y, L = 10, estimate_prior_variance = FALSE, scaled_prior_variance = 0.001)
susie_plot(fitted2, y='PIP', b=b, add_legend=T)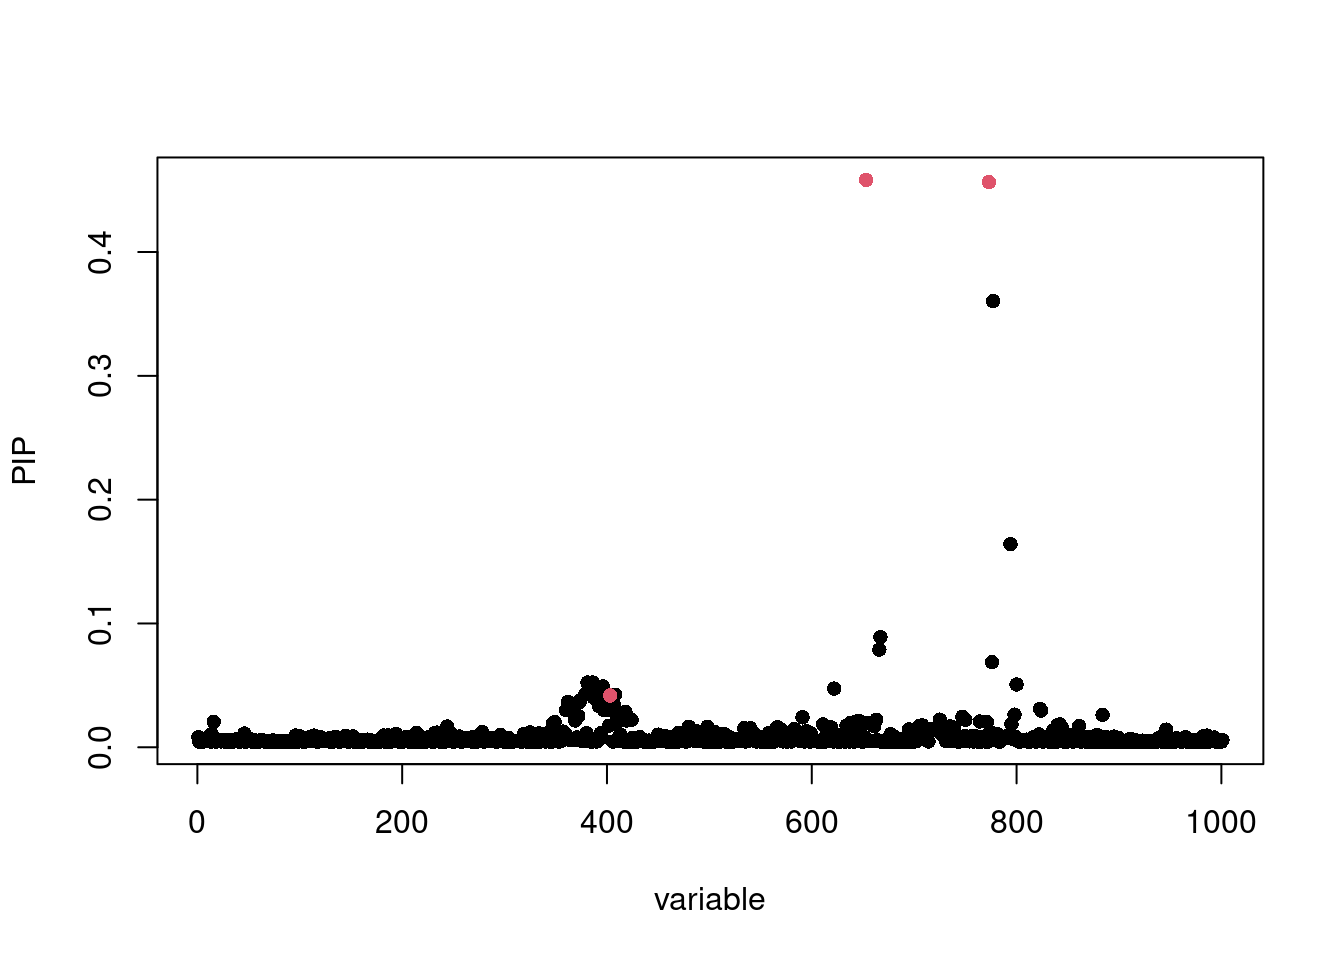
Fine-mapping with summary statistics via susie_rss
z-scores are provided and we can compute R from X.
R <- cor(X)
fitted_rss <- susie_rss(z_scores, R, L = 10)
WARNING: Providing the sample size (n), or even a rough estimate of n, is highly recommended. Without n, the implicit assumption is n is large (Inf) and the effect sizes are small (close to zero).plot(fitted$pip, fitted_rss$pip, ylim=c(0,1))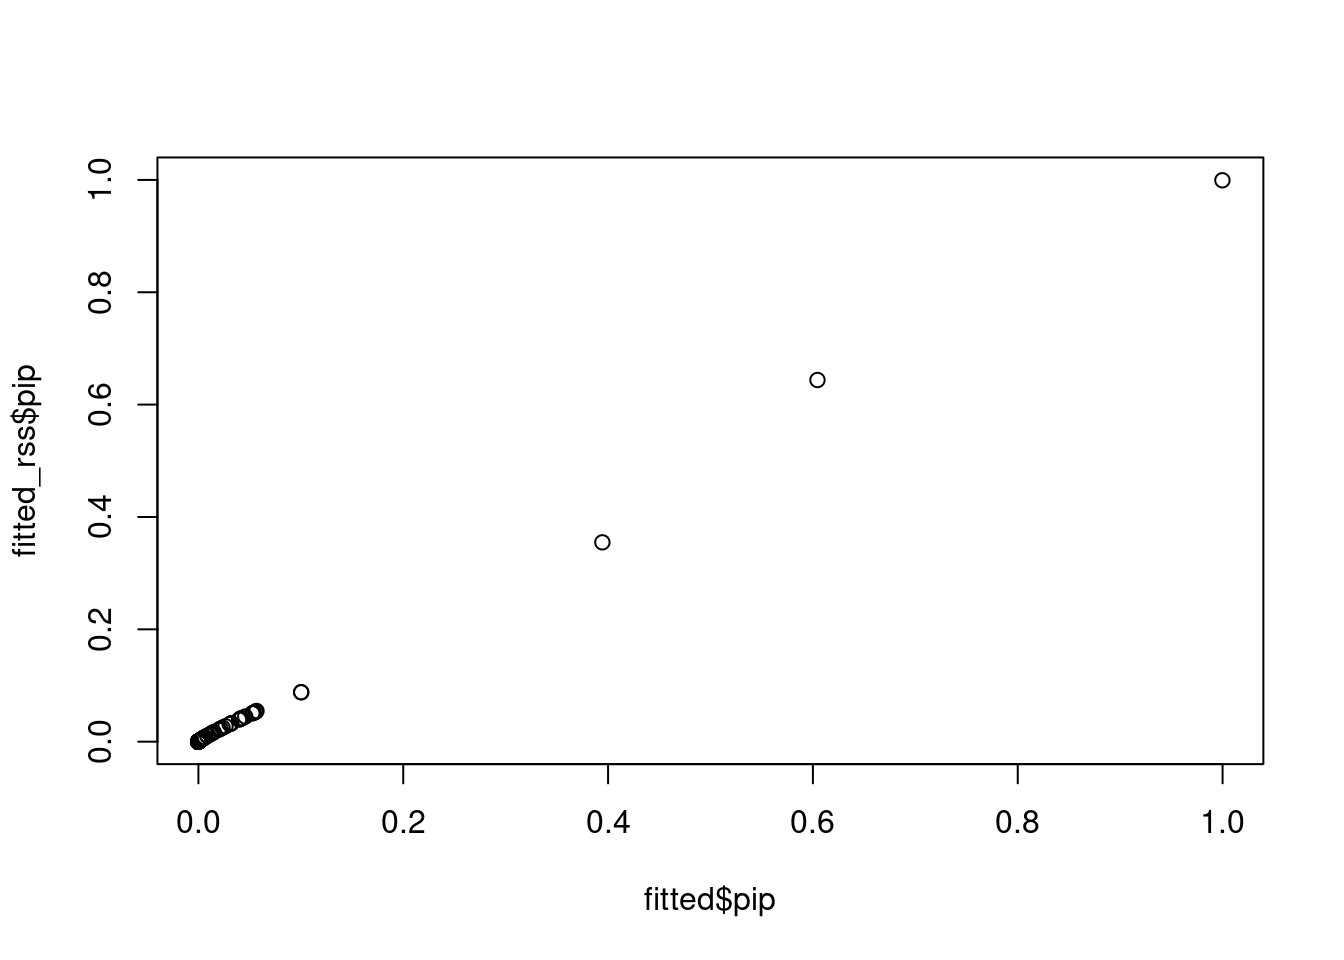
Credit
Credit to Gao Wang: https://statgenetics.github.io/statgen-courses/notebooks/finemapping.html#Fine-mapping-with-summary-statistics-via-susie_rss-6
sessionInfo()R version 4.1.0 (2021-05-18)
Platform: x86_64-pc-linux-gnu (64-bit)
Running under: CentOS Linux 7 (Core)
Matrix products: default
BLAS: /software/R-4.1.0-no-openblas-el7-x86_64/lib64/R/lib/libRblas.so
LAPACK: /software/R-4.1.0-no-openblas-el7-x86_64/lib64/R/lib/libRlapack.so
locale:
[1] LC_CTYPE=en_US.UTF-8 LC_NUMERIC=C LC_TIME=C
[4] LC_COLLATE=C LC_MONETARY=C LC_MESSAGES=C
[7] LC_PAPER=C LC_NAME=C LC_ADDRESS=C
[10] LC_TELEPHONE=C LC_MEASUREMENT=C LC_IDENTIFICATION=C
attached base packages:
[1] stats graphics grDevices utils datasets methods base
other attached packages:
[1] susieR_0.12.35
loaded via a namespace (and not attached):
[1] tidyselect_1.1.1 xfun_0.38 bslib_0.4.2 purrr_0.3.4
[5] lattice_0.20-44 colorspace_2.0-2 vctrs_0.3.8 generics_0.1.0
[9] htmltools_0.5.5 yaml_2.2.1 utf8_1.2.1 rlang_1.1.0
[13] mixsqp_0.3-48 jquerylib_0.1.4 later_1.2.0 pillar_1.6.1
[17] glue_1.4.2 DBI_1.1.1 RcppZiggurat_0.1.6 plyr_1.8.6
[21] matrixStats_0.59.0 lifecycle_1.0.3 stringr_1.4.0 munsell_0.5.0
[25] gtable_0.3.0 workflowr_1.6.2 evaluate_0.20 knitr_1.42
[29] fastmap_1.1.0 httpuv_1.6.1 parallel_4.1.0 irlba_2.3.3
[33] fansi_0.5.0 Rfast_2.0.6 highr_0.9 Rcpp_1.0.9
[37] promises_1.2.0.1 scales_1.1.1 cachem_1.0.5 jsonlite_1.7.2
[41] fs_1.6.1 ggplot2_3.3.5 digest_0.6.27 stringi_1.6.2
[45] dplyr_1.0.7 rprojroot_2.0.2 grid_4.1.0 cli_3.6.1
[49] tools_4.1.0 magrittr_2.0.1 sass_0.4.0 tibble_3.1.2
[53] crayon_1.5.2 pkgconfig_2.0.3 ellipsis_0.3.2 Matrix_1.3-3
[57] reshape_0.8.8 assertthat_0.2.1 rmarkdown_2.21 rstudioapi_0.13
[61] R6_2.5.0 git2r_0.28.0 compiler_4.1.0