Differential expression analysis–EdgeR quasi-likelihood F-tests
Siming Zhao
December 2, 2018
Last updated: 2018-12-17
workflowr checks: (Click a bullet for more information)-
✔ R Markdown file: up-to-date
Great! Since the R Markdown file has been committed to the Git repository, you know the exact version of the code that produced these results.
-
✔ Environment: empty
Great job! The global environment was empty. Objects defined in the global environment can affect the analysis in your R Markdown file in unknown ways. For reproduciblity it’s best to always run the code in an empty environment.
-
✔ Seed:
set.seed(20181119)The command
set.seed(20181119)was run prior to running the code in the R Markdown file. Setting a seed ensures that any results that rely on randomness, e.g. subsampling or permutations, are reproducible. -
✔ Session information: recorded
Great job! Recording the operating system, R version, and package versions is critical for reproducibility.
-
Great! You are using Git for version control. Tracking code development and connecting the code version to the results is critical for reproducibility. The version displayed above was the version of the Git repository at the time these results were generated.✔ Repository version: 49ecf6e
Note that you need to be careful to ensure that all relevant files for the analysis have been committed to Git prior to generating the results (you can usewflow_publishorwflow_git_commit). workflowr only checks the R Markdown file, but you know if there are other scripts or data files that it depends on. Below is the status of the Git repository when the results were generated:
Note that any generated files, e.g. HTML, png, CSS, etc., are not included in this status report because it is ok for generated content to have uncommitted changes.Ignored files: Ignored: .Rhistory Ignored: .Rproj.user/ Ignored: analysis/Quality_metrics_cache/ Ignored: analysis/figure/
Expand here to see past versions:
Load data
source("code/summary_functions.R")
library(dplyr)
load("data/DE_input.Rd")
glocus <- "VPS45"
dim(dm)[1]NULLgcount <- dm[1:(dim(dm)[1]-76), colnames(dm1dfagg)[dm1dfagg[glocus,] >0 & nlocus==1]]
# negative control cells defined as neg gRNA targeted cells
ncount <- dm[1:(dim(dm)[1]-76), colnames(dm1dfagg)[dm1dfagg["neg",] >0 & nlocus==1]]
coldata <- data.frame(row.names = c(colnames(gcount),colnames(ncount)),
condition=c(rep('G',dim(gcount)[2]),rep('N',dim(ncount)[2])))
countall <- cbind(gcount,ncount)
totalcount <- apply(countall,1,sum)
cellpercent <- apply(countall,1,function(x) length(x[x>0])/length(x))edgeR quasi-likelihood F-tests function
library(edgeR)
run_edgeR <- function(y) {
  # y is DGElist object
  y <- calcNormFactors(y)
  group=coldata$condition
  design <- model.matrix(~group)
  y <- estimateDisp(y,design)
  fitqlf <- glmQLFit(y,design)
  qlf <- glmQLFTest(fitqlf,coef=2)
  summ_pvalues(qlf$table$PValue)
  out <- topTags(qlf, n=Inf, adjust.method = "BH")
  outsig <- subset(out$table,FDR <0.1)
  print(paste0("There are ",dim(outsig)[1], " genes passed FDR <0.1 cutoff"))
  print(knitr::kable(signif(as.matrix(head(out$table[order(out$table$PValue),])),digit=2)))
  return(out)
}
Run edgeR–No filtering
y <- DGEList(counts= countall,group=coldata$condition)
res <- run_edgeR(y)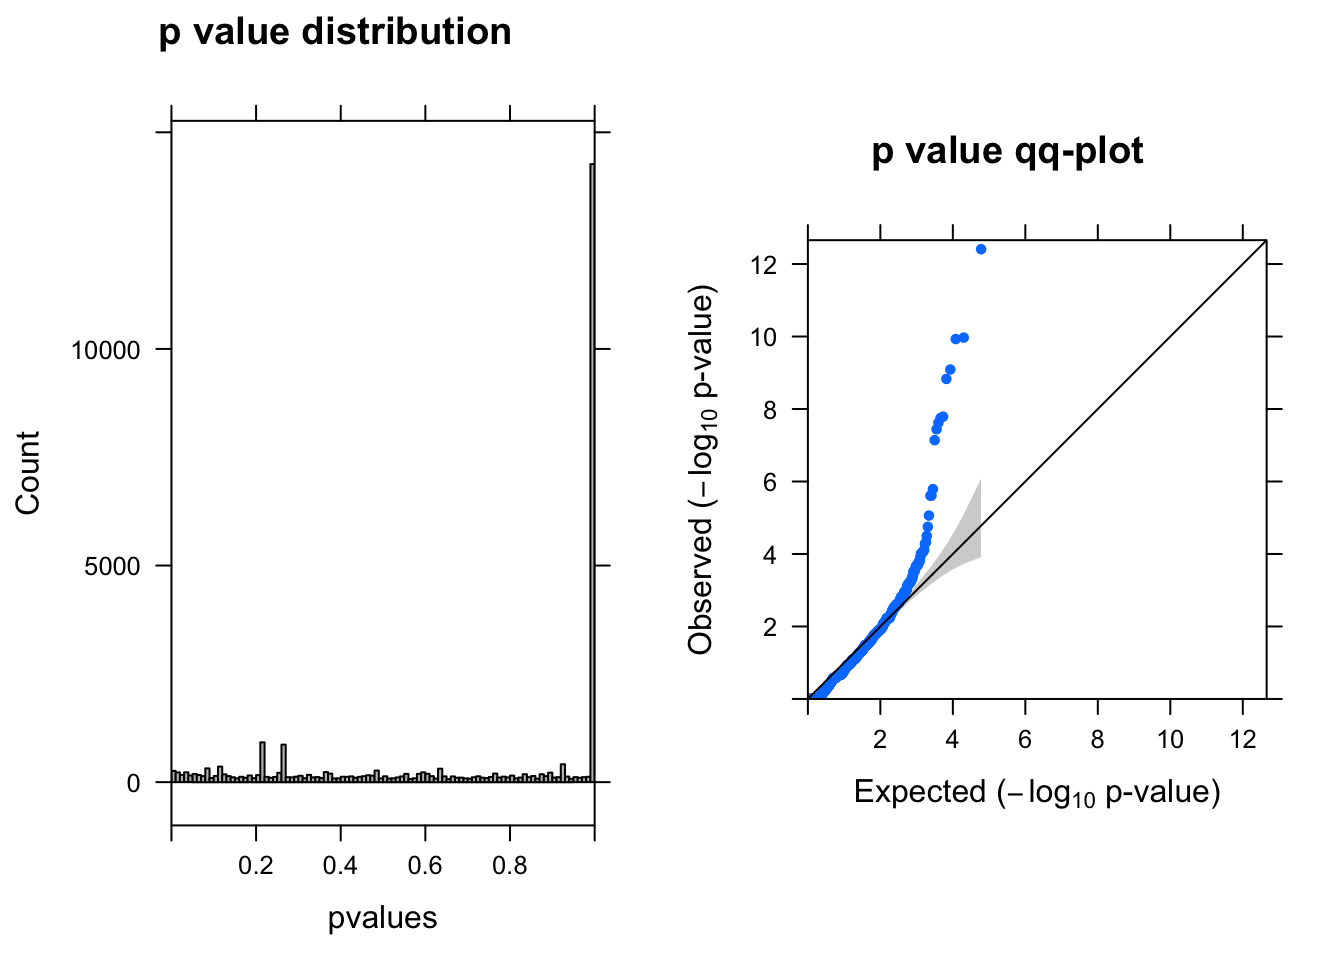
Expand here to see past versions of edgeRall-1.png:
| Version | Author | Date |
|---|---|---|
| 49ecf6e | simingz | 2018-12-16 |
[1] "There are 18 genes passed FDR <0.1 cutoff"

                      logFC   logCPM    F   PValue       FDR
-------------------  ------  -------  ---  -------  --------
ENSG00000176956.12     -2.8      6.6   59        0   0.0e+00
ENSG00000100097.11     -2.3      6.6   45        0   1.2e-06
ENSG00000130203.9      -1.8      6.4   45        0   1.2e-06
ENSG00000100300.17     -1.6      6.4   41        0   6.0e-06
ENSG00000138136.6      -2.0      6.4   39        0   8.8e-06
ENSG00000089116.3      -1.5      6.3   37        0   7.6e-05
Run edgeR–at least one cell UMI > 0
y <- DGEList(counts= countall[totalcount>0,],group=coldata$condition)
res <- run_edgeR(y)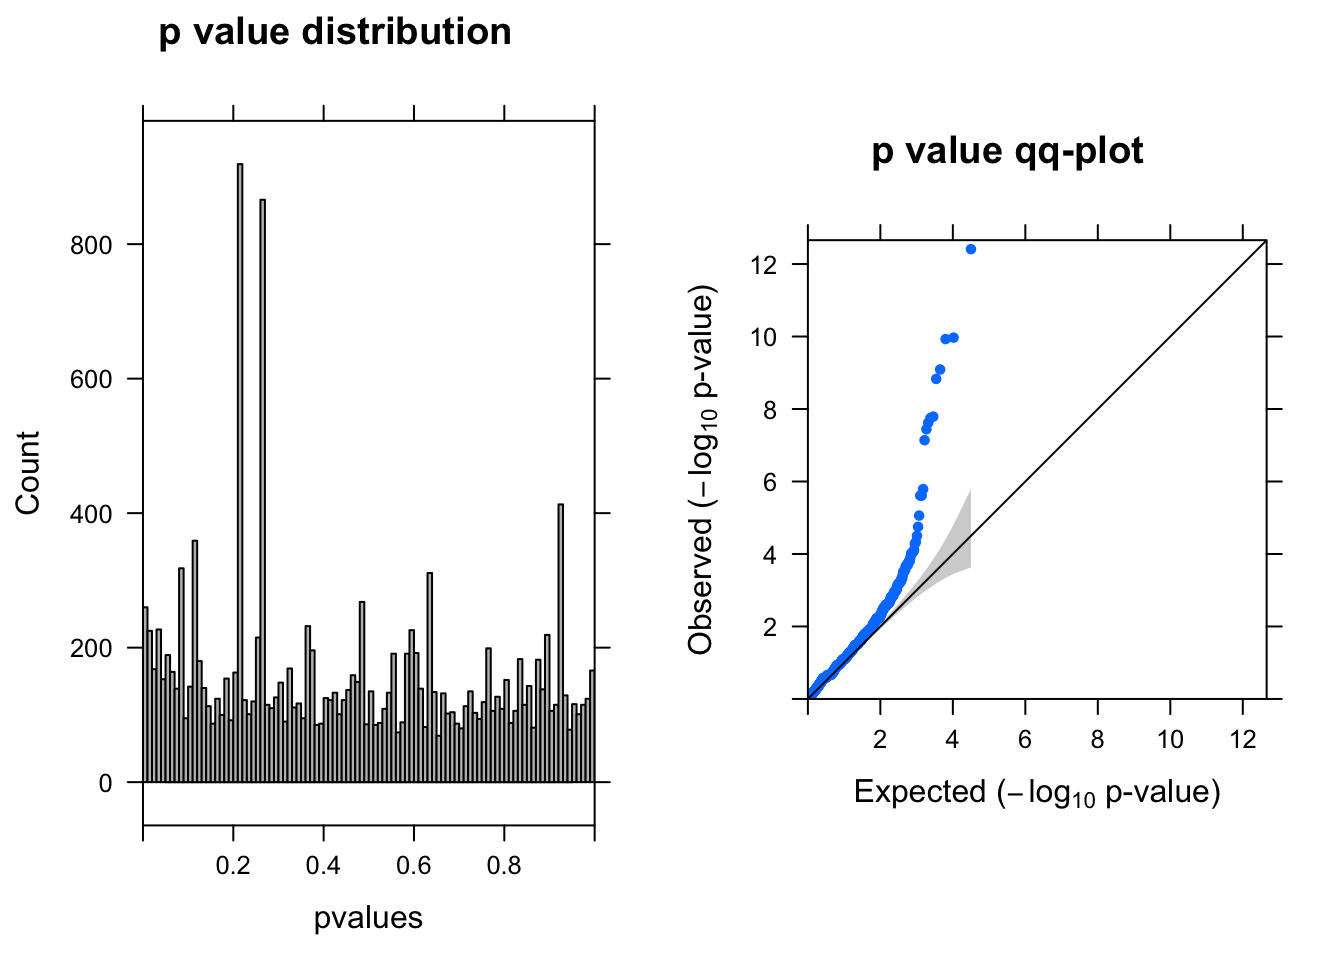
Expand here to see past versions of edgeR>0-1.png:
Version
Author
Date
49ecf6e
simingz
2018-12-16
[1] "There are 26 genes passed FDR <0.1 cutoff"

                      logFC   logCPM    F   PValue       FDR
-------------------  ------  -------  ---  -------  --------
ENSG00000176956.12     -2.8      6.6   59        0   0.0e+00
ENSG00000100097.11     -2.3      6.6   45        0   6.0e-07
ENSG00000130203.9      -1.8      6.4   45        0   6.0e-07
ENSG00000100300.17     -1.6      6.4   41        0   3.2e-06
ENSG00000138136.6      -2.0      6.4   39        0   4.6e-06
ENSG00000089116.3      -1.5      6.3   37        0   4.0e-05
Run edgeR–3% cells with UMI > 0
y <- DGEList(counts= countall[cellpercent > 0.03,],group=coldata$condition)
res <- run_edgeR(y)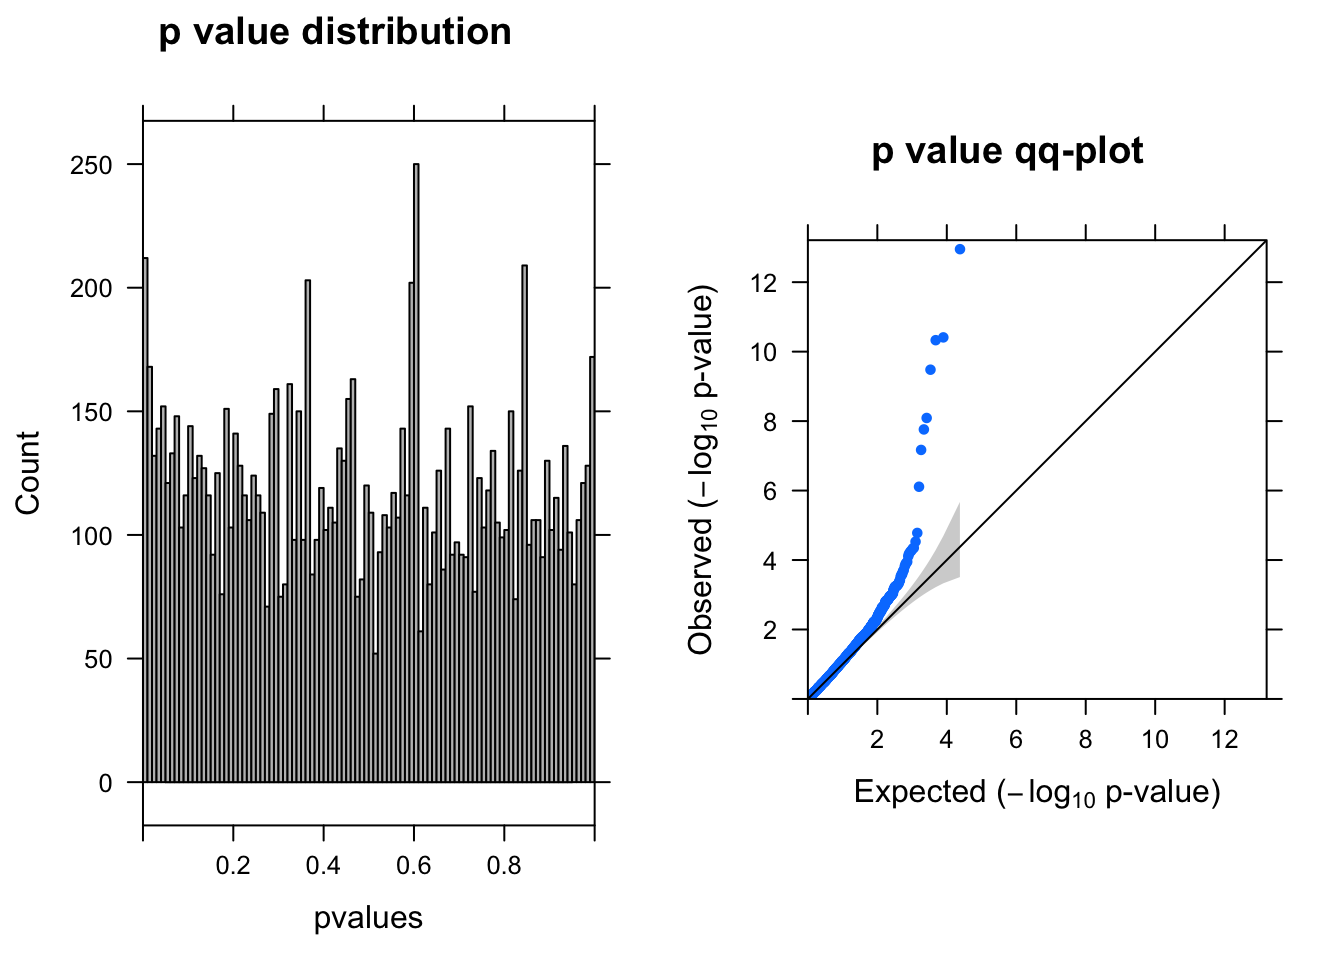
Expand here to see past versions of edgeR0.03-1.png:
| Version | Author | Date |
|---|---|---|
| 49ecf6e | simingz | 2018-12-16 |
[1] "There are 20 genes passed FDR <0.1 cutoff"

                      logFC   logCPM    F   PValue       FDR
-------------------  ------  -------  ---  -------  --------
ENSG00000176956.12     -2.8      6.6   61        0   0.0e+00
ENSG00000100097.11     -2.3      6.6   47        0   2.0e-07
ENSG00000130203.9      -1.9      6.4   47        0   2.0e-07
ENSG00000100300.17     -1.6      6.4   43        0   1.0e-06
ENSG00000175899.14     -1.6      6.9   35        0   1.9e-05
ENSG00000198417.6      -1.6      6.4   34        0   3.5e-05
Run edgeR–10% cells with UMI > 0
y <- DGEList(counts= countall[cellpercent > 0.1,],group=coldata$condition)
res <- run_edgeR(y)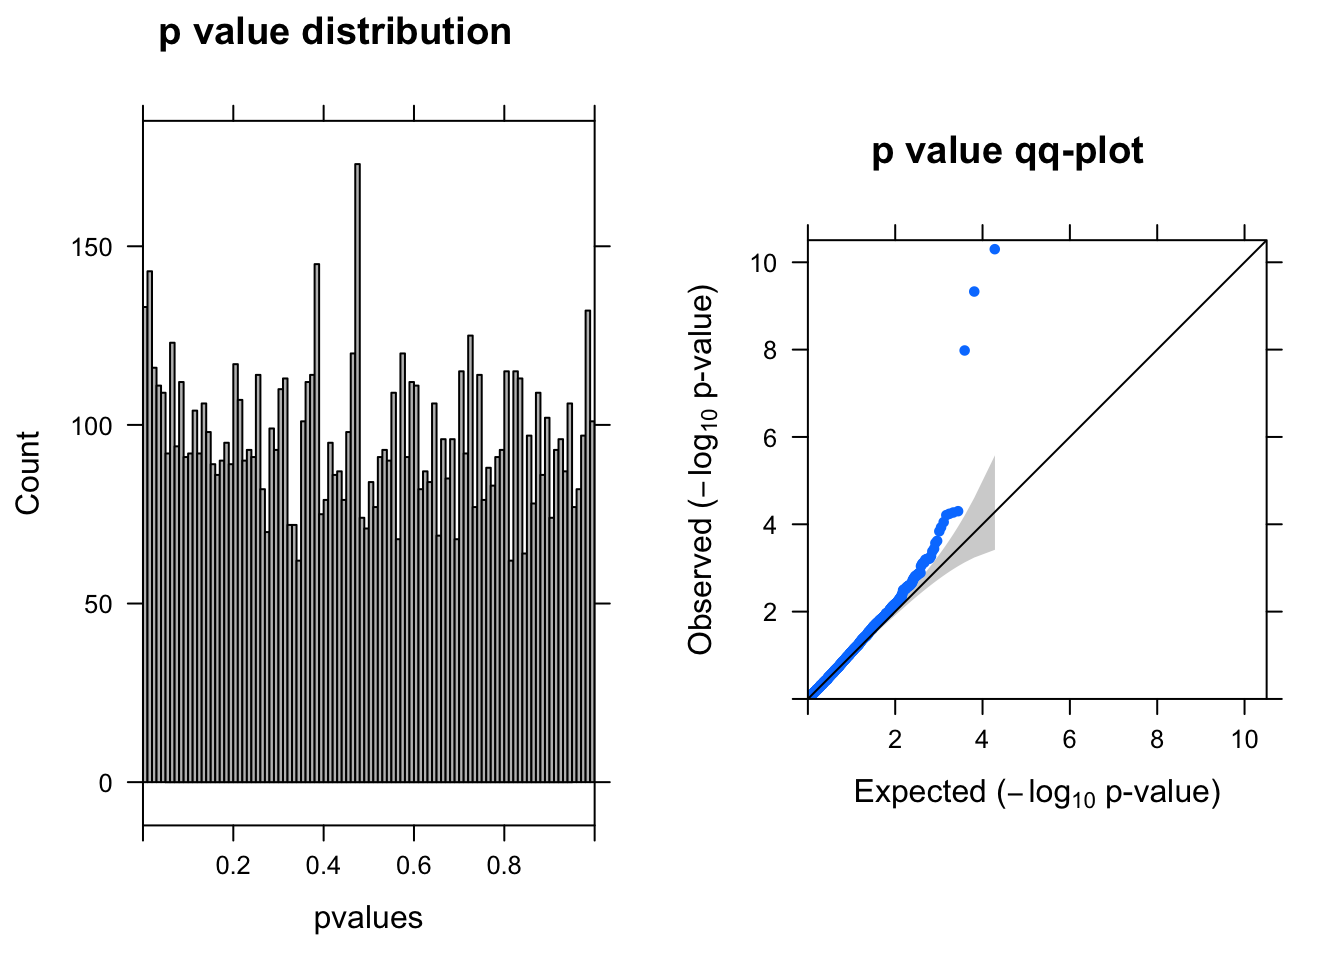
Expand here to see past versions of edgeR0.1-1.png:
| Version | Author | Date |
|---|---|---|
| 49ecf6e | simingz | 2018-12-16 |
[1] "There are 7 genes passed FDR <0.1 cutoff"

                      logFC   logCPM    F    PValue       FDR
-------------------  ------  -------  ---  --------  --------
ENSG00000100097.11     -2.3      6.6   47   0.0e+00   5.0e-07
ENSG00000100300.17     -1.6      6.4   42   0.0e+00   2.3e-06
ENSG00000175899.14     -1.6      6.9   35   0.0e+00   3.4e-05
ENSG00000119906.11      1.1      6.5   20   5.0e-05   8.4e-02
ENSG00000111057.10      1.3      7.1   17   5.3e-05   8.4e-02
ENSG00000170293.8       1.1      6.6   17   5.7e-05   8.4e-02
Run edgeR–20% cells with UMI > 0
y <- DGEList(counts= countall[cellpercent > 0.2,],group=coldata$condition)
res <- run_edgeR(y)
Expand here to see past versions of edgeR0.2-1.png:
| Version | Author | Date |
|---|---|---|
| 49ecf6e | simingz | 2018-12-16 |
[1] "There are 1 genes passed FDR <0.1 cutoff"

                      logFC   logCPM    F    PValue       FDR
-------------------  ------  -------  ---  --------  --------
ENSG00000175899.14    -1.60      6.9   34   0.0e+00   0.00013
ENSG00000119906.11     1.10      6.5   20   4.8e-05   0.12000
ENSG00000170293.8      1.10      6.6   17   5.9e-05   0.12000
ENSG00000111057.10     1.30      7.1   16   7.3e-05   0.12000
ENSG00000172020.12    -0.91      8.2   16   9.0e-05   0.12000
ENSG00000219626.8     -0.99      6.5   18   9.2e-05   0.12000
Parameters used
- We used data processed after QC step here.
- targeted locus, choose VPS45.
Session information
sessionInfo()R version 3.5.1 (2018-07-02)
Platform: x86_64-apple-darwin14.5.0 (64-bit)
Running under: OS X El Capitan 10.11.6
Matrix products: default
BLAS: /System/Library/Frameworks/Accelerate.framework/Versions/A/Frameworks/vecLib.framework/Versions/A/libBLAS.dylib
LAPACK: /System/Library/Frameworks/Accelerate.framework/Versions/A/Frameworks/vecLib.framework/Versions/A/libLAPACK.dylib
locale:
[1] en_US.UTF-8/en_US.UTF-8/en_US.UTF-8/C/en_US.UTF-8/en_US.UTF-8
attached base packages:
[1] grid stats graphics grDevices utils datasets methods
[8] base
other attached packages:
[1] gridExtra_2.3 lattice_0.20-35 edgeR_3.22.5 limma_3.36.5
[5] Matrix_1.2-14 dplyr_0.7.6
loaded via a namespace (and not attached):
[1] Rcpp_1.0.0 compiler_3.5.1 pillar_1.3.0
[4] git2r_0.23.0 highr_0.7 workflowr_1.1.1
[7] bindr_0.1.1 R.methodsS3_1.7.1 R.utils_2.7.0
[10] tools_3.5.1 digest_0.6.18 evaluate_0.12
[13] tibble_1.4.2 gtable_0.2.0 pkgconfig_2.0.2
[16] rlang_0.3.0.1 yaml_2.2.0 bindrcpp_0.2.2
[19] stringr_1.3.1 knitr_1.20 locfit_1.5-9.1
[22] rprojroot_1.3-2 tidyselect_0.2.4 glue_1.3.0
[25] R6_2.3.0 rmarkdown_1.10 purrr_0.2.5
[28] magrittr_1.5 whisker_0.3-2 backports_1.1.2
[31] htmltools_0.3.6 splines_3.5.1 assertthat_0.2.0
[34] stringi_1.2.4 crayon_1.3.4 R.oo_1.22.0 This reproducible R Markdown analysis was created with workflowr 1.1.1