SCZ - Brain Amygdala
sheng Qian
2021-2-6
Last updated: 2022-04-19
Checks: 5 2
Knit directory: cTWAS_analysis/
This reproducible R Markdown analysis was created with workflowr (version 1.7.0). The Checks tab describes the reproducibility checks that were applied when the results were created. The Past versions tab lists the development history.
The R Markdown file has unstaged changes. To know which version of the R Markdown file created these results, you’ll want to first commit it to the Git repo. If you’re still working on the analysis, you can ignore this warning. When you’re finished, you can run wflow_publish to commit the R Markdown file and build the HTML.
Great job! The global environment was empty. Objects defined in the global environment can affect the analysis in your R Markdown file in unknown ways. For reproduciblity it’s best to always run the code in an empty environment.
The command set.seed(20211220) was run prior to running the code in the R Markdown file. Setting a seed ensures that any results that rely on randomness, e.g. subsampling or permutations, are reproducible.
Great job! Recording the operating system, R version, and package versions is critical for reproducibility.
Nice! There were no cached chunks for this analysis, so you can be confident that you successfully produced the results during this run.
Using absolute paths to the files within your workflowr project makes it difficult for you and others to run your code on a different machine. Change the absolute path(s) below to the suggested relative path(s) to make your code more reproducible.
| absolute | relative |
|---|---|
| /project2/xinhe/shengqian/cTWAS/cTWAS_analysis/data/ | data |
| /project2/xinhe/shengqian/cTWAS/cTWAS_analysis/code/ctwas_config.R | code/ctwas_config.R |
Great! You are using Git for version control. Tracking code development and connecting the code version to the results is critical for reproducibility.
The results in this page were generated with repository version ba919ab. See the Past versions tab to see a history of the changes made to the R Markdown and HTML files.
Note that you need to be careful to ensure that all relevant files for the analysis have been committed to Git prior to generating the results (you can use wflow_publish or wflow_git_commit). workflowr only checks the R Markdown file, but you know if there are other scripts or data files that it depends on. Below is the status of the Git repository when the results were generated:
Ignored files:
    Ignored:    .ipynb_checkpoints/
    Ignored:    analysis/figure/
    Ignored:    data/AF/

Untracked files:
    Untracked:  Rplot.png
    Untracked:  analysis/.ipynb_checkpoints/
    Untracked:  code/.ipynb_checkpoints/
    Untracked:  code/AF_out/
    Untracked:  code/Autism_out/
    Untracked:  code/BMI_S_out/
    Untracked:  code/BMI_out/
    Untracked:  code/Glucose_out/
    Untracked:  code/LDL_S_out/
    Untracked:  code/SCZ_2014_EUR_out/
    Untracked:  code/SCZ_2018_out/
    Untracked:  code/SCZ_2020_Single_out/
    Untracked:  code/SCZ_2020_out/
    Untracked:  code/SCZ_S_out/
    Untracked:  code/SCZ_out/
    Untracked:  code/T2D_out/
    Untracked:  code/ctwas_config.R
    Untracked:  code/mapping.R
    Untracked:  code/out/
    Untracked:  code/process_scz_2018_snps.R
    Untracked:  code/run_AF_analysis.sbatch
    Untracked:  code/run_AF_analysis.sh
    Untracked:  code/run_AF_ctwas_rss_LDR.R
    Untracked:  code/run_Autism_analysis.sbatch
    Untracked:  code/run_Autism_analysis.sh
    Untracked:  code/run_Autism_ctwas_rss_LDR.R
    Untracked:  code/run_BMI_analysis.sbatch
    Untracked:  code/run_BMI_analysis.sh
    Untracked:  code/run_BMI_analysis_S.sbatch
    Untracked:  code/run_BMI_analysis_S.sh
    Untracked:  code/run_BMI_ctwas_rss_LDR.R
    Untracked:  code/run_BMI_ctwas_rss_LDR_S.R
    Untracked:  code/run_Glucose_analysis.sbatch
    Untracked:  code/run_Glucose_analysis.sh
    Untracked:  code/run_Glucose_ctwas_rss_LDR.R
    Untracked:  code/run_LDL_analysis_S.sbatch
    Untracked:  code/run_LDL_analysis_S.sh
    Untracked:  code/run_LDL_ctwas_rss_LDR_S.R
    Untracked:  code/run_SCZ_2014_EUR_analysis.sbatch
    Untracked:  code/run_SCZ_2014_EUR_analysis.sh
    Untracked:  code/run_SCZ_2014_EUR_ctwas_rss_LDR.R
    Untracked:  code/run_SCZ_2018_analysis.sbatch
    Untracked:  code/run_SCZ_2018_analysis.sh
    Untracked:  code/run_SCZ_2018_ctwas_rss_LDR.R
    Untracked:  code/run_SCZ_2020_Single_analysis.sbatch
    Untracked:  code/run_SCZ_2020_Single_analysis.sh
    Untracked:  code/run_SCZ_2020_Single_ctwas_rss_LDR.R
    Untracked:  code/run_SCZ_2020_analysis.sbatch
    Untracked:  code/run_SCZ_2020_analysis.sh
    Untracked:  code/run_SCZ_2020_ctwas_rss_LDR.R
    Untracked:  code/run_SCZ_analysis.sbatch
    Untracked:  code/run_SCZ_analysis.sh
    Untracked:  code/run_SCZ_analysis_S.sbatch
    Untracked:  code/run_SCZ_analysis_S.sh
    Untracked:  code/run_SCZ_ctwas_rss_LDR.R
    Untracked:  code/run_SCZ_ctwas_rss_LDR_S.R
    Untracked:  code/run_T2D_analysis.sbatch
    Untracked:  code/run_T2D_analysis.sh
    Untracked:  code/run_T2D_ctwas_rss_LDR.R
    Untracked:  code/wflow_build.R
    Untracked:  code/wflow_build.sbatch
    Untracked:  data/.ipynb_checkpoints/
    Untracked:  data/BMI/
    Untracked:  data/GO_Terms/
    Untracked:  data/PGC3_SCZ_wave3_public.v2.tsv
    Untracked:  data/SCZ/
    Untracked:  data/SCZ_2014_EUR/
    Untracked:  data/SCZ_2018/
    Untracked:  data/SCZ_2020/
    Untracked:  data/SCZ_2020_Single/
    Untracked:  data/SCZ_S/
    Untracked:  data/Supplementary Table 15 - MAGMA.xlsx
    Untracked:  data/Supplementary Table 20 - Prioritised Genes.xlsx
    Untracked:  data/T2D/
    Untracked:  data/UKBB/
    Untracked:  data/UKBB_SNPs_Info.text
    Untracked:  data/gene_OMIM.txt
    Untracked:  data/gene_pip_0.8.txt
    Untracked:  data/mashr_Heart_Atrial_Appendage.db
    Untracked:  data/mashr_sqtl/
    Untracked:  data/scz_2018.RDS
    Untracked:  data/summary_known_genes_annotations.xlsx
    Untracked:  data/untitled.txt
    Untracked:  top_genes_32.txt
    Untracked:  top_genes_37.txt
    Untracked:  top_genes_43.txt
    Untracked:  top_genes_81.txt

Unstaged changes:
    Modified:   analysis/SCZ_2018_Brain_Amygdala.Rmd
    Modified:   analysis/SCZ_2018_Brain_Anterior_cingulate_cortex_BA24.Rmd
    Modified:   analysis/SCZ_2018_Brain_Caudate_basal_ganglia.Rmd
    Modified:   analysis/SCZ_2018_Brain_Cerebellar_Hemisphere.Rmd
    Modified:   analysis/SCZ_2018_Brain_Cerebellum.Rmd
    Modified:   analysis/SCZ_2018_Brain_Cortex.Rmd
    Modified:   analysis/SCZ_2018_Brain_Frontal_Cortex_BA9.Rmd
    Modified:   analysis/SCZ_2018_Brain_Hippocampus.Rmd
    Modified:   analysis/SCZ_2018_Brain_Hypothalamus.Rmd
    Modified:   analysis/SCZ_2018_Brain_Nucleus_accumbens_basal_ganglia.Rmd
    Modified:   analysis/SCZ_2018_Brain_Putamen_basal_ganglia.Rmd
    Modified:   analysis/SCZ_2018_Brain_Spinal_cord_cervical_c-1.Rmd
    Modified:   analysis/SCZ_2018_Brain_Substantia_nigra.Rmd
    Modified:   analysis/SCZ_Annotation_Analysis.Rmd
Note that any generated files, e.g. HTML, png, CSS, etc., are not included in this status report because it is ok for generated content to have uncommitted changes.
These are the previous versions of the repository in which changes were made to the R Markdown (analysis/SCZ_2018_Brain_Amygdala.Rmd) and HTML (docs/SCZ_2018_Brain_Amygdala.html) files. If you’ve configured a remote Git repository (see ?wflow_git_remote), click on the hyperlinks in the table below to view the files as they were in that past version.
| File | Version | Author | Date | Message |
|---|---|---|---|---|
| Rmd | 9ddc9c4 | sq-96 | 2022-04-18 | update |
| Rmd | f6e7062 | sq-96 | 2022-04-17 | update |
| html | f6e7062 | sq-96 | 2022-04-17 | update |
Weight QC
#number of imputed weights
nrow(qclist_all)
[1] 8763#number of imputed weights by chromosome
table(qclist_all$chr)
  1   2   3   4   5   6   7   8   9  10  11  12  13  14  15  16  17  18  19  20
857 634 491 344 439 522 412 309 342 339 551 509 196 285 296 349 522 147 694 272
 21  22
 23 230
#number of imputed weights without missing variants
sum(qclist_all$nmiss==0)[1] 6434#proportion of imputed weights without missing variants
mean(qclist_all$nmiss==0)[1] 0.7342Check convergence of parameters
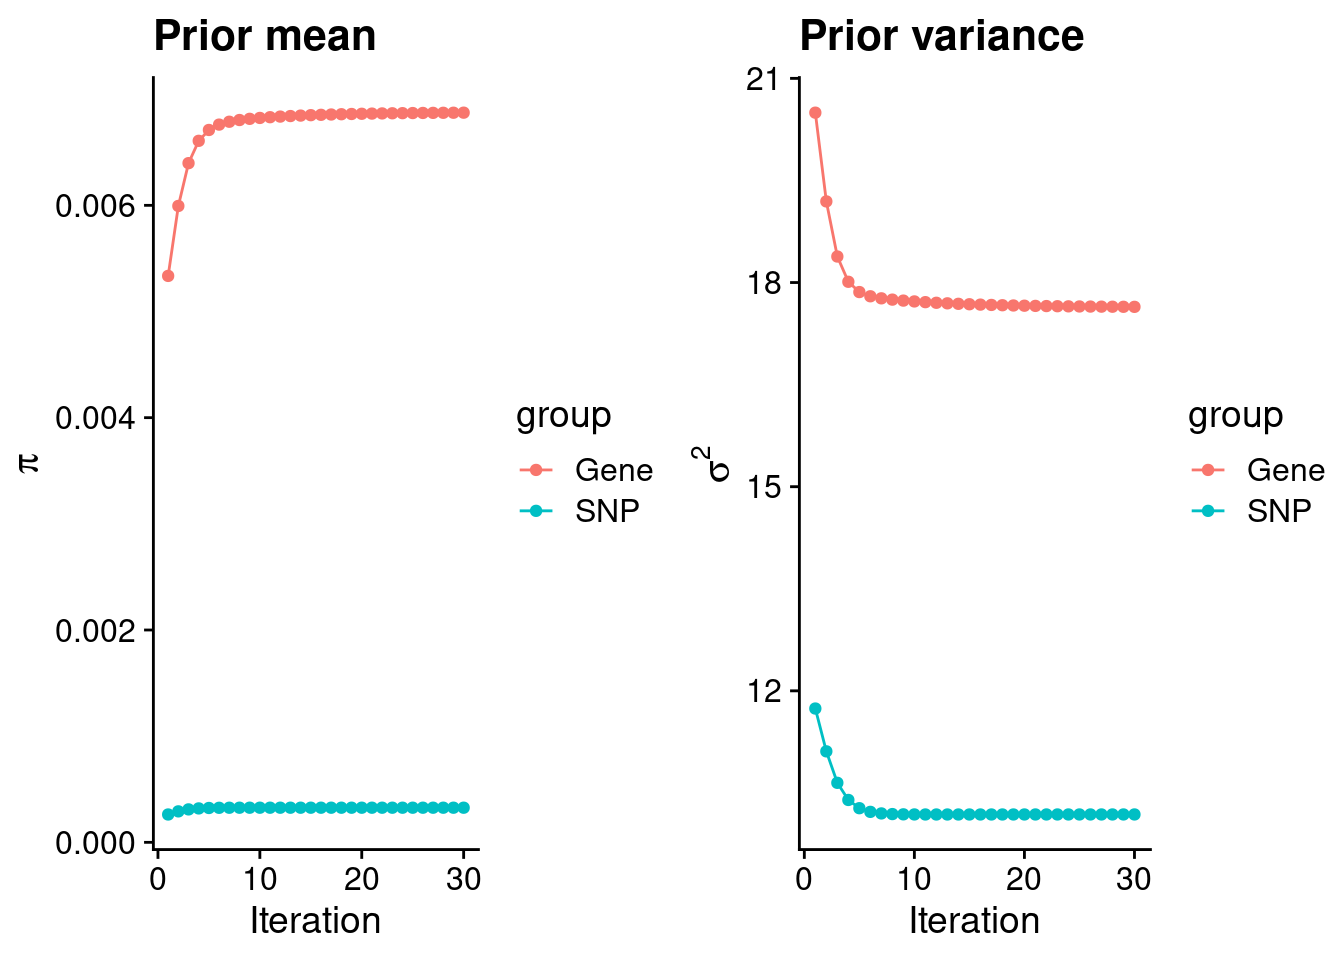
#estimated group prior
estimated_group_prior <- group_prior_rec[,ncol(group_prior_rec)]
names(estimated_group_prior) <- c("gene", "snp")
estimated_group_prior["snp"] <- estimated_group_prior["snp"]*thin #adjust parameter to account for thin argument
print(estimated_group_prior)
gene snp
0.0068728 0.0003262 #estimated group prior variance
estimated_group_prior_var <- group_prior_var_rec[,ncol(group_prior_var_rec)]
names(estimated_group_prior_var) <- c("gene", "snp")
print(estimated_group_prior_var) gene snp
17.64 10.18 #report sample size
print(sample_size)[1] 105318#report group size
group_size <- c(nrow(ctwas_gene_res), n_snps)
print(group_size)[1] 8763 6309950#estimated group PVE
estimated_group_pve <- estimated_group_prior_var*estimated_group_prior*group_size/sample_size #check PVE calculation
names(estimated_group_pve) <- c("gene", "snp")
print(estimated_group_pve) gene snp
0.01009 0.19900 #compare sum(PIP*mu2/sample_size) with above PVE calculation
c(sum(ctwas_gene_res$PVE),sum(ctwas_snp_res$PVE))[1] 0.03318 1.09729Genes with highest PIPs
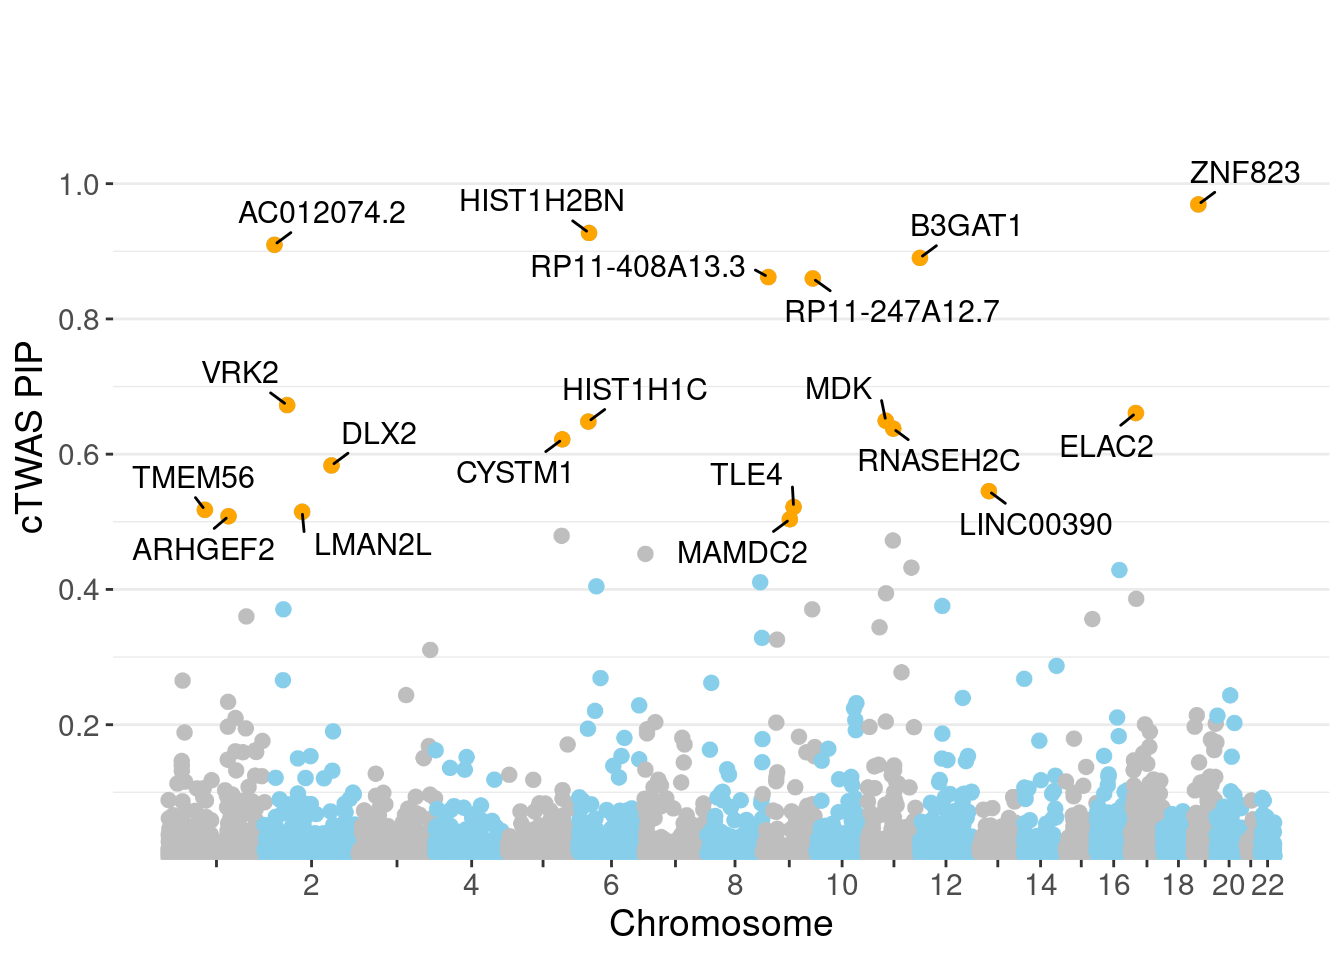
           genename region_tag susie_pip    mu2       PVE      z num_eqtl
10169        ZNF823      19_10    0.9693  38.09 0.0003506  6.143        1
11179     HIST1H2BN       6_21    0.9271 147.71 0.0013003 13.396        1
11222    AC012074.2       2_15    0.9096  23.50 0.0002030  4.671        2
2362         B3GAT1      11_84    0.8902  30.20 0.0002553 -5.211        2
12505 RP11-408A13.3       9_12    0.8618  24.23 0.0001983  4.536        1
12183 RP11-247A12.7       9_66    0.8599  23.99 0.0001959  4.683        1
296            VRK2       2_38    0.6725  39.11 0.0002498  4.977        1
93            ELAC2      17_11    0.6609  25.64 0.0001609  4.752        1
2406            MDK      11_28    0.6495  49.33 0.0003042 -7.159        1
9695       HIST1H1C       6_20    0.6481  26.32 0.0001620  4.586        2
8298       RNASEH2C      11_36    0.6378  26.54 0.0001607 -4.491        1
3251         CYSTM1       5_83    0.6219  26.62 0.0001572 -4.480        1
2889           DLX2      2_104    0.5833  23.13 0.0001281  4.259        1
10971     LINC00390      13_17    0.5453  23.40 0.0001211 -4.536        1
2135           TLE4       9_38    0.5220  22.83 0.0001132 -4.279        1
5997         TMEM56       1_58    0.5177  29.60 0.0001455 -3.907        1
2782         LMAN2L       2_57    0.5148  30.65 0.0001498 -4.276        2
2951        ARHGEF2       1_76    0.5083  26.14 0.0001261  3.816        1
7221         MAMDC2       9_31    0.5037  25.77 0.0001232  4.125        1
377          CTNNA1       5_82    0.4793  27.63 0.0001257  5.491        1
Genes with largest effect sizes
       genename region_tag susie_pip    mu2       PVE       z num_eqtl
10468   ABHD16A       6_27 4.173e-08 234.37 9.286e-11  11.526        1
10465      MSH5       6_27 3.268e-08 233.32 7.241e-11  11.506        1
11458       C4A       6_27 7.516e-09 225.88 1.612e-11  11.326        1
10473      APOM       6_27 6.379e-10 179.20 1.085e-12   9.901        2
11179 HIST1H2BN       6_21 9.271e-01 147.71 1.300e-03  13.396        1
10445    AGPAT1       6_27 1.035e-10 110.58 1.087e-13  -5.190        1
9573     BTN3A2       6_20 9.453e-03  98.01 8.797e-06  10.797        2
8899   HLA-DQB1       6_27 8.804e-09  95.42 7.977e-12   4.624        1
10707     DDAH2       6_27 8.193e-09  91.92 7.151e-12   8.149        1
9980   HLA-DQA1       6_27 1.524e-07  89.62 1.297e-10   4.441        1
10436   HLA-DMA       6_27 2.720e-04  88.71 2.291e-07  -8.845        1
4692      FLOT1       6_24 5.245e-02  85.97 4.282e-05 -10.981        1
9870   HLA-DRB1       6_27 3.229e-09  85.82 2.631e-12   5.077        1
8984  HIST1H2BC       6_20 1.367e-02  84.14 1.092e-05  -9.909        1
11286  HLA-DQA2       6_27 1.754e-08  80.00 1.332e-11  -3.704        2
1135   PPP1R13B      14_54 2.870e-01  63.46 1.729e-04  -7.019        2
11128   CYP21A2       6_27 2.000e-08  57.87 1.099e-11   5.267        2
437    MPHOSPH9      12_75 1.537e-01  56.89 8.301e-05   7.662        1
10231   ZKSCAN8       6_22 5.880e-03  56.79 3.171e-06   7.465        1
10458   SLC44A4       6_27 9.789e-06  55.82 5.188e-09   6.717        1
Genes with highest PVE
           genename region_tag susie_pip    mu2       PVE      z num_eqtl
11179     HIST1H2BN       6_21    0.9271 147.71 0.0013003 13.396        1
10169        ZNF823      19_10    0.9693  38.09 0.0003506  6.143        1
2406            MDK      11_28    0.6495  49.33 0.0003042 -7.159        1
2362         B3GAT1      11_84    0.8902  30.20 0.0002553 -5.211        2
296            VRK2       2_38    0.6725  39.11 0.0002498  4.977        1
11222    AC012074.2       2_15    0.9096  23.50 0.0002030  4.671        2
12505 RP11-408A13.3       9_12    0.8618  24.23 0.0001983  4.536        1
12183 RP11-247A12.7       9_66    0.8599  23.99 0.0001959  4.683        1
1135       PPP1R13B      14_54    0.2870  63.46 0.0001729 -7.019        2
9695       HIST1H1C       6_20    0.6481  26.32 0.0001620  4.586        2
93            ELAC2      17_11    0.6609  25.64 0.0001609  4.752        1
8298       RNASEH2C      11_36    0.6378  26.54 0.0001607 -4.491        1
3251         CYSTM1       5_83    0.6219  26.62 0.0001572 -4.480        1
3591          CNOT1      16_31    0.4287  37.81 0.0001539  6.215        1
2782         LMAN2L       2_57    0.5148  30.65 0.0001498 -4.276        2
5997         TMEM56       1_58    0.5177  29.60 0.0001455 -3.907        1
677         PPP2R5B      11_36    0.4723  31.35 0.0001406 -5.093        1
2889           DLX2      2_104    0.5833  23.13 0.0001281  4.259        1
2951        ARHGEF2       1_76    0.5083  26.14 0.0001261  3.816        1
377          CTNNA1       5_82    0.4793  27.63 0.0001257  5.491        1
Genes with largest z scores
genename region_tag susie_pip mu2 PVE z num_eqtl
11179 HIST1H2BN 6_21 9.271e-01 147.71 1.300e-03 13.396 1
10468 ABHD16A 6_27 4.173e-08 234.37 9.286e-11 11.526 1
10465 MSH5 6_27 3.268e-08 233.32 7.241e-11 11.506 1
11458 C4A 6_27 7.516e-09 225.88 1.612e-11 11.326 1
4692 FLOT1 6_24 5.245e-02 85.97 4.282e-05 -10.981 1
9573 BTN3A2 6_20 9.453e-03 98.01 8.797e-06 10.797 2
8984 HIST1H2BC 6_20 1.367e-02 84.14 1.092e-05 -9.909 1
10473 APOM 6_27 6.379e-10 179.20 1.085e-12 9.901 2
10436 HLA-DMA 6_27 2.720e-04 88.71 2.291e-07 -8.845 1
5778 CNNM2 10_66 6.889e-02 47.06 3.078e-05 -8.161 1
10707 DDAH2 6_27 8.193e-09 91.92 7.151e-12 8.149 1
437 MPHOSPH9 12_75 1.537e-01 56.89 8.301e-05 7.662 1
10231 ZKSCAN8 6_22 5.880e-03 56.79 3.171e-06 7.465 1
11226 ZSCAN31 6_22 7.515e-03 35.76 2.552e-06 -7.444 2
2406 MDK 11_28 6.495e-01 49.33 3.042e-04 -7.159 1
9987 ZSCAN16 6_22 6.258e-03 49.25 2.927e-06 7.135 1
1135 PPP1R13B 14_54 2.870e-01 63.46 1.729e-04 -7.019 2
8969 HARBI1 11_28 2.046e-01 46.57 9.046e-05 6.977 1
10510 LINC01556 6_22 9.927e-03 37.31 3.517e-06 -6.865 1
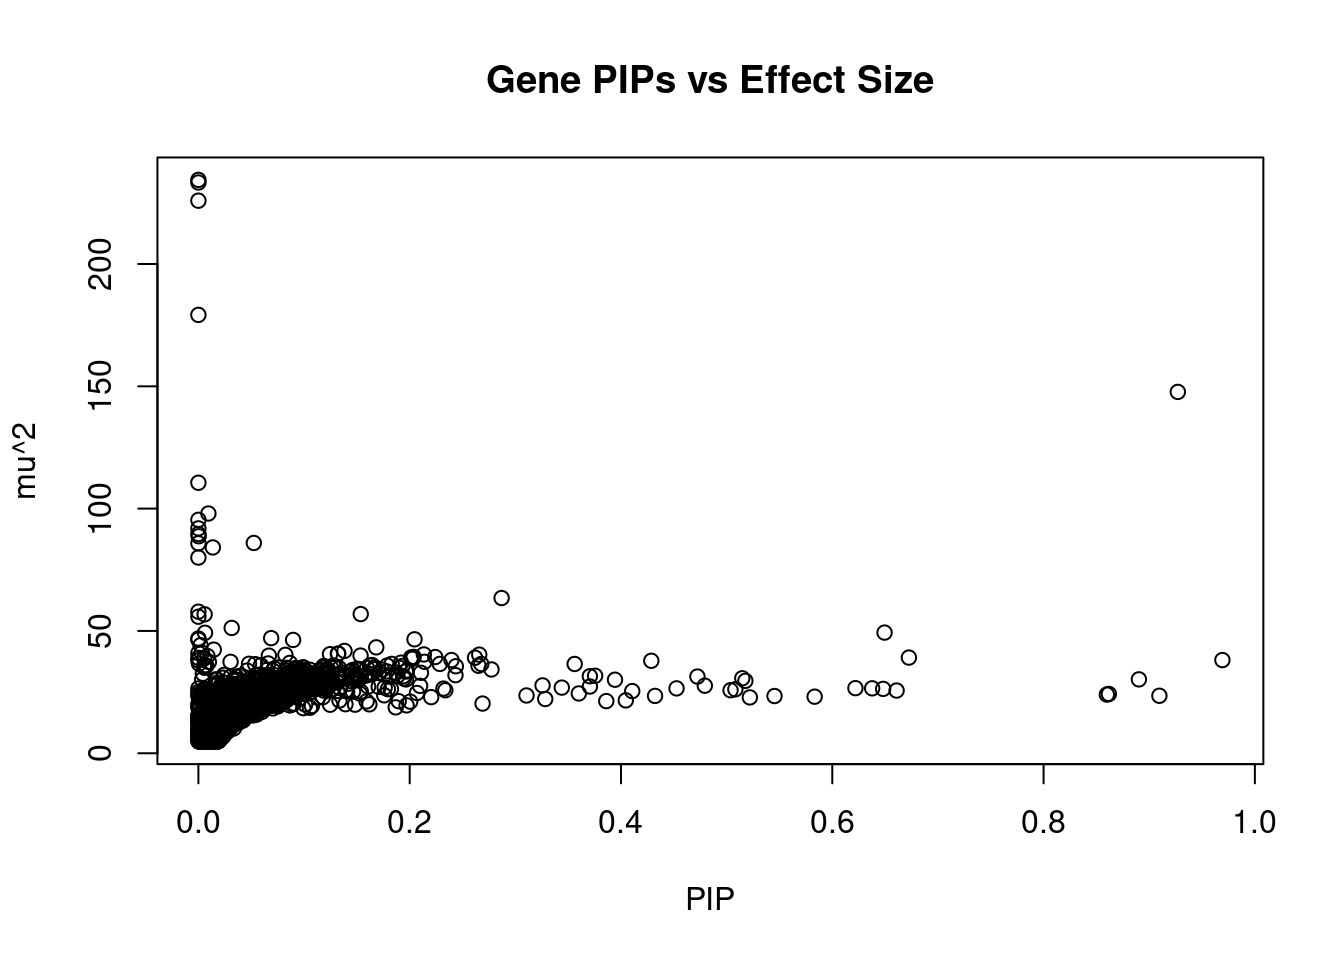
2590 TRIM38 6_20 8.548e-03 39.73 3.225e-06 6.798 2Comparing z scores and PIPs
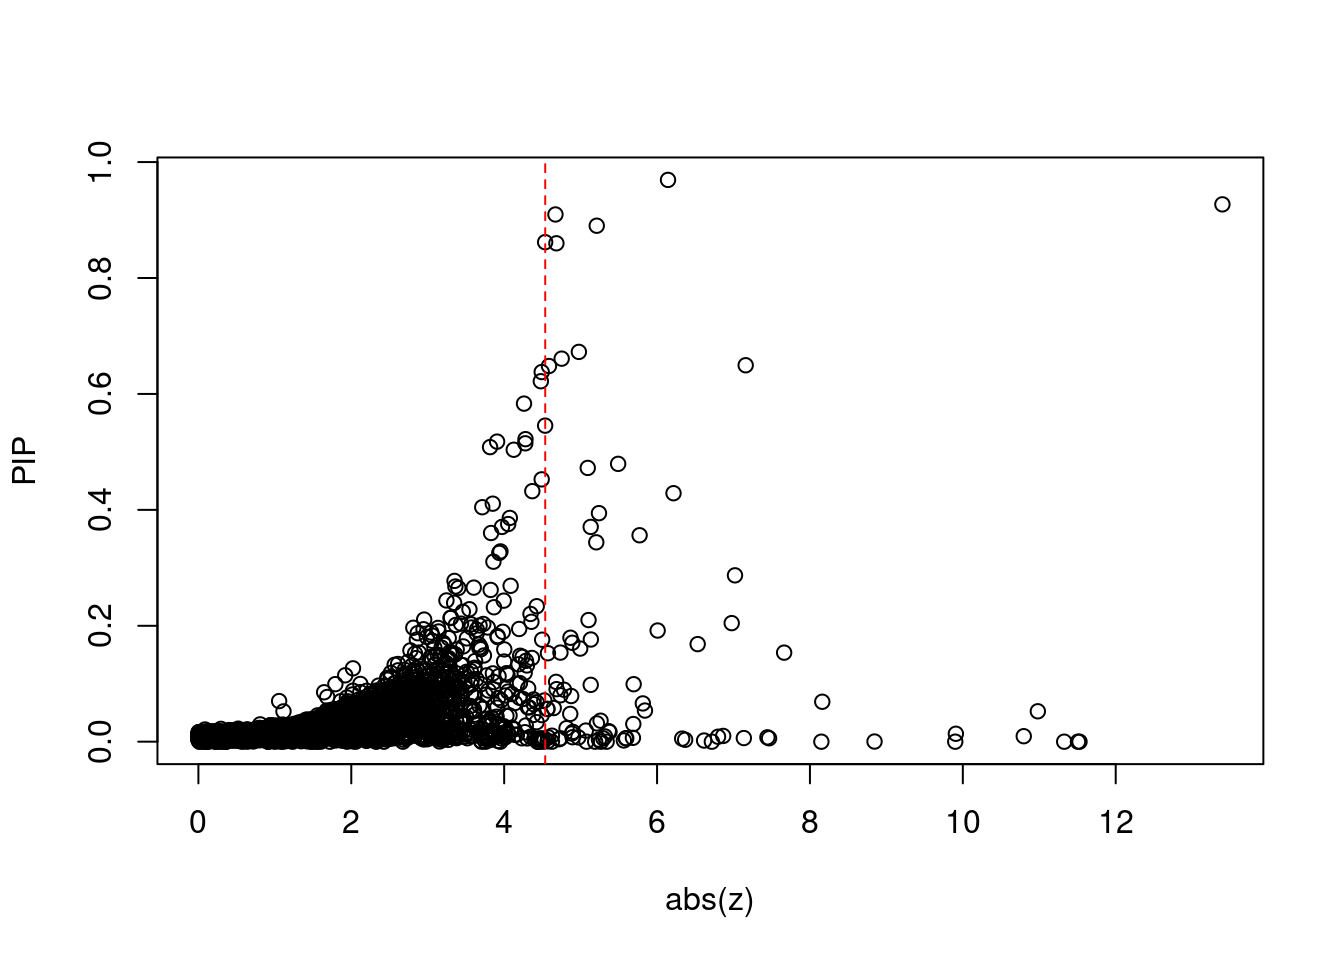
[1] 0.01004GO enrichment analysis for genes with PIP>0.5
#number of genes for gene set enrichment
length(genes)
[1] 19Uploading data to Enrichr... Done.
Querying GO_Biological_Process_2021... Done.
Querying GO_Cellular_Component_2021... Done.
Querying GO_Molecular_Function_2021... Done.
Parsing results... Done.
[1] "GO_Biological_Process_2021"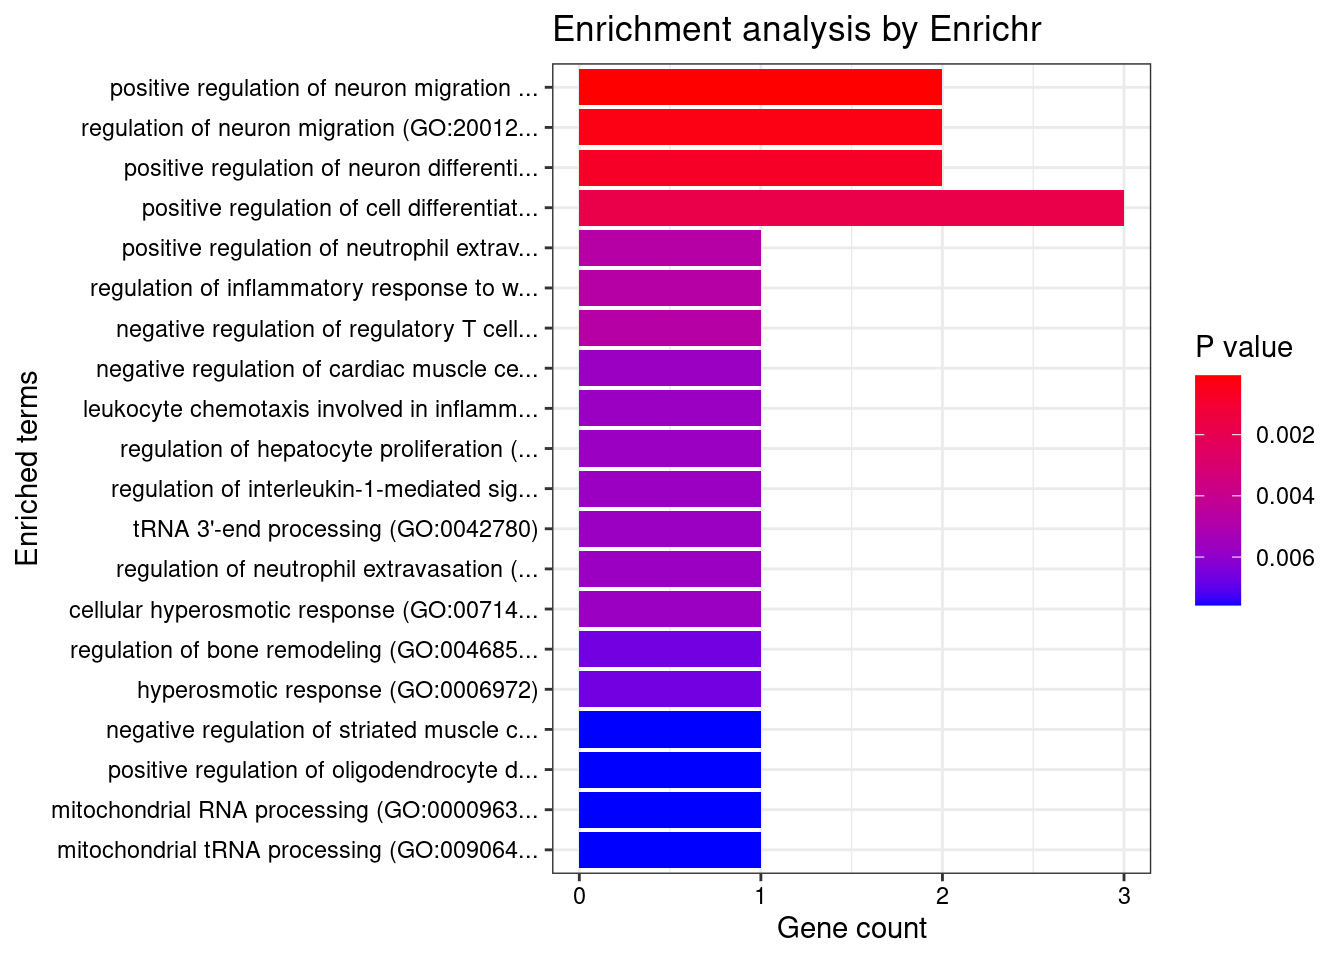
                                                  Term Overlap Adjusted.P.value
1 positive regulation of neuron migration (GO:2001224)    2/13          0.01359
2          regulation of neuron migration (GO:2001222)    2/28          0.03264
        Genes
1 MDK;ARHGEF2
2 MDK;ARHGEF2
[1] "GO_Cellular_Component_2021"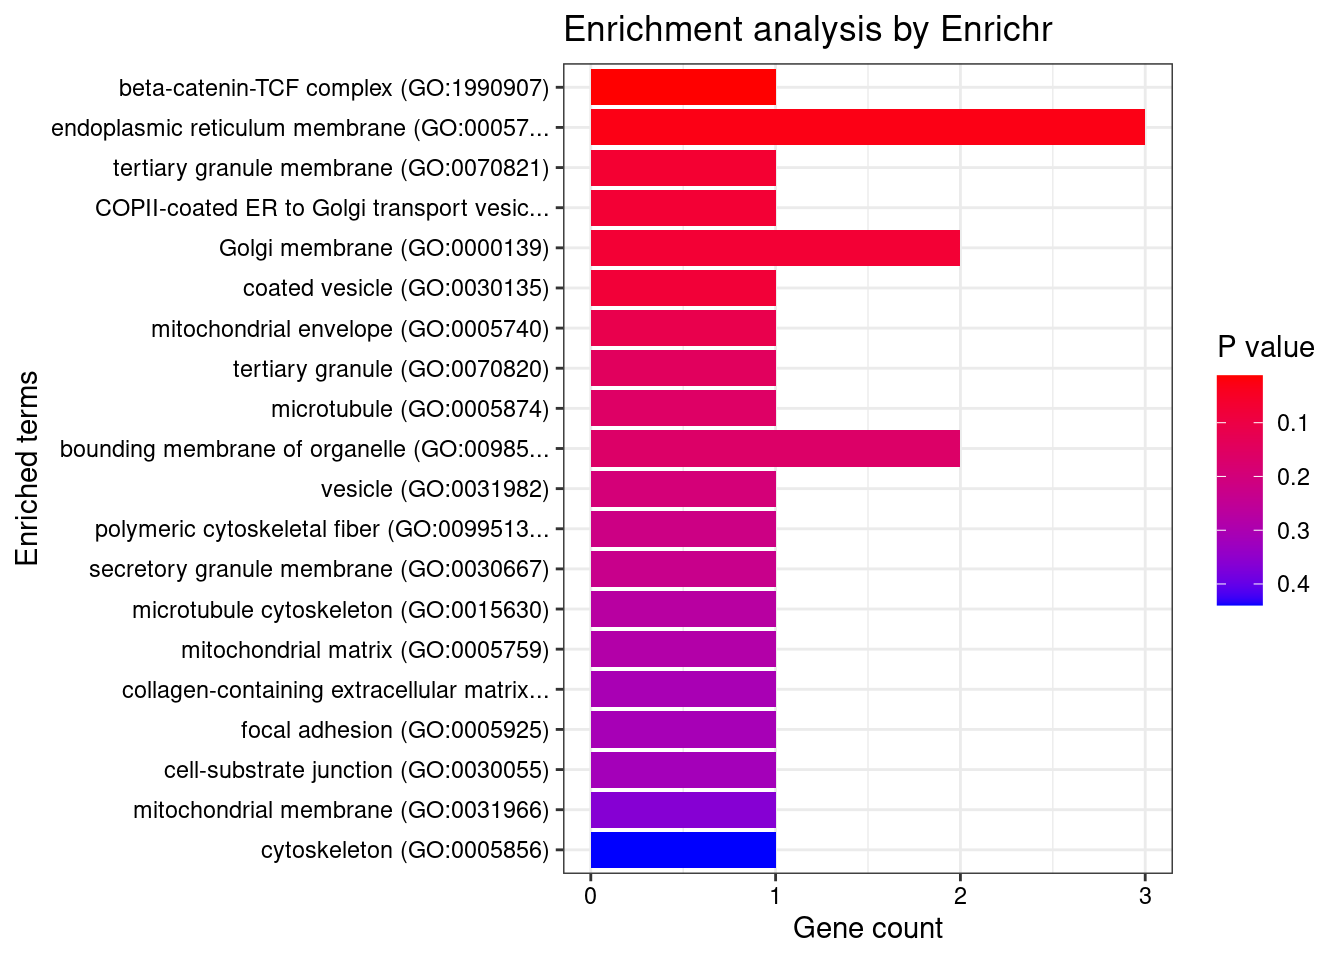
[1] Term             Overlap          Adjusted.P.value Genes
<0 rows> (or 0-length row.names)
[1] "GO_Molecular_Function_2021"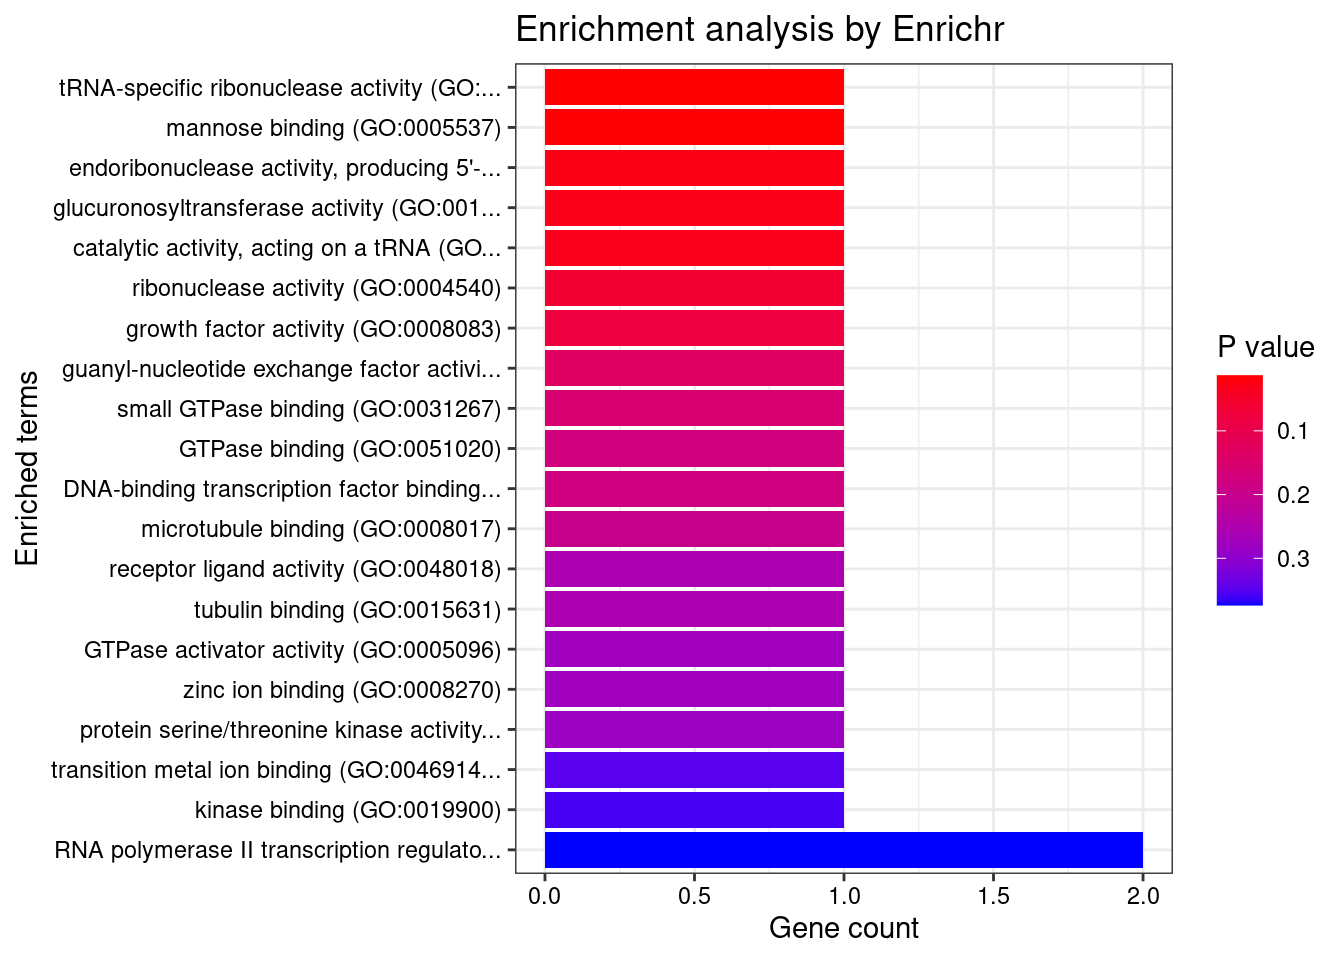
[1] Term             Overlap          Adjusted.P.value Genes
<0 rows> (or 0-length row.names)
DisGeNET enrichment analysis for genes with PIP>0.5
                                                             Description
45                                          AICARDI-GOUTIERES SYNDROME 3
49                                        PROSTATE CANCER, HEREDITARY, 2
51                      COMBINED OXIDATIVE PHOSPHORYLATION DEFICIENCY 17
53                            MENTAL RETARDATION, AUTOSOMAL RECESSIVE 52
54 NEURODEVELOPMENTAL DISORDER WITH MIDBRAIN AND HINDBRAIN MALFORMATIONS
47                                             Prostate cancer, familial
18                                                         Schizophrenia
32                                            AICARDI-GOUTIERES SYNDROME
1                                                      Anxiety Disorders
7                                                   Diabetic Nephropathy
       FDR Ratio  BgRatio
45 0.01134  1/10   1/9703
49 0.01134  1/10   1/9703
51 0.01134  1/10   1/9703
53 0.01134  1/10   1/9703
54 0.01134  1/10   1/9703
47 0.01982  2/10  69/9703
18 0.06298  4/10 883/9703
32 0.06298  1/10   8/9703
1  0.11644  1/10  44/9703
7  0.11644  1/10  44/9703
WebGestalt enrichment analysis for genes with PIP>0.5
Loading the functional categories...
Loading the ID list...
Loading the reference list...
Performing the enrichment analysis...
Warning in oraEnrichment(interestGeneList, referenceGeneList, geneSet, minNum =
minNum, : No significant gene set is identified based on FDR 0.05!NULLPIP Manhattan Plot
Sensitivity, specificity and precision for silver standard genes
#number of genes in known annotations
print(length(known_annotations))
[1] 130#number of genes in known annotations with imputed expression
print(sum(known_annotations %in% ctwas_gene_res$genename))[1] 46#significance threshold for TWAS
print(sig_thresh)[1] 4.537#number of ctwas genes
length(ctwas_genes)[1] 6#number of TWAS genes
length(twas_genes)[1] 88#show novel genes (ctwas genes with not in TWAS genes)
ctwas_gene_res[ctwas_gene_res$genename %in% novel_genes,report_cols] genename region_tag susie_pip mu2 PVE z num_eqtl
12505 RP11-408A13.3 9_12 0.8618 24.23 0.0001983 4.536 1#sensitivity / recall
print(sensitivity) ctwas TWAS
0.007692 0.061538 #specificity
print(specificity) ctwas TWAS
0.9994 0.9908 #precision / PPV
print(precision) ctwas TWAS
0.16667 0.09091 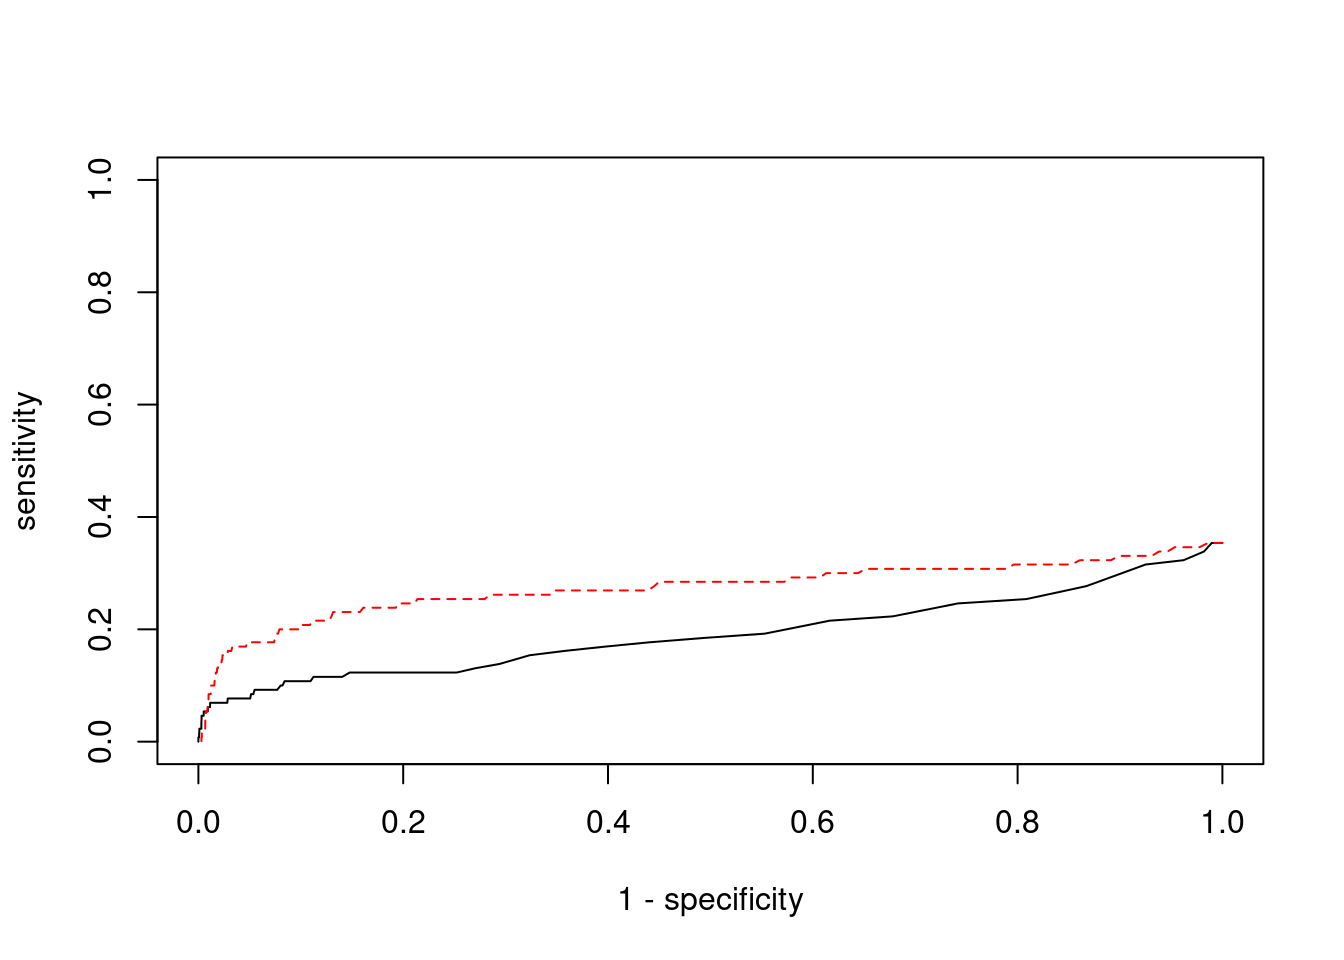
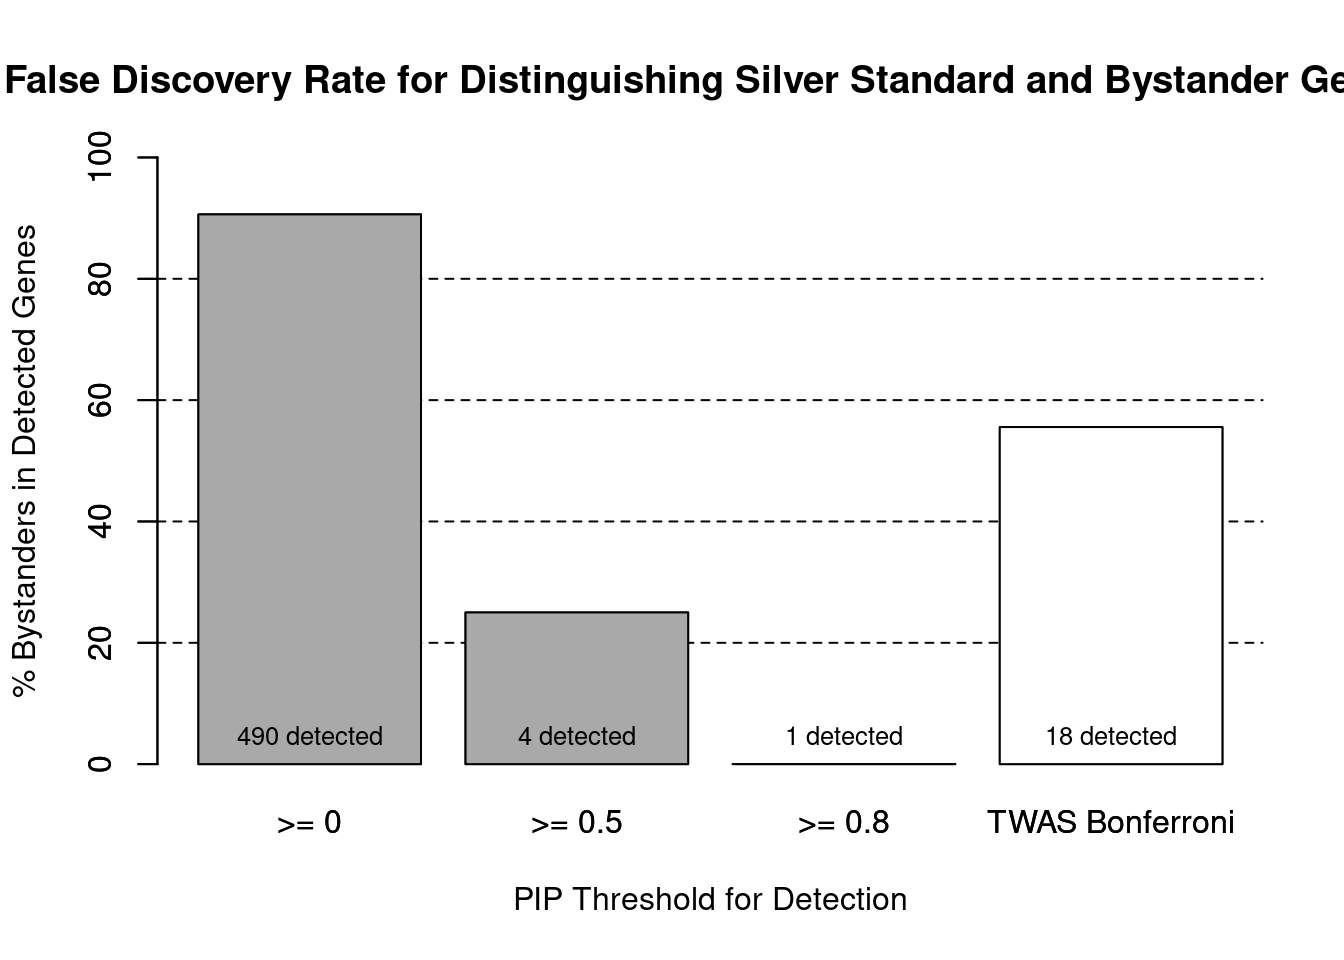
cTWAS is more precise than TWAS in distinguishing silver standard and bystander genes
#number of genes in known annotations (with imputed expression)
print(length(known_annotations))[1] 46#number of bystander genes (with imputed expression)
print(length(unrelated_genes))[1] 443#subset results to genes in known annotations or bystanders
ctwas_gene_res_subset <- ctwas_gene_res[ctwas_gene_res$genename %in% c(known_annotations, unrelated_genes),]
#assign ctwas and TWAS genes
ctwas_genes <- ctwas_gene_res_subset$genename[ctwas_gene_res_subset$susie_pip>0.8]
twas_genes <- ctwas_gene_res_subset$genename[abs(ctwas_gene_res_subset$z)>sig_thresh]
#significance threshold for TWAS
print(sig_thresh)
[1] 4.537#number of ctwas genes (in known annotations or bystanders)
length(ctwas_genes)[1] 1#number of TWAS genes (in known annotations or bystanders)
length(twas_genes)[1] 18#sensitivity / recall
sensitivity ctwas TWAS
0.02174 0.17391 #specificity / (1 - False Positive Rate)
specificity ctwas TWAS
1.0000 0.9774 #precision / PPV / (1 - False Discovery Rate)
precision ctwas TWAS
1.0000 0.4444 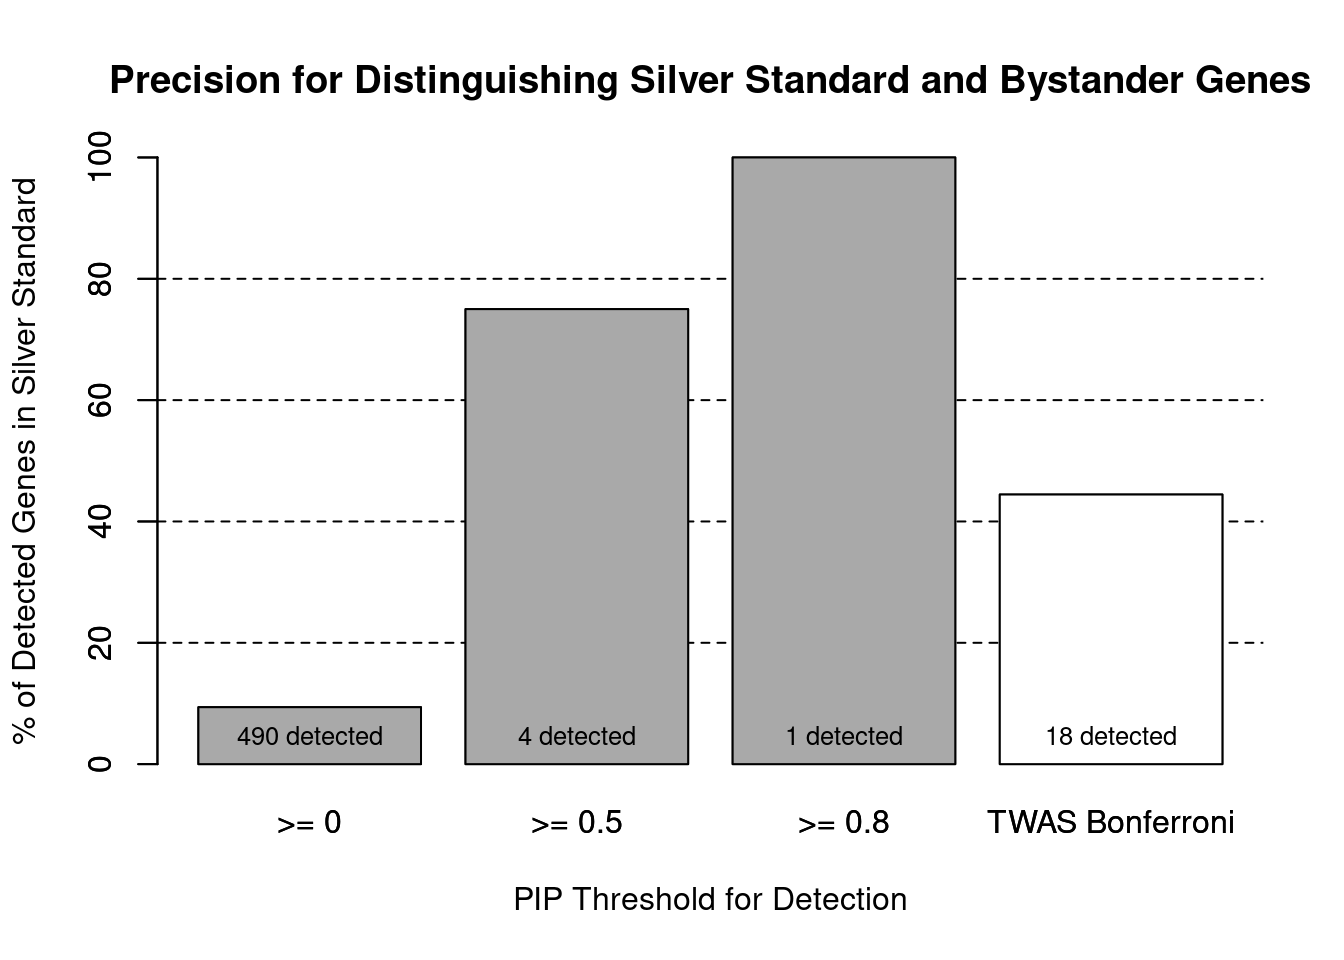
pip_range <- (0:1000)/1000
sensitivity <- rep(NA, length(pip_range))
specificity <- rep(NA, length(pip_range))

for (index in 1:length(pip_range)){
  pip <- pip_range[index]
  ctwas_genes <- ctwas_gene_res_subset$genename[ctwas_gene_res_subset$susie_pip>=pip]
  sensitivity[index] <- sum(ctwas_genes %in% known_annotations)/length(known_annotations)
  specificity[index] <- sum(!(unrelated_genes %in% ctwas_genes))/length(unrelated_genes)
}

plot(1-specificity, sensitivity, type="l", xlim=c(0,1), ylim=c(0,1), main="", xlab="1 - Specificity", ylab="Sensitivity")
title(expression("ROC Curve for cTWAS (black) and TWAS (" * phantom("red") * ")"))
title(expression(phantom("ROC Curve for cTWAS (black) and TWAS (") * "red" * phantom(")")), col.main="red")

sig_thresh_range <- seq(from=0, to=max(abs(ctwas_gene_res_subset$z)), length.out=length(pip_range))

for (index in 1:length(sig_thresh_range)){
  sig_thresh_plot <- sig_thresh_range[index]
  twas_genes <- ctwas_gene_res_subset$genename[abs(ctwas_gene_res_subset$z)>=sig_thresh_plot]
  sensitivity[index] <- sum(twas_genes %in% known_annotations)/length(known_annotations)
  specificity[index] <- sum(!(unrelated_genes %in% twas_genes))/length(unrelated_genes)
}

lines(1-specificity, sensitivity, xlim=c(0,1), ylim=c(0,1), col="red", lty=1)

abline(a=0,b=1,lty=3)

#add previously computed points from the analysis
ctwas_genes <- ctwas_gene_res_subset$genename[ctwas_gene_res_subset$susie_pip>0.8]
twas_genes <- ctwas_gene_res_subset$genename[abs(ctwas_gene_res_subset$z)>sig_thresh]

points(1-specificity_plot["ctwas"], sensitivity_plot["ctwas"], pch=21, bg="black")
points(1-specificity_plot["TWAS"], sensitivity_plot["TWAS"], pch=21, bg="red")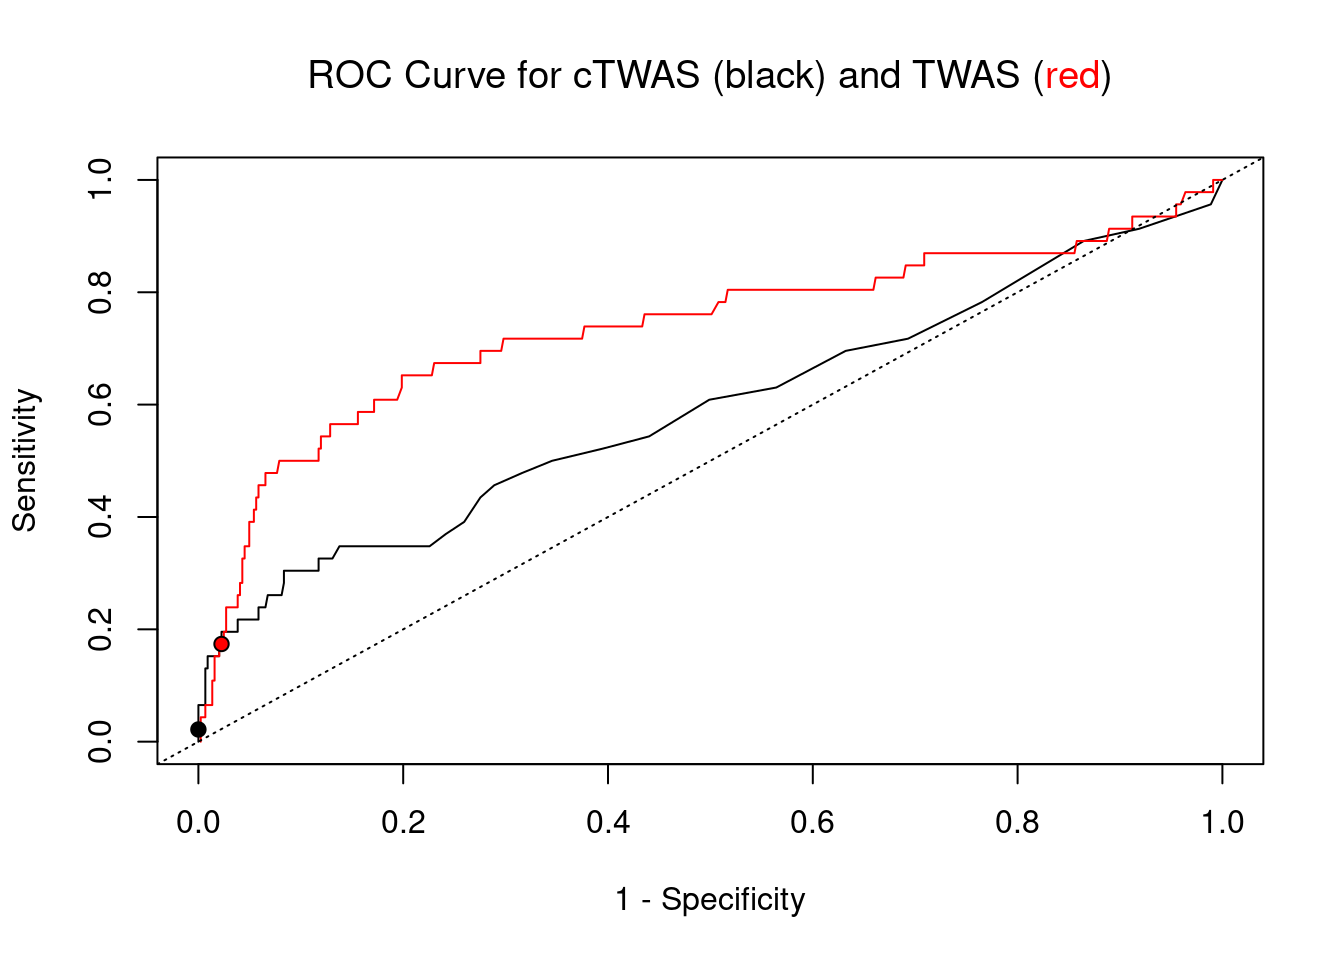
Undetected silver standard genes have low TWAS z-scores or stronger signal from nearby variants
#table of outcomes for silver standard genes
-sort(-table(silver_standard_case))
silver_standard_case
Not Imputed Insignificant z-score Nearby SNP(s)
84 38 7
Detected (PIP > 0.8)
1 #show inconclusive genes
silver_standard_case[silver_standard_case=="Inconclusive"]named character(0)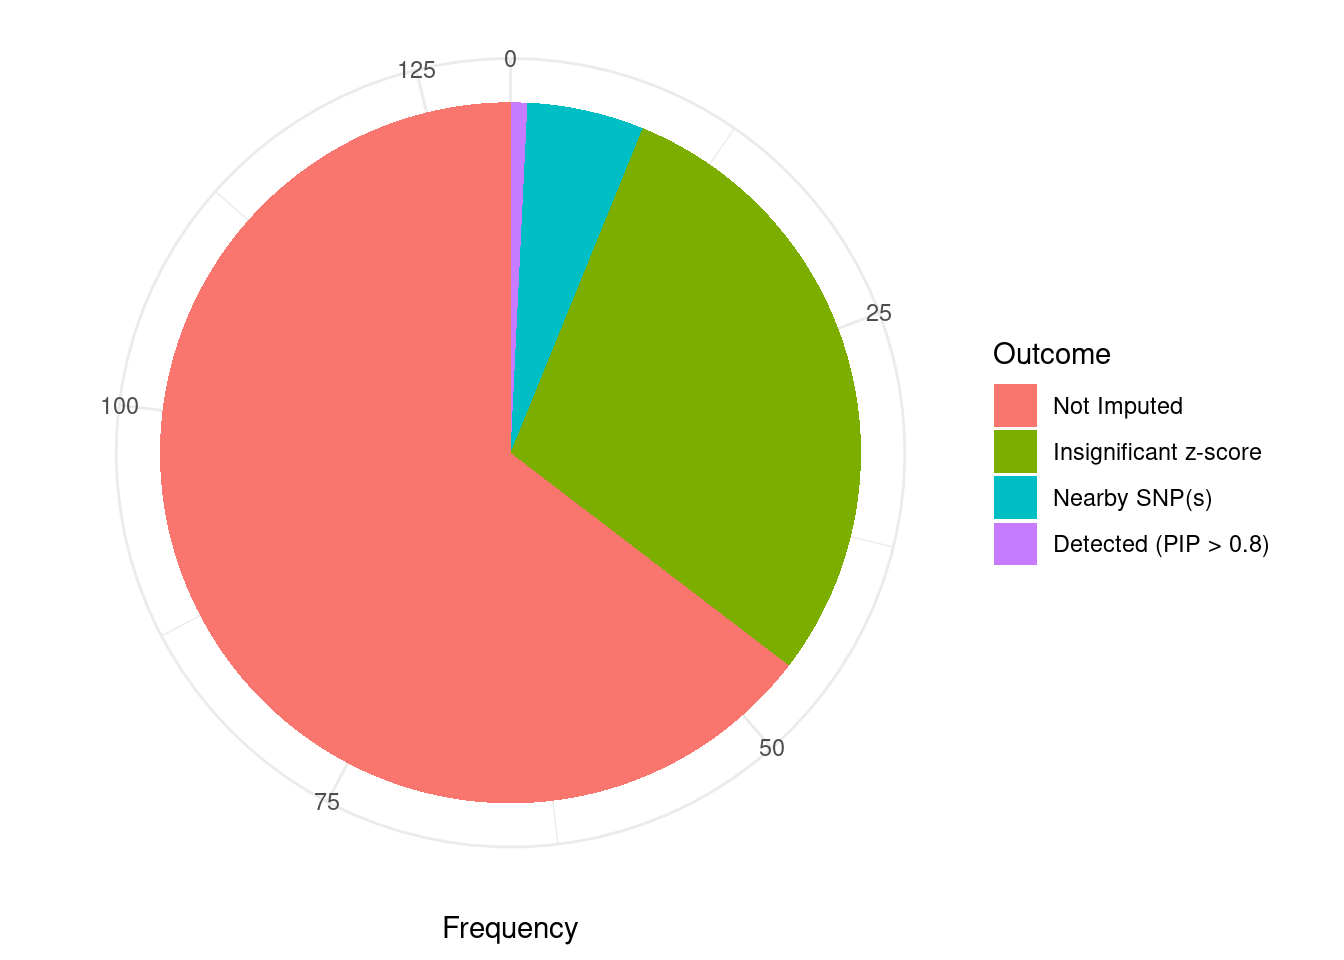
sessionInfo()R version 3.6.1 (2019-07-05)
Platform: x86_64-pc-linux-gnu (64-bit)
Running under: Scientific Linux 7.4 (Nitrogen)
Matrix products: default
BLAS/LAPACK: /software/openblas-0.2.19-el7-x86_64/lib/libopenblas_haswellp-r0.2.19.so
locale:
[1] LC_CTYPE=en_US.UTF-8 LC_NUMERIC=C
[3] LC_TIME=en_US.UTF-8 LC_COLLATE=en_US.UTF-8
[5] LC_MONETARY=en_US.UTF-8 LC_MESSAGES=en_US.UTF-8
[7] LC_PAPER=en_US.UTF-8 LC_NAME=C
[9] LC_ADDRESS=C LC_TELEPHONE=C
[11] LC_MEASUREMENT=en_US.UTF-8 LC_IDENTIFICATION=C
attached base packages:
[1] parallel stats4 stats graphics grDevices utils datasets
[8] methods base
other attached packages:
[1] GenomicRanges_1.36.1 GenomeInfoDb_1.20.0 IRanges_2.18.1
[4] S4Vectors_0.22.1 BiocGenerics_0.30.0 biomaRt_2.40.1
[7] readxl_1.3.1 forcats_0.5.1 stringr_1.4.0
[10] dplyr_1.0.7 purrr_0.3.4 readr_2.1.1
[13] tidyr_1.1.4 tidyverse_1.3.1 tibble_3.1.6
[16] WebGestaltR_0.4.4 disgenet2r_0.99.2 enrichR_3.0
[19] cowplot_1.1.1 ggplot2_3.3.5 workflowr_1.7.0
loaded via a namespace (and not attached):
[1] ggbeeswarm_0.6.0 colorspace_2.0-2 rjson_0.2.20
[4] ellipsis_0.3.2 rprojroot_2.0.2 XVector_0.24.0
[7] fs_1.5.2 rstudioapi_0.13 farver_2.1.0
[10] ggrepel_0.9.1 bit64_4.0.5 AnnotationDbi_1.46.0
[13] fansi_1.0.2 lubridate_1.8.0 xml2_1.3.3
[16] codetools_0.2-16 doParallel_1.0.17 cachem_1.0.6
[19] knitr_1.36 jsonlite_1.7.2 apcluster_1.4.8
[22] Cairo_1.5-12.2 broom_0.7.10 dbplyr_2.1.1
[25] compiler_3.6.1 httr_1.4.2 backports_1.4.1
[28] assertthat_0.2.1 Matrix_1.2-18 fastmap_1.1.0
[31] cli_3.1.0 later_0.8.0 prettyunits_1.1.1
[34] htmltools_0.5.2 tools_3.6.1 igraph_1.2.10
[37] GenomeInfoDbData_1.2.1 gtable_0.3.0 glue_1.6.2
[40] reshape2_1.4.4 doRNG_1.8.2 Rcpp_1.0.8
[43] Biobase_2.44.0 cellranger_1.1.0 jquerylib_0.1.4
[46] vctrs_0.3.8 svglite_1.2.2 iterators_1.0.14
[49] xfun_0.29 ps_1.6.0 rvest_1.0.2
[52] lifecycle_1.0.1 rngtools_1.5.2 XML_3.99-0.3
[55] zlibbioc_1.30.0 getPass_0.2-2 scales_1.1.1
[58] vroom_1.5.7 hms_1.1.1 promises_1.0.1
[61] yaml_2.2.1 curl_4.3.2 memoise_2.0.1
[64] ggrastr_1.0.1 gdtools_0.1.9 stringi_1.7.6
[67] RSQLite_2.2.8 highr_0.9 foreach_1.5.2
[70] rlang_1.0.1 pkgconfig_2.0.3 bitops_1.0-7
[73] evaluate_0.14 lattice_0.20-38 labeling_0.4.2
[76] bit_4.0.4 processx_3.5.2 tidyselect_1.1.1
[79] plyr_1.8.6 magrittr_2.0.2 R6_2.5.1
[82] generics_0.1.1 DBI_1.1.2 pillar_1.6.4
[85] haven_2.4.3 whisker_0.3-2 withr_2.4.3
[88] RCurl_1.98-1.5 modelr_0.1.8 crayon_1.5.0
[91] utf8_1.2.2 tzdb_0.2.0 rmarkdown_2.11
[94] progress_1.2.2 grid_3.6.1 data.table_1.14.2
[97] blob_1.2.2 callr_3.7.0 git2r_0.26.1
[100] reprex_2.0.1 digest_0.6.29 httpuv_1.5.1
[103] munsell_0.5.0 beeswarm_0.2.3 vipor_0.4.5