SCZ - Brain Nucleus accumbens basal ganglia
sheng Qian
2021-2-6
Last updated: 2022-04-19
Checks: 5 2
Knit directory: cTWAS_analysis/
This reproducible R Markdown analysis was created with workflowr (version 1.7.0). The Checks tab describes the reproducibility checks that were applied when the results were created. The Past versions tab lists the development history.
The R Markdown file has unstaged changes. To know which version of the R Markdown file created these results, you’ll want to first commit it to the Git repo. If you’re still working on the analysis, you can ignore this warning. When you’re finished, you can run wflow_publish to commit the R Markdown file and build the HTML.
Great job! The global environment was empty. Objects defined in the global environment can affect the analysis in your R Markdown file in unknown ways. For reproduciblity it’s best to always run the code in an empty environment.
The command set.seed(20211220) was run prior to running the code in the R Markdown file. Setting a seed ensures that any results that rely on randomness, e.g. subsampling or permutations, are reproducible.
Great job! Recording the operating system, R version, and package versions is critical for reproducibility.
Nice! There were no cached chunks for this analysis, so you can be confident that you successfully produced the results during this run.
Using absolute paths to the files within your workflowr project makes it difficult for you and others to run your code on a different machine. Change the absolute path(s) below to the suggested relative path(s) to make your code more reproducible.
| absolute | relative |
|---|---|
| /project2/xinhe/shengqian/cTWAS/cTWAS_analysis/data/ | data |
| /project2/xinhe/shengqian/cTWAS/cTWAS_analysis/code/ctwas_config.R | code/ctwas_config.R |
Great! You are using Git for version control. Tracking code development and connecting the code version to the results is critical for reproducibility.
The results in this page were generated with repository version ba919ab. See the Past versions tab to see a history of the changes made to the R Markdown and HTML files.
Note that you need to be careful to ensure that all relevant files for the analysis have been committed to Git prior to generating the results (you can use wflow_publish or wflow_git_commit). workflowr only checks the R Markdown file, but you know if there are other scripts or data files that it depends on. Below is the status of the Git repository when the results were generated:
Ignored files:
    Ignored:    .ipynb_checkpoints/
    Ignored:    data/AF/

Untracked files:
    Untracked:  Rplot.png
    Untracked:  analysis/.ipynb_checkpoints/
    Untracked:  code/.ipynb_checkpoints/
    Untracked:  code/AF_out/
    Untracked:  code/Autism_out/
    Untracked:  code/BMI_S_out/
    Untracked:  code/BMI_out/
    Untracked:  code/Glucose_out/
    Untracked:  code/LDL_S_out/
    Untracked:  code/SCZ_2014_EUR_out/
    Untracked:  code/SCZ_2018_out/
    Untracked:  code/SCZ_2020_Single_out/
    Untracked:  code/SCZ_2020_out/
    Untracked:  code/SCZ_S_out/
    Untracked:  code/SCZ_out/
    Untracked:  code/T2D_out/
    Untracked:  code/ctwas_config.R
    Untracked:  code/mapping.R
    Untracked:  code/out/
    Untracked:  code/process_scz_2018_snps.R
    Untracked:  code/run_AF_analysis.sbatch
    Untracked:  code/run_AF_analysis.sh
    Untracked:  code/run_AF_ctwas_rss_LDR.R
    Untracked:  code/run_Autism_analysis.sbatch
    Untracked:  code/run_Autism_analysis.sh
    Untracked:  code/run_Autism_ctwas_rss_LDR.R
    Untracked:  code/run_BMI_analysis.sbatch
    Untracked:  code/run_BMI_analysis.sh
    Untracked:  code/run_BMI_analysis_S.sbatch
    Untracked:  code/run_BMI_analysis_S.sh
    Untracked:  code/run_BMI_ctwas_rss_LDR.R
    Untracked:  code/run_BMI_ctwas_rss_LDR_S.R
    Untracked:  code/run_Glucose_analysis.sbatch
    Untracked:  code/run_Glucose_analysis.sh
    Untracked:  code/run_Glucose_ctwas_rss_LDR.R
    Untracked:  code/run_LDL_analysis_S.sbatch
    Untracked:  code/run_LDL_analysis_S.sh
    Untracked:  code/run_LDL_ctwas_rss_LDR_S.R
    Untracked:  code/run_SCZ_2014_EUR_analysis.sbatch
    Untracked:  code/run_SCZ_2014_EUR_analysis.sh
    Untracked:  code/run_SCZ_2014_EUR_ctwas_rss_LDR.R
    Untracked:  code/run_SCZ_2018_analysis.sbatch
    Untracked:  code/run_SCZ_2018_analysis.sh
    Untracked:  code/run_SCZ_2018_ctwas_rss_LDR.R
    Untracked:  code/run_SCZ_2020_Single_analysis.sbatch
    Untracked:  code/run_SCZ_2020_Single_analysis.sh
    Untracked:  code/run_SCZ_2020_Single_ctwas_rss_LDR.R
    Untracked:  code/run_SCZ_2020_analysis.sbatch
    Untracked:  code/run_SCZ_2020_analysis.sh
    Untracked:  code/run_SCZ_2020_ctwas_rss_LDR.R
    Untracked:  code/run_SCZ_analysis.sbatch
    Untracked:  code/run_SCZ_analysis.sh
    Untracked:  code/run_SCZ_analysis_S.sbatch
    Untracked:  code/run_SCZ_analysis_S.sh
    Untracked:  code/run_SCZ_ctwas_rss_LDR.R
    Untracked:  code/run_SCZ_ctwas_rss_LDR_S.R
    Untracked:  code/run_T2D_analysis.sbatch
    Untracked:  code/run_T2D_analysis.sh
    Untracked:  code/run_T2D_ctwas_rss_LDR.R
    Untracked:  code/wflow_build.R
    Untracked:  code/wflow_build.sbatch
    Untracked:  data/.ipynb_checkpoints/
    Untracked:  data/BMI/
    Untracked:  data/GO_Terms/
    Untracked:  data/PGC3_SCZ_wave3_public.v2.tsv
    Untracked:  data/SCZ/
    Untracked:  data/SCZ_2014_EUR/
    Untracked:  data/SCZ_2018/
    Untracked:  data/SCZ_2020/
    Untracked:  data/SCZ_2020_Single/
    Untracked:  data/SCZ_S/
    Untracked:  data/Supplementary Table 15 - MAGMA.xlsx
    Untracked:  data/Supplementary Table 20 - Prioritised Genes.xlsx
    Untracked:  data/T2D/
    Untracked:  data/UKBB/
    Untracked:  data/UKBB_SNPs_Info.text
    Untracked:  data/gene_OMIM.txt
    Untracked:  data/gene_pip_0.8.txt
    Untracked:  data/mashr_Heart_Atrial_Appendage.db
    Untracked:  data/mashr_sqtl/
    Untracked:  data/scz_2018.RDS
    Untracked:  data/summary_known_genes_annotations.xlsx
    Untracked:  data/untitled.txt
    Untracked:  top_genes_32.txt
    Untracked:  top_genes_37.txt
    Untracked:  top_genes_43.txt
    Untracked:  top_genes_81.txt

Unstaged changes:
    Modified:   analysis/SCZ_2018_Brain_Amygdala.Rmd
    Modified:   analysis/SCZ_2018_Brain_Anterior_cingulate_cortex_BA24.Rmd
    Modified:   analysis/SCZ_2018_Brain_Caudate_basal_ganglia.Rmd
    Modified:   analysis/SCZ_2018_Brain_Cerebellar_Hemisphere.Rmd
    Modified:   analysis/SCZ_2018_Brain_Cerebellum.Rmd
    Modified:   analysis/SCZ_2018_Brain_Cortex.Rmd
    Modified:   analysis/SCZ_2018_Brain_Frontal_Cortex_BA9.Rmd
    Modified:   analysis/SCZ_2018_Brain_Hippocampus.Rmd
    Modified:   analysis/SCZ_2018_Brain_Hypothalamus.Rmd
    Modified:   analysis/SCZ_2018_Brain_Nucleus_accumbens_basal_ganglia.Rmd
    Modified:   analysis/SCZ_2018_Brain_Putamen_basal_ganglia.Rmd
    Modified:   analysis/SCZ_2018_Brain_Spinal_cord_cervical_c-1.Rmd
    Modified:   analysis/SCZ_2018_Brain_Substantia_nigra.Rmd
    Modified:   analysis/SCZ_Annotation_Analysis.Rmd
Note that any generated files, e.g. HTML, png, CSS, etc., are not included in this status report because it is ok for generated content to have uncommitted changes.
These are the previous versions of the repository in which changes were made to the R Markdown (analysis/SCZ_2018_Brain_Nucleus_accumbens_basal_ganglia.Rmd) and HTML (docs/SCZ_2018_Brain_Nucleus_accumbens_basal_ganglia.html) files. If you’ve configured a remote Git repository (see ?wflow_git_remote), click on the hyperlinks in the table below to view the files as they were in that past version.
| File | Version | Author | Date | Message |
|---|---|---|---|---|
| Rmd | 9ddc9c4 | sq-96 | 2022-04-18 | update |
| Rmd | f6e7062 | sq-96 | 2022-04-17 | update |
| html | f6e7062 | sq-96 | 2022-04-17 | update |
Weight QC
#number of imputed weights
nrow(qclist_all)
[1] 10019#number of imputed weights by chromosome
table(qclist_all$chr)
  1   2   3   4   5   6   7   8   9  10  11  12  13  14  15  16  17  18  19  20
984 716 600 396 489 570 494 366 377 401 621 577 200 337 331 411 611 164 776 316
 21  22
 32 250
#number of imputed weights without missing variants
sum(qclist_all$nmiss==0)[1] 6976#proportion of imputed weights without missing variants
mean(qclist_all$nmiss==0)[1] 0.6963Check convergence of parameters
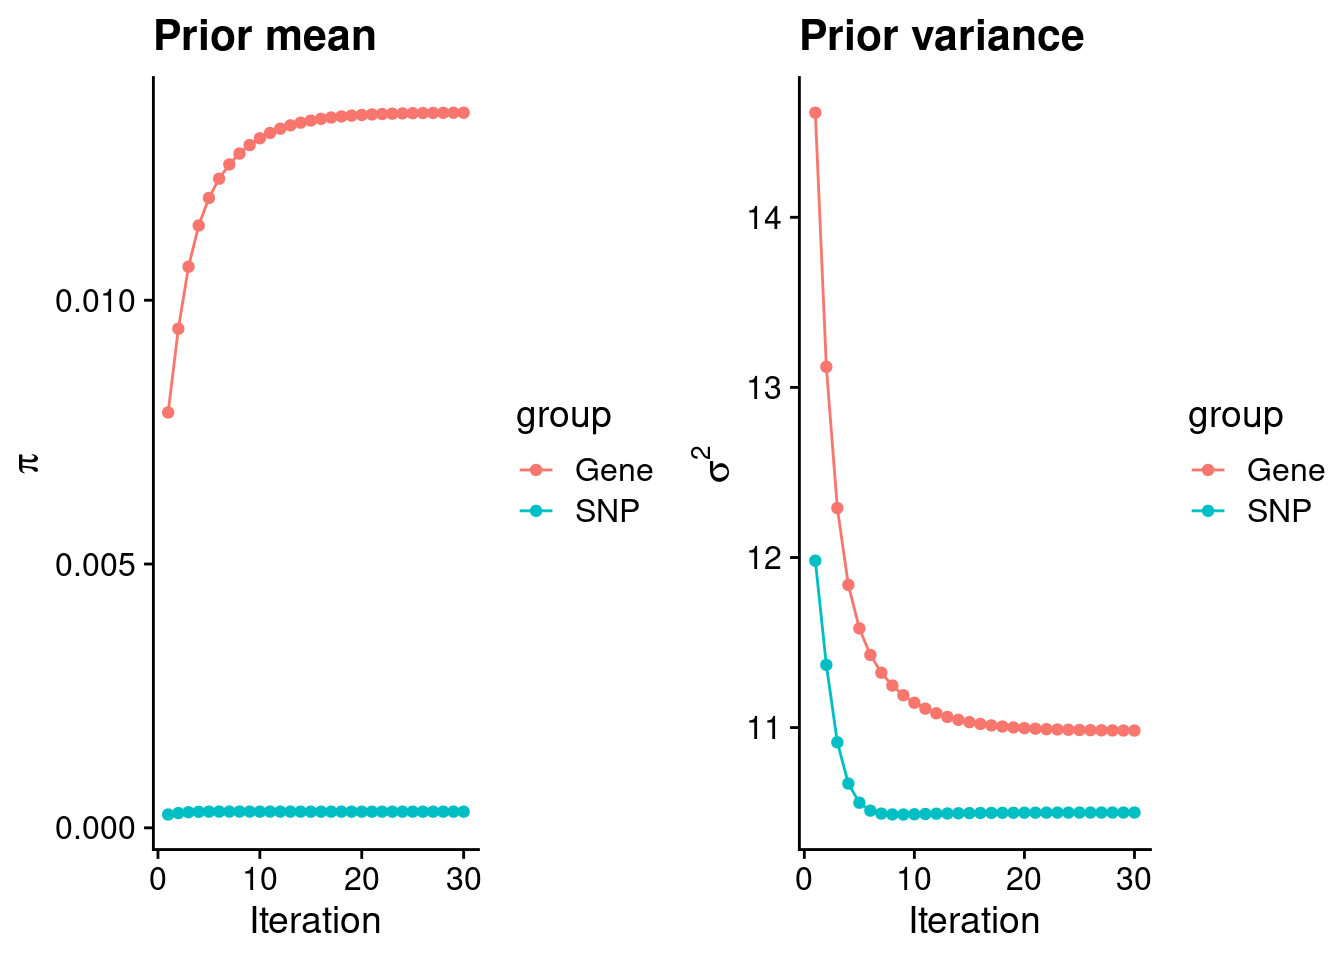
#estimated group prior
estimated_group_prior <- group_prior_rec[,ncol(group_prior_rec)]
names(estimated_group_prior) <- c("gene", "snp")
estimated_group_prior["snp"] <- estimated_group_prior["snp"]*thin #adjust parameter to account for thin argument
print(estimated_group_prior)
gene snp
0.0135548 0.0003062 #estimated group prior variance
estimated_group_prior_var <- group_prior_var_rec[,ncol(group_prior_var_rec)]
names(estimated_group_prior_var) <- c("gene", "snp")
print(estimated_group_prior_var) gene snp
10.98 10.50 #report sample size
print(sample_size)[1] 105318#report group size
group_size <- c(nrow(ctwas_gene_res), n_snps)
print(group_size)[1] 10019 6309950#estimated group PVE
estimated_group_pve <- estimated_group_prior_var*estimated_group_prior*group_size/sample_size #check PVE calculation
names(estimated_group_pve) <- c("gene", "snp")
print(estimated_group_pve) gene snp
0.01416 0.19266 #compare sum(PIP*mu2/sample_size) with above PVE calculation
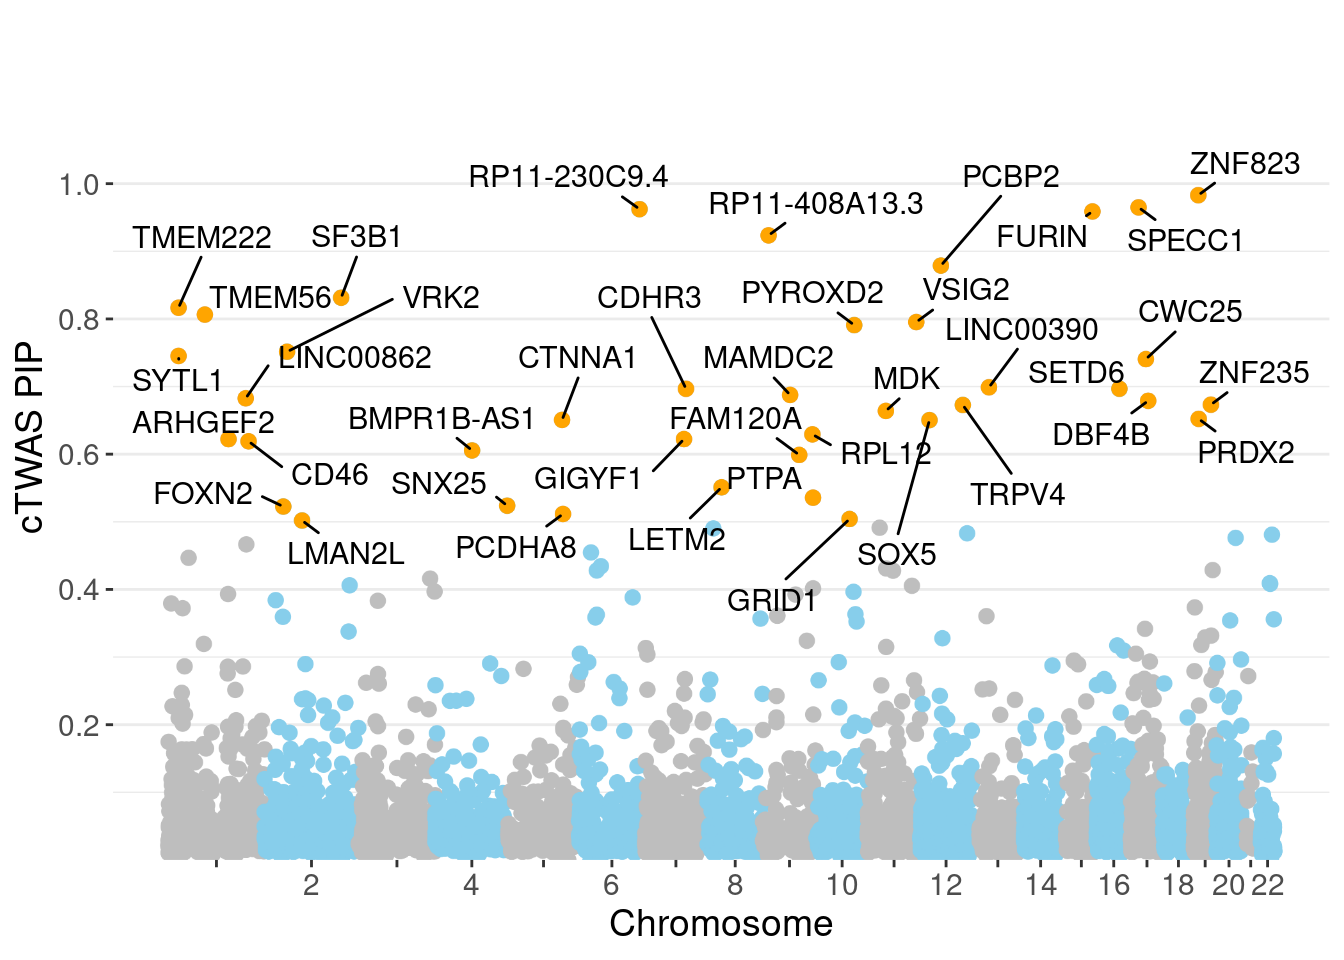
c(sum(ctwas_gene_res$PVE),sum(ctwas_snp_res$PVE))[1] 0.06609 1.10055Genes with highest PIPs
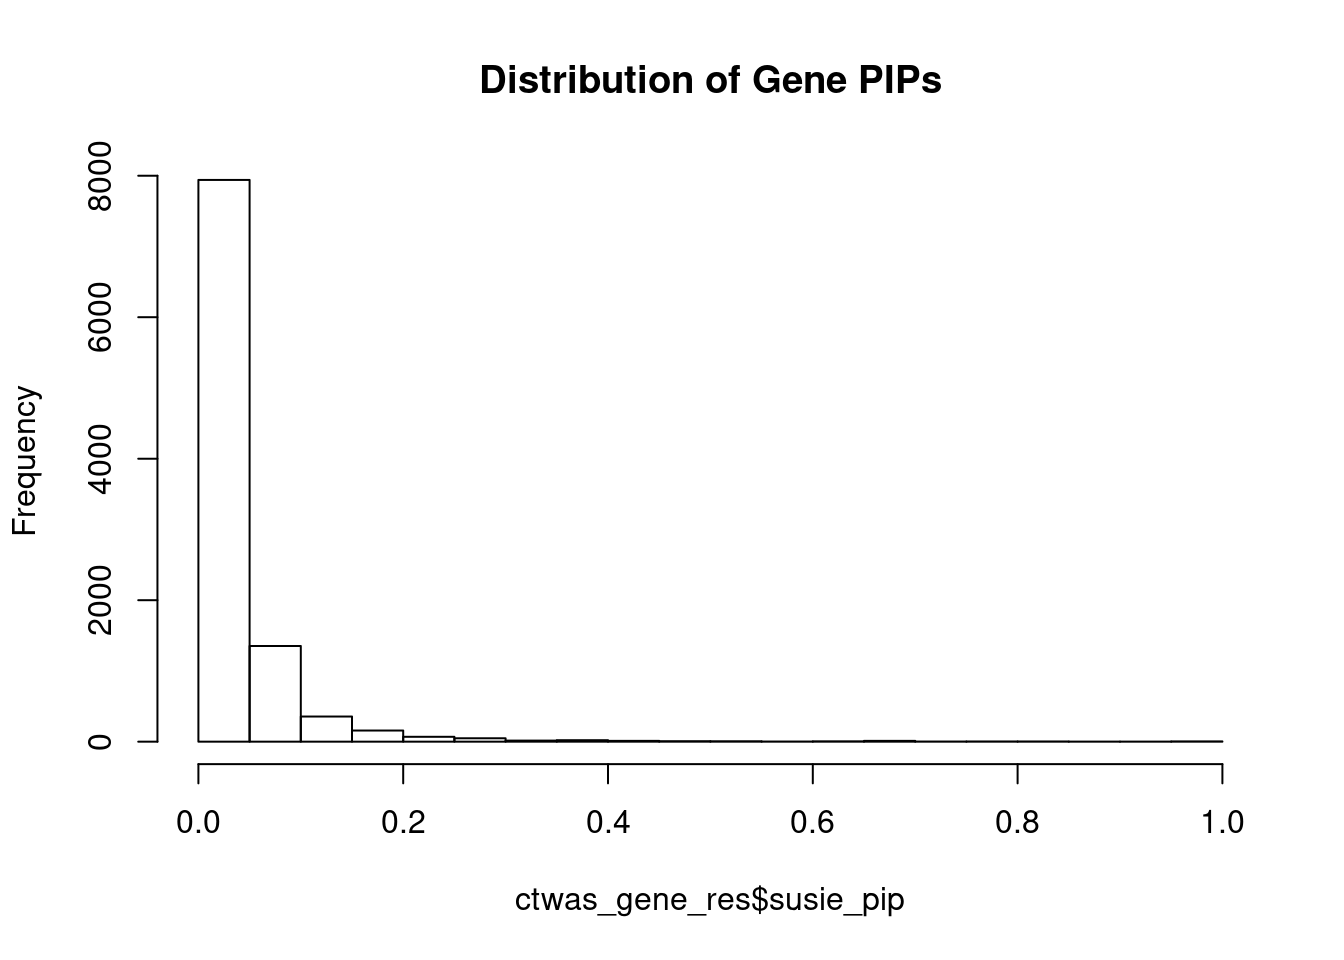
           genename region_tag susie_pip   mu2       PVE      z num_eqtl
11067        ZNF823      19_10    0.9830 36.50 0.0003406  6.184        2
4131         SPECC1      17_16    0.9649 28.01 0.0002566  5.295        2
13453  RP11-230C9.4      6_102    0.9623 23.13 0.0002113 -4.738        2
5491          FURIN      15_42    0.9589 46.05 0.0004193 -6.990        1
13724 RP11-408A13.3       9_12    0.9236 22.78 0.0001998  4.536        1
10921         PCBP2      12_33    0.8789 26.37 0.0002201  5.065        1
3067          SF3B1      2_117    0.8314 48.79 0.0003852  7.265        1
10418       TMEM222       1_19    0.8165 22.08 0.0001712  4.303        1
6509         TMEM56       1_58    0.8064 20.82 0.0001594 -3.907        1
268           VSIG2      11_77    0.7953 30.05 0.0002269 -4.616        2
3468        PYROXD2      10_62    0.7908 20.64 0.0001550  3.952        1
320            VRK2       2_38    0.7514 36.84 0.0002628  4.977        1
5689          SYTL1       1_19    0.7452 24.35 0.0001723  4.306        2
13743         CWC25      17_23    0.7406 21.86 0.0001537 -4.095        3
11955     LINC00390      13_17    0.6989 22.10 0.0001467 -4.536        1
1843          SETD6      16_31    0.6968 37.01 0.0002448 -6.343        1
4135          CDHR3       7_65    0.6967 22.67 0.0001499  4.315        1
7855         MAMDC2       9_31    0.6876 21.71 0.0001418  4.125        1
11298     LINC00862      1_101    0.6826 22.93 0.0001486  4.339        2
7266          DBF4B      17_26    0.6789 19.28 0.0001243  3.890        1
Genes with largest effect sizes
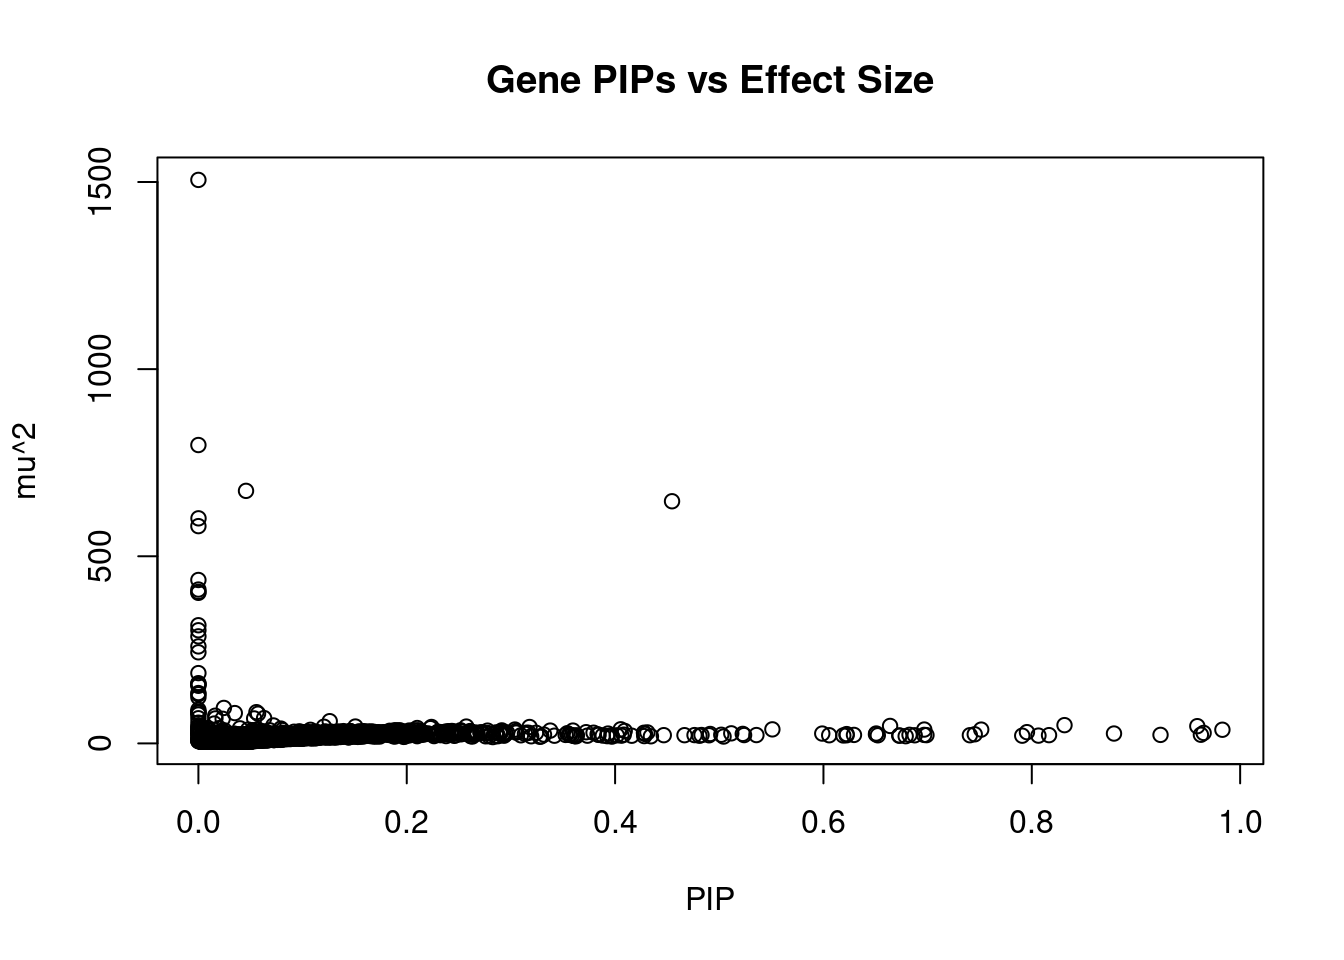
      genename region_tag susie_pip    mu2       PVE       z num_eqtl
12325 HLA-DQA2       6_26 0.000e+00 1505.7 0.000e+00 -0.6489        2
12152 HLA-DQB2       6_26 0.000e+00  797.3 0.000e+00 -3.4195        1
12513      C4A       6_26 4.570e-02  674.8 2.928e-04 11.3259        1
11404     APOM       6_26 4.547e-01  647.0 2.793e-03 11.5895        1
11389  C6orf48       6_26 9.823e-05  601.4 5.609e-07 10.9169        2
11395     MSH5       6_26 2.863e-06  580.6 1.578e-08 10.5589        2
11386    EHMT2       6_26 0.000e+00  436.6 0.000e+00  7.5336        1
10865 HLA-DQA1       6_26 0.000e+00  411.1 0.000e+00  3.6960        2
11372   AGPAT1       6_26 0.000e+00  405.0 0.000e+00 -5.1903        1
11371     AGER       6_26 1.776e-15  402.3 6.786e-18 -9.0708        1
11369   NOTCH4       6_26 0.000e+00  315.7 0.000e+00  7.5989        2
11367    BTNL2       6_26 0.000e+00  302.3 0.000e+00  3.4859        1
11391   HSPA1L       6_26 0.000e+00  286.0 0.000e+00  1.4874        1
11648    DDAH2       6_26 0.000e+00  259.2 0.000e+00  8.1494        1
11397   LY6G6C       6_26 0.000e+00  243.4 0.000e+00 -7.8392        3
11375    FKBPL       6_26 0.000e+00  187.8 0.000e+00 -5.2840        2
11647    CLIC1       6_26 0.000e+00  160.9 0.000e+00  0.0146        1
11366  HLA-DRA       6_26 0.000e+00  159.0 0.000e+00  3.7977        1
11642    ATF6B       6_26 0.000e+00  157.2 0.000e+00  4.3893        1
11370     PBX2       6_26 0.000e+00  153.9 0.000e+00 -1.0290        2
Genes with highest PVE
           genename region_tag susie_pip    mu2       PVE      z num_eqtl
11404          APOM       6_26    0.4547 647.02 0.0027931 11.590        1
5491          FURIN      15_42    0.9589  46.05 0.0004193 -6.990        1
3067          SF3B1      2_117    0.8314  48.79 0.0003852  7.265        1
11067        ZNF823      19_10    0.9830  36.50 0.0003406  6.184        2
2602            MDK      11_28    0.6640  46.66 0.0002941 -7.159        1
12513           C4A       6_26    0.0457 674.80 0.0002928 11.326        1
320            VRK2       2_38    0.7514  36.84 0.0002628  4.977        1
4131         SPECC1      17_16    0.9649  28.01 0.0002566  5.295        2
1843          SETD6      16_31    0.6968  37.01 0.0002448 -6.343        1
268           VSIG2      11_77    0.7953  30.05 0.0002269 -4.616        2
10921         PCBP2      12_33    0.8789  26.37 0.0002201  5.065        1
13453  RP11-230C9.4      6_102    0.9623  23.13 0.0002113 -4.738        2
13724 RP11-408A13.3       9_12    0.9236  22.78 0.0001998  4.536        1
7851          LETM2       8_34    0.5510  37.51 0.0001962 -6.067        1
5689          SYTL1       1_19    0.7452  24.35 0.0001723  4.306        2
10418       TMEM222       1_19    0.8165  22.08 0.0001712  4.303        1
410          CTNNA1       5_82    0.6507  26.43 0.0001633  5.512        1
6509         TMEM56       1_58    0.8064  20.82 0.0001594 -3.907        1
3468        PYROXD2      10_62    0.7908  20.64 0.0001550  3.952        1
13743         CWC25      17_23    0.7406  21.86 0.0001537 -4.095        3
Genes with largest z scores
       genename region_tag susie_pip    mu2       PVE       z num_eqtl
11404      APOM       6_26 4.547e-01 647.02 2.793e-03  11.590        1
12513       C4A       6_26 4.570e-02 674.80 2.928e-04  11.326        1
5093      FLOT1       6_24 5.725e-02  79.39 4.315e-05 -10.981        1
11389   C6orf48       6_26 9.823e-05 601.40 5.609e-07  10.917        2
10415    BTN3A2       6_20 2.445e-02  94.77 2.200e-05  10.822        3
11395      MSH5       6_26 2.863e-06 580.55 1.578e-08  10.559        2
10915   ZSCAN26       6_22 1.614e-02  73.96 1.134e-05  10.158        3
2826     BTN2A1       6_20 5.570e-02  83.47 4.415e-05 -10.131        1
9788  HIST1H2BC       6_20 3.494e-02  81.03 2.688e-05  -9.909        1
11431     RNF39       6_24 1.261e-01  59.40 7.110e-05   9.536        1
11371      AGER       6_26 1.776e-15 402.34 6.786e-18  -9.071        1
2790     TRIM38       6_20 2.329e-02  65.72 1.453e-05  -9.032        2
11359   HLA-DMA       6_27 5.353e-02  66.65 3.388e-05  -8.845        1
12454   HLA-DMB       6_27 6.309e-02  67.59 4.049e-05  -8.701        2
11648     DDAH2       6_26 0.000e+00 259.20 0.000e+00   8.149        1
6275      CNNM2      10_66 3.990e-02  40.21 1.523e-05  -8.125        2
11397    LY6G6C       6_26 0.000e+00 243.41 0.000e+00  -7.839        3
10558   ZSCAN23       6_22 7.201e-02  47.91 3.275e-05  -7.769        2
11369    NOTCH4       6_26 0.000e+00 315.72 0.000e+00   7.599        2
11386     EHMT2       6_26 0.000e+00 436.64 0.000e+00   7.534        1
Comparing z scores and PIPs
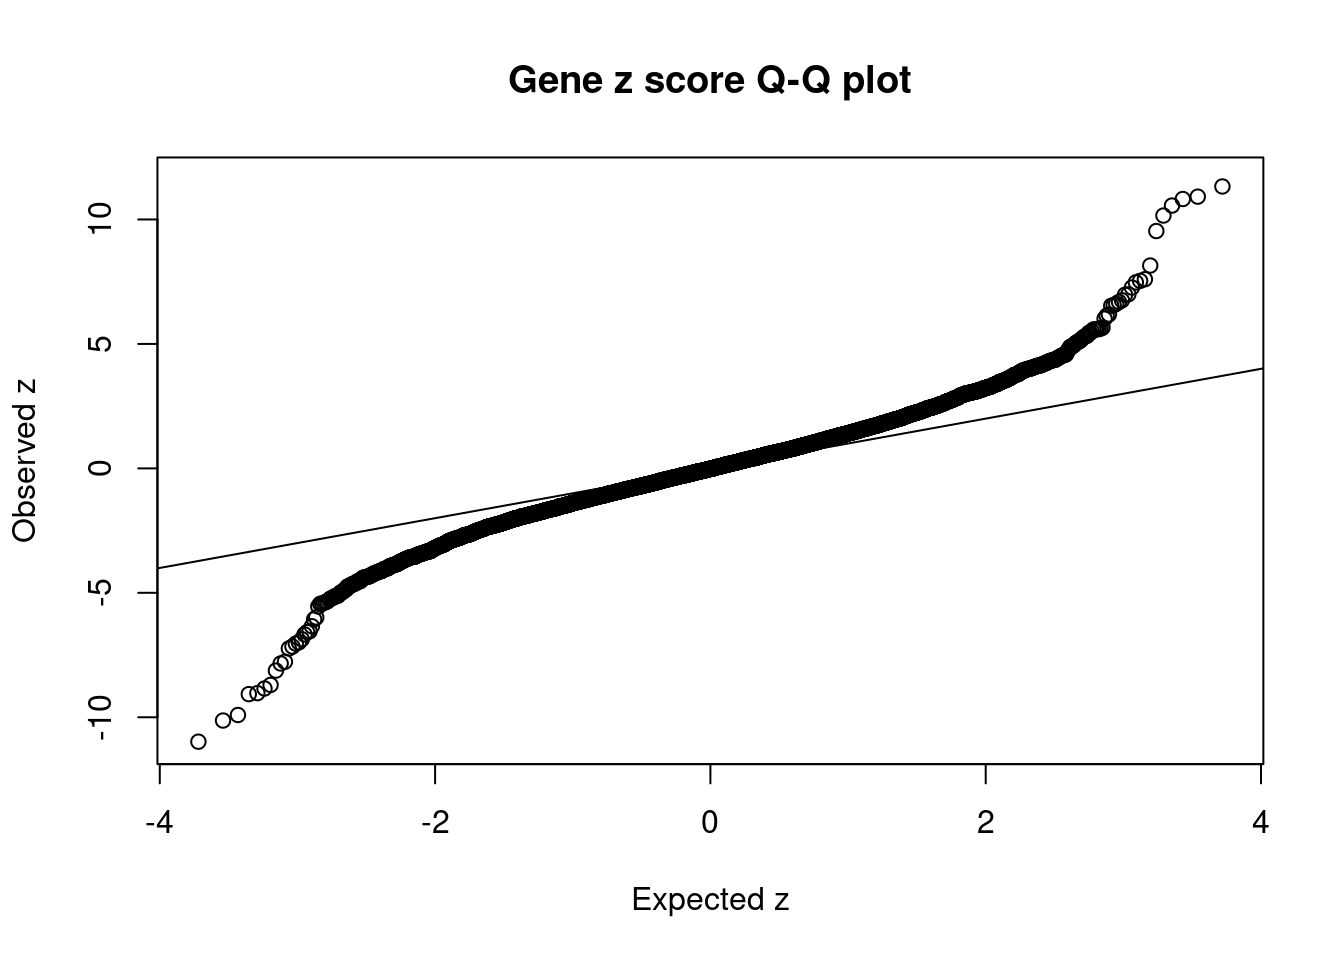
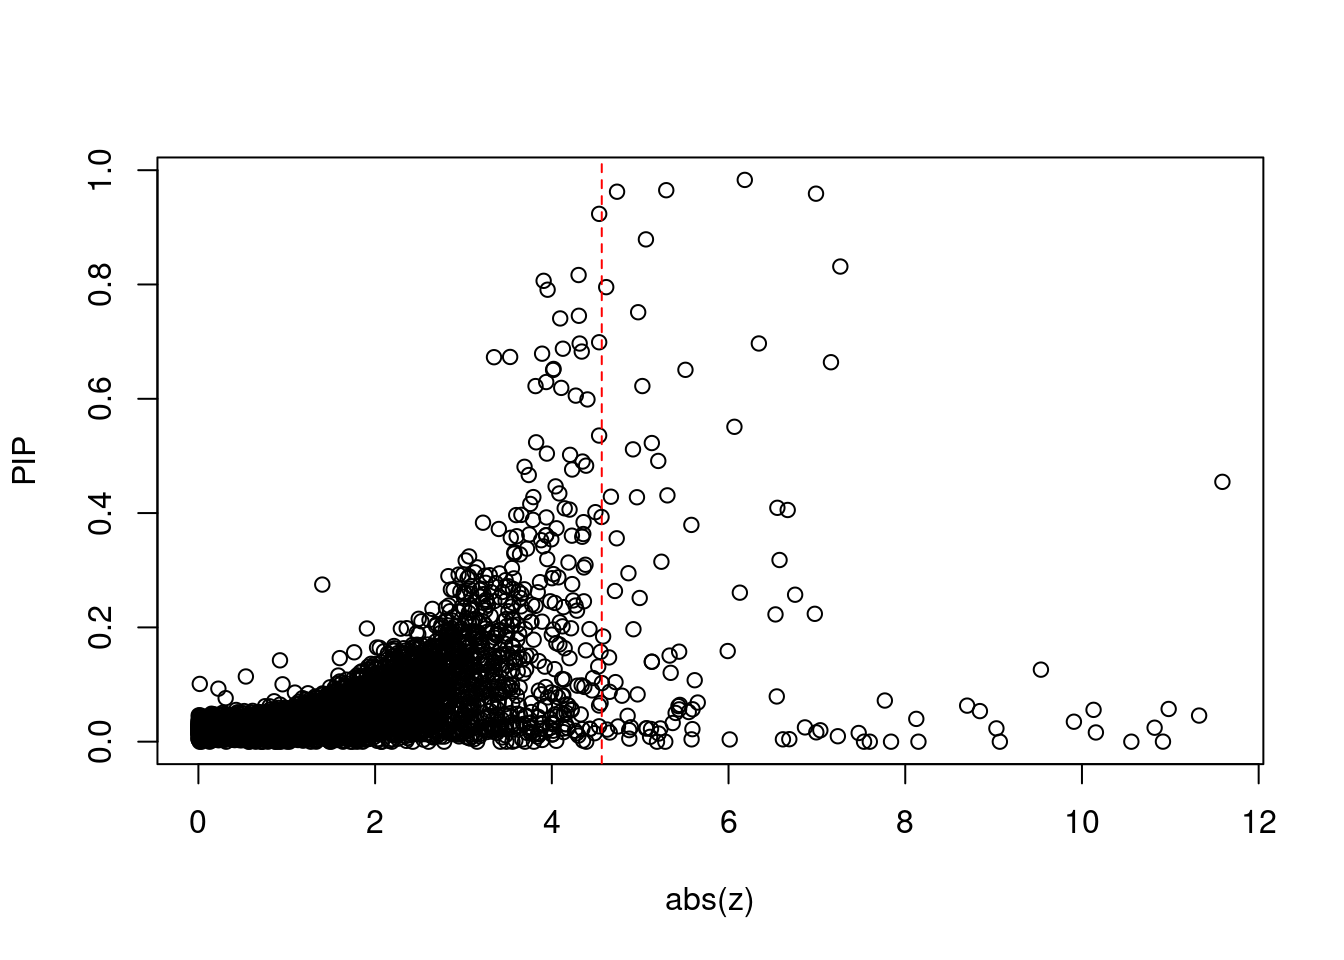
[1] 0.01008GO enrichment analysis for genes with PIP>0.5
#number of genes for gene set enrichment
length(genes)
[1] 39Uploading data to Enrichr... Done.
Querying GO_Biological_Process_2021... Done.
Querying GO_Cellular_Component_2021... Done.
Querying GO_Molecular_Function_2021... Done.
Parsing results... Done.
[1] "GO_Biological_Process_2021"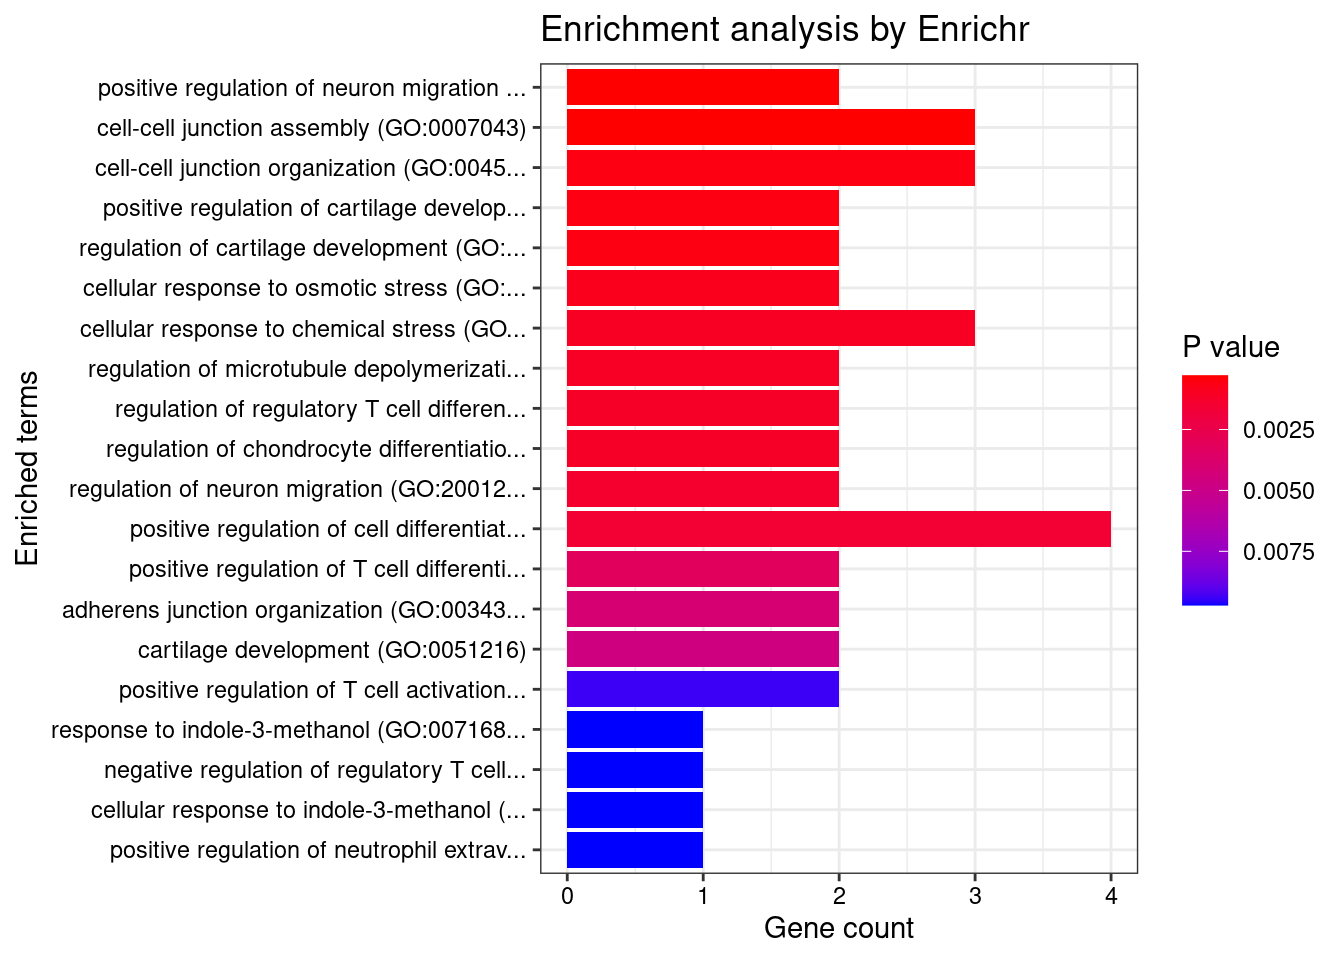
                                                           Term Overlap
1          positive regulation of neuron migration (GO:2001224)    2/13
2                      cell-cell junction assembly (GO:0007043)    3/66
3                  cell-cell junction organization (GO:0045216)    3/82
4     positive regulation of cartilage development (GO:0061036)    2/18
5              regulation of cartilage development (GO:0061035)    2/18
6              cellular response to osmotic stress (GO:0071470)    2/22
7             cellular response to chemical stress (GO:0062197)   3/101
8       regulation of microtubule depolymerization (GO:0031114)    2/25
9  regulation of regulatory T cell differentiation (GO:0045589)    2/26
10       regulation of chondrocyte differentiation (GO:0032330)    2/26
   Adjusted.P.value              Genes
1           0.04580        MDK;ARHGEF2
2           0.04580 TRPV4;CTNNA1;CDHR3
3           0.04580 TRPV4;CTNNA1;CDHR3
4           0.04580           MDK;SOX5
5           0.04580           MDK;SOX5
6           0.04817      TRPV4;ARHGEF2
7           0.04817   PRDX2;TRPV4;VRK2
8           0.04817      TRPV4;ARHGEF2
9           0.04817           MDK;CD46
10          0.04817           MDK;SOX5
[1] "GO_Cellular_Component_2021"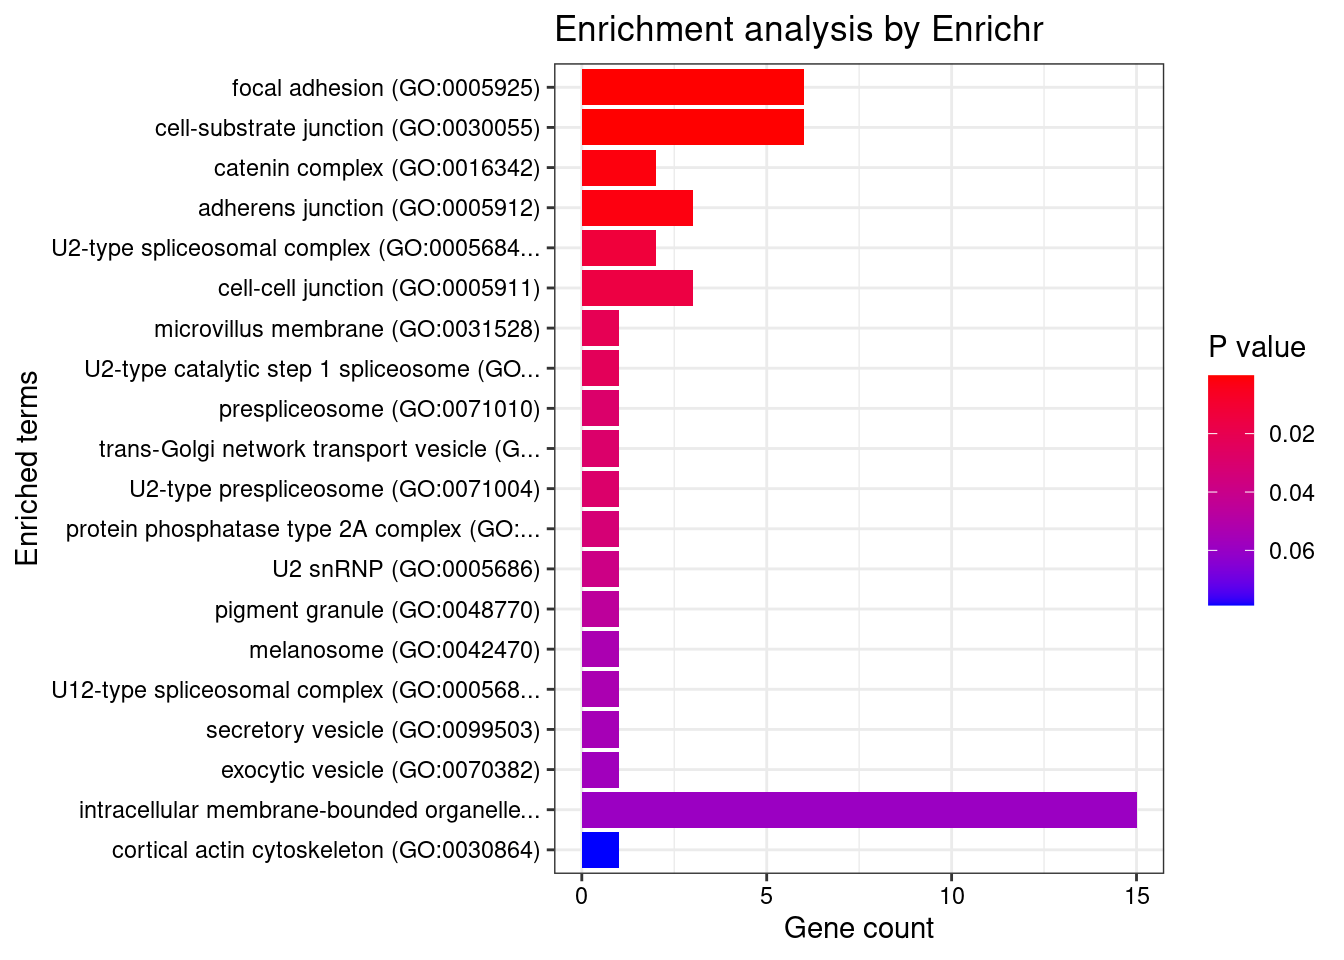
                                  Term Overlap Adjusted.P.value
1          focal adhesion (GO:0005925)   6/387         0.003283
2 cell-substrate junction (GO:0030055)   6/394         0.003283
3         catenin complex (GO:0016342)    2/31         0.033461
4       adherens junction (GO:0005912)   3/132         0.033461
                                  Genes
1 RPL12;TRPV4;PCBP2;CTNNA1;ARHGEF2;CD46
2 RPL12;TRPV4;PCBP2;CTNNA1;ARHGEF2;CD46
3                          CTNNA1;CDHR3
4                    TRPV4;CTNNA1;CDHR3
[1] "GO_Molecular_Function_2021"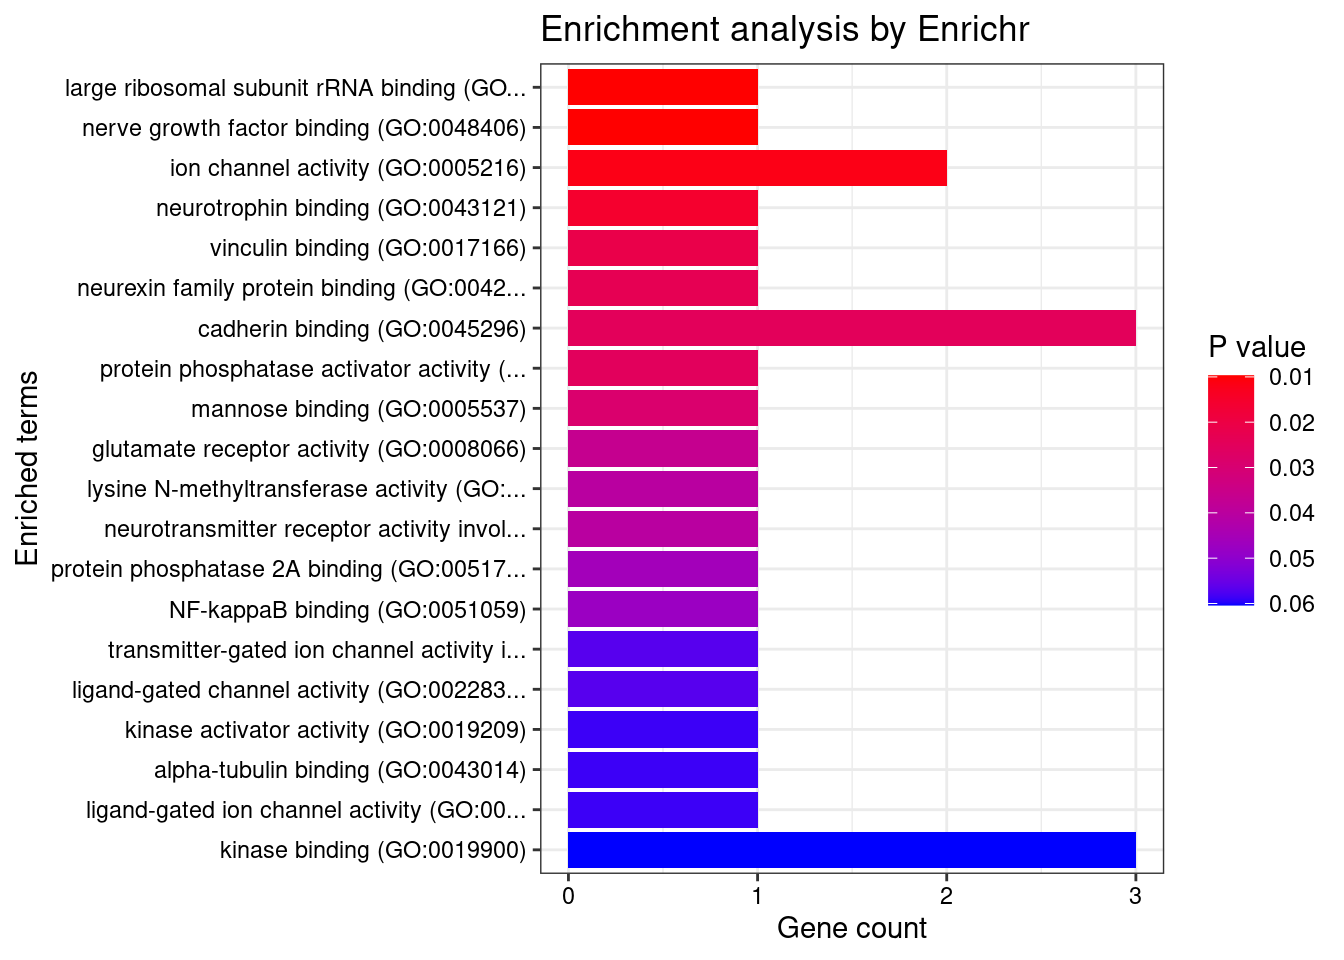
[1] Term             Overlap          Adjusted.P.value Genes
<0 rows> (or 0-length row.names)
DisGeNET enrichment analysis for genes with PIP>0.5
                                                              Description
15                                                              Confusion
40                                                                Measles
66                                                      Speech impairment
67                                                          Derealization
73                          Spondylometaphyseal dysplasia, Kozlowski type
74                                                    Metatropic dwarfism
91                                                     Brachyolmia Type 3
99                                         Sexually disinhibited behavior
106                                                Hypersomnia, Recurrent
129 SPINAL MUSCULAR ATROPHY, DISTAL, CONGENITAL NONPROGRESSIVE (disorder)
        FDR Ratio BgRatio
15  0.01027  1/15  1/9703
40  0.01027  1/15  1/9703
66  0.01027  1/15  1/9703
67  0.01027  1/15  1/9703
73  0.01027  1/15  1/9703
74  0.01027  1/15  1/9703
91  0.01027  1/15  1/9703
99  0.01027  1/15  1/9703
106 0.01027  1/15  1/9703
129 0.01027  1/15  1/9703
WebGestalt enrichment analysis for genes with PIP>0.5
Loading the functional categories...
Loading the ID list...
Loading the reference list...
Performing the enrichment analysis...
Warning in oraEnrichment(interestGeneList, referenceGeneList, geneSet, minNum =
minNum, : No significant gene set is identified based on FDR 0.05!NULLPIP Manhattan Plot
Sensitivity, specificity and precision for silver standard genes
#number of genes in known annotations
print(length(known_annotations))
[1] 130#number of genes in known annotations with imputed expression
print(sum(known_annotations %in% ctwas_gene_res$genename))[1] 52#significance threshold for TWAS
print(sig_thresh)[1] 4.565#number of ctwas genes
length(ctwas_genes)[1] 9#number of TWAS genes
length(twas_genes)[1] 101#show novel genes (ctwas genes with not in TWAS genes)
ctwas_gene_res[ctwas_gene_res$genename %in% novel_genes,report_cols] genename region_tag susie_pip mu2 PVE z num_eqtl
10418 TMEM222 1_19 0.8165 22.08 0.0001712 4.303 1
6509 TMEM56 1_58 0.8064 20.82 0.0001594 -3.907 1
13724 RP11-408A13.3 9_12 0.9236 22.78 0.0001998 4.536 1#sensitivity / recall
print(sensitivity) ctwas TWAS
0.02308 0.12308 #specificity
print(specificity) ctwas TWAS
0.9994 0.9915 #precision / PPV
print(precision) ctwas TWAS
0.3333 0.1584 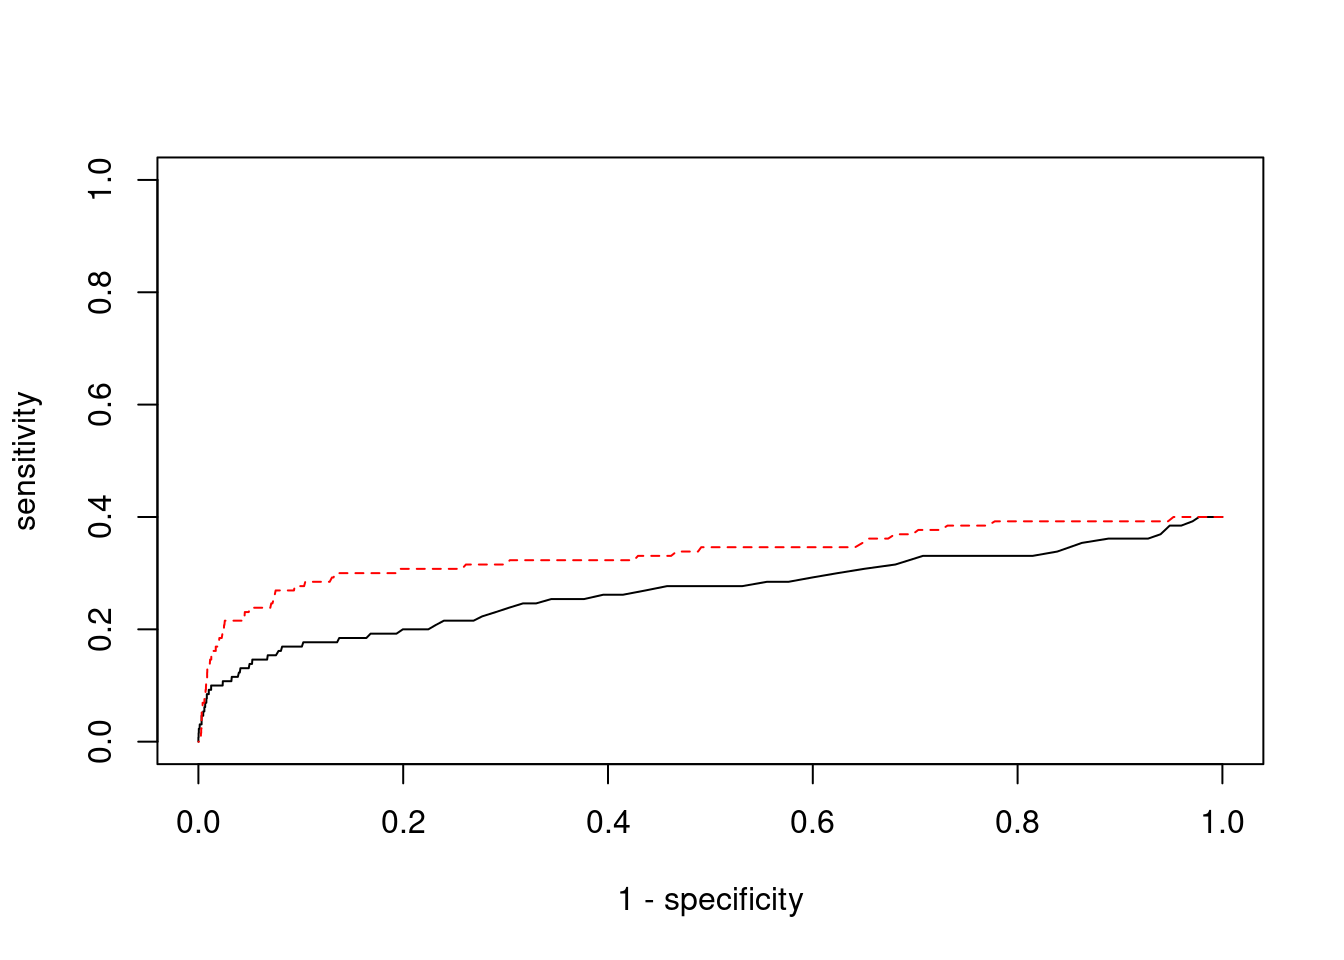
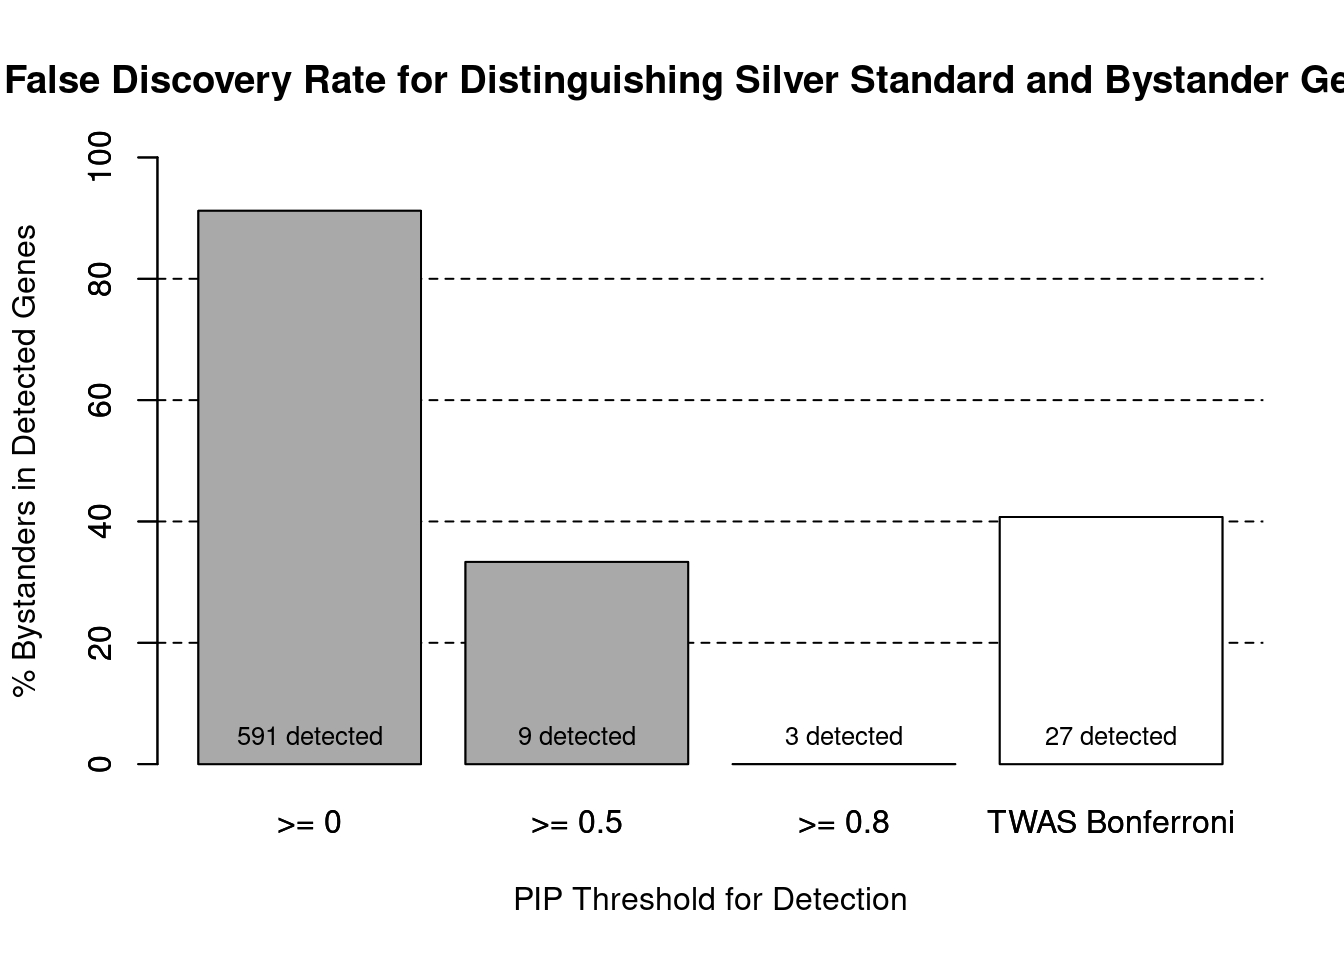
cTWAS is more precise than TWAS in distinguishing silver standard and bystander genes
#number of genes in known annotations (with imputed expression)
print(length(known_annotations))[1] 52#number of bystander genes (with imputed expression)
print(length(unrelated_genes))[1] 539#subset results to genes in known annotations or bystanders
ctwas_gene_res_subset <- ctwas_gene_res[ctwas_gene_res$genename %in% c(known_annotations, unrelated_genes),]
#assign ctwas and TWAS genes
ctwas_genes <- ctwas_gene_res_subset$genename[ctwas_gene_res_subset$susie_pip>0.8]
twas_genes <- ctwas_gene_res_subset$genename[abs(ctwas_gene_res_subset$z)>sig_thresh]
#significance threshold for TWAS
print(sig_thresh)
[1] 4.565#number of ctwas genes (in known annotations or bystanders)
length(ctwas_genes)[1] 3#number of TWAS genes (in known annotations or bystanders)
length(twas_genes)[1] 27#sensitivity / recall
sensitivity ctwas TWAS
0.05769 0.30769 #specificity / (1 - False Positive Rate)
specificity ctwas TWAS
1.0000 0.9796 #precision / PPV / (1 - False Discovery Rate)
precision ctwas TWAS
1.0000 0.5926 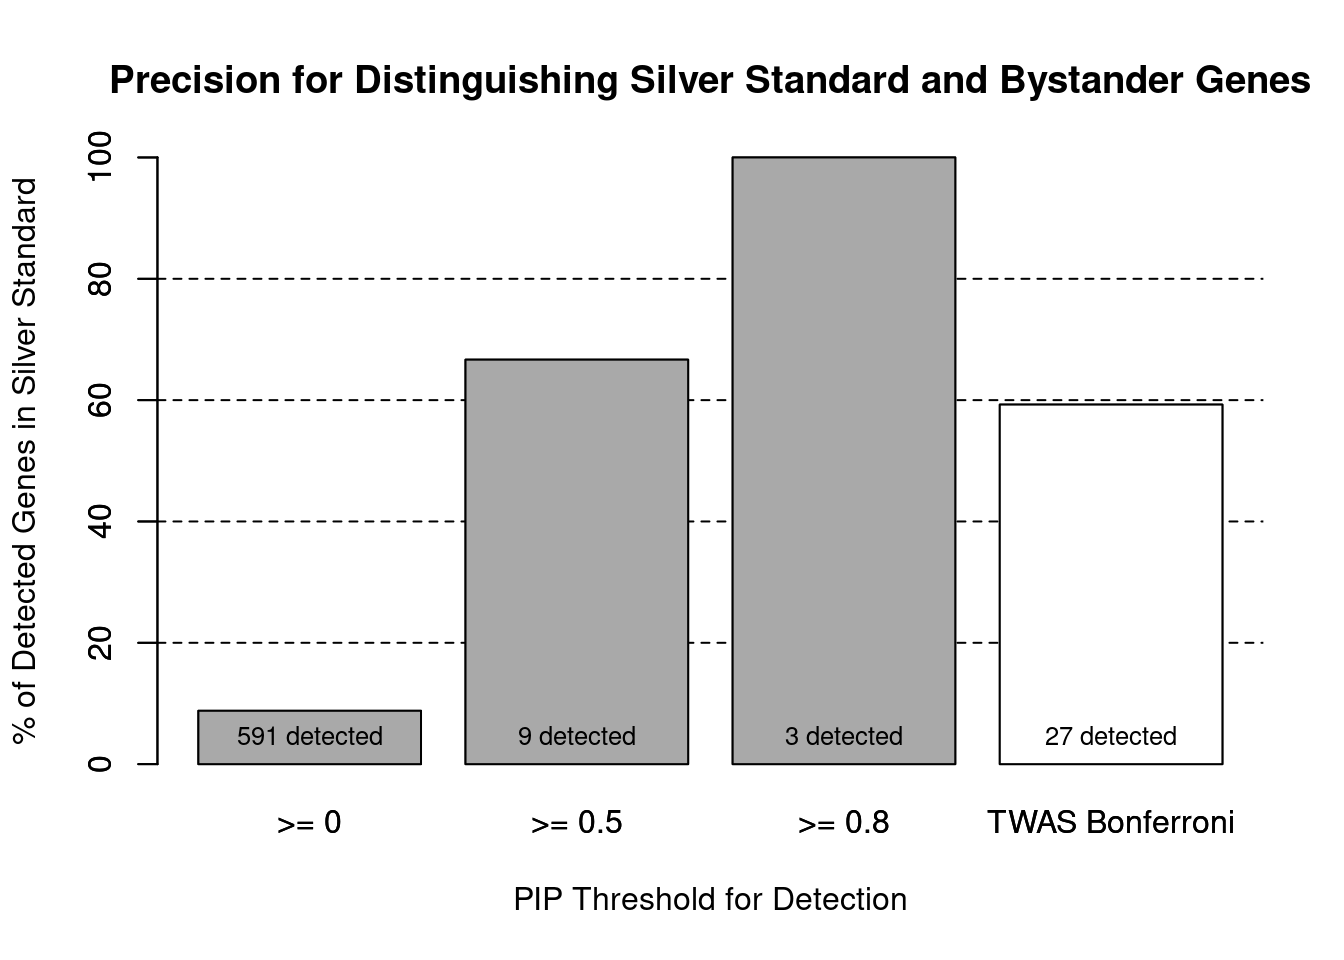
pip_range <- (0:1000)/1000
sensitivity <- rep(NA, length(pip_range))
specificity <- rep(NA, length(pip_range))

for (index in 1:length(pip_range)){
  pip <- pip_range[index]
  ctwas_genes <- ctwas_gene_res_subset$genename[ctwas_gene_res_subset$susie_pip>=pip]
  sensitivity[index] <- sum(ctwas_genes %in% known_annotations)/length(known_annotations)
  specificity[index] <- sum(!(unrelated_genes %in% ctwas_genes))/length(unrelated_genes)
}

plot(1-specificity, sensitivity, type="l", xlim=c(0,1), ylim=c(0,1), main="", xlab="1 - Specificity", ylab="Sensitivity")
title(expression("ROC Curve for cTWAS (black) and TWAS (" * phantom("red") * ")"))
title(expression(phantom("ROC Curve for cTWAS (black) and TWAS (") * "red" * phantom(")")), col.main="red")

sig_thresh_range <- seq(from=0, to=max(abs(ctwas_gene_res_subset$z)), length.out=length(pip_range))

for (index in 1:length(sig_thresh_range)){
  sig_thresh_plot <- sig_thresh_range[index]
  twas_genes <- ctwas_gene_res_subset$genename[abs(ctwas_gene_res_subset$z)>=sig_thresh_plot]
  sensitivity[index] <- sum(twas_genes %in% known_annotations)/length(known_annotations)
  specificity[index] <- sum(!(unrelated_genes %in% twas_genes))/length(unrelated_genes)
}

lines(1-specificity, sensitivity, xlim=c(0,1), ylim=c(0,1), col="red", lty=1)

abline(a=0,b=1,lty=3)

#add previously computed points from the analysis
ctwas_genes <- ctwas_gene_res_subset$genename[ctwas_gene_res_subset$susie_pip>0.8]
twas_genes <- ctwas_gene_res_subset$genename[abs(ctwas_gene_res_subset$z)>sig_thresh]

points(1-specificity_plot["ctwas"], sensitivity_plot["ctwas"], pch=21, bg="black")
points(1-specificity_plot["TWAS"], sensitivity_plot["TWAS"], pch=21, bg="red")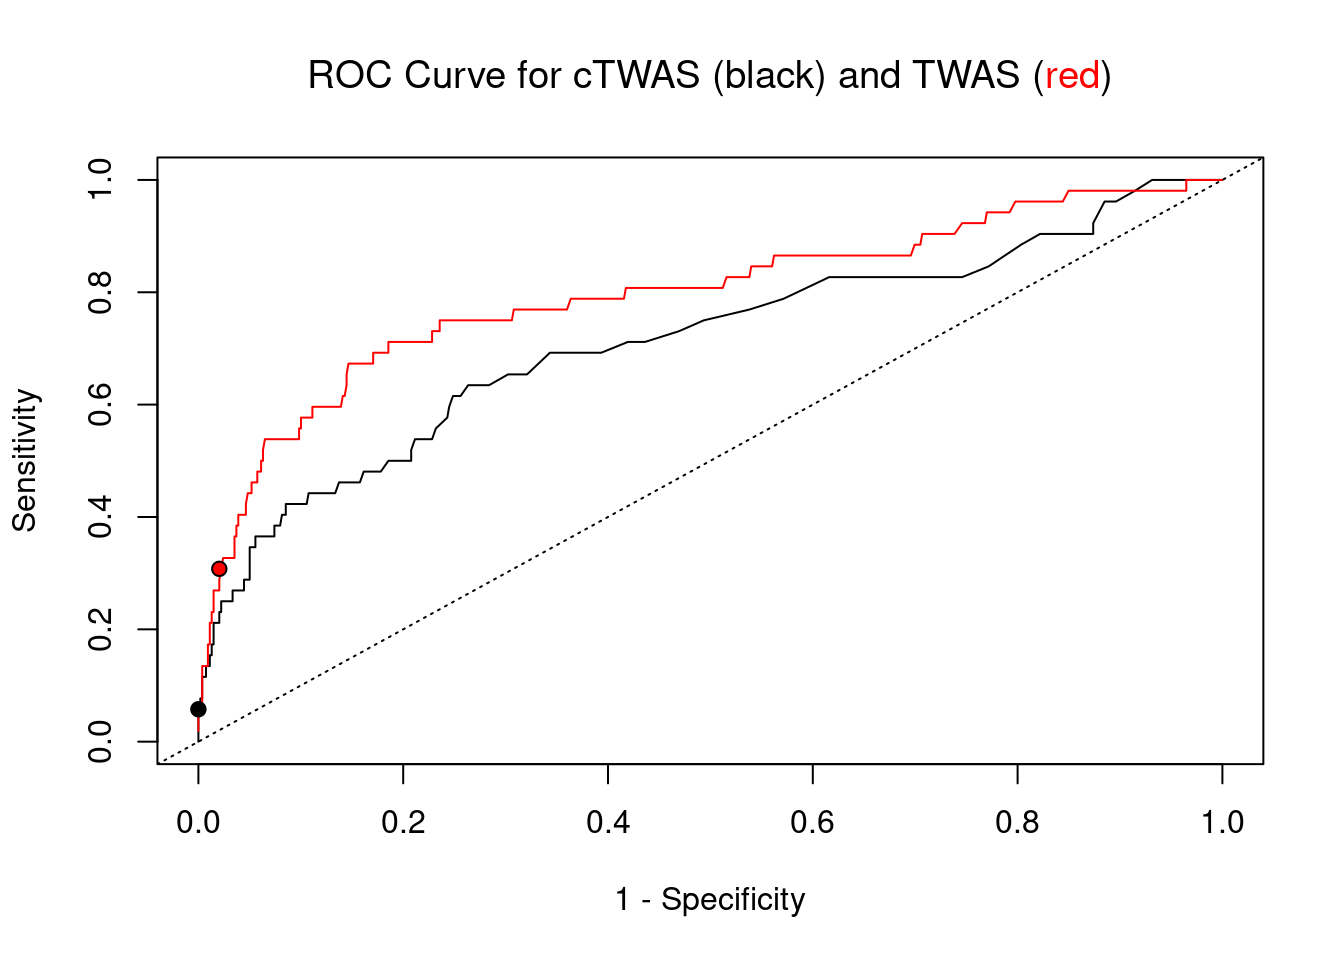
Undetected silver standard genes have low TWAS z-scores or stronger signal from nearby variants
#table of outcomes for silver standard genes
-sort(-table(silver_standard_case))
silver_standard_case
Not Imputed Insignificant z-score Nearby SNP(s)
78 36 13
Detected (PIP > 0.8)
3 #show inconclusive genes
silver_standard_case[silver_standard_case=="Inconclusive"]named character(0)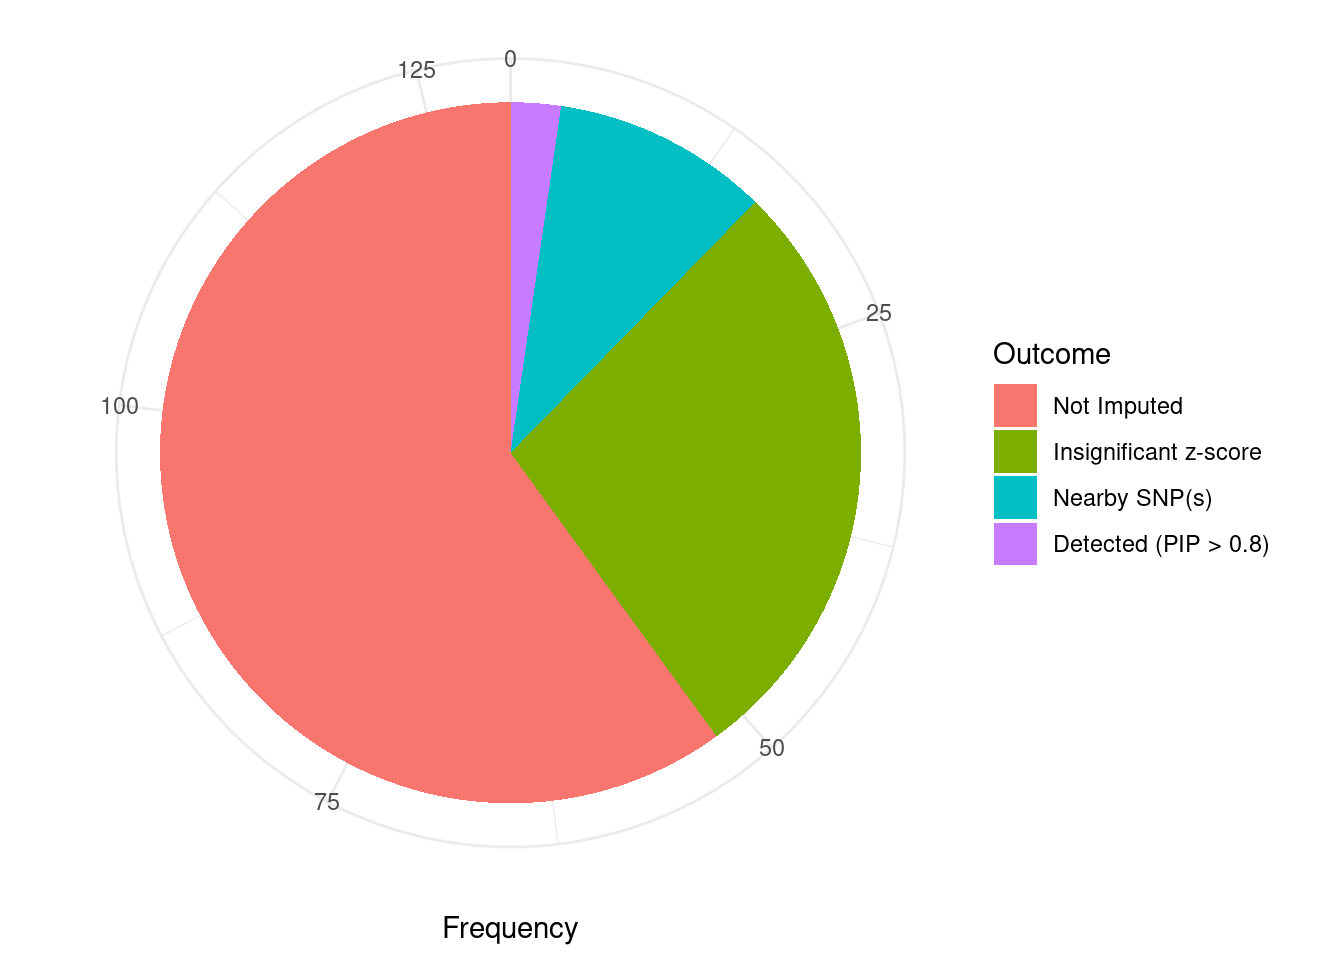
sessionInfo()R version 3.6.1 (2019-07-05)
Platform: x86_64-pc-linux-gnu (64-bit)
Running under: Scientific Linux 7.4 (Nitrogen)
Matrix products: default
BLAS/LAPACK: /software/openblas-0.2.19-el7-x86_64/lib/libopenblas_haswellp-r0.2.19.so
locale:
[1] LC_CTYPE=en_US.UTF-8 LC_NUMERIC=C
[3] LC_TIME=en_US.UTF-8 LC_COLLATE=en_US.UTF-8
[5] LC_MONETARY=en_US.UTF-8 LC_MESSAGES=en_US.UTF-8
[7] LC_PAPER=en_US.UTF-8 LC_NAME=C
[9] LC_ADDRESS=C LC_TELEPHONE=C
[11] LC_MEASUREMENT=en_US.UTF-8 LC_IDENTIFICATION=C
attached base packages:
[1] parallel stats4 stats graphics grDevices utils datasets
[8] methods base
other attached packages:
[1] GenomicRanges_1.36.1 GenomeInfoDb_1.20.0 IRanges_2.18.1
[4] S4Vectors_0.22.1 BiocGenerics_0.30.0 biomaRt_2.40.1
[7] readxl_1.3.1 forcats_0.5.1 stringr_1.4.0
[10] dplyr_1.0.7 purrr_0.3.4 readr_2.1.1
[13] tidyr_1.1.4 tidyverse_1.3.1 tibble_3.1.6
[16] WebGestaltR_0.4.4 disgenet2r_0.99.2 enrichR_3.0
[19] cowplot_1.1.1 ggplot2_3.3.5 workflowr_1.7.0
loaded via a namespace (and not attached):
[1] ggbeeswarm_0.6.0 colorspace_2.0-2 rjson_0.2.20
[4] ellipsis_0.3.2 rprojroot_2.0.2 XVector_0.24.0
[7] fs_1.5.2 rstudioapi_0.13 farver_2.1.0
[10] ggrepel_0.9.1 bit64_4.0.5 AnnotationDbi_1.46.0
[13] fansi_1.0.2 lubridate_1.8.0 xml2_1.3.3
[16] codetools_0.2-16 doParallel_1.0.17 cachem_1.0.6
[19] knitr_1.36 jsonlite_1.7.2 apcluster_1.4.8
[22] Cairo_1.5-12.2 broom_0.7.10 dbplyr_2.1.1
[25] compiler_3.6.1 httr_1.4.2 backports_1.4.1
[28] assertthat_0.2.1 Matrix_1.2-18 fastmap_1.1.0
[31] cli_3.1.0 later_0.8.0 prettyunits_1.1.1
[34] htmltools_0.5.2 tools_3.6.1 igraph_1.2.10
[37] GenomeInfoDbData_1.2.1 gtable_0.3.0 glue_1.6.2
[40] reshape2_1.4.4 doRNG_1.8.2 Rcpp_1.0.8
[43] Biobase_2.44.0 cellranger_1.1.0 jquerylib_0.1.4
[46] vctrs_0.3.8 svglite_1.2.2 iterators_1.0.14
[49] xfun_0.29 ps_1.6.0 rvest_1.0.2
[52] lifecycle_1.0.1 rngtools_1.5.2 XML_3.99-0.3
[55] zlibbioc_1.30.0 getPass_0.2-2 scales_1.1.1
[58] vroom_1.5.7 hms_1.1.1 promises_1.0.1
[61] yaml_2.2.1 curl_4.3.2 memoise_2.0.1
[64] ggrastr_1.0.1 gdtools_0.1.9 stringi_1.7.6
[67] RSQLite_2.2.8 highr_0.9 foreach_1.5.2
[70] rlang_1.0.1 pkgconfig_2.0.3 bitops_1.0-7
[73] evaluate_0.14 lattice_0.20-38 labeling_0.4.2
[76] bit_4.0.4 processx_3.5.2 tidyselect_1.1.1
[79] plyr_1.8.6 magrittr_2.0.2 R6_2.5.1
[82] generics_0.1.1 DBI_1.1.2 pillar_1.6.4
[85] haven_2.4.3 whisker_0.3-2 withr_2.4.3
[88] RCurl_1.98-1.5 modelr_0.1.8 crayon_1.5.0
[91] utf8_1.2.2 tzdb_0.2.0 rmarkdown_2.11
[94] progress_1.2.2 grid_3.6.1 data.table_1.14.2
[97] blob_1.2.2 callr_3.7.0 git2r_0.26.1
[100] reprex_2.0.1 digest_0.6.29 httpuv_1.5.1
[103] munsell_0.5.0 beeswarm_0.2.3 vipor_0.4.5