SCZ - Brain Caudate basal ganglia
sheng Qian
2021-2-6
Last updated: 2022-03-14
Checks: 5 2
Knit directory: cTWAS_analysis/
This reproducible R Markdown analysis was created with workflowr (version 1.7.0). The Checks tab describes the reproducibility checks that were applied when the results were created. The Past versions tab lists the development history.
The R Markdown is untracked by Git. To know which version of the R Markdown file created these results, you’ll want to first commit it to the Git repo. If you’re still working on the analysis, you can ignore this warning. When you’re finished, you can run wflow_publish to commit the R Markdown file and build the HTML.
Great job! The global environment was empty. Objects defined in the global environment can affect the analysis in your R Markdown file in unknown ways. For reproduciblity it’s best to always run the code in an empty environment.
The command set.seed(20211220) was run prior to running the code in the R Markdown file. Setting a seed ensures that any results that rely on randomness, e.g. subsampling or permutations, are reproducible.
Great job! Recording the operating system, R version, and package versions is critical for reproducibility.
Nice! There were no cached chunks for this analysis, so you can be confident that you successfully produced the results during this run.
Using absolute paths to the files within your workflowr project makes it difficult for you and others to run your code on a different machine. Change the absolute path(s) below to the suggested relative path(s) to make your code more reproducible.
| absolute | relative |
|---|---|
| /project2/xinhe/shengqian/cTWAS/cTWAS_analysis/data/ | data |
| /project2/xinhe/shengqian/cTWAS/cTWAS_analysis/code/ctwas_config.R | code/ctwas_config.R |
Great! You are using Git for version control. Tracking code development and connecting the code version to the results is critical for reproducibility.
The results in this page were generated with repository version 4c71b11. See the Past versions tab to see a history of the changes made to the R Markdown and HTML files.
Note that you need to be careful to ensure that all relevant files for the analysis have been committed to Git prior to generating the results (you can use wflow_publish or wflow_git_commit). workflowr only checks the R Markdown file, but you know if there are other scripts or data files that it depends on. Below is the status of the Git repository when the results were generated:
Ignored files:
    Ignored:    .ipynb_checkpoints/
    Ignored:    data/AF/

Untracked files:
    Untracked:  Rplot.png
    Untracked:  analysis/.ipynb_checkpoints/
    Untracked:  analysis/SCZ_2014_EUR_Brain_Amygdala.Rmd
    Untracked:  analysis/SCZ_2014_EUR_Brain_Anterior_cingulate_cortex_BA24.Rmd
    Untracked:  analysis/SCZ_2014_EUR_Brain_Caudate_basal_ganglia.Rmd
    Untracked:  analysis/SCZ_2014_EUR_Brain_Cerebellar_Hemisphere.Rmd
    Untracked:  analysis/SCZ_2014_EUR_Brain_Cerebellum.Rmd
    Untracked:  analysis/SCZ_2014_EUR_Brain_Cortex.Rmd
    Untracked:  analysis/SCZ_2014_EUR_Brain_Frontal_Cortex_BA9.Rmd
    Untracked:  analysis/SCZ_2014_EUR_Brain_Hippocampus.Rmd
    Untracked:  analysis/SCZ_2014_EUR_Brain_Hypothalamus.Rmd
    Untracked:  analysis/SCZ_2014_EUR_Brain_Nucleus_accumbens_basal_ganglia.Rmd
    Untracked:  analysis/SCZ_2014_EUR_Brain_Putamen_basal_ganglia.Rmd
    Untracked:  analysis/SCZ_2014_EUR_Brain_Spinal_cord_cervical_c-1.Rmd
    Untracked:  analysis/SCZ_2014_EUR_Brain_Substantia_nigra.Rmd
    Untracked:  analysis/SCZ_2020_Brain_Cortex.Rmd
    Untracked:  analysis/SCZ_2020_Brain_Frontal_Cortex_BA9.Rmd
    Untracked:  analysis/SCZ_2020_Brain_Hypothalamus.Rmd
    Untracked:  analysis/SCZ_2020_Brain_Putamen_basal_ganglia.Rmd
    Untracked:  analysis/SCZ_Cross_Tissue_Analysis.Rmd
    Untracked:  code/.ipynb_checkpoints/
    Untracked:  code/AF_out/
    Untracked:  code/Autism_out/
    Untracked:  code/BMI_S_out/
    Untracked:  code/BMI_out/
    Untracked:  code/Glucose_out/
    Untracked:  code/LDL_S_out/
    Untracked:  code/SCZ_2014_EUR_out/
    Untracked:  code/SCZ_2020_out/
    Untracked:  code/SCZ_S_out/
    Untracked:  code/SCZ_out/
    Untracked:  code/T2D_out/
    Untracked:  code/ctwas_config.R
    Untracked:  code/mapping.R
    Untracked:  code/out/
    Untracked:  code/run_AF_analysis.sbatch
    Untracked:  code/run_AF_analysis.sh
    Untracked:  code/run_AF_ctwas_rss_LDR.R
    Untracked:  code/run_Autism_analysis.sbatch
    Untracked:  code/run_Autism_analysis.sh
    Untracked:  code/run_Autism_ctwas_rss_LDR.R
    Untracked:  code/run_BMI_analysis.sbatch
    Untracked:  code/run_BMI_analysis.sh
    Untracked:  code/run_BMI_analysis_S.sbatch
    Untracked:  code/run_BMI_analysis_S.sh
    Untracked:  code/run_BMI_ctwas_rss_LDR.R
    Untracked:  code/run_BMI_ctwas_rss_LDR_S.R
    Untracked:  code/run_Glucose_analysis.sbatch
    Untracked:  code/run_Glucose_analysis.sh
    Untracked:  code/run_Glucose_ctwas_rss_LDR.R
    Untracked:  code/run_LDL_analysis_S.sbatch
    Untracked:  code/run_LDL_analysis_S.sh
    Untracked:  code/run_LDL_ctwas_rss_LDR_S.R
    Untracked:  code/run_SCZ_2014_EUR_analysis.sbatch
    Untracked:  code/run_SCZ_2014_EUR_analysis.sh
    Untracked:  code/run_SCZ_2014_EUR_ctwas_rss_LDR.R
    Untracked:  code/run_SCZ_2020_analysis.sbatch
    Untracked:  code/run_SCZ_2020_analysis.sh
    Untracked:  code/run_SCZ_2020_ctwas_rss_LDR.R
    Untracked:  code/run_SCZ_analysis.sbatch
    Untracked:  code/run_SCZ_analysis.sh
    Untracked:  code/run_SCZ_analysis_S.sbatch
    Untracked:  code/run_SCZ_analysis_S.sh
    Untracked:  code/run_SCZ_ctwas_rss_LDR.R
    Untracked:  code/run_SCZ_ctwas_rss_LDR_S.R
    Untracked:  code/run_T2D_analysis.sbatch
    Untracked:  code/run_T2D_analysis.sh
    Untracked:  code/run_T2D_ctwas_rss_LDR.R
    Untracked:  code/wflow_build.R
    Untracked:  code/wflow_build.sbatch
    Untracked:  data/.ipynb_checkpoints/
    Untracked:  data/BMI/
    Untracked:  data/PGC3_SCZ_wave3_public.v2.tsv
    Untracked:  data/SCZ/
    Untracked:  data/SCZ_2014_EUR/
    Untracked:  data/SCZ_2020/
    Untracked:  data/SCZ_S/
    Untracked:  data/T2D/
    Untracked:  data/UKBB/
    Untracked:  data/UKBB_SNPs_Info.text
    Untracked:  data/gene_OMIM.txt
    Untracked:  data/gene_pip_0.8.txt
    Untracked:  data/mashr_Heart_Atrial_Appendage.db
    Untracked:  data/mashr_sqtl/
    Untracked:  data/summary_known_genes_annotations.xlsx
    Untracked:  data/untitled.txt

Unstaged changes:
    Modified:   analysis/SCZ_Brain_Amygdala.Rmd
    Modified:   analysis/SCZ_Brain_Anterior_cingulate_cortex_BA24.Rmd
    Modified:   analysis/SCZ_Brain_Caudate_basal_ganglia.Rmd
    Modified:   analysis/SCZ_Brain_Cerebellar_Hemisphere.Rmd
    Modified:   analysis/SCZ_Brain_Cerebellum.Rmd
    Modified:   analysis/SCZ_Brain_Cortex.Rmd
    Modified:   analysis/SCZ_Brain_Frontal_Cortex_BA9.Rmd
    Modified:   analysis/SCZ_Brain_Hippocampus.Rmd
    Modified:   analysis/SCZ_Brain_Hypothalamus.Rmd
    Modified:   analysis/SCZ_Brain_Nucleus_accumbens_basal_ganglia.Rmd
    Modified:   analysis/SCZ_Brain_Putamen_basal_ganglia.Rmd
    Modified:   analysis/SCZ_Brain_Spinal_cord_cervical_c-1.Rmd
    Modified:   analysis/SCZ_Brain_Substantia_nigra.Rmd
Note that any generated files, e.g. HTML, png, CSS, etc., are not included in this status report because it is ok for generated content to have uncommitted changes.
There are no past versions. Publish this analysis with wflow_publish() to start tracking its development.
Weight QC
#number of imputed weights
nrow(qclist_all)
[1] 11179#number of imputed weights by chromosome
table(qclist_all$chr)
   1    2    3    4    5    6    7    8    9   10   11   12   13   14   15   16
1069  801  661  428  548  641  529  417  410  427  653  638  232  374  375  505
  17   18   19   20   21   22
 698  181  864  331  121  276
#number of imputed weights without missing variants
sum(qclist_all$nmiss==0)[1] 8312#proportion of imputed weights without missing variants
mean(qclist_all$nmiss==0)[1] 0.7435Check convergence of parameters
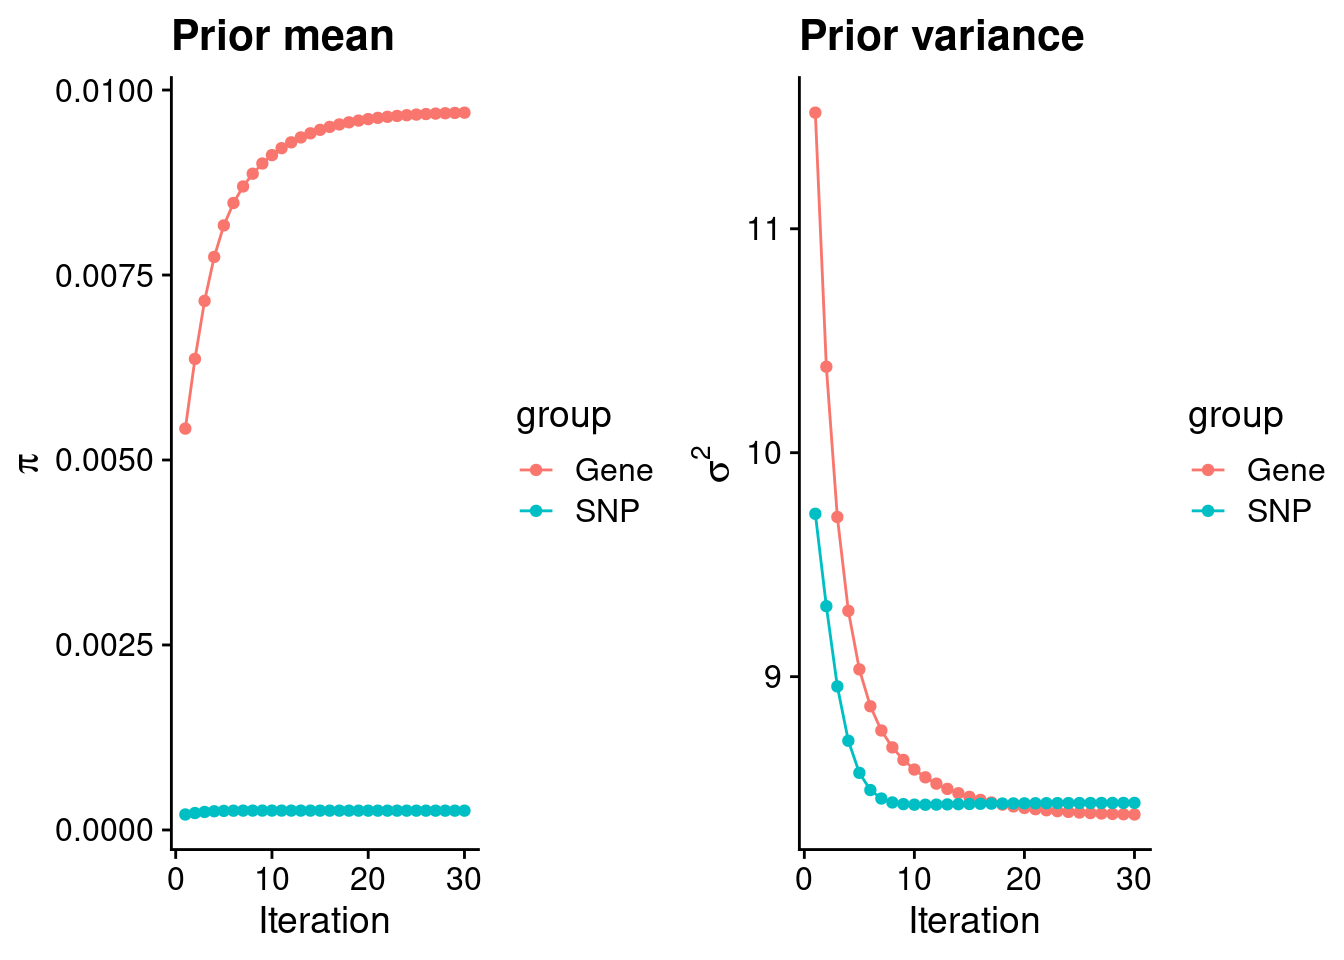
#estimated group prior
estimated_group_prior <- group_prior_rec[,ncol(group_prior_rec)]
names(estimated_group_prior) <- c("gene", "snp")
estimated_group_prior["snp"] <- estimated_group_prior["snp"]*thin #adjust parameter to account for thin argument
print(estimated_group_prior)
gene snp
0.0096940 0.0002607 #estimated group prior variance
estimated_group_prior_var <- group_prior_var_rec[,ncol(group_prior_var_rec)]
names(estimated_group_prior_var) <- c("gene", "snp")
print(estimated_group_prior_var) gene snp
8.385 8.436 #report sample size
print(sample_size)[1] 77096#report group size
group_size <- c(nrow(ctwas_gene_res), n_snps)
print(group_size)[1] 11179 7352670#estimated group PVE
estimated_group_pve <- estimated_group_prior_var*estimated_group_prior*group_size/sample_size #check PVE calculation
names(estimated_group_pve) <- c("gene", "snp")
print(estimated_group_pve) gene snp
0.01179 0.20978 #compare sum(PIP*mu2/sample_size) with above PVE calculation
c(sum(ctwas_gene_res$PVE),sum(ctwas_snp_res$PVE))[1] 0.0693 1.7962Genes with highest PIPs
        genename region_tag susie_pip   mu2       PVE      z num_eqtl
11135     ZNF823      19_10    0.9727 29.26 0.0003692  5.506        2
12311 AC012074.2       2_16    0.8626 23.50 0.0002629  4.623        1
3091       SF3B1      2_117    0.8337 42.87 0.0004636  6.784        1
110        ELAC2      17_11    0.8068 21.67 0.0002268  4.540        1
3016      LMAN2L       2_57    0.7583 40.87 0.0004020 -4.853        2
2684       VPS29      12_67    0.7448 24.37 0.0002354 -4.923        2
3236      MAP7D1       1_22    0.7347 24.70 0.0002354  5.058        1
1678    KIAA0391       14_9    0.7166 22.30 0.0002073 -4.760        1
1879       ESRP2      16_36    0.6767 25.40 0.0002229  5.047        2
8894      ZNF318       6_33    0.6584 23.98 0.0002048 -4.832        1
179        NISCH       3_36    0.6556 33.67 0.0002863  6.110        1
4159      SPECC1      17_16    0.6420 24.40 0.0002032  4.167        1
13347  LINC01415      18_30    0.6226 30.27 0.0002445 -5.655        1
10494    TMEM222       1_19    0.6204 25.88 0.0002083  3.902        1
2630         MDK      11_28    0.5981 37.22 0.0002888 -6.344        1
13314    TBC1D29      17_18    0.5920 25.26 0.0001939  4.354        1
729      PPP2R5B      11_36    0.5628 24.40 0.0001781 -4.614        1
3750     BHLHE41      12_18    0.5481 27.81 0.0001977 -3.860        1
422       CTNNA1       5_82    0.5379 23.12 0.0001613  4.938        1
506      SDCCAG8      1_128    0.5316 24.71 0.0001704 -4.897        1
Genes with largest effect sizes
      genename region_tag susie_pip    mu2       PVE      z num_eqtl
6289     CNNM2      10_66 6.684e-04 2517.0 2.182e-05 -8.294        2
6279   CYP17A1      10_66 8.577e-05  346.6 3.856e-07 -6.664        1
2944      PCCB       3_84 0.000e+00  282.0 0.000e+00 -4.695        3
6280       INA      10_66 1.465e-09  281.7 5.352e-12 -3.927        1
12229 HLA-DQB2       6_26 3.331e-16  243.6 1.053e-18 -3.919        1
10939 HLA-DQA1       6_26 6.328e-15  218.1 1.790e-17  3.448        1
11478     APOM       6_26 7.091e-10  194.8 1.792e-12  8.945        1
11467     VWA7       6_26 5.093e-10  194.7 1.286e-12  8.911        1
11731    CLIC1       6_26 4.793e-10  193.9 1.205e-12  8.873        2
11469     MSH5       6_26 1.110e-16  193.7 2.790e-19  7.592        2
12582      C4A       6_26 1.551e-11  191.8 3.859e-14  8.519        2
11732    DDAH2       6_26 0.000e+00  180.2 0.000e+00  7.661        1
11464   HSPA1L       6_26 0.000e+00  159.1 0.000e+00  7.658        1
8111    BORCS7      10_66 1.929e-08  150.4 3.762e-11  3.773        2
11458    EHMT2       6_26 0.000e+00  149.3 0.000e+00  5.405        1
13485    HCG17       6_24 3.109e-15  132.3 5.334e-18  5.533        1
849    PPP2R3A       3_84 0.000e+00  128.5 0.000e+00  4.119        1
11474   CSNK2B       6_26 1.110e-16  127.9 1.841e-19 -6.642        1
673      ZNRD1       6_24 6.230e-07  123.3 9.962e-10  5.354        2
11440     AGER       6_26 0.000e+00  116.6 0.000e+00 -7.547        1
Genes with highest PVE
        genename region_tag susie_pip   mu2       PVE      z num_eqtl
3091       SF3B1      2_117    0.8337 42.87 0.0004636  6.784        1
3016      LMAN2L       2_57    0.7583 40.87 0.0004020 -4.853        2
11135     ZNF823      19_10    0.9727 29.26 0.0003692  5.506        2
2630         MDK      11_28    0.5981 37.22 0.0002888 -6.344        1
179        NISCH       3_36    0.6556 33.67 0.0002863  6.110        1
4922     TMEM127       2_57    0.4346 47.44 0.0002674 -3.710        1
12311 AC012074.2       2_16    0.8626 23.50 0.0002629  4.623        1
13347  LINC01415      18_30    0.6226 30.27 0.0002445 -5.655        1
2684       VPS29      12_67    0.7448 24.37 0.0002354 -4.923        2
3236      MAP7D1       1_22    0.7347 24.70 0.0002354  5.058        1
110        ELAC2      17_11    0.8068 21.67 0.0002268  4.540        1
1879       ESRP2      16_36    0.6767 25.40 0.0002229  5.047        2
10494    TMEM222       1_19    0.6204 25.88 0.0002083  3.902        1
1678    KIAA0391       14_9    0.7166 22.30 0.0002073 -4.760        1
8894      ZNF318       6_33    0.6584 23.98 0.0002048 -4.832        1
4159      SPECC1      17_16    0.6420 24.40 0.0002032  4.167        1
3750     BHLHE41      12_18    0.5481 27.81 0.0001977 -3.860        1
13314    TBC1D29      17_18    0.5920 25.26 0.0001939  4.354        1
729      PPP2R5B      11_36    0.5628 24.40 0.0001781 -4.614        1
12520    HLA-DMB       6_27    0.2288 57.84 0.0001716 -7.990        1
Genes with largest z scores
          genename region_tag susie_pip     mu2       PVE      z num_eqtl
10491       BTN3A2       6_20 1.746e-02   64.58 1.462e-05  9.089        2
11478         APOM       6_26 7.091e-10  194.82 1.792e-12  8.945        1
11467         VWA7       6_26 5.093e-10  194.67 1.286e-12  8.911        1
11731        CLIC1       6_26 4.793e-10  193.88 1.205e-12  8.873        2
5119         PGBD1       6_22 6.819e-03   76.21 6.741e-06 -8.525        1
12582          C4A       6_26 1.551e-11  191.76 3.859e-14  8.519        2
6289         CNNM2      10_66 6.684e-04 2516.99 2.182e-05 -8.294        2
12520      HLA-DMB       6_27 2.288e-01   57.84 1.716e-04 -7.990        1
11444        PRRT1       6_26 0.000e+00   91.45 0.000e+00  7.907        1
11732        DDAH2       6_26 0.000e+00  180.23 0.000e+00  7.661        1
11464       HSPA1L       6_26 0.000e+00  159.14 0.000e+00  7.658        1
11469         MSH5       6_26 1.110e-16  193.74 2.790e-19  7.592        2
13068 RP11-490G2.2       1_60 1.721e-02   49.56 1.106e-05  7.551        1
11440         AGER       6_26 0.000e+00  116.58 0.000e+00 -7.547        1
7064       ZSCAN12       6_22 6.588e-03   37.55 3.208e-06  7.450        1
9628       C2orf69      2_118 3.015e-01   41.30 1.616e-04  7.234        2
11471       LY6G6C       6_26 0.000e+00  106.34 0.000e+00 -6.903        2
11792        AS3MT      10_66 2.711e-03   80.15 2.819e-06  6.876        2
7500          TYW5      2_118 4.640e-02   37.87 2.279e-05 -6.812        2
3091         SF3B1      2_117 8.337e-01   42.87 4.636e-04  6.784        1
Comparing z scores and PIPs
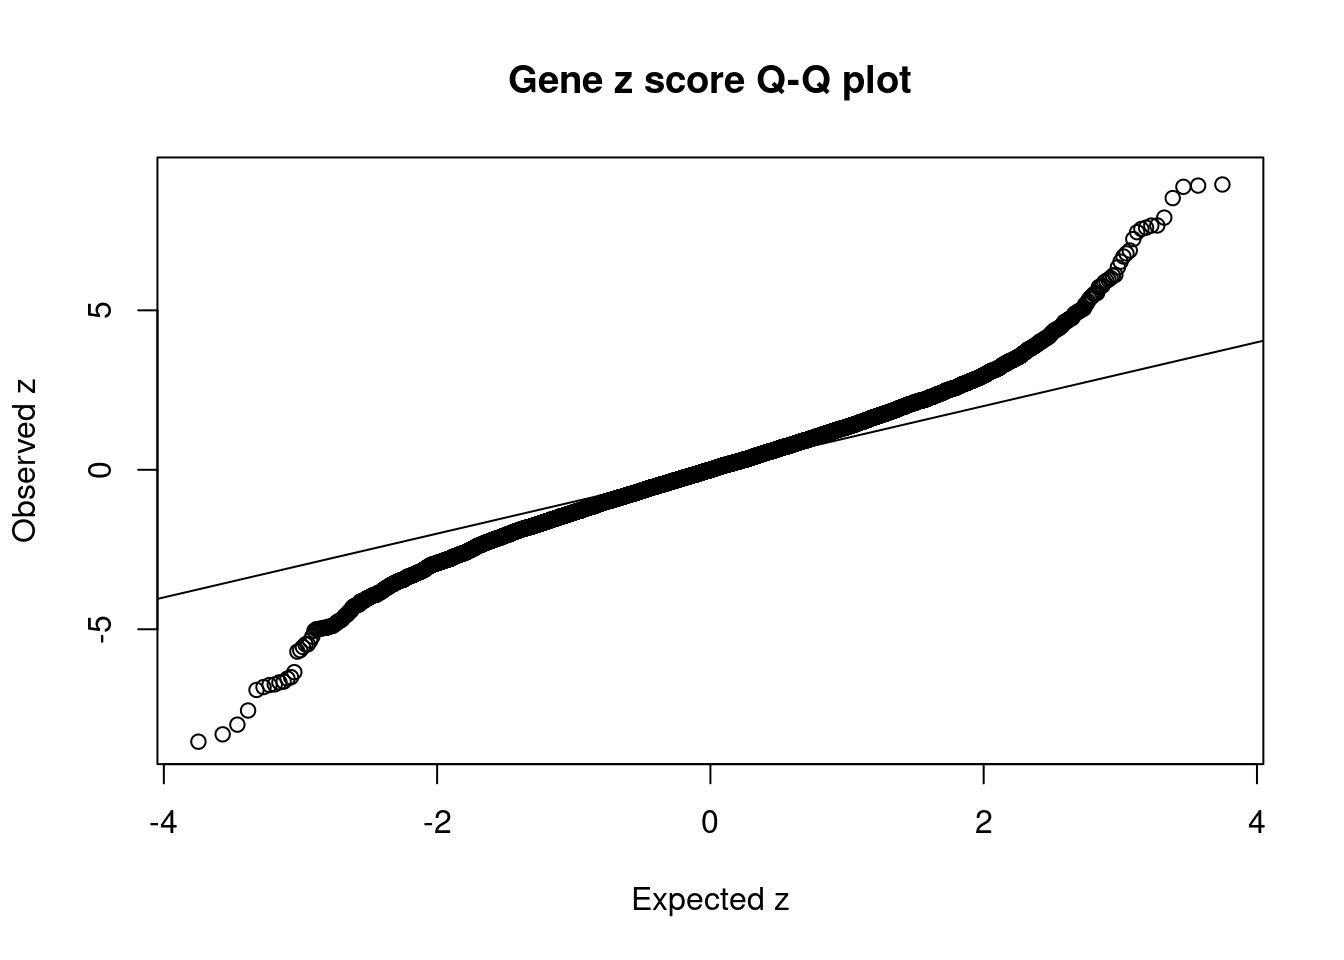
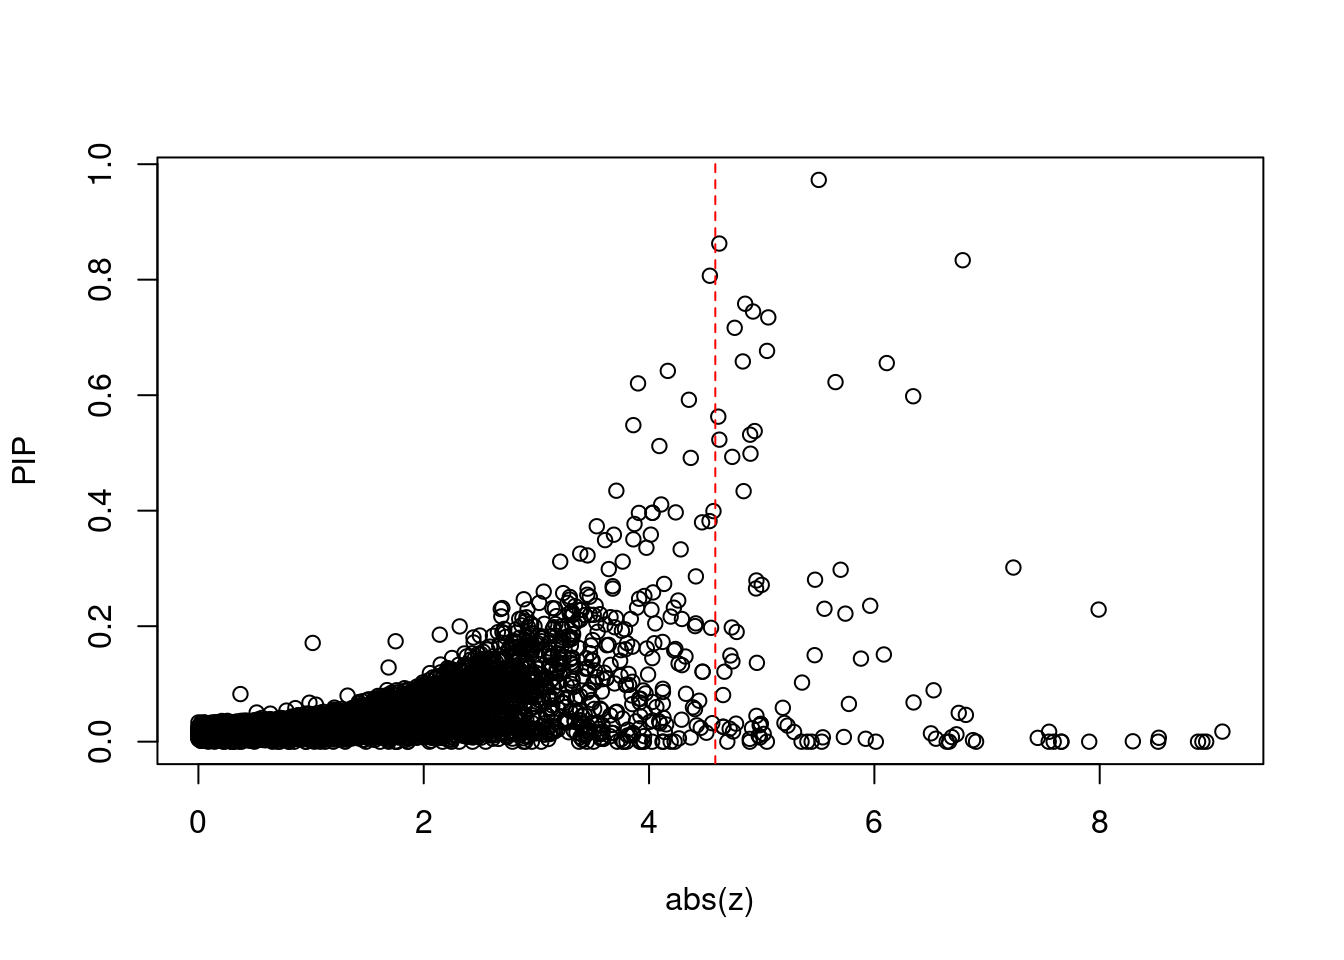
[1] 0.008588GO enrichment analysis for genes with PIP>0.5
#number of genes for gene set enrichment
length(genes)
[1] 22Uploading data to Enrichr... Done.
Querying GO_Biological_Process_2021... Done.
Querying GO_Cellular_Component_2021... Done.
Querying GO_Molecular_Function_2021... Done.
Parsing results... Done.
[1] "GO_Biological_Process_2021"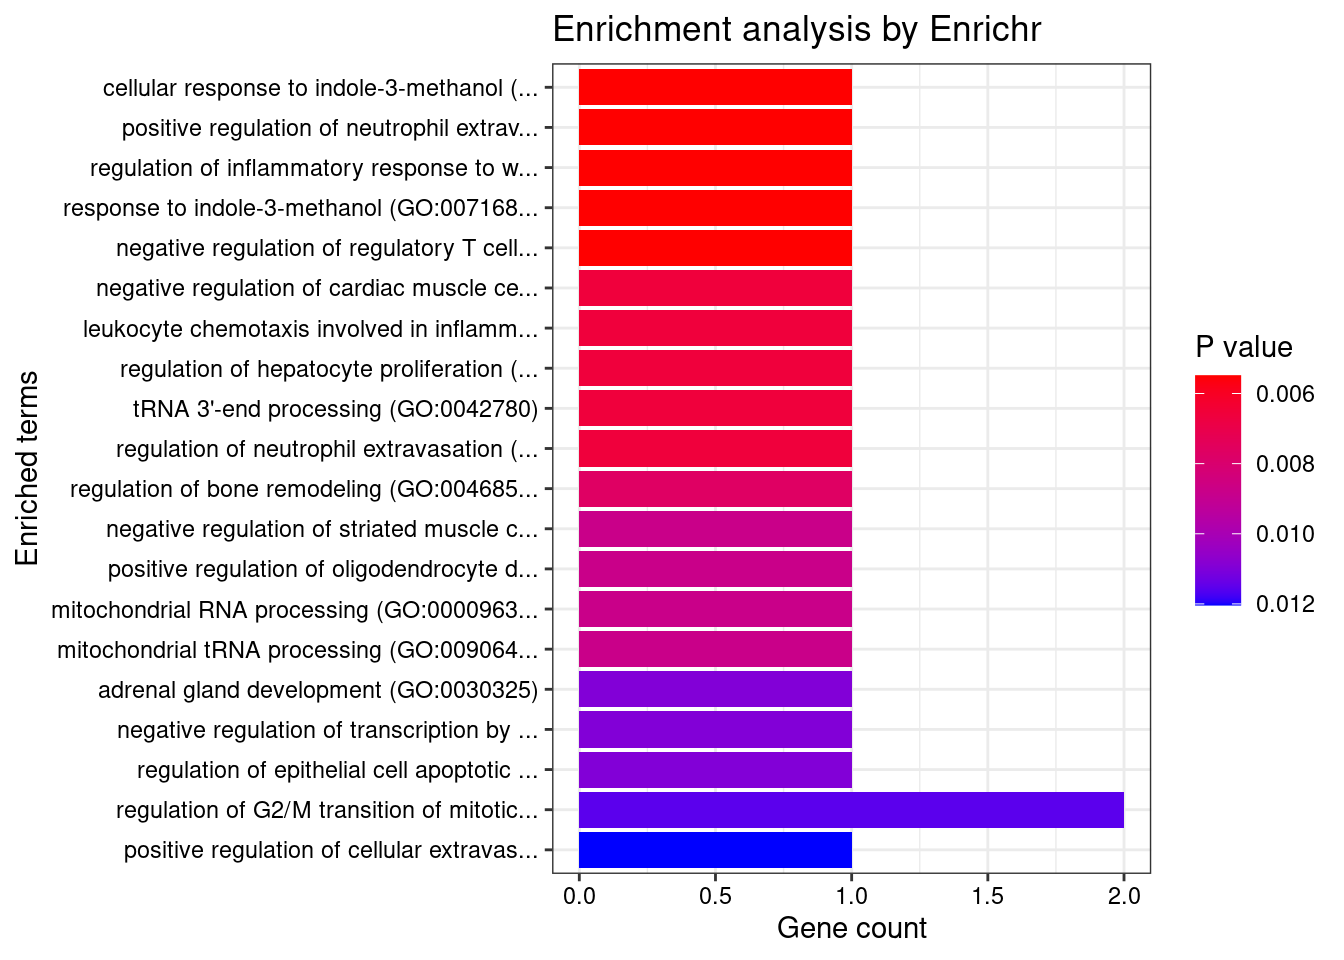
[1] Term             Overlap          Adjusted.P.value Genes
<0 rows> (or 0-length row.names)
[1] "GO_Cellular_Component_2021"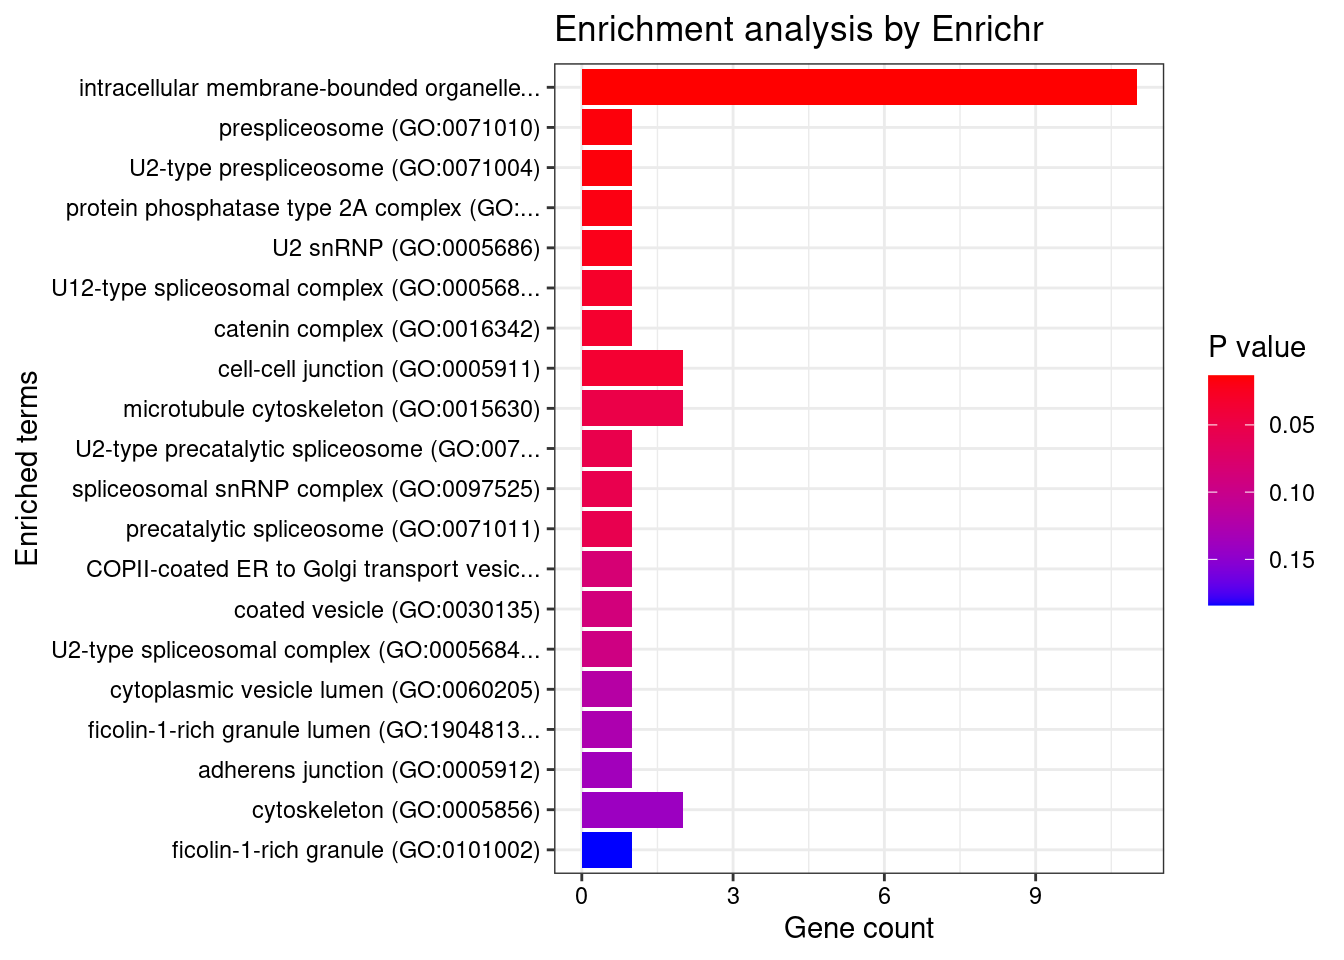
[1] Term             Overlap          Adjusted.P.value Genes
<0 rows> (or 0-length row.names)
[1] "GO_Molecular_Function_2021"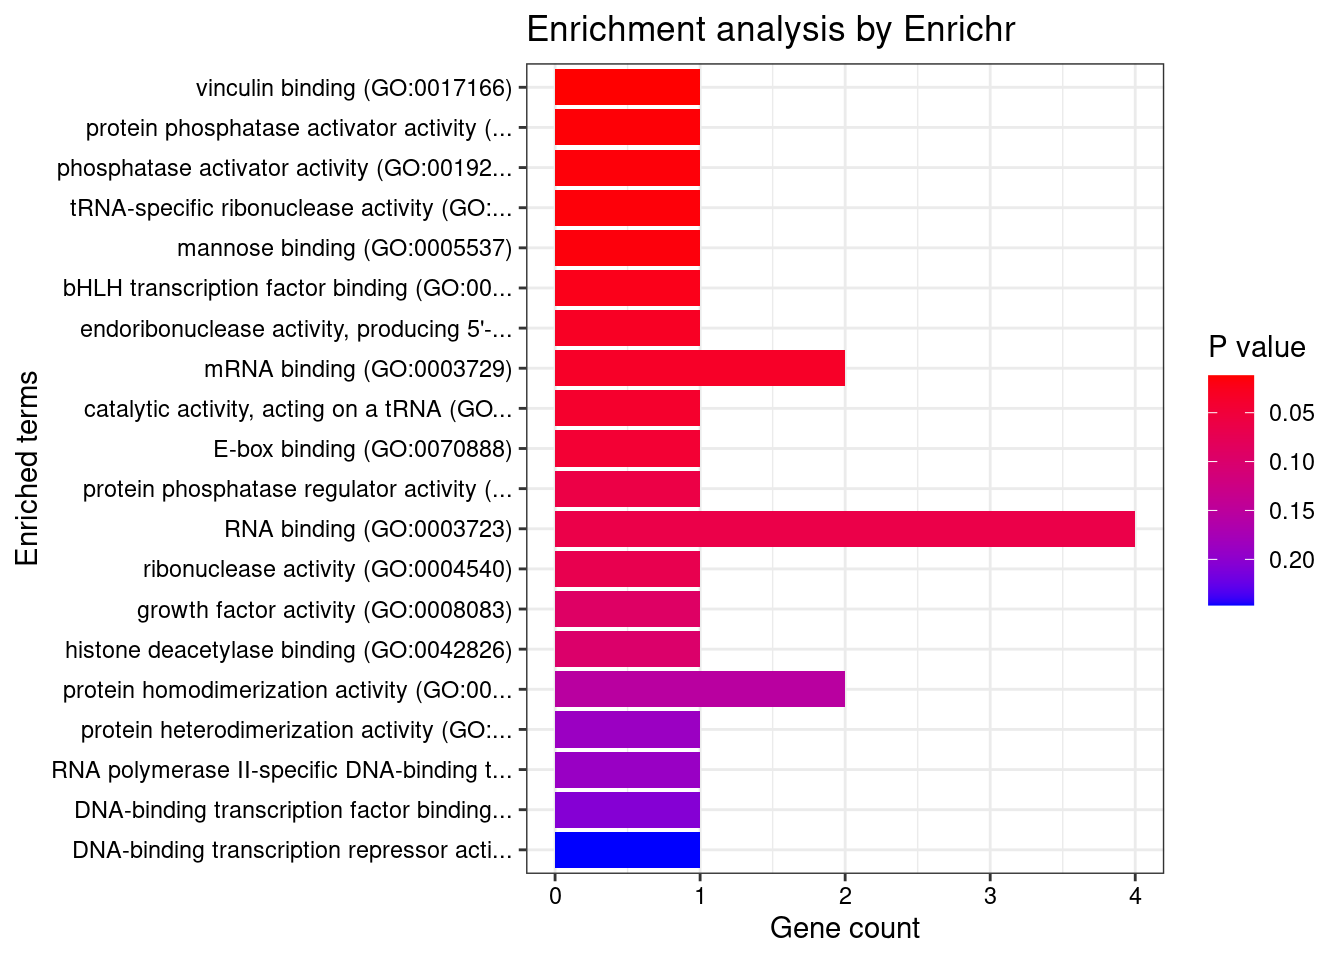
[1] Term             Overlap          Adjusted.P.value Genes
<0 rows> (or 0-length row.names)
DisGeNET enrichment analysis for genes with PIP>0.5
                                         Description     FDR Ratio BgRatio
69                       Hematopoetic Myelodysplasia 0.01426  2/10 29/9703
72                           SENIOR-LOKEN SYNDROME 7 0.01426  1/10  1/9703
75                    PROSTATE CANCER, HEREDITARY, 2 0.01426  1/10  1/9703
77  COMBINED OXIDATIVE PHOSPHORYLATION DEFICIENCY 17 0.01426  1/10  1/9703
78                          BARDET-BIEDL SYNDROME 16 0.01426  1/10  1/9703
80        MENTAL RETARDATION, AUTOSOMAL RECESSIVE 52 0.01426  1/10  1/9703
54        Refractory anemia with ringed sideroblasts 0.02138  1/10  2/9703
74                          MYELODYSPLASTIC SYNDROME 0.02138  2/10 67/9703
65 Macular Dystrophy, Butterfly-Shaped Pigmentary, 2 0.02331  1/10  3/9703
67 Patterned dystrophy of retinal pigment epithelium 0.02331  1/10  3/9703
WebGestalt enrichment analysis for genes with PIP>0.5
Loading the functional categories...
Loading the ID list...
Loading the reference list...
Performing the enrichment analysis...
Warning in oraEnrichment(interestGeneList, referenceGeneList, geneSet, minNum =
minNum, : No significant gene set is identified based on FDR 0.05!NULLPIP Manhattan Plot
Warning: 'timedatectl' indicates the non-existent timezone name 'n/a'Warning: Your system is mis-configured: '/etc/localtime' is not a symlinkWarning: It is strongly recommended to set envionment variable TZ to 'America/
Chicago' (or equivalent)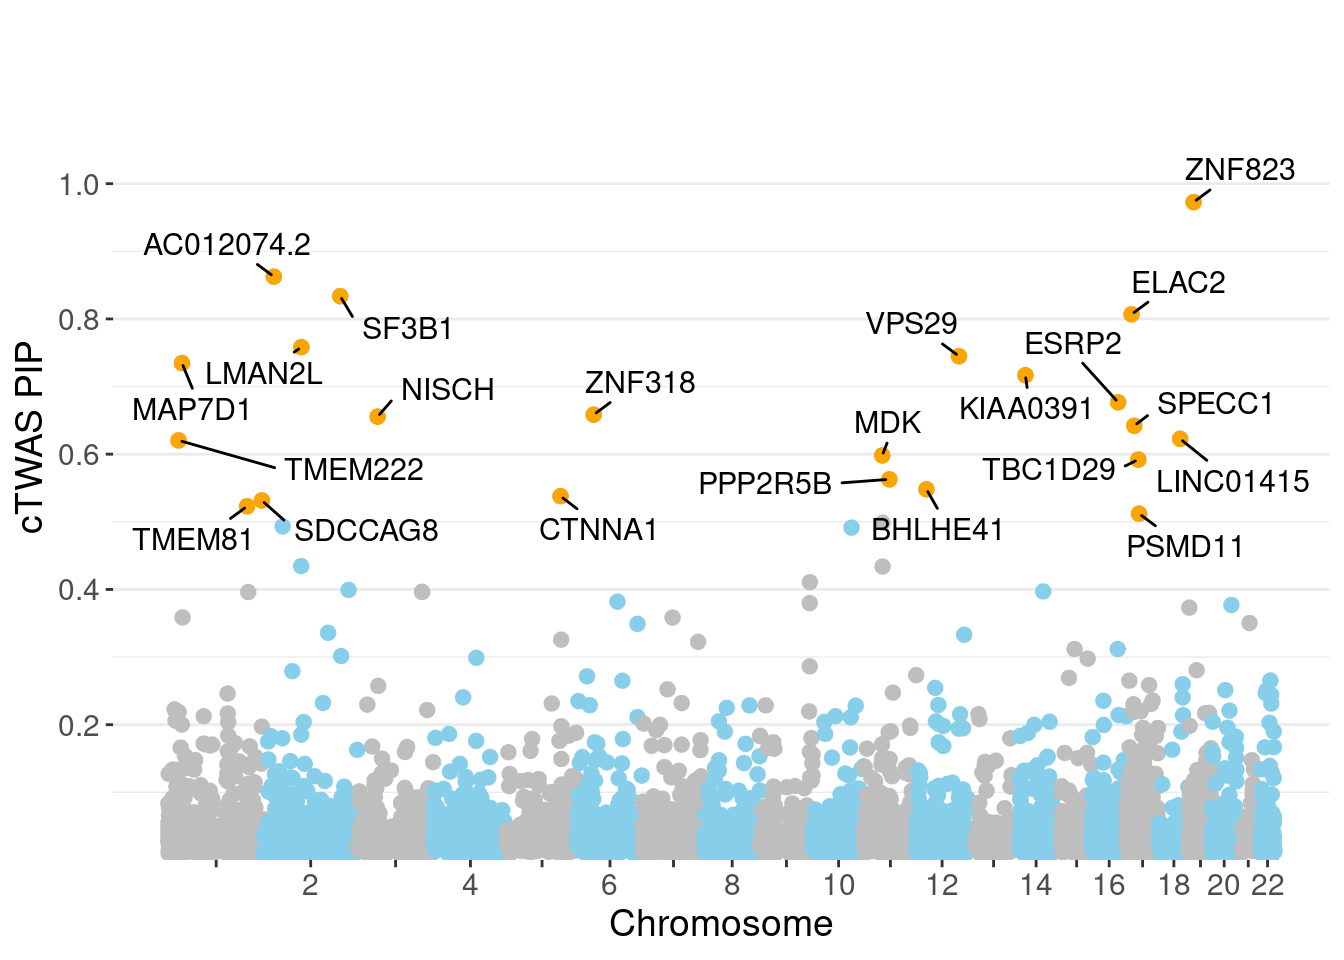
Sensitivity, specificity and precision for silver standard genes
#number of genes in known annotations
print(length(known_annotations))
[1] 130#number of genes in known annotations with imputed expression
print(sum(known_annotations %in% ctwas_gene_res$genename))[1] 64#significance threshold for TWAS
print(sig_thresh)[1] 4.588#number of ctwas genes
length(ctwas_genes)[1] 4#number of TWAS genes
length(twas_genes)[1] 96#show novel genes (ctwas genes with not in TWAS genes)
ctwas_gene_res[ctwas_gene_res$genename %in% novel_genes,report_cols] genename region_tag susie_pip mu2 PVE z num_eqtl
110 ELAC2 17_11 0.8068 21.67 0.0002268 4.54 1#sensitivity / recall
print(sensitivity) ctwas TWAS
0.02308 0.08462 #specificity
print(specificity) ctwas TWAS
0.9999 0.9924 #precision / PPV
print(precision) ctwas TWAS
0.7500 0.1146 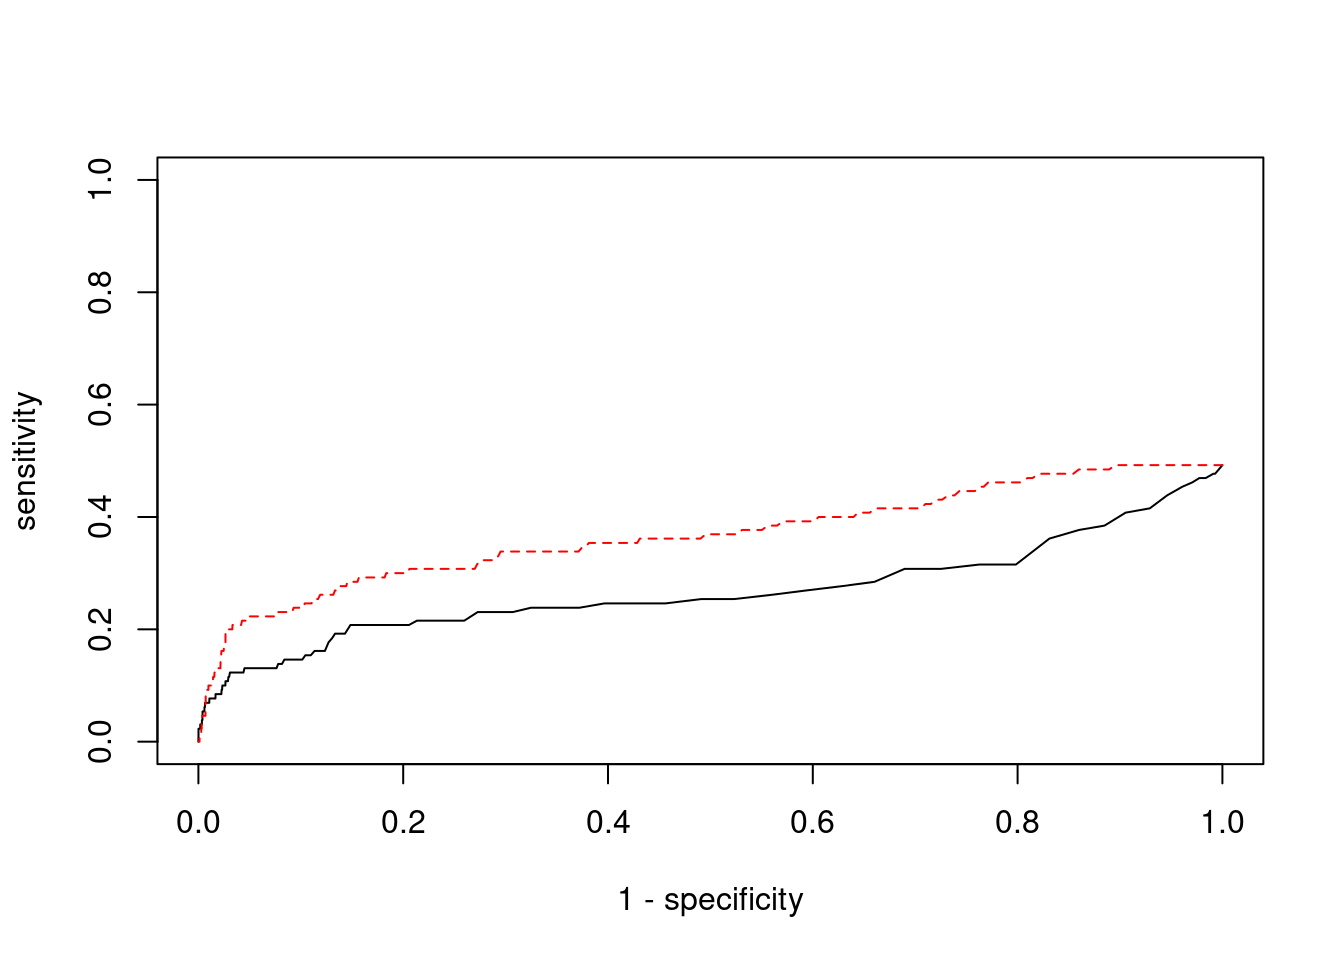
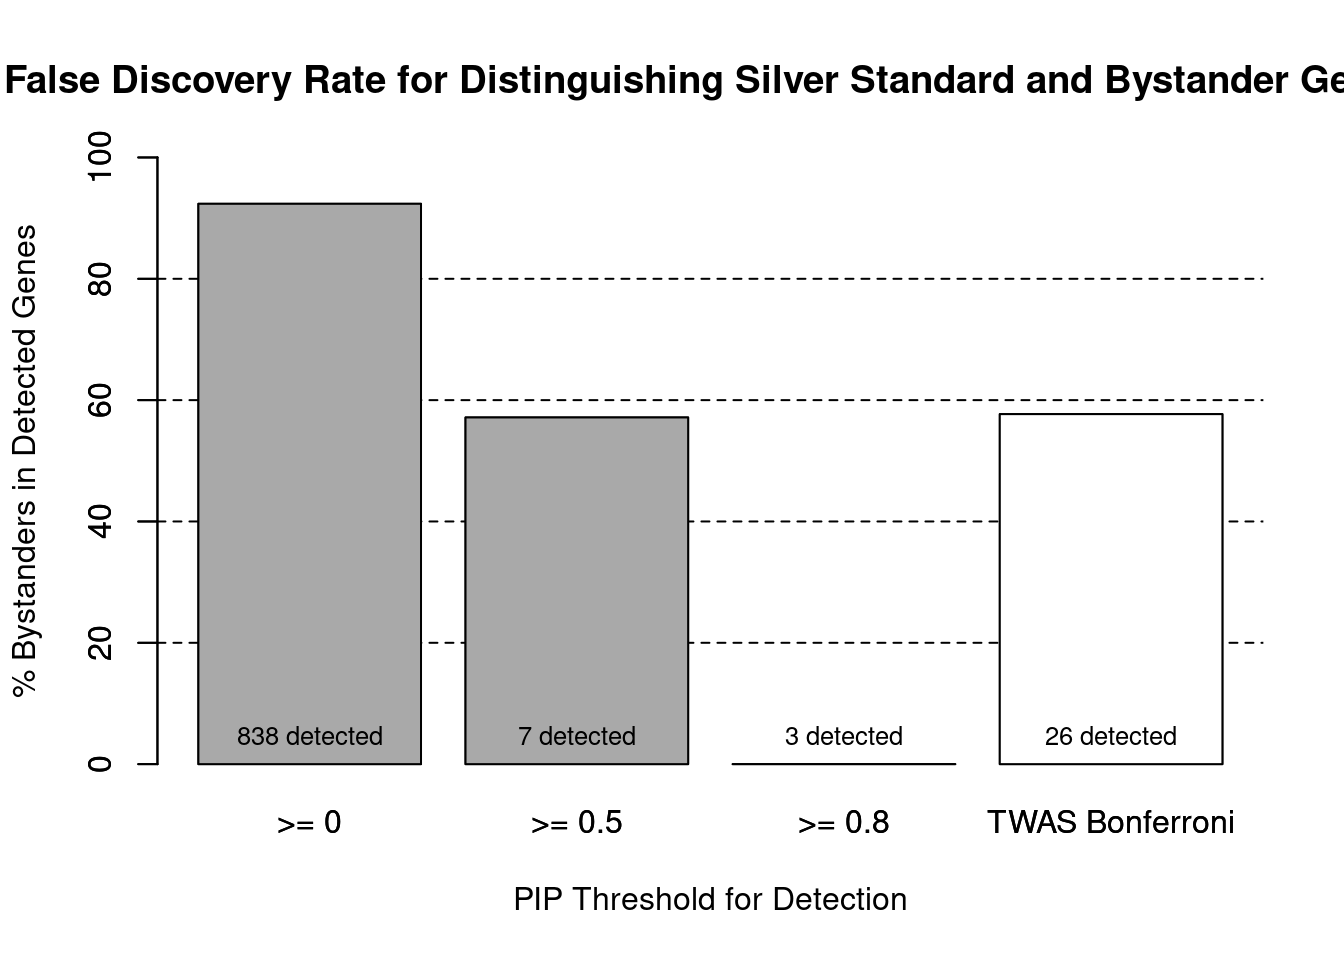
cTWAS is more precise than TWAS in distinguishing silver standard and bystander genes
#number of genes in known annotations (with imputed expression)
print(length(known_annotations))[1] 64#number of bystander genes (with imputed expression)
print(length(unrelated_genes))[1] 774#subset results to genes in known annotations or bystanders
ctwas_gene_res_subset <- ctwas_gene_res[ctwas_gene_res$genename %in% c(known_annotations, unrelated_genes),]
#assign ctwas and TWAS genes
ctwas_genes <- ctwas_gene_res_subset$genename[ctwas_gene_res_subset$susie_pip>0.8]
twas_genes <- ctwas_gene_res_subset$genename[abs(ctwas_gene_res_subset$z)>sig_thresh]
#significance threshold for TWAS
print(sig_thresh)
[1] 4.588#number of ctwas genes (in known annotations or bystanders)
length(ctwas_genes)[1] 3#number of TWAS genes (in known annotations or bystanders)
length(twas_genes)[1] 26#sensitivity / recall
sensitivity ctwas TWAS
0.04688 0.17188 #specificity / (1 - False Positive Rate)
specificity ctwas TWAS
1.0000 0.9806 #precision / PPV / (1 - False Discovery Rate)
precision ctwas TWAS
1.0000 0.4231 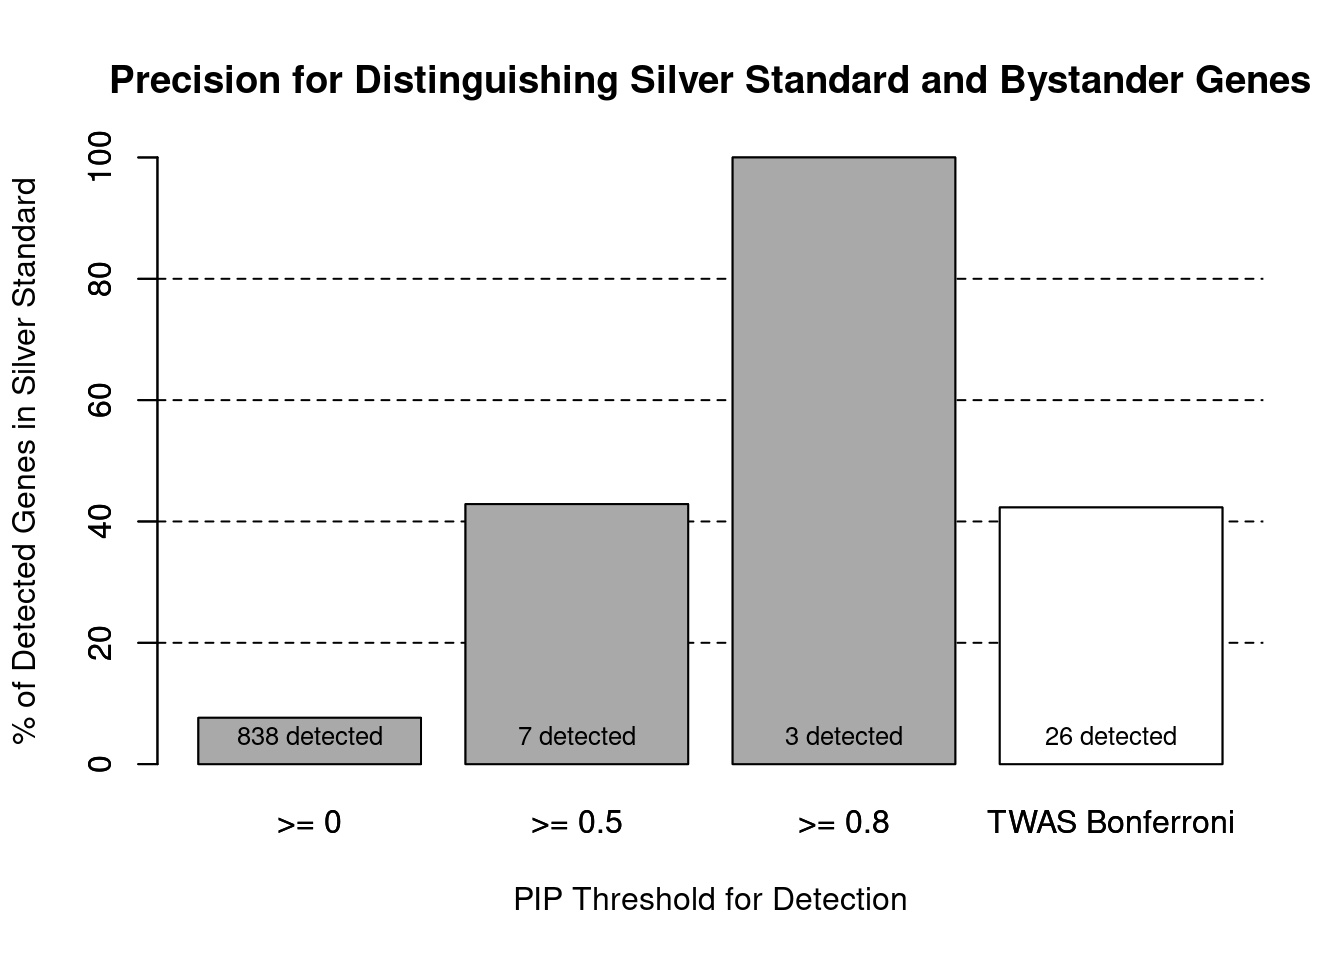
pip_range <- (0:1000)/1000
sensitivity <- rep(NA, length(pip_range))
specificity <- rep(NA, length(pip_range))

for (index in 1:length(pip_range)){
  pip <- pip_range[index]
  ctwas_genes <- ctwas_gene_res_subset$genename[ctwas_gene_res_subset$susie_pip>=pip]
  sensitivity[index] <- sum(ctwas_genes %in% known_annotations)/length(known_annotations)
  specificity[index] <- sum(!(unrelated_genes %in% ctwas_genes))/length(unrelated_genes)
}

plot(1-specificity, sensitivity, type="l", xlim=c(0,1), ylim=c(0,1), main="", xlab="1 - Specificity", ylab="Sensitivity")
title(expression("ROC Curve for cTWAS (black) and TWAS (" * phantom("red") * ")"))
title(expression(phantom("ROC Curve for cTWAS (black) and TWAS (") * "red" * phantom(")")), col.main="red")

sig_thresh_range <- seq(from=0, to=max(abs(ctwas_gene_res_subset$z)), length.out=length(pip_range))

for (index in 1:length(sig_thresh_range)){
  sig_thresh_plot <- sig_thresh_range[index]
  twas_genes <- ctwas_gene_res_subset$genename[abs(ctwas_gene_res_subset$z)>=sig_thresh_plot]
  sensitivity[index] <- sum(twas_genes %in% known_annotations)/length(known_annotations)
  specificity[index] <- sum(!(unrelated_genes %in% twas_genes))/length(unrelated_genes)
}

lines(1-specificity, sensitivity, xlim=c(0,1), ylim=c(0,1), col="red", lty=1)

abline(a=0,b=1,lty=3)

#add previously computed points from the analysis
ctwas_genes <- ctwas_gene_res_subset$genename[ctwas_gene_res_subset$susie_pip>0.8]
twas_genes <- ctwas_gene_res_subset$genename[abs(ctwas_gene_res_subset$z)>sig_thresh]

points(1-specificity_plot["ctwas"], sensitivity_plot["ctwas"], pch=21, bg="black")
points(1-specificity_plot["TWAS"], sensitivity_plot["TWAS"], pch=21, bg="red")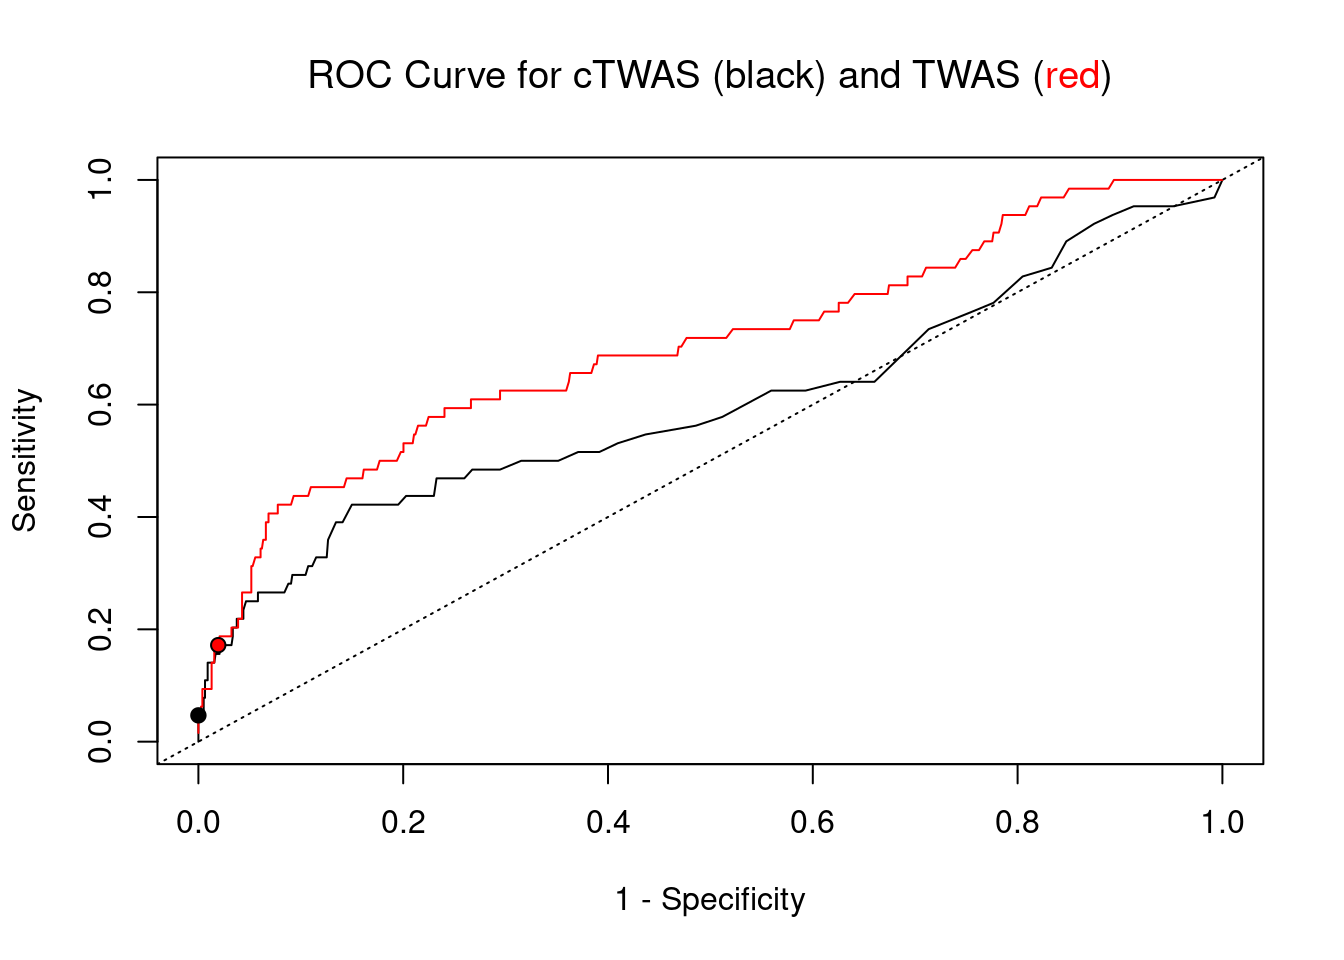
Undetected silver standard genes have low TWAS z-scores or stronger signal from nearby variants
#table of outcomes for silver standard genes
-sort(-table(silver_standard_case))
silver_standard_case
Not Imputed Insignificant z-score Nearby SNP(s)
66 52 9
Detected (PIP > 0.8)
3 #show inconclusive genes
silver_standard_case[silver_standard_case=="Inconclusive"]named character(0)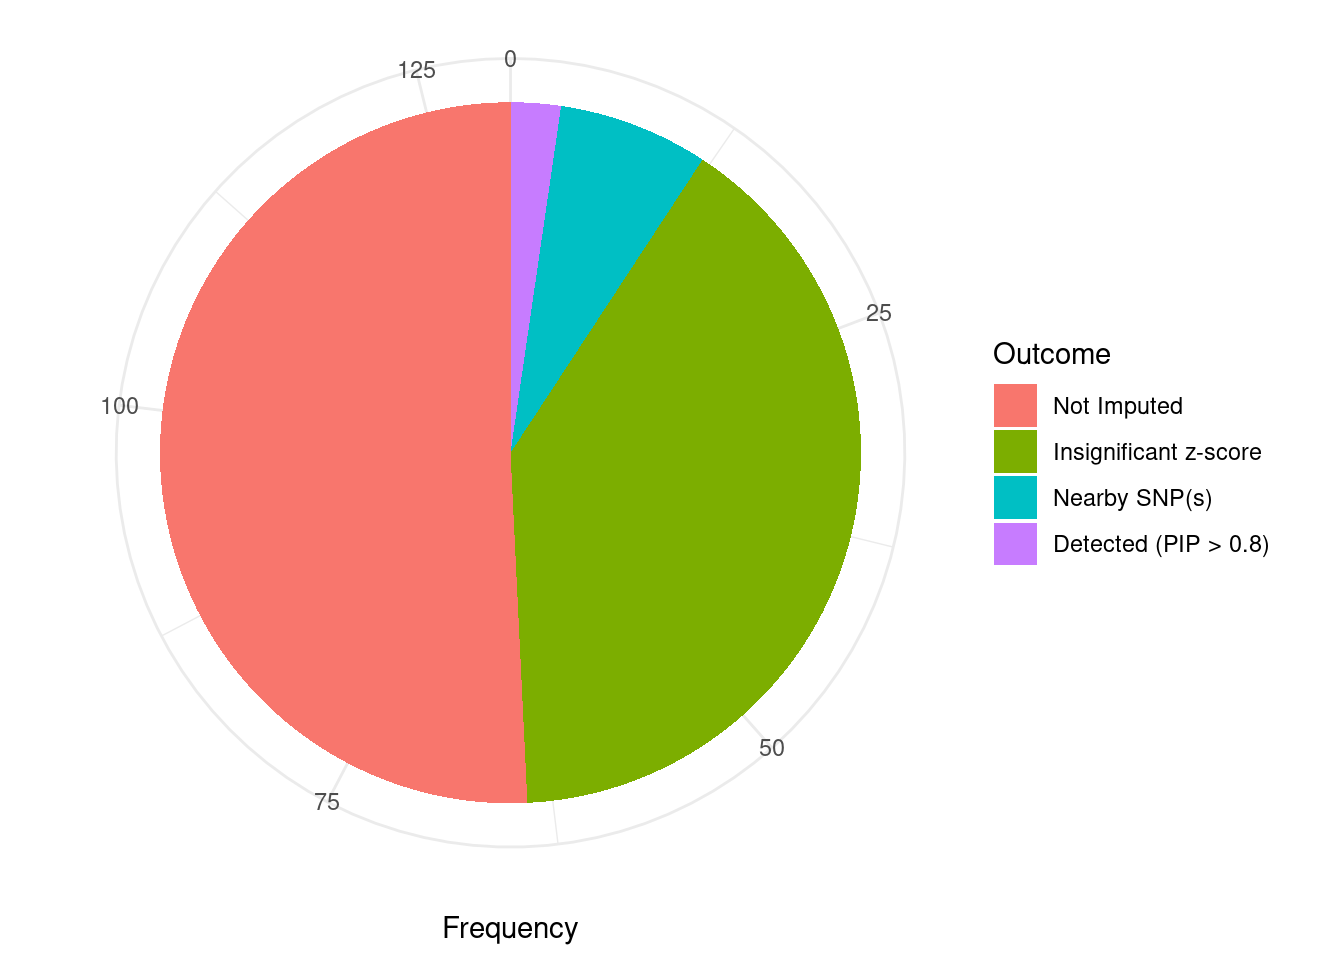
sessionInfo()R version 3.6.1 (2019-07-05)
Platform: x86_64-pc-linux-gnu (64-bit)
Running under: Scientific Linux 7.4 (Nitrogen)
Matrix products: default
BLAS/LAPACK: /software/openblas-0.2.19-el7-x86_64/lib/libopenblas_haswellp-r0.2.19.so
locale:
[1] LC_CTYPE=en_US.UTF-8 LC_NUMERIC=C
[3] LC_TIME=en_US.UTF-8 LC_COLLATE=en_US.UTF-8
[5] LC_MONETARY=en_US.UTF-8 LC_MESSAGES=en_US.UTF-8
[7] LC_PAPER=en_US.UTF-8 LC_NAME=C
[9] LC_ADDRESS=C LC_TELEPHONE=C
[11] LC_MEASUREMENT=en_US.UTF-8 LC_IDENTIFICATION=C
attached base packages:
[1] parallel stats4 stats graphics grDevices utils datasets
[8] methods base
other attached packages:
[1] GenomicRanges_1.36.1 GenomeInfoDb_1.20.0 IRanges_2.18.1
[4] S4Vectors_0.22.1 BiocGenerics_0.30.0 biomaRt_2.40.1
[7] readxl_1.3.1 forcats_0.5.1 stringr_1.4.0
[10] dplyr_1.0.7 purrr_0.3.4 readr_2.1.1
[13] tidyr_1.1.4 tidyverse_1.3.1 tibble_3.1.6
[16] WebGestaltR_0.4.4 disgenet2r_0.99.2 enrichR_3.0
[19] cowplot_1.0.0 ggplot2_3.3.5 workflowr_1.7.0
loaded via a namespace (and not attached):
[1] ggbeeswarm_0.6.0 colorspace_2.0-2 rjson_0.2.20
[4] ellipsis_0.3.2 rprojroot_2.0.2 XVector_0.24.0
[7] fs_1.5.2 rstudioapi_0.13 farver_2.1.0
[10] ggrepel_0.9.1 bit64_4.0.5 AnnotationDbi_1.46.0
[13] fansi_1.0.2 lubridate_1.8.0 xml2_1.3.3
[16] codetools_0.2-16 doParallel_1.0.17 cachem_1.0.6
[19] knitr_1.36 jsonlite_1.7.2 apcluster_1.4.8
[22] Cairo_1.5-12.2 broom_0.7.10 dbplyr_2.1.1
[25] compiler_3.6.1 httr_1.4.2 backports_1.4.1
[28] assertthat_0.2.1 Matrix_1.2-18 fastmap_1.1.0
[31] cli_3.1.0 later_0.8.0 prettyunits_1.1.1
[34] htmltools_0.5.2 tools_3.6.1 igraph_1.2.10
[37] GenomeInfoDbData_1.2.1 gtable_0.3.0 glue_1.6.2
[40] reshape2_1.4.4 doRNG_1.8.2 Rcpp_1.0.8
[43] Biobase_2.44.0 cellranger_1.1.0 jquerylib_0.1.4
[46] vctrs_0.3.8 svglite_1.2.2 iterators_1.0.14
[49] xfun_0.29 ps_1.6.0 rvest_1.0.2
[52] lifecycle_1.0.1 rngtools_1.5.2 XML_3.99-0.3
[55] zlibbioc_1.30.0 getPass_0.2-2 scales_1.1.1
[58] vroom_1.5.7 hms_1.1.1 promises_1.0.1
[61] yaml_2.2.1 curl_4.3.2 memoise_2.0.1
[64] ggrastr_1.0.1 gdtools_0.1.9 stringi_1.7.6
[67] RSQLite_2.2.8 highr_0.9 foreach_1.5.2
[70] rlang_1.0.1 pkgconfig_2.0.3 bitops_1.0-7
[73] evaluate_0.14 lattice_0.20-38 labeling_0.4.2
[76] bit_4.0.4 processx_3.5.2 tidyselect_1.1.1
[79] plyr_1.8.6 magrittr_2.0.2 R6_2.5.1
[82] generics_0.1.1 DBI_1.1.2 pillar_1.6.4
[85] haven_2.4.3 whisker_0.3-2 withr_2.4.3
[88] RCurl_1.98-1.5 modelr_0.1.8 crayon_1.5.0
[91] utf8_1.2.2 tzdb_0.2.0 rmarkdown_2.11
[94] progress_1.2.2 grid_3.6.1 data.table_1.14.2
[97] blob_1.2.2 callr_3.7.0 git2r_0.26.1
[100] reprex_2.0.1 digest_0.6.29 httpuv_1.5.1
[103] munsell_0.5.0 beeswarm_0.2.3 vipor_0.4.5