SCZ - Brain Cortex
sheng Qian
2021-2-6
Last updated: 2022-03-14
Checks: 5 2
Knit directory: cTWAS_analysis/
This reproducible R Markdown analysis was created with workflowr (version 1.7.0). The Checks tab describes the reproducibility checks that were applied when the results were created. The Past versions tab lists the development history.
The R Markdown is untracked by Git. To know which version of the R Markdown file created these results, you’ll want to first commit it to the Git repo. If you’re still working on the analysis, you can ignore this warning. When you’re finished, you can run wflow_publish to commit the R Markdown file and build the HTML.
Great job! The global environment was empty. Objects defined in the global environment can affect the analysis in your R Markdown file in unknown ways. For reproduciblity it’s best to always run the code in an empty environment.
The command set.seed(20211220) was run prior to running the code in the R Markdown file. Setting a seed ensures that any results that rely on randomness, e.g. subsampling or permutations, are reproducible.
Great job! Recording the operating system, R version, and package versions is critical for reproducibility.
Nice! There were no cached chunks for this analysis, so you can be confident that you successfully produced the results during this run.
Using absolute paths to the files within your workflowr project makes it difficult for you and others to run your code on a different machine. Change the absolute path(s) below to the suggested relative path(s) to make your code more reproducible.
| absolute | relative |
|---|---|
| /project2/xinhe/shengqian/cTWAS/cTWAS_analysis/data/ | data |
| /project2/xinhe/shengqian/cTWAS/cTWAS_analysis/code/ctwas_config.R | code/ctwas_config.R |
Great! You are using Git for version control. Tracking code development and connecting the code version to the results is critical for reproducibility.
The results in this page were generated with repository version 4c71b11. See the Past versions tab to see a history of the changes made to the R Markdown and HTML files.
Note that you need to be careful to ensure that all relevant files for the analysis have been committed to Git prior to generating the results (you can use wflow_publish or wflow_git_commit). workflowr only checks the R Markdown file, but you know if there are other scripts or data files that it depends on. Below is the status of the Git repository when the results were generated:
Ignored files:
    Ignored:    .ipynb_checkpoints/
    Ignored:    data/AF/

Untracked files:
    Untracked:  Rplot.png
    Untracked:  analysis/.ipynb_checkpoints/
    Untracked:  analysis/SCZ_2014_EUR_Brain_Amygdala.Rmd
    Untracked:  analysis/SCZ_2014_EUR_Brain_Anterior_cingulate_cortex_BA24.Rmd
    Untracked:  analysis/SCZ_2014_EUR_Brain_Caudate_basal_ganglia.Rmd
    Untracked:  analysis/SCZ_2014_EUR_Brain_Cerebellar_Hemisphere.Rmd
    Untracked:  analysis/SCZ_2014_EUR_Brain_Cerebellum.Rmd
    Untracked:  analysis/SCZ_2014_EUR_Brain_Cortex.Rmd
    Untracked:  analysis/SCZ_2014_EUR_Brain_Frontal_Cortex_BA9.Rmd
    Untracked:  analysis/SCZ_2014_EUR_Brain_Hippocampus.Rmd
    Untracked:  analysis/SCZ_2014_EUR_Brain_Hypothalamus.Rmd
    Untracked:  analysis/SCZ_2014_EUR_Brain_Nucleus_accumbens_basal_ganglia.Rmd
    Untracked:  analysis/SCZ_2014_EUR_Brain_Putamen_basal_ganglia.Rmd
    Untracked:  analysis/SCZ_2014_EUR_Brain_Spinal_cord_cervical_c-1.Rmd
    Untracked:  analysis/SCZ_2014_EUR_Brain_Substantia_nigra.Rmd
    Untracked:  analysis/SCZ_2020_Brain_Cortex.Rmd
    Untracked:  analysis/SCZ_2020_Brain_Frontal_Cortex_BA9.Rmd
    Untracked:  analysis/SCZ_2020_Brain_Hypothalamus.Rmd
    Untracked:  analysis/SCZ_2020_Brain_Putamen_basal_ganglia.Rmd
    Untracked:  analysis/SCZ_Cross_Tissue_Analysis.Rmd
    Untracked:  code/.ipynb_checkpoints/
    Untracked:  code/AF_out/
    Untracked:  code/Autism_out/
    Untracked:  code/BMI_S_out/
    Untracked:  code/BMI_out/
    Untracked:  code/Glucose_out/
    Untracked:  code/LDL_S_out/
    Untracked:  code/SCZ_2014_EUR_out/
    Untracked:  code/SCZ_2020_out/
    Untracked:  code/SCZ_S_out/
    Untracked:  code/SCZ_out/
    Untracked:  code/T2D_out/
    Untracked:  code/ctwas_config.R
    Untracked:  code/mapping.R
    Untracked:  code/out/
    Untracked:  code/run_AF_analysis.sbatch
    Untracked:  code/run_AF_analysis.sh
    Untracked:  code/run_AF_ctwas_rss_LDR.R
    Untracked:  code/run_Autism_analysis.sbatch
    Untracked:  code/run_Autism_analysis.sh
    Untracked:  code/run_Autism_ctwas_rss_LDR.R
    Untracked:  code/run_BMI_analysis.sbatch
    Untracked:  code/run_BMI_analysis.sh
    Untracked:  code/run_BMI_analysis_S.sbatch
    Untracked:  code/run_BMI_analysis_S.sh
    Untracked:  code/run_BMI_ctwas_rss_LDR.R
    Untracked:  code/run_BMI_ctwas_rss_LDR_S.R
    Untracked:  code/run_Glucose_analysis.sbatch
    Untracked:  code/run_Glucose_analysis.sh
    Untracked:  code/run_Glucose_ctwas_rss_LDR.R
    Untracked:  code/run_LDL_analysis_S.sbatch
    Untracked:  code/run_LDL_analysis_S.sh
    Untracked:  code/run_LDL_ctwas_rss_LDR_S.R
    Untracked:  code/run_SCZ_2014_EUR_analysis.sbatch
    Untracked:  code/run_SCZ_2014_EUR_analysis.sh
    Untracked:  code/run_SCZ_2014_EUR_ctwas_rss_LDR.R
    Untracked:  code/run_SCZ_2020_analysis.sbatch
    Untracked:  code/run_SCZ_2020_analysis.sh
    Untracked:  code/run_SCZ_2020_ctwas_rss_LDR.R
    Untracked:  code/run_SCZ_analysis.sbatch
    Untracked:  code/run_SCZ_analysis.sh
    Untracked:  code/run_SCZ_analysis_S.sbatch
    Untracked:  code/run_SCZ_analysis_S.sh
    Untracked:  code/run_SCZ_ctwas_rss_LDR.R
    Untracked:  code/run_SCZ_ctwas_rss_LDR_S.R
    Untracked:  code/run_T2D_analysis.sbatch
    Untracked:  code/run_T2D_analysis.sh
    Untracked:  code/run_T2D_ctwas_rss_LDR.R
    Untracked:  code/wflow_build.R
    Untracked:  code/wflow_build.sbatch
    Untracked:  data/.ipynb_checkpoints/
    Untracked:  data/BMI/
    Untracked:  data/PGC3_SCZ_wave3_public.v2.tsv
    Untracked:  data/SCZ/
    Untracked:  data/SCZ_2014_EUR/
    Untracked:  data/SCZ_2020/
    Untracked:  data/SCZ_S/
    Untracked:  data/T2D/
    Untracked:  data/UKBB/
    Untracked:  data/UKBB_SNPs_Info.text
    Untracked:  data/gene_OMIM.txt
    Untracked:  data/gene_pip_0.8.txt
    Untracked:  data/mashr_Heart_Atrial_Appendage.db
    Untracked:  data/mashr_sqtl/
    Untracked:  data/summary_known_genes_annotations.xlsx
    Untracked:  data/untitled.txt

Unstaged changes:
    Modified:   analysis/SCZ_Brain_Amygdala.Rmd
    Modified:   analysis/SCZ_Brain_Anterior_cingulate_cortex_BA24.Rmd
    Modified:   analysis/SCZ_Brain_Caudate_basal_ganglia.Rmd
    Modified:   analysis/SCZ_Brain_Cerebellar_Hemisphere.Rmd
    Modified:   analysis/SCZ_Brain_Cerebellum.Rmd
    Modified:   analysis/SCZ_Brain_Cortex.Rmd
    Modified:   analysis/SCZ_Brain_Frontal_Cortex_BA9.Rmd
    Modified:   analysis/SCZ_Brain_Hippocampus.Rmd
    Modified:   analysis/SCZ_Brain_Hypothalamus.Rmd
    Modified:   analysis/SCZ_Brain_Nucleus_accumbens_basal_ganglia.Rmd
    Modified:   analysis/SCZ_Brain_Putamen_basal_ganglia.Rmd
    Modified:   analysis/SCZ_Brain_Spinal_cord_cervical_c-1.Rmd
    Modified:   analysis/SCZ_Brain_Substantia_nigra.Rmd
Note that any generated files, e.g. HTML, png, CSS, etc., are not included in this status report because it is ok for generated content to have uncommitted changes.
There are no past versions. Publish this analysis with wflow_publish() to start tracking its development.
Weight QC
#number of imputed weights
nrow(qclist_all)
[1] 11379#number of imputed weights by chromosome
table(qclist_all$chr)
   1    2    3    4    5    6    7    8    9   10   11   12   13   14   15   16
1142  801  644  426  537  655  549  427  432  458  680  647  221  367  377  522
  17   18   19   20   21   22
 695  179  851  353  123  293
#number of imputed weights without missing variants
sum(qclist_all$nmiss==0)[1] 8519#proportion of imputed weights without missing variants
mean(qclist_all$nmiss==0)[1] 0.7487Check convergence of parameters
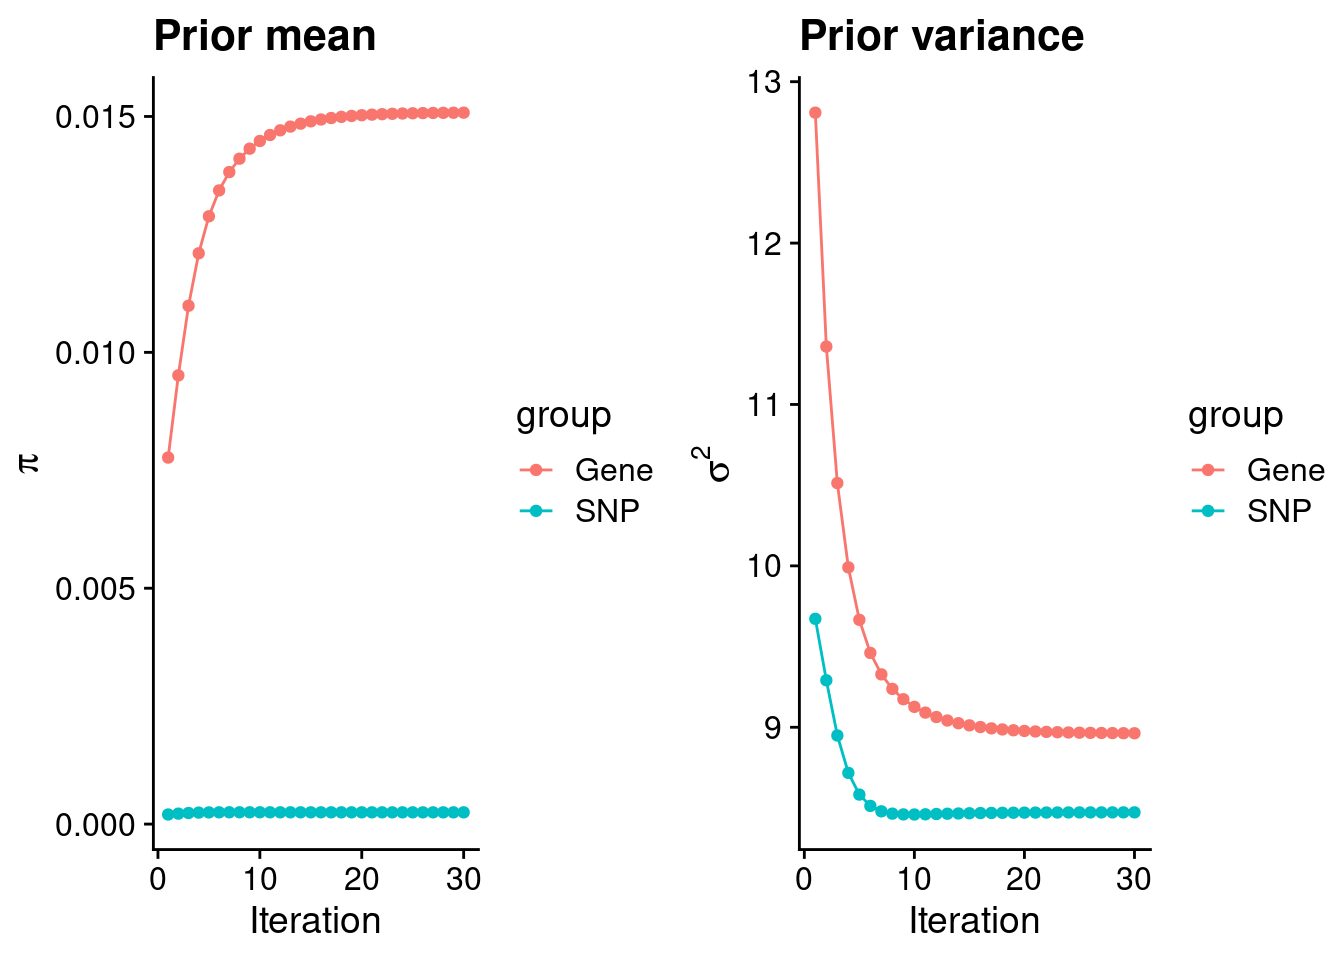
#estimated group prior
estimated_group_prior <- group_prior_rec[,ncol(group_prior_rec)]
names(estimated_group_prior) <- c("gene", "snp")
estimated_group_prior["snp"] <- estimated_group_prior["snp"]*thin #adjust parameter to account for thin argument
print(estimated_group_prior)
gene snp
0.0150804 0.0002497 #estimated group prior variance
estimated_group_prior_var <- group_prior_var_rec[,ncol(group_prior_var_rec)]
names(estimated_group_prior_var) <- c("gene", "snp")
print(estimated_group_prior_var) gene snp
8.963 8.473 #report sample size
print(sample_size)[1] 77096#report group size
group_size <- c(nrow(ctwas_gene_res), n_snps)
print(group_size)[1] 11379 7352670#estimated group PVE
estimated_group_pve <- estimated_group_prior_var*estimated_group_prior*group_size/sample_size #check PVE calculation
names(estimated_group_pve) <- c("gene", "snp")
print(estimated_group_pve) gene snp
0.01995 0.20174 #compare sum(PIP*mu2/sample_size) with above PVE calculation
c(sum(ctwas_gene_res$PVE),sum(ctwas_snp_res$PVE))[1] 0.1379 1.7253Genes with highest PIPs

          genename region_tag susie_pip     mu2       PVE      z num_eqtl
958          NT5C2      10_66    0.9990 2876.64 0.0372745 -8.190        1
1518          DDTL       22_6    0.9987   32.10 0.0004159 -3.206        2
11314       ZNF823      19_10    0.9889   29.71 0.0003811  5.560        2
13518    LINC01415      18_30    0.9807   42.34 0.0005386 -7.512        2
13679 RP11-230C9.4      6_102    0.9414   21.83 0.0002666 -4.558        2
3165         SF3B1      2_117    0.9029   43.80 0.0005130  6.784        1
3085         SPCS1       3_36    0.9013   33.68 0.0003938 -6.382        1
11176        PCBP2      12_33    0.8743   21.44 0.0002432  4.496        1
12719      HLA-DMB       6_27    0.8111  393.39 0.0041389 -8.273        1
421          TRIT1       1_25    0.8089   20.37 0.0002137 -4.060        3
9752       ZNF354C      5_108    0.8015   20.29 0.0002110 -4.154        1
5055        RCBTB1      13_21    0.7780   20.45 0.0002064 -4.141        2
6035      METTL21A      2_122    0.7368   22.25 0.0002126 -4.391        1
451        FAM120A       9_47    0.7113   22.53 0.0002079 -4.571        1
4616          DLG4       17_6    0.6780   22.05 0.0001939  3.863        2
3159        KCNJ13      2_137    0.6742   36.58 0.0003199  6.658        1
6435       ARFGAP2      11_29    0.6699   25.00 0.0002172  4.839        1
9648          LY6H       8_94    0.6544   20.80 0.0001766  4.118        1
6579      FAM177A1       14_9    0.6489   20.82 0.0001753 -4.548        1
947           FMO4       1_84    0.6487   22.82 0.0001920  3.839        1
Genes with largest effect sizes

      genename region_tag susie_pip    mu2       PVE       z num_eqtl
958      NT5C2      10_66 9.990e-01 2876.6 3.727e-02 -8.1897        1
6413     CNNM2      10_66 6.582e-05 2786.0 2.378e-06 -7.8764        1
6404       INA      10_66 5.789e-06 2049.1 1.539e-07 -7.1401        1
12375 HLA-DPA1       6_27 2.730e-08 1004.3 3.557e-10  5.3356        2
9334     USMG5      10_66 7.687e-11  409.2 4.079e-13  2.4174        1
12719  HLA-DMB       6_27 8.111e-01  393.4 4.139e-03 -8.2728        1
11611  HLA-DMA       6_27 3.220e-15  327.3 1.367e-17  0.4948        1
8214     WBP1L      10_66 5.766e-11  289.3 2.164e-13  2.1272        2
6414    PDCD11      10_66 3.156e-10  261.5 1.070e-12  3.0363        1
9405      MSL2       3_84 1.040e-06  196.8 2.655e-09  5.8137        2
11907    CLIC1       6_26 3.079e-04  176.8 7.062e-07  9.5362        2
5342    CALHM2      10_66 5.007e-11  162.6 1.056e-13 -1.7655        1
11645   LY6G6C       6_26 1.657e-05  151.0 3.247e-08  8.8896        1
11634   ZBTB12       6_26 3.831e-06  146.1 7.259e-09  8.7124        1
11640   HSPA1L       6_26 8.730e-12  140.4 1.590e-14 -7.6575        1
12122      C4B       6_26 3.225e-07  138.7 5.804e-10 -8.4450        1
11638  C6orf48       6_26 3.936e-13  137.8 7.036e-16  7.2997        1
12783      C4A       6_26 2.555e-07  137.2 4.546e-10  8.4728        3
12471   TRIM26       6_24 4.330e-15  135.7 7.619e-18 -5.4551        1
13651    HCG17       6_24 4.552e-15  134.5 7.943e-18  5.5087        1
Genes with highest PVE
genename region_tag susie_pip mu2 PVE z num_eqtl
958 NT5C2 10_66 0.9990 2876.64 0.0372745 -8.190 1
12719 HLA-DMB 6_27 0.8111 393.39 0.0041389 -8.273 1
13518 LINC01415 18_30 0.9807 42.34 0.0005386 -7.512 2
3165 SF3B1 2_117 0.9029 43.80 0.0005130 6.784 1
1518 DDTL 22_6 0.9987 32.10 0.0004159 -3.206 2
3085 SPCS1 3_36 0.9013 33.68 0.0003938 -6.382 1
11314 ZNF823 19_10 0.9889 29.71 0.0003811 5.560 2
3159 KCNJ13 2_137 0.6742 36.58 0.0003199 6.658 1
2682 MDK 11_28 0.5855 38.23 0.0002904 -6.344 1
7729 THOC7 3_43 0.6093 34.55 0.0002730 -5.844 4
13679 RP11-230C9.4 6_102 0.9414 21.83 0.0002666 -4.558 2
11176 PCBP2 12_33 0.8743 21.44 0.0002432 4.496 1
6507 TMEM219 16_24 0.5089 34.44 0.0002273 6.164 1
376 CUL3 2_132 0.6023 28.00 0.0002187 -5.422 1
6435 ARFGAP2 11_29 0.6699 25.00 0.0002172 4.839 1
421 TRIT1 1_25 0.8089 20.37 0.0002137 -4.060 3
6035 METTL21A 2_122 0.7368 22.25 0.0002126 -4.391 1
9752 ZNF354C 5_108 0.8015 20.29 0.0002110 -4.154 1
451 FAM120A 9_47 0.7113 22.53 0.0002079 -4.571 1
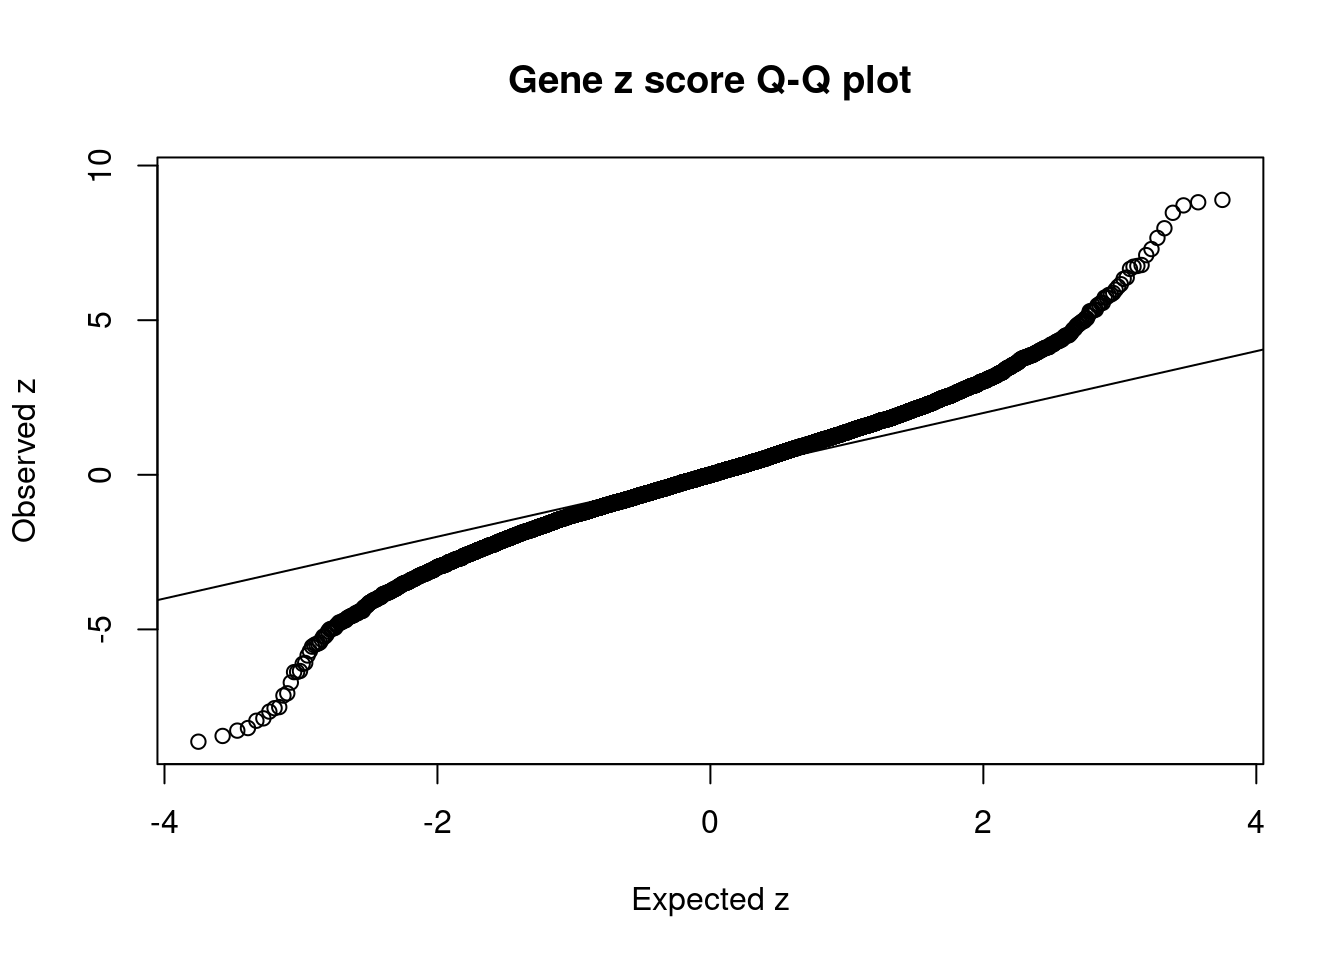
5055 RCBTB1 13_21 0.7780 20.45 0.0002064 -4.141 2Genes with largest z scores
       genename region_tag susie_pip     mu2       PVE      z num_eqtl
11907     CLIC1       6_26 3.079e-04  176.84 7.062e-07  9.536        2
11645    LY6G6C       6_26 1.657e-05  151.03 3.247e-08  8.890        1
11129   ZSCAN16       6_22 1.319e-02   79.39 1.358e-05  8.813        1
11634    ZBTB12       6_26 3.831e-06  146.08 7.259e-09  8.712        1
2927     PRSS16       6_21 4.903e-02   42.22 2.685e-05 -8.631        2
12783       C4A       6_26 2.555e-07  137.19 4.546e-10  8.473        3
12122       C4B       6_26 3.225e-07  138.73 5.804e-10 -8.445        1
12719   HLA-DMB       6_27 8.111e-01  393.39 4.139e-03 -8.273        1
958       NT5C2      10_66 9.990e-01 2876.64 3.727e-02 -8.190        1
11649    GPANK1       6_26 3.819e-14  103.62 5.133e-17  7.973        1
12395   CYP21A2       6_26 7.677e-10  129.01 1.285e-12 -7.953        2
6413      CNNM2      10_66 6.582e-05 2786.03 2.378e-06 -7.876        1
11908     DDAH2       6_26 1.042e-13  127.56 1.725e-16  7.661        1
11640    HSPA1L       6_26 8.730e-12  140.43 1.590e-14 -7.658        1
11620      AGER       6_26 2.220e-16   70.05 2.017e-19 -7.547        1
13518 LINC01415      18_30 9.807e-01   42.34 5.386e-04 -7.512        2
11638   C6orf48       6_26 3.936e-13  137.83 7.036e-16  7.300        1
6404        INA      10_66 5.789e-06 2049.08 1.539e-07 -7.140        1
11621      RNF5       6_26 2.220e-16   45.12 1.300e-19  7.104        2
12511   ZSCAN31       6_22 2.921e-02   41.08 1.556e-05 -7.066        3
Comparing z scores and PIPs
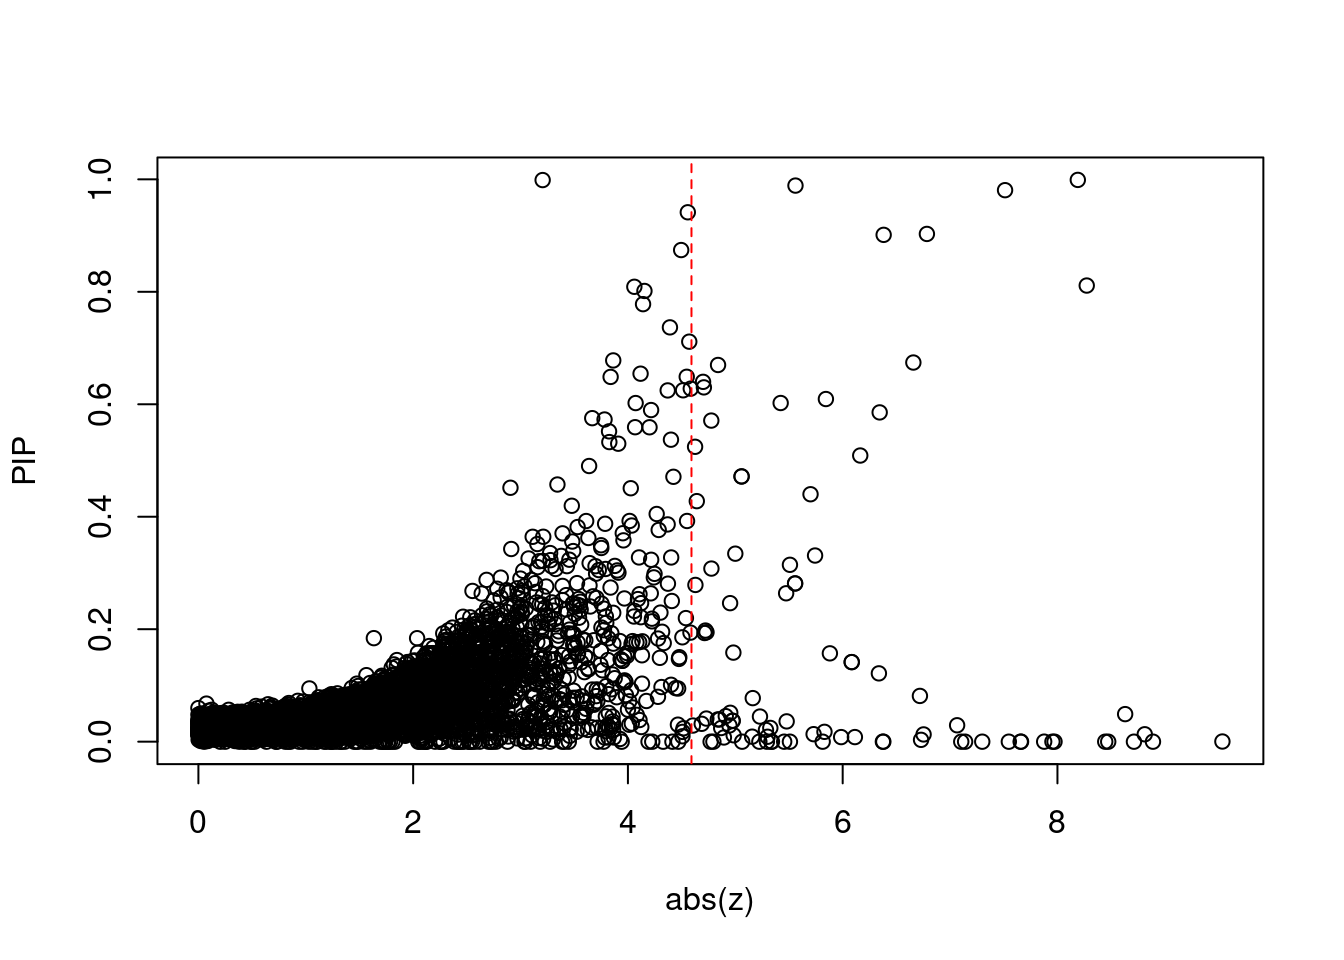
[1] 0.008173GO enrichment analysis for genes with PIP>0.5
#number of genes for gene set enrichment
length(genes)
[1] 41Uploading data to Enrichr... Done.
Querying GO_Biological_Process_2021... Done.
Querying GO_Cellular_Component_2021... Done.
Querying GO_Molecular_Function_2021... Done.
Parsing results... Done.
[1] "GO_Biological_Process_2021"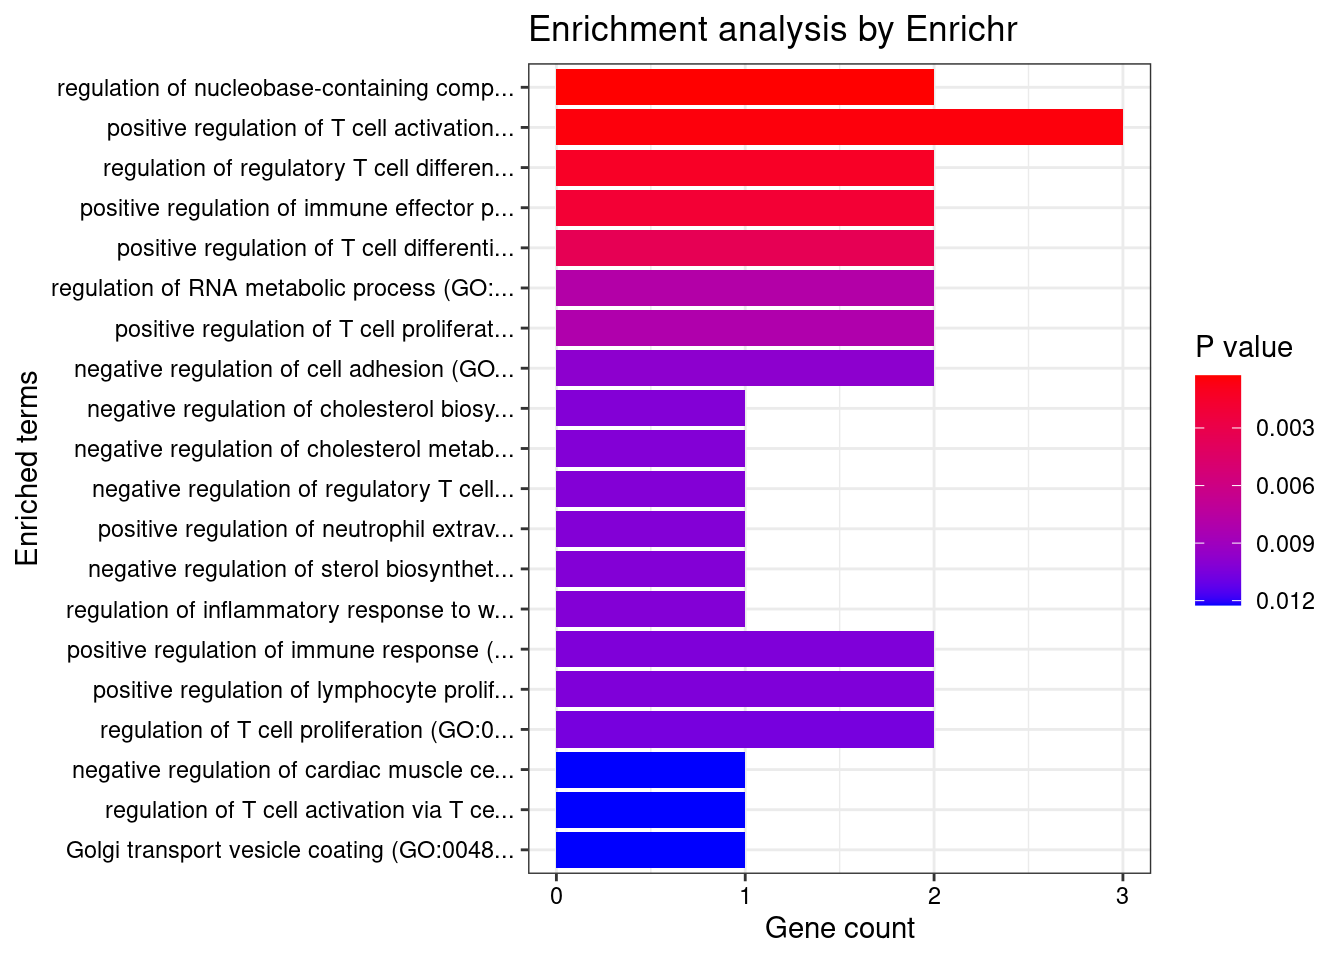
[1] Term             Overlap          Adjusted.P.value Genes
<0 rows> (or 0-length row.names)
[1] "GO_Cellular_Component_2021"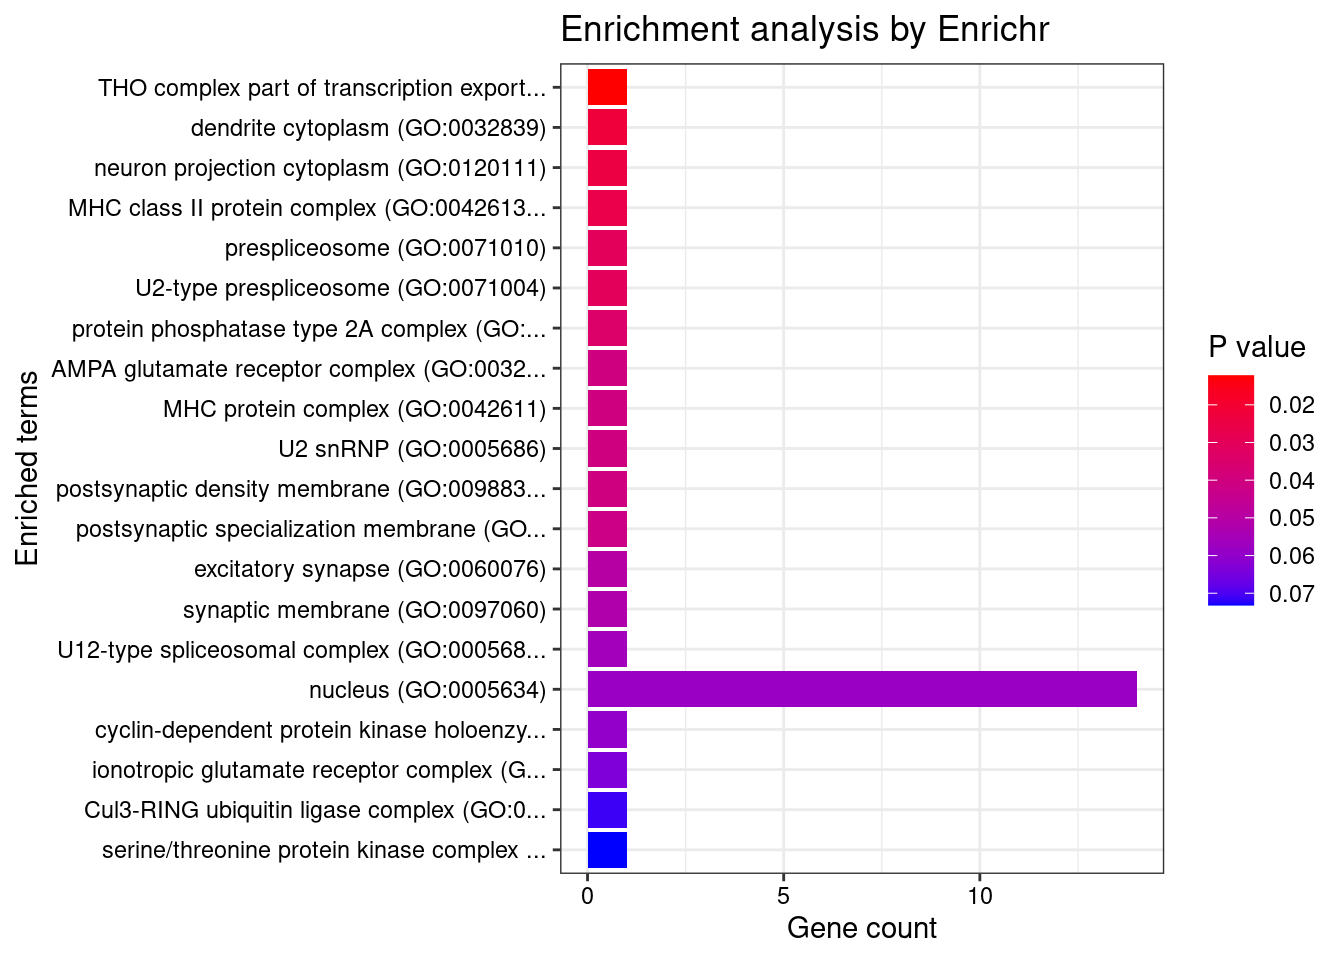
[1] Term             Overlap          Adjusted.P.value Genes
<0 rows> (or 0-length row.names)
[1] "GO_Molecular_Function_2021"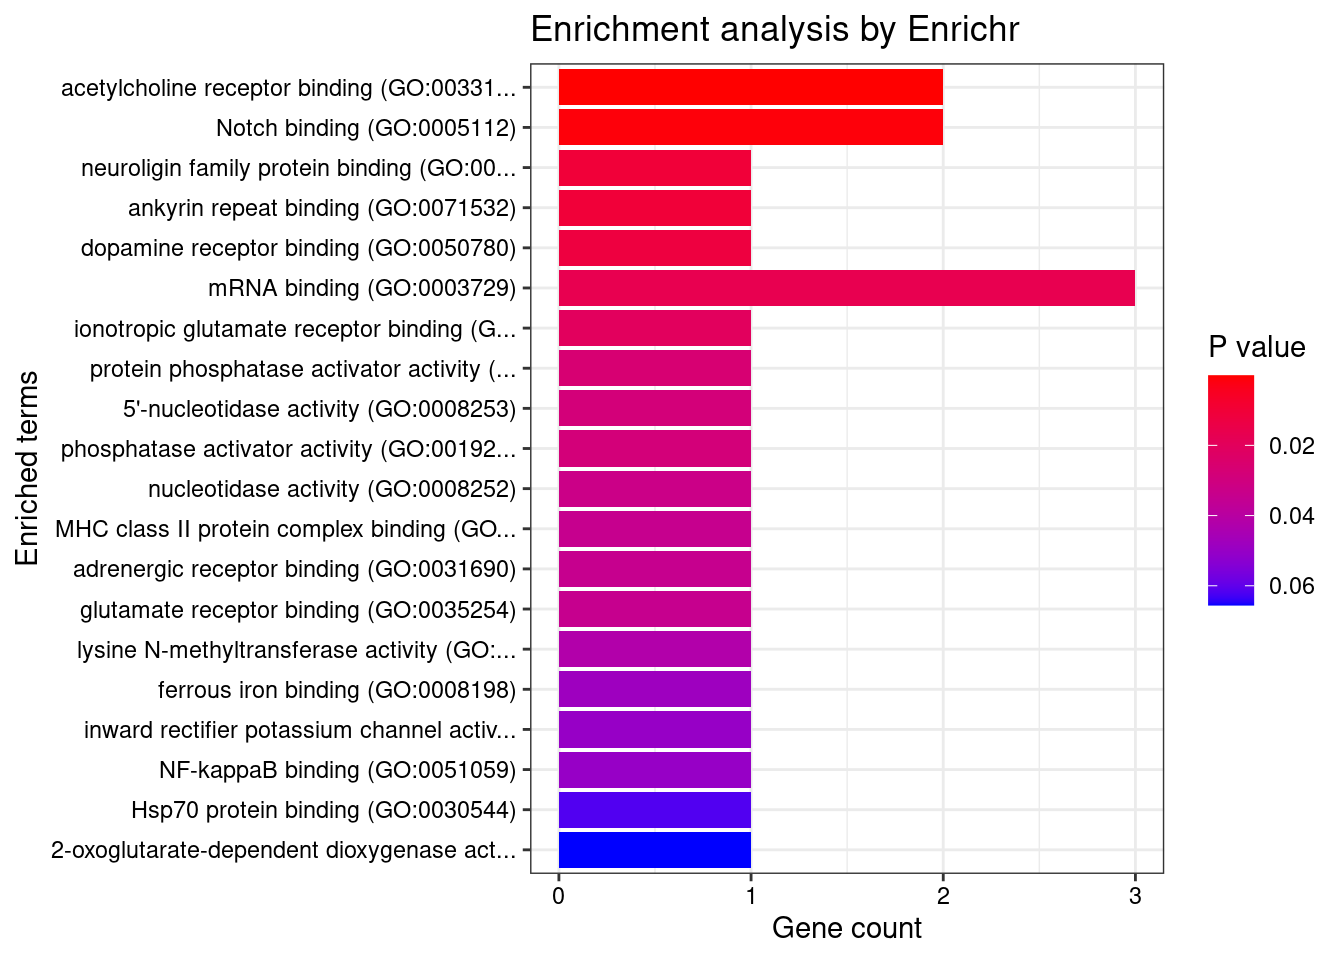
                                         Term Overlap Adjusted.P.value
1 acetylcholine receptor binding (GO:0033130)     2/8         0.007632
2                  Notch binding (GO:0005112)    2/24         0.036841
        Genes
1   DLG4;LY6H
2 CUL3;HIF1AN
DisGeNET enrichment analysis for genes with PIP>0.5
                                                 Description     FDR Ratio
20                                                   Measles 0.01082  1/15
64                             Disproportionate tall stature 0.01082  1/15
65                      Snowflake vitreoretinal degeneration 0.01082  1/15
66         Reticular Dystrophy Of Retinal Pigment Epithelium 0.01082  1/15
69 HEMOLYTIC UREMIC SYNDROME, ATYPICAL, SUSCEPTIBILITY TO, 2 0.01082  1/15
71                             LEBER CONGENITAL AMAUROSIS 16 0.01082  1/15
73                         PSEUDOHYPOALDOSTERONISM, TYPE IIE 0.01082  1/15
78                SPASTIC PARAPLEGIA 45, AUTOSOMAL RECESSIVE 0.01082  1/15
79                                     CONE-ROD DYSTROPHY 20 0.01082  1/15
82                SPASTIC PARAPLEGIA 62, AUTOSOMAL RECESSIVE 0.01082  1/15
   BgRatio
20  1/9703
64  1/9703
65  1/9703
66  1/9703
69  1/9703
71  1/9703
73  1/9703
78  1/9703
79  1/9703
82  1/9703
WebGestalt enrichment analysis for genes with PIP>0.5
Loading the functional categories...
Loading the ID list...
Loading the reference list...
Performing the enrichment analysis...
Warning in oraEnrichment(interestGeneList, referenceGeneList, geneSet, minNum =
minNum, : No significant gene set is identified based on FDR 0.05!NULLPIP Manhattan Plot
Warning: 'timedatectl' indicates the non-existent timezone name 'n/a'Warning: Your system is mis-configured: '/etc/localtime' is not a symlinkWarning: It is strongly recommended to set envionment variable TZ to 'America/
Chicago' (or equivalent)Warning: ggrepel: 6 unlabeled data points (too many overlaps). Consider
increasing max.overlaps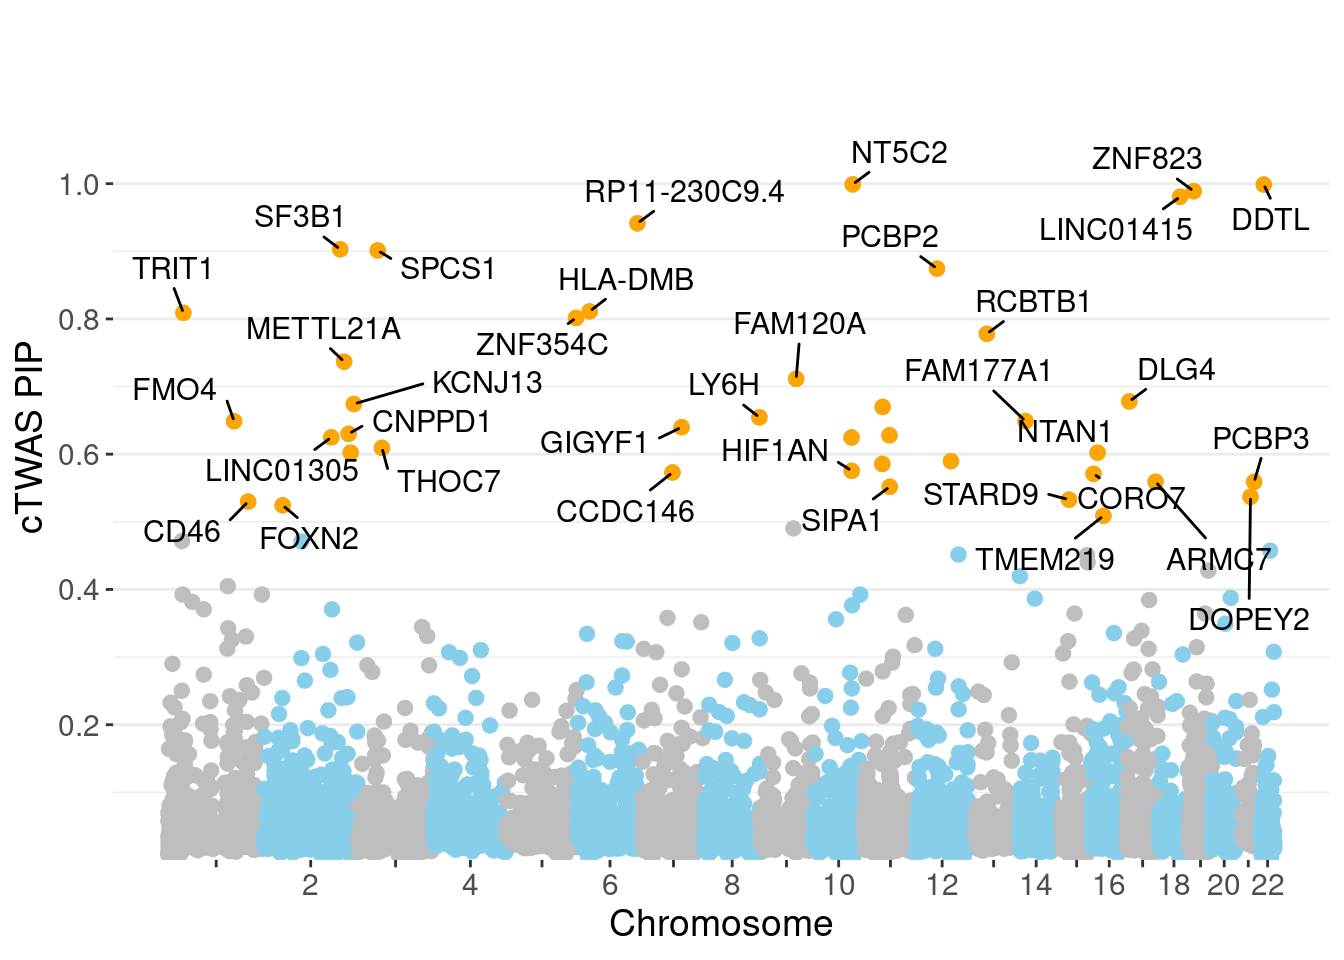
Sensitivity, specificity and precision for silver standard genes
#number of genes in known annotations
print(length(known_annotations))
[1] 130#number of genes in known annotations with imputed expression
print(sum(known_annotations %in% ctwas_gene_res$genename))[1] 65#significance threshold for TWAS
print(sig_thresh)[1] 4.592#number of ctwas genes
length(ctwas_genes)[1] 11#number of TWAS genes
length(twas_genes)[1] 93#show novel genes (ctwas genes with not in TWAS genes)
ctwas_gene_res[ctwas_gene_res$genename %in% novel_genes,report_cols] genename region_tag susie_pip mu2 PVE z num_eqtl
421 TRIT1 1_25 0.8089 20.37 0.0002137 -4.060 3
9752 ZNF354C 5_108 0.8015 20.29 0.0002110 -4.154 1
13679 RP11-230C9.4 6_102 0.9414 21.83 0.0002666 -4.558 2
11176 PCBP2 12_33 0.8743 21.44 0.0002432 4.496 1
1518 DDTL 22_6 0.9987 32.10 0.0004159 -3.206 2#sensitivity / recall
print(sensitivity) ctwas TWAS
0.01538 0.06923 #specificity
print(specificity) ctwas TWAS
0.9992 0.9926 #precision / PPV
print(precision) ctwas TWAS
0.18182 0.09677 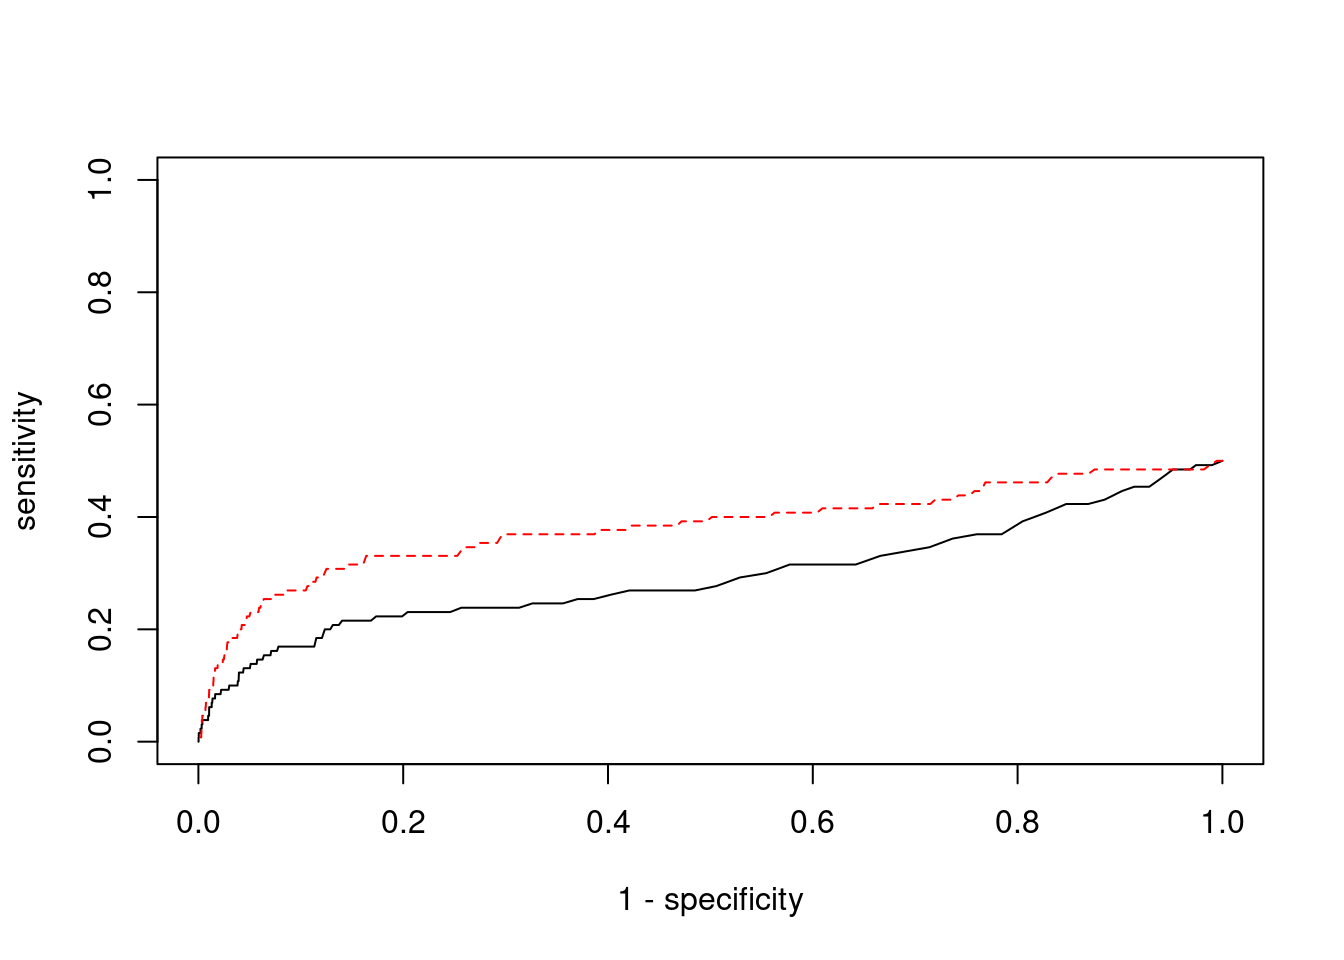
cTWAS is more precise than TWAS in distinguishing silver standard and bystander genes
#number of genes in known annotations (with imputed expression)
print(length(known_annotations))[1] 65#number of bystander genes (with imputed expression)
print(length(unrelated_genes))[1] 820#subset results to genes in known annotations or bystanders
ctwas_gene_res_subset <- ctwas_gene_res[ctwas_gene_res$genename %in% c(known_annotations, unrelated_genes),]
#assign ctwas and TWAS genes
ctwas_genes <- ctwas_gene_res_subset$genename[ctwas_gene_res_subset$susie_pip>0.8]
twas_genes <- ctwas_gene_res_subset$genename[abs(ctwas_gene_res_subset$z)>sig_thresh]
#significance threshold for TWAS
print(sig_thresh)
[1] 4.592#number of ctwas genes (in known annotations or bystanders)
length(ctwas_genes)[1] 2#number of TWAS genes (in known annotations or bystanders)
length(twas_genes)[1] 26#sensitivity / recall
sensitivity ctwas TWAS
0.03077 0.13846 #specificity / (1 - False Positive Rate)
specificity ctwas TWAS
1.0000 0.9793 #precision / PPV / (1 - False Discovery Rate)
precision ctwas TWAS
1.0000 0.3462 

pip_range <- (0:1000)/1000
sensitivity <- rep(NA, length(pip_range))
specificity <- rep(NA, length(pip_range))

for (index in 1:length(pip_range)){
  pip <- pip_range[index]
  ctwas_genes <- ctwas_gene_res_subset$genename[ctwas_gene_res_subset$susie_pip>=pip]
  sensitivity[index] <- sum(ctwas_genes %in% known_annotations)/length(known_annotations)
  specificity[index] <- sum(!(unrelated_genes %in% ctwas_genes))/length(unrelated_genes)
}

plot(1-specificity, sensitivity, type="l", xlim=c(0,1), ylim=c(0,1), main="", xlab="1 - Specificity", ylab="Sensitivity")
title(expression("ROC Curve for cTWAS (black) and TWAS (" * phantom("red") * ")"))
title(expression(phantom("ROC Curve for cTWAS (black) and TWAS (") * "red" * phantom(")")), col.main="red")

sig_thresh_range <- seq(from=0, to=max(abs(ctwas_gene_res_subset$z)), length.out=length(pip_range))

for (index in 1:length(sig_thresh_range)){
  sig_thresh_plot <- sig_thresh_range[index]
  twas_genes <- ctwas_gene_res_subset$genename[abs(ctwas_gene_res_subset$z)>=sig_thresh_plot]
  sensitivity[index] <- sum(twas_genes %in% known_annotations)/length(known_annotations)
  specificity[index] <- sum(!(unrelated_genes %in% twas_genes))/length(unrelated_genes)
}

lines(1-specificity, sensitivity, xlim=c(0,1), ylim=c(0,1), col="red", lty=1)

abline(a=0,b=1,lty=3)

#add previously computed points from the analysis
ctwas_genes <- ctwas_gene_res_subset$genename[ctwas_gene_res_subset$susie_pip>0.8]
twas_genes <- ctwas_gene_res_subset$genename[abs(ctwas_gene_res_subset$z)>sig_thresh]

points(1-specificity_plot["ctwas"], sensitivity_plot["ctwas"], pch=21, bg="black")
points(1-specificity_plot["TWAS"], sensitivity_plot["TWAS"], pch=21, bg="red")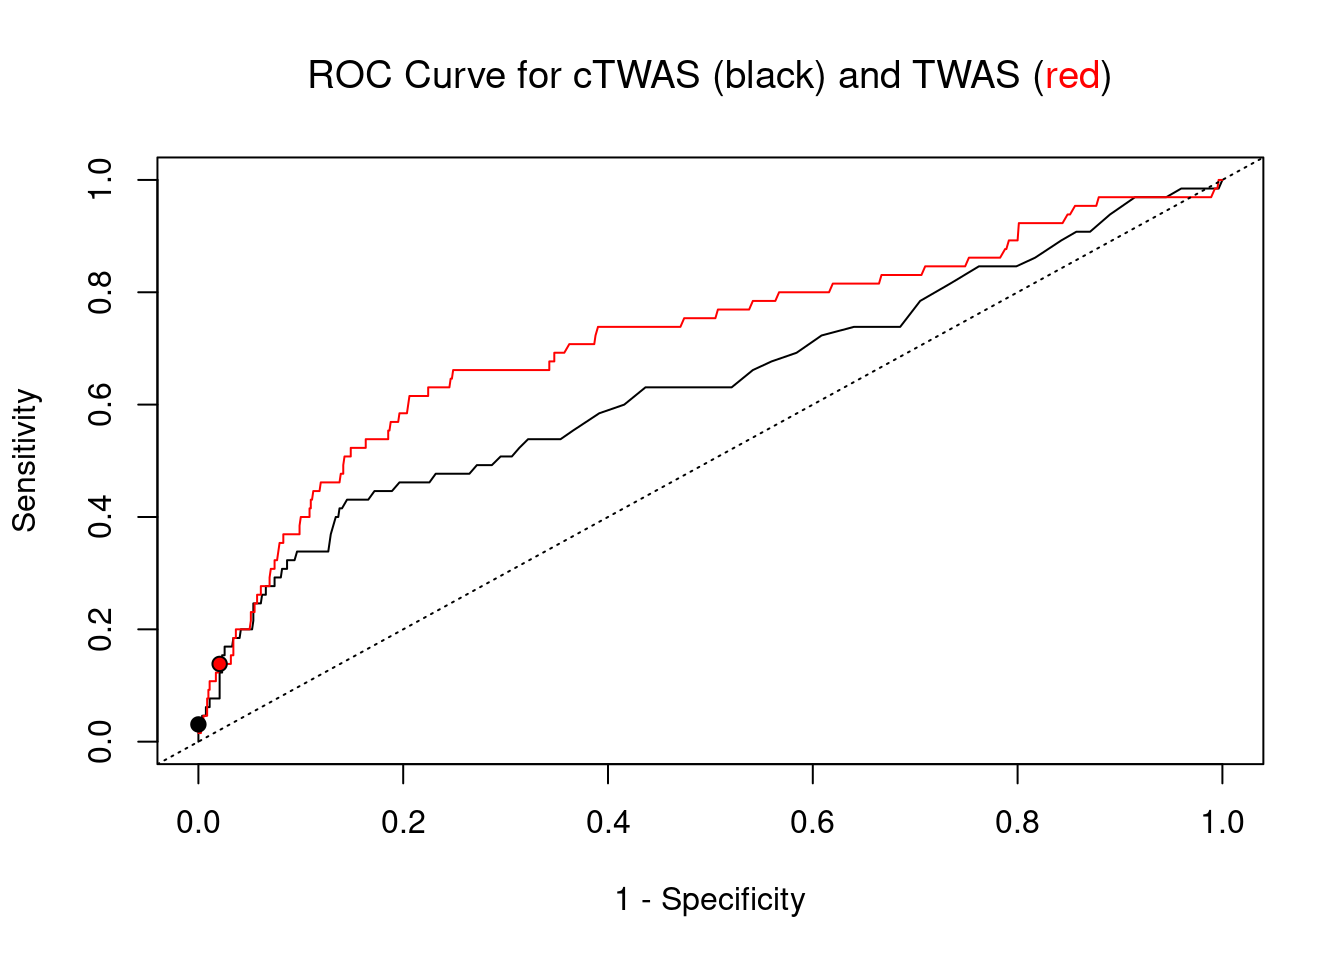
Undetected silver standard genes have low TWAS z-scores or stronger signal from nearby variants
#table of outcomes for silver standard genes
-sort(-table(silver_standard_case))
silver_standard_case
Not Imputed Insignificant z-score Nearby SNP(s)
65 56 7
Detected (PIP > 0.8)
2 #show inconclusive genes
silver_standard_case[silver_standard_case=="Inconclusive"]named character(0)
sessionInfo()R version 3.6.1 (2019-07-05)
Platform: x86_64-pc-linux-gnu (64-bit)
Running under: Scientific Linux 7.4 (Nitrogen)
Matrix products: default
BLAS/LAPACK: /software/openblas-0.2.19-el7-x86_64/lib/libopenblas_haswellp-r0.2.19.so
locale:
[1] LC_CTYPE=en_US.UTF-8 LC_NUMERIC=C
[3] LC_TIME=en_US.UTF-8 LC_COLLATE=en_US.UTF-8
[5] LC_MONETARY=en_US.UTF-8 LC_MESSAGES=en_US.UTF-8
[7] LC_PAPER=en_US.UTF-8 LC_NAME=C
[9] LC_ADDRESS=C LC_TELEPHONE=C
[11] LC_MEASUREMENT=en_US.UTF-8 LC_IDENTIFICATION=C
attached base packages:
[1] parallel stats4 stats graphics grDevices utils datasets
[8] methods base
other attached packages:
[1] GenomicRanges_1.36.1 GenomeInfoDb_1.20.0 IRanges_2.18.1
[4] S4Vectors_0.22.1 BiocGenerics_0.30.0 biomaRt_2.40.1
[7] readxl_1.3.1 forcats_0.5.1 stringr_1.4.0
[10] dplyr_1.0.7 purrr_0.3.4 readr_2.1.1
[13] tidyr_1.1.4 tidyverse_1.3.1 tibble_3.1.6
[16] WebGestaltR_0.4.4 disgenet2r_0.99.2 enrichR_3.0
[19] cowplot_1.0.0 ggplot2_3.3.5 workflowr_1.7.0
loaded via a namespace (and not attached):
[1] ggbeeswarm_0.6.0 colorspace_2.0-2 rjson_0.2.20
[4] ellipsis_0.3.2 rprojroot_2.0.2 XVector_0.24.0
[7] fs_1.5.2 rstudioapi_0.13 farver_2.1.0
[10] ggrepel_0.9.1 bit64_4.0.5 AnnotationDbi_1.46.0
[13] fansi_1.0.2 lubridate_1.8.0 xml2_1.3.3
[16] codetools_0.2-16 doParallel_1.0.17 cachem_1.0.6
[19] knitr_1.36 jsonlite_1.7.2 apcluster_1.4.8
[22] Cairo_1.5-12.2 broom_0.7.10 dbplyr_2.1.1
[25] compiler_3.6.1 httr_1.4.2 backports_1.4.1
[28] assertthat_0.2.1 Matrix_1.2-18 fastmap_1.1.0
[31] cli_3.1.0 later_0.8.0 prettyunits_1.1.1
[34] htmltools_0.5.2 tools_3.6.1 igraph_1.2.10
[37] GenomeInfoDbData_1.2.1 gtable_0.3.0 glue_1.6.2
[40] reshape2_1.4.4 doRNG_1.8.2 Rcpp_1.0.8
[43] Biobase_2.44.0 cellranger_1.1.0 jquerylib_0.1.4
[46] vctrs_0.3.8 svglite_1.2.2 iterators_1.0.14
[49] xfun_0.29 ps_1.6.0 rvest_1.0.2
[52] lifecycle_1.0.1 rngtools_1.5.2 XML_3.99-0.3
[55] zlibbioc_1.30.0 getPass_0.2-2 scales_1.1.1
[58] vroom_1.5.7 hms_1.1.1 promises_1.0.1
[61] yaml_2.2.1 curl_4.3.2 memoise_2.0.1
[64] ggrastr_1.0.1 gdtools_0.1.9 stringi_1.7.6
[67] RSQLite_2.2.8 highr_0.9 foreach_1.5.2
[70] rlang_1.0.1 pkgconfig_2.0.3 bitops_1.0-7
[73] evaluate_0.14 lattice_0.20-38 labeling_0.4.2
[76] bit_4.0.4 processx_3.5.2 tidyselect_1.1.1
[79] plyr_1.8.6 magrittr_2.0.2 R6_2.5.1
[82] generics_0.1.1 DBI_1.1.2 pillar_1.6.4
[85] haven_2.4.3 whisker_0.3-2 withr_2.4.3
[88] RCurl_1.98-1.5 modelr_0.1.8 crayon_1.5.0
[91] utf8_1.2.2 tzdb_0.2.0 rmarkdown_2.11
[94] progress_1.2.2 grid_3.6.1 data.table_1.14.2
[97] blob_1.2.2 callr_3.7.0 git2r_0.26.1
[100] reprex_2.0.1 digest_0.6.29 httpuv_1.5.1
[103] munsell_0.5.0 beeswarm_0.2.3 vipor_0.4.5