SCZ - Brain Putamen basal ganglia
sheng Qian
2021-2-6
Last updated: 2022-04-19
Checks: 5 2
Knit directory: cTWAS_analysis/
This reproducible R Markdown analysis was created with workflowr (version 1.7.0). The Checks tab describes the reproducibility checks that were applied when the results were created. The Past versions tab lists the development history.
The R Markdown file has unstaged changes. To know which version of the R Markdown file created these results, you’ll want to first commit it to the Git repo. If you’re still working on the analysis, you can ignore this warning. When you’re finished, you can run wflow_publish to commit the R Markdown file and build the HTML.
Great job! The global environment was empty. Objects defined in the global environment can affect the analysis in your R Markdown file in unknown ways. For reproduciblity it’s best to always run the code in an empty environment.
The command set.seed(20211220) was run prior to running the code in the R Markdown file. Setting a seed ensures that any results that rely on randomness, e.g. subsampling or permutations, are reproducible.
Great job! Recording the operating system, R version, and package versions is critical for reproducibility.
Nice! There were no cached chunks for this analysis, so you can be confident that you successfully produced the results during this run.
Using absolute paths to the files within your workflowr project makes it difficult for you and others to run your code on a different machine. Change the absolute path(s) below to the suggested relative path(s) to make your code more reproducible.
| absolute | relative |
|---|---|
| /project2/xinhe/shengqian/cTWAS/cTWAS_analysis/data/ | data |
| /project2/xinhe/shengqian/cTWAS/cTWAS_analysis/code/ctwas_config.R | code/ctwas_config.R |
Great! You are using Git for version control. Tracking code development and connecting the code version to the results is critical for reproducibility.
The results in this page were generated with repository version ba919ab. See the Past versions tab to see a history of the changes made to the R Markdown and HTML files.
Note that you need to be careful to ensure that all relevant files for the analysis have been committed to Git prior to generating the results (you can use wflow_publish or wflow_git_commit). workflowr only checks the R Markdown file, but you know if there are other scripts or data files that it depends on. Below is the status of the Git repository when the results were generated:
Ignored files:
    Ignored:    .ipynb_checkpoints/
    Ignored:    data/AF/

Untracked files:
    Untracked:  Rplot.png
    Untracked:  analysis/.ipynb_checkpoints/
    Untracked:  code/.ipynb_checkpoints/
    Untracked:  code/AF_out/
    Untracked:  code/Autism_out/
    Untracked:  code/BMI_S_out/
    Untracked:  code/BMI_out/
    Untracked:  code/Glucose_out/
    Untracked:  code/LDL_S_out/
    Untracked:  code/SCZ_2014_EUR_out/
    Untracked:  code/SCZ_2018_out/
    Untracked:  code/SCZ_2020_Single_out/
    Untracked:  code/SCZ_2020_out/
    Untracked:  code/SCZ_S_out/
    Untracked:  code/SCZ_out/
    Untracked:  code/T2D_out/
    Untracked:  code/ctwas_config.R
    Untracked:  code/mapping.R
    Untracked:  code/out/
    Untracked:  code/process_scz_2018_snps.R
    Untracked:  code/run_AF_analysis.sbatch
    Untracked:  code/run_AF_analysis.sh
    Untracked:  code/run_AF_ctwas_rss_LDR.R
    Untracked:  code/run_Autism_analysis.sbatch
    Untracked:  code/run_Autism_analysis.sh
    Untracked:  code/run_Autism_ctwas_rss_LDR.R
    Untracked:  code/run_BMI_analysis.sbatch
    Untracked:  code/run_BMI_analysis.sh
    Untracked:  code/run_BMI_analysis_S.sbatch
    Untracked:  code/run_BMI_analysis_S.sh
    Untracked:  code/run_BMI_ctwas_rss_LDR.R
    Untracked:  code/run_BMI_ctwas_rss_LDR_S.R
    Untracked:  code/run_Glucose_analysis.sbatch
    Untracked:  code/run_Glucose_analysis.sh
    Untracked:  code/run_Glucose_ctwas_rss_LDR.R
    Untracked:  code/run_LDL_analysis_S.sbatch
    Untracked:  code/run_LDL_analysis_S.sh
    Untracked:  code/run_LDL_ctwas_rss_LDR_S.R
    Untracked:  code/run_SCZ_2014_EUR_analysis.sbatch
    Untracked:  code/run_SCZ_2014_EUR_analysis.sh
    Untracked:  code/run_SCZ_2014_EUR_ctwas_rss_LDR.R
    Untracked:  code/run_SCZ_2018_analysis.sbatch
    Untracked:  code/run_SCZ_2018_analysis.sh
    Untracked:  code/run_SCZ_2018_ctwas_rss_LDR.R
    Untracked:  code/run_SCZ_2020_Single_analysis.sbatch
    Untracked:  code/run_SCZ_2020_Single_analysis.sh
    Untracked:  code/run_SCZ_2020_Single_ctwas_rss_LDR.R
    Untracked:  code/run_SCZ_2020_analysis.sbatch
    Untracked:  code/run_SCZ_2020_analysis.sh
    Untracked:  code/run_SCZ_2020_ctwas_rss_LDR.R
    Untracked:  code/run_SCZ_analysis.sbatch
    Untracked:  code/run_SCZ_analysis.sh
    Untracked:  code/run_SCZ_analysis_S.sbatch
    Untracked:  code/run_SCZ_analysis_S.sh
    Untracked:  code/run_SCZ_ctwas_rss_LDR.R
    Untracked:  code/run_SCZ_ctwas_rss_LDR_S.R
    Untracked:  code/run_T2D_analysis.sbatch
    Untracked:  code/run_T2D_analysis.sh
    Untracked:  code/run_T2D_ctwas_rss_LDR.R
    Untracked:  code/wflow_build.R
    Untracked:  code/wflow_build.sbatch
    Untracked:  data/.ipynb_checkpoints/
    Untracked:  data/BMI/
    Untracked:  data/GO_Terms/
    Untracked:  data/PGC3_SCZ_wave3_public.v2.tsv
    Untracked:  data/SCZ/
    Untracked:  data/SCZ_2014_EUR/
    Untracked:  data/SCZ_2018/
    Untracked:  data/SCZ_2020/
    Untracked:  data/SCZ_2020_Single/
    Untracked:  data/SCZ_S/
    Untracked:  data/Supplementary Table 15 - MAGMA.xlsx
    Untracked:  data/Supplementary Table 20 - Prioritised Genes.xlsx
    Untracked:  data/T2D/
    Untracked:  data/UKBB/
    Untracked:  data/UKBB_SNPs_Info.text
    Untracked:  data/gene_OMIM.txt
    Untracked:  data/gene_pip_0.8.txt
    Untracked:  data/mashr_Heart_Atrial_Appendage.db
    Untracked:  data/mashr_sqtl/
    Untracked:  data/scz_2018.RDS
    Untracked:  data/summary_known_genes_annotations.xlsx
    Untracked:  data/untitled.txt
    Untracked:  top_genes_32.txt
    Untracked:  top_genes_37.txt
    Untracked:  top_genes_43.txt
    Untracked:  top_genes_81.txt

Unstaged changes:
    Modified:   analysis/SCZ_2018_Brain_Amygdala.Rmd
    Modified:   analysis/SCZ_2018_Brain_Anterior_cingulate_cortex_BA24.Rmd
    Modified:   analysis/SCZ_2018_Brain_Caudate_basal_ganglia.Rmd
    Modified:   analysis/SCZ_2018_Brain_Cerebellar_Hemisphere.Rmd
    Modified:   analysis/SCZ_2018_Brain_Cerebellum.Rmd
    Modified:   analysis/SCZ_2018_Brain_Cortex.Rmd
    Modified:   analysis/SCZ_2018_Brain_Frontal_Cortex_BA9.Rmd
    Modified:   analysis/SCZ_2018_Brain_Hippocampus.Rmd
    Modified:   analysis/SCZ_2018_Brain_Hypothalamus.Rmd
    Modified:   analysis/SCZ_2018_Brain_Nucleus_accumbens_basal_ganglia.Rmd
    Modified:   analysis/SCZ_2018_Brain_Putamen_basal_ganglia.Rmd
    Modified:   analysis/SCZ_2018_Brain_Spinal_cord_cervical_c-1.Rmd
    Modified:   analysis/SCZ_2018_Brain_Substantia_nigra.Rmd
    Modified:   analysis/SCZ_Annotation_Analysis.Rmd
Note that any generated files, e.g. HTML, png, CSS, etc., are not included in this status report because it is ok for generated content to have uncommitted changes.
These are the previous versions of the repository in which changes were made to the R Markdown (analysis/SCZ_2018_Brain_Putamen_basal_ganglia.Rmd) and HTML (docs/SCZ_2018_Brain_Putamen_basal_ganglia.html) files. If you’ve configured a remote Git repository (see ?wflow_git_remote), click on the hyperlinks in the table below to view the files as they were in that past version.
| File | Version | Author | Date | Message |
|---|---|---|---|---|
| Rmd | 9ddc9c4 | sq-96 | 2022-04-18 | update |
| Rmd | f6e7062 | sq-96 | 2022-04-17 | update |
| html | f6e7062 | sq-96 | 2022-04-17 | update |
Weight QC
#number of imputed weights
nrow(qclist_all)
[1] 9809#number of imputed weights by chromosome
table(qclist_all$chr)
  1   2   3   4   5   6   7   8   9  10  11  12  13  14  15  16  17  18  19  20
968 704 572 395 453 573 498 359 366 394 599 571 207 337 341 396 606 157 750 301
 21  22
 25 237
#number of imputed weights without missing variants
sum(qclist_all$nmiss==0)[1] 6827#proportion of imputed weights without missing variants
mean(qclist_all$nmiss==0)[1] 0.696Check convergence of parameters
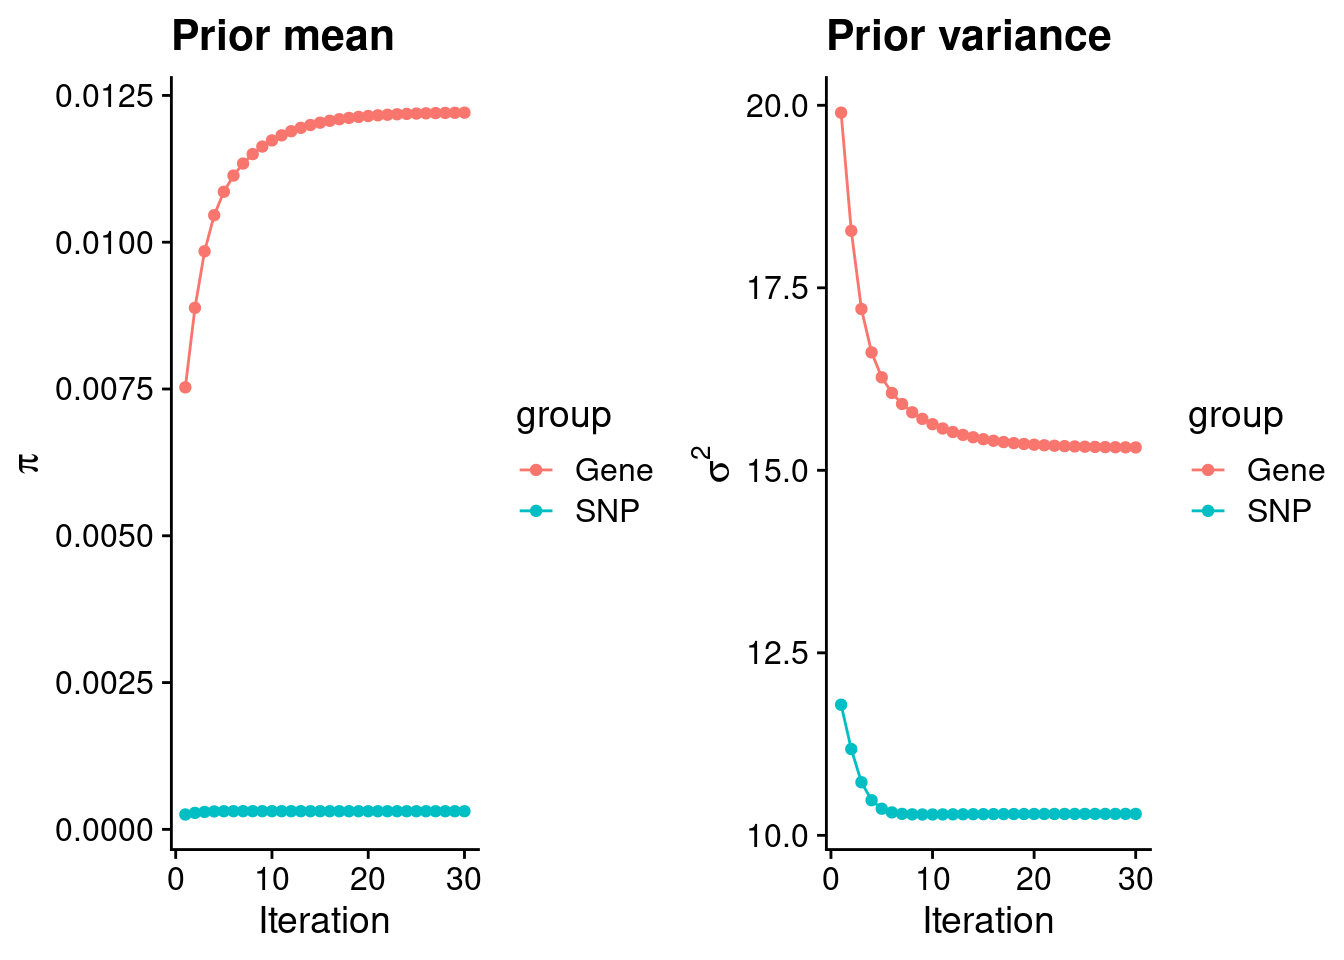
#estimated group prior
estimated_group_prior <- group_prior_rec[,ncol(group_prior_rec)]
names(estimated_group_prior) <- c("gene", "snp")
estimated_group_prior["snp"] <- estimated_group_prior["snp"]*thin #adjust parameter to account for thin argument
print(estimated_group_prior)
gene snp
0.0122063 0.0003085 #estimated group prior variance
estimated_group_prior_var <- group_prior_var_rec[,ncol(group_prior_var_rec)]
names(estimated_group_prior_var) <- c("gene", "snp")
print(estimated_group_prior_var) gene snp
15.31 10.29 #report sample size
print(sample_size)[1] 105318#report group size
group_size <- c(nrow(ctwas_gene_res), n_snps)
print(group_size)[1] 9809 6309950#estimated group PVE
estimated_group_pve <- estimated_group_prior_var*estimated_group_prior*group_size/sample_size #check PVE calculation
names(estimated_group_pve) <- c("gene", "snp")
print(estimated_group_pve) gene snp
0.01741 0.19029 #compare sum(PIP*mu2/sample_size) with above PVE calculation
c(sum(ctwas_gene_res$PVE),sum(ctwas_snp_res$PVE))[1] 0.05605 1.06023Genes with highest PIPs
        genename region_tag susie_pip    mu2       PVE      z num_eqtl
10867     ZNF823      19_10    0.9820  37.56 0.0003502  6.143        1
4092       FEZF1       7_74    0.9532  25.00 0.0002263 -4.812        1
11990 AC012074.2       2_15    0.9478  22.91 0.0002062  4.655        1
3950        IRF3      19_34    0.9150  42.36 0.0003681 -6.590        1
10737      PCBP2      12_33    0.8815  27.36 0.0002290  5.065        1
3043       SF3B1      2_117    0.8725  50.81 0.0004209  7.265        1
11945  HIST1H2BN       6_21    0.8448 105.63 0.0008473 13.396        1
3431     PYROXD2      10_62    0.7840  21.30 0.0001585  3.952        1
5518      ZCCHC2      18_34    0.7666  20.47 0.0001490 -3.877        1
3149     ARHGEF2       1_76    0.7374  22.47 0.0001573 -3.816        1
6842       SPPL3      12_74    0.7325  25.14 0.0001748 -4.648        2
2590         MDK      11_28    0.6904  48.58 0.0003184 -7.159        1
2365    ARHGAP21      10_18    0.6740  23.62 0.0001511 -3.738        2
11117      SOX18      20_38    0.6695  22.76 0.0001447  3.679        2
2638       TRPV4      12_66    0.6616  21.38 0.0001343  3.346        1
6076     FAM135B       8_91    0.6531  21.89 0.0001357 -3.851        1
7176       DBF4B      17_26    0.6514  19.98 0.0001236  3.890        1
10828        NMB      15_39    0.6472  36.10 0.0002219  5.881        1
3364        PTPA       9_66    0.6323  23.70 0.0001423 -4.650        2
9570       TDRD6       6_35    0.6288  20.76 0.0001240  3.788        2
Genes with largest effect sizes
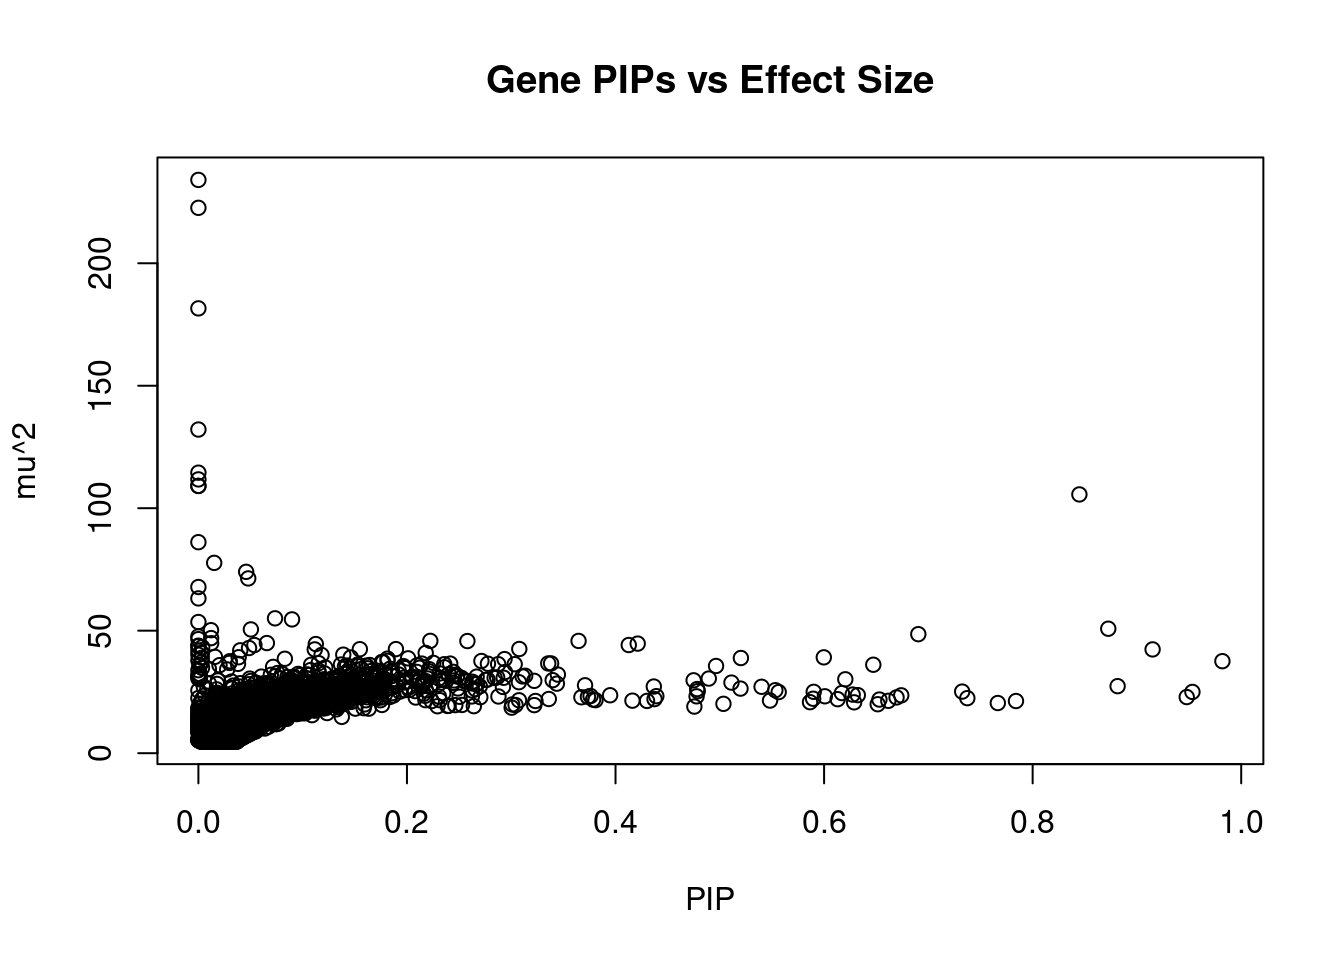
         genename region_tag susie_pip    mu2       PVE       z num_eqtl
11197        APOM       6_26 9.098e-08 234.02 2.022e-10 11.5895        1
12247         C4A       6_26 1.880e-08 222.62 3.975e-11 11.2611        2
11190        MSH5       6_26 2.806e-09 181.57 4.838e-12  9.8879        2
11167        AGER       6_26 1.077e-07 132.12 1.351e-10 -9.0708        1
11183       EHMT2       6_26 1.226e-07 114.50 1.333e-10  7.5336        1
10570    HLA-DRB1       6_26 1.347e-06 111.76 1.429e-09 -5.1060        1
11168        RNF5       6_26 1.708e-10 109.10 1.769e-13  5.1903        1
11169      AGPAT1       6_26 1.708e-10 109.10 1.769e-13 -5.1903        1
11945   HIST1H2BN       6_21 8.448e-01 105.63 8.473e-04 13.3956        1
11186     C6orf48       6_26 8.795e-10  86.13 7.193e-13  7.7844        1
10244      BTN3A2       6_20 1.514e-02  77.69 1.117e-05  9.8139        3
13230 RP1-86C11.7       6_21 4.582e-02  74.03 3.220e-05 10.8893        1
11156     HLA-DMA       6_27 4.778e-02  71.34 3.236e-05 -8.8449        1
11176       STK19       6_26 9.767e-09  67.83 6.290e-12 -3.1148        1
11207       HLA-C       6_26 6.211e-11  63.18 3.726e-14 -7.3708        3
13228   U91328.19       6_20 7.348e-02  55.05 3.841e-05 -7.3880        1
10392     ZSCAN23       6_22 8.978e-02  54.62 4.656e-05 -7.9581        2
12064    HLA-DQA2       6_26 1.189e-07  53.54 6.045e-11  0.8591        1
3043        SF3B1      2_117 8.725e-01  50.81 4.209e-04  7.2652        1
11172       FKBPL       6_26 5.033e-02  50.52 2.414e-05 -5.2136        1
Genes with highest PVE
        genename region_tag susie_pip    mu2       PVE      z num_eqtl
11945  HIST1H2BN       6_21    0.8448 105.63 0.0008473 13.396        1
3043       SF3B1      2_117    0.8725  50.81 0.0004209  7.265        1
3950        IRF3      19_34    0.9150  42.36 0.0003681 -6.590        1
10867     ZNF823      19_10    0.9820  37.56 0.0003502  6.143        1
2590         MDK      11_28    0.6904  48.58 0.0003184 -7.159        1
10737      PCBP2      12_33    0.8815  27.36 0.0002290  5.065        1
4092       FEZF1       7_74    0.9532  25.00 0.0002263 -4.812        1
13621  LINC02033       3_27    0.5997  39.12 0.0002228 -6.280        1
10828        NMB      15_39    0.6472  36.10 0.0002219  5.881        1
11990 AC012074.2       2_15    0.9478  22.91 0.0002062  4.655        1
7748       LETM2       8_34    0.5202  38.85 0.0001919 -6.067        1
5872      CCDC39      3_111    0.4213  44.73 0.0001789 -6.797        1
7857     PACSIN3      11_29    0.6204  30.16 0.0001777  5.308        1
6842       SPPL3      12_74    0.7325  25.14 0.0001748 -4.648        2
11497      AS3MT      10_66    0.4127  44.15 0.0001730  8.120        2
5406       FURIN      15_42    0.4964  35.60 0.0001678 -5.772        1
8111     GATAD2A      19_16    0.3646  45.83 0.0001586 -6.577        1
3431     PYROXD2      10_62    0.7840  21.30 0.0001585  3.952        1
3149     ARHGEF2       1_76    0.7374  22.47 0.0001573 -3.816        1
2365    ARHGAP21      10_18    0.6740  23.62 0.0001511 -3.738        2
Genes with largest z scores
         genename region_tag susie_pip    mu2       PVE      z num_eqtl
11945   HIST1H2BN       6_21 8.448e-01 105.63 8.473e-04 13.396        1
11197        APOM       6_26 9.098e-08 234.02 2.022e-10 11.590        1
12247         C4A       6_26 1.880e-08 222.62 3.975e-11 11.261        2
13230 RP1-86C11.7       6_21 4.582e-02  74.03 3.220e-05 10.889        1
11190        MSH5       6_26 2.806e-09 181.57 4.838e-12  9.888        2
10244      BTN3A2       6_20 1.514e-02  77.69 1.117e-05  9.814        3
11167        AGER       6_26 1.077e-07 132.12 1.351e-10 -9.071        1
11156     HLA-DMA       6_27 4.778e-02  71.34 3.236e-05 -8.845        1
6164        CNNM2      10_66 1.116e-01  42.36 4.488e-05 -8.161        1
11497       AS3MT      10_66 4.127e-01  44.15 1.730e-04  8.120        2
10392     ZSCAN23       6_22 8.978e-02  54.62 4.656e-05 -7.958        2
11186     C6orf48       6_26 8.795e-10  86.13 7.193e-13  7.784        1
10545     ZKSCAN3       6_22 1.584e-02  39.33 5.914e-06  7.765        1
11183       EHMT2       6_26 1.226e-07 114.50 1.333e-10  7.534        1
10732     ZSCAN26       6_22 1.220e-02  46.98 5.440e-06  7.514        3
13228   U91328.19       6_20 7.348e-02  55.05 3.841e-05 -7.388        1
11207       HLA-C       6_26 6.211e-11  63.18 3.726e-14 -7.371        3
3043        SF3B1      2_117 8.725e-01  50.81 4.209e-04  7.265        1
2590          MDK      11_28 6.904e-01  48.58 3.184e-04 -7.159        1
10932     ZKSCAN8       6_22 1.209e-02  50.21 5.764e-06  7.127        2
Comparing z scores and PIPs
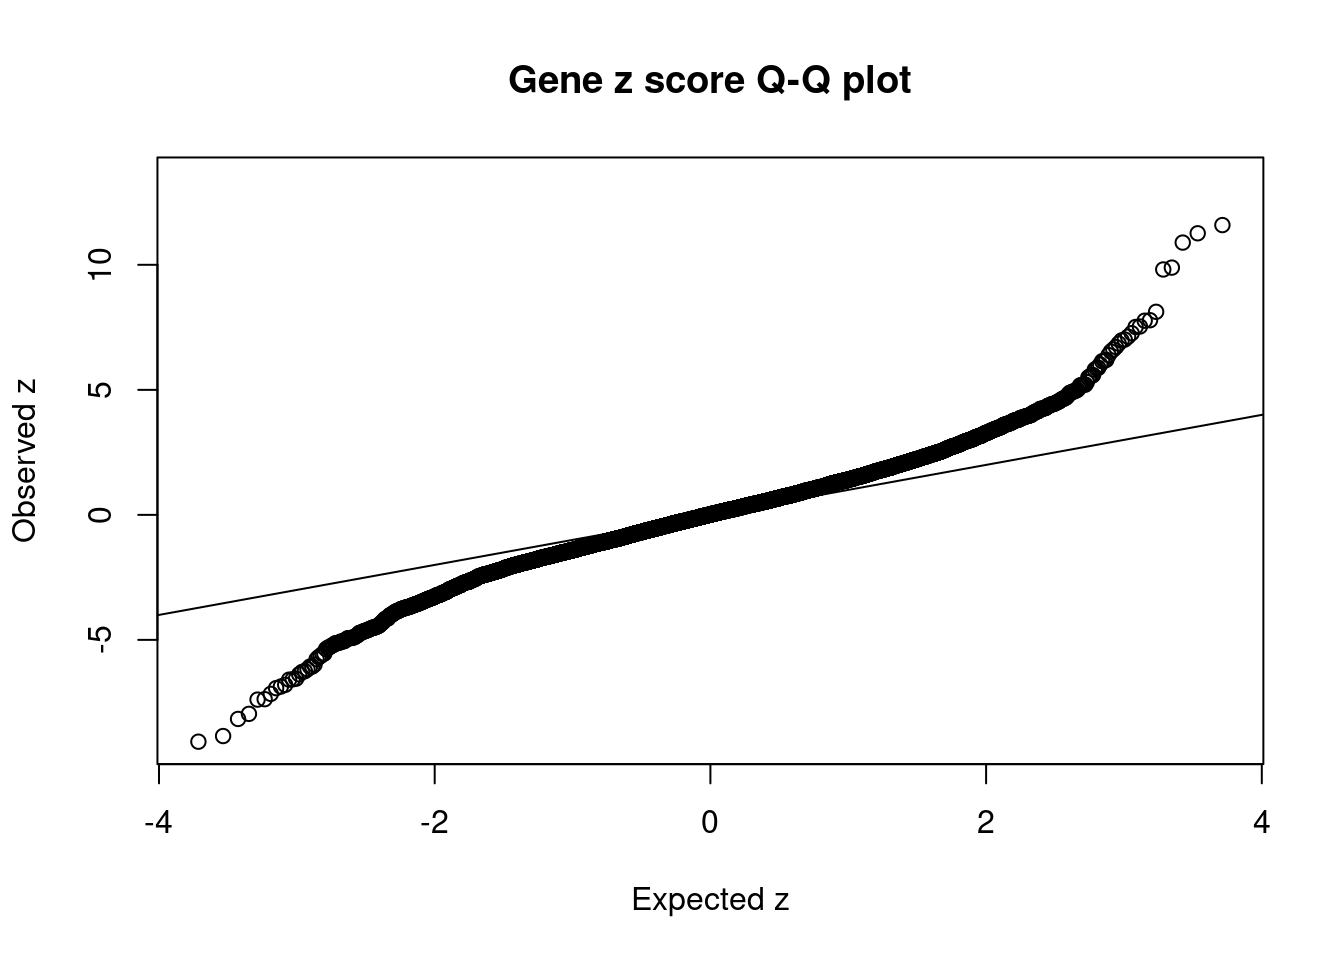
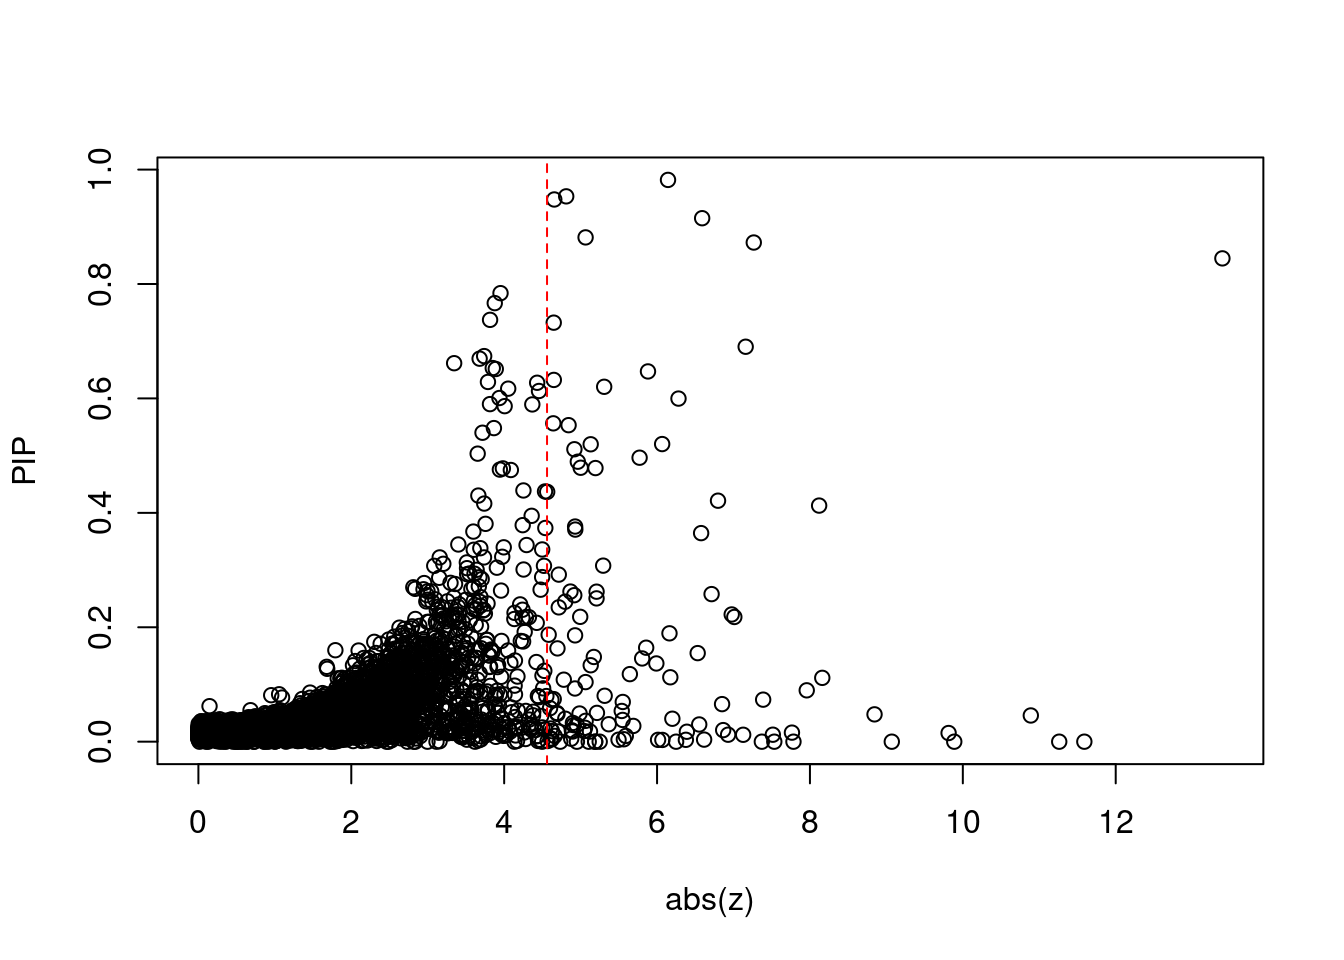
#proportion of significant z scores
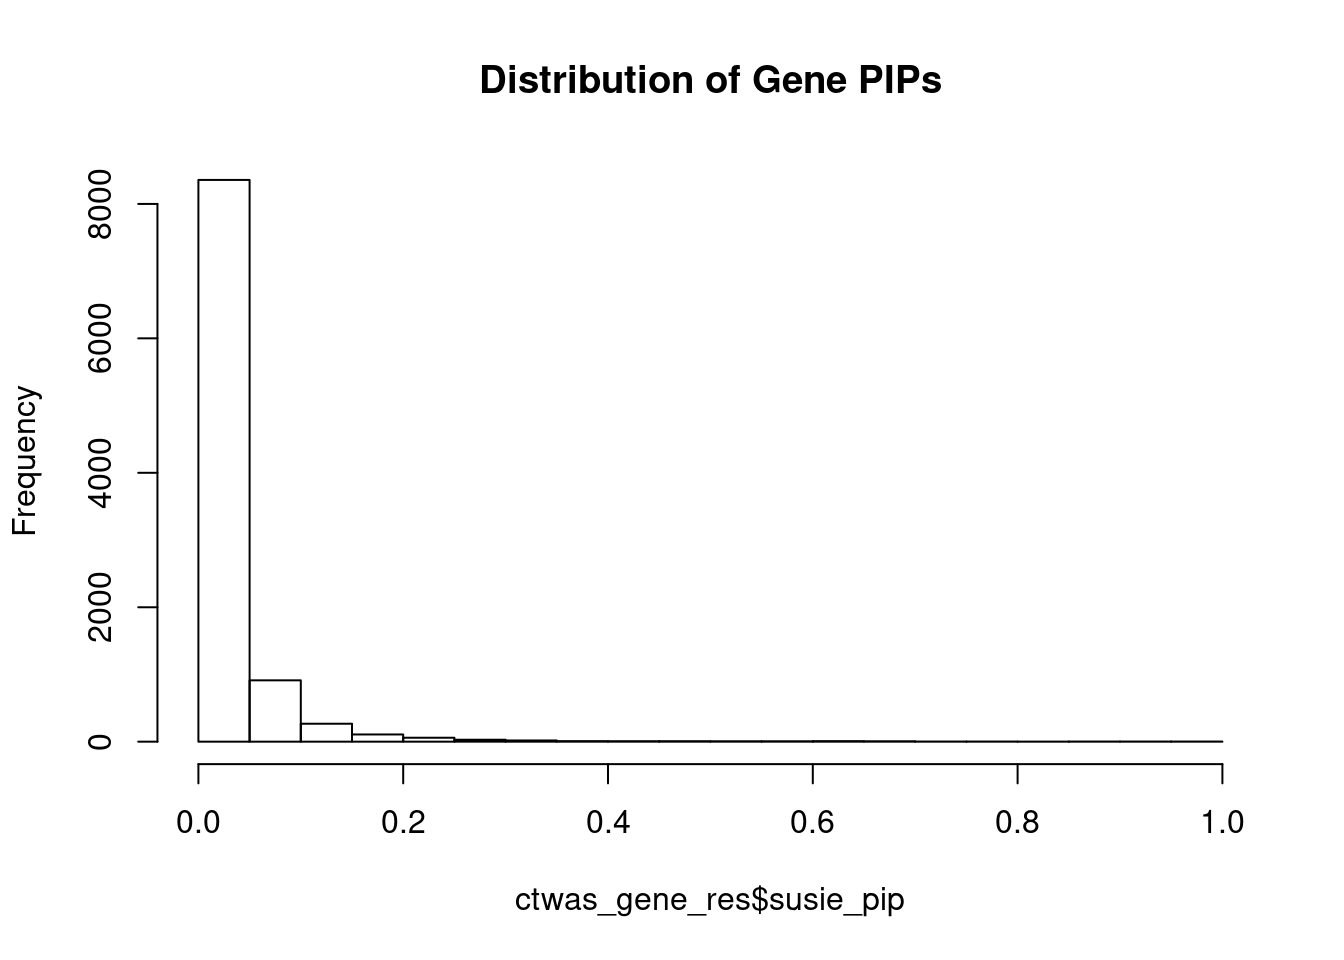
mean(abs(ctwas_gene_res$z) > sig_thresh)[1] 0.01244GO enrichment analysis for genes with PIP>0.5
#number of genes for gene set enrichment
length(genes)
[1] 37Uploading data to Enrichr... Done.
Querying GO_Biological_Process_2021... Done.
Querying GO_Cellular_Component_2021... Done.
Querying GO_Molecular_Function_2021... Done.
Parsing results... Done.
[1] "GO_Biological_Process_2021"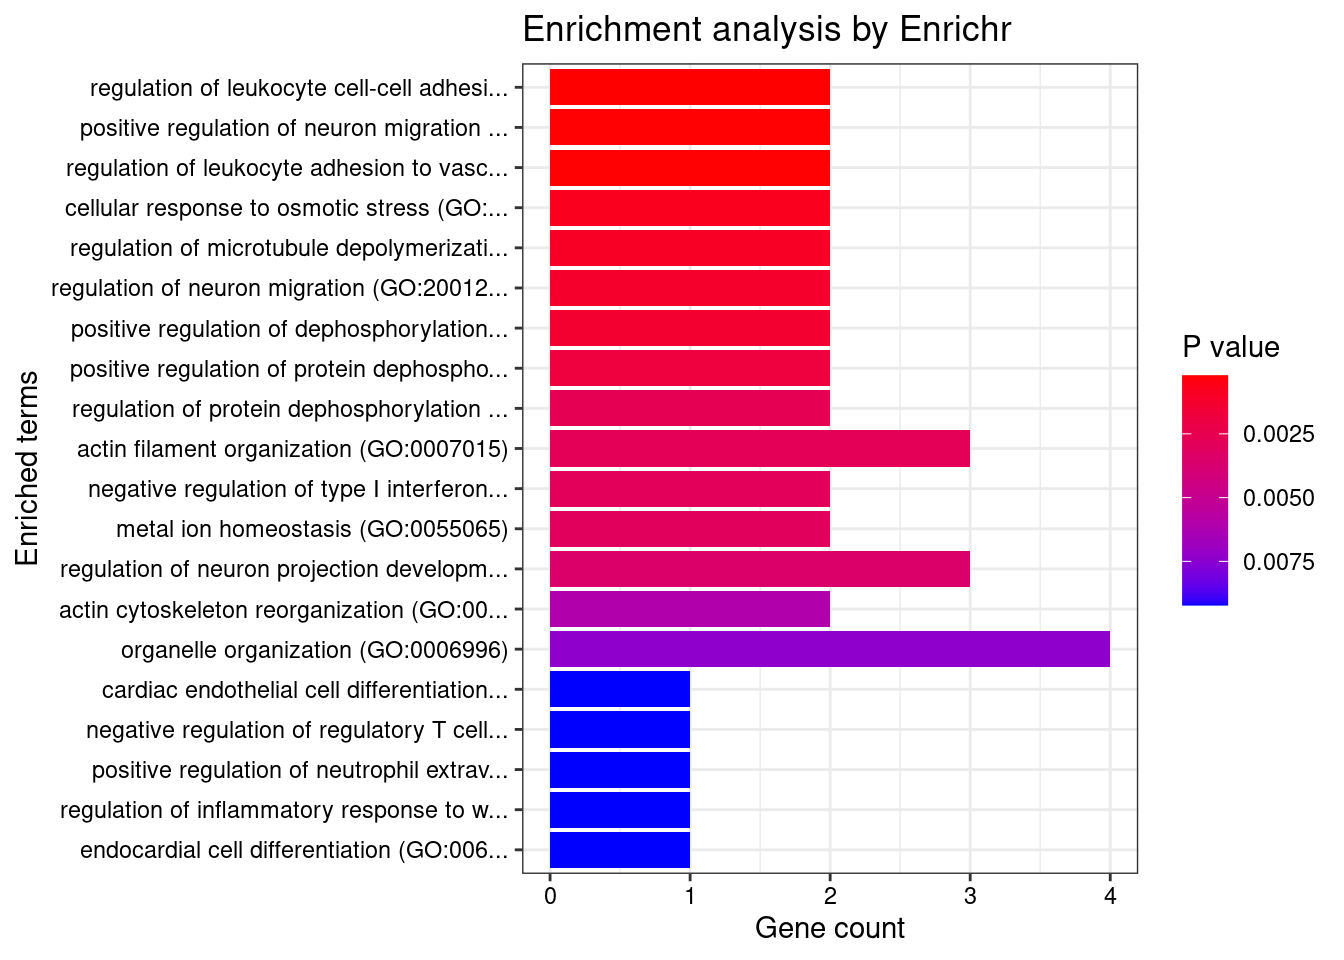
                                                                        Term
1                    regulation of leukocyte cell-cell adhesion (GO:1903037)
2                       positive regulation of neuron migration (GO:2001224)
3 regulation of leukocyte adhesion to vascular endothelial cell (GO:1904994)
  Overlap Adjusted.P.value       Genes
1    2/12          0.03453    FUT9;MDK
2    2/13          0.03453 MDK;ARHGEF2
3    2/13          0.03453    FUT9;MDK
[1] "GO_Cellular_Component_2021"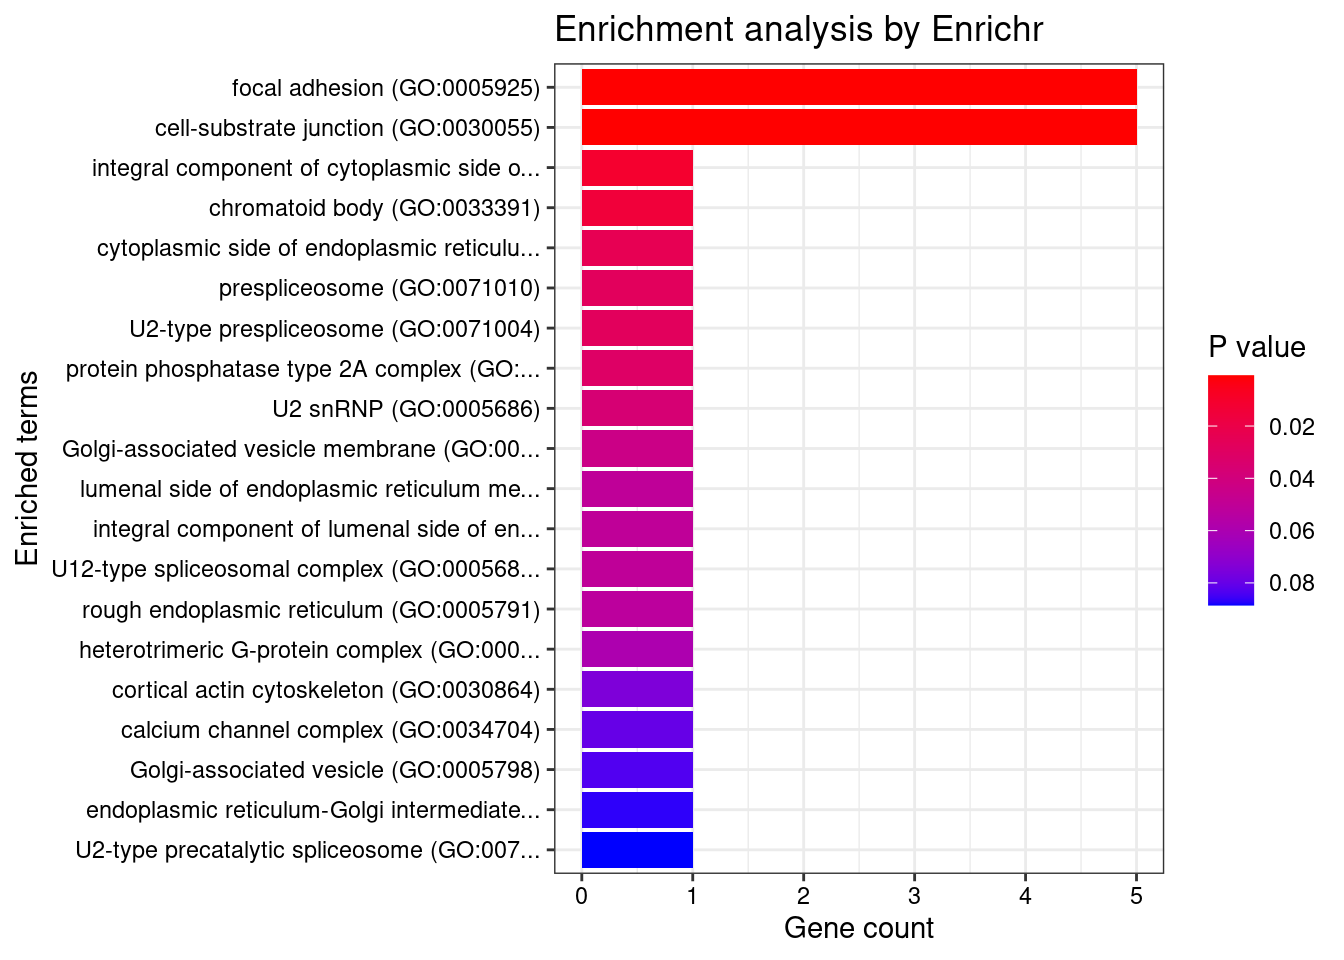
                                  Term Overlap Adjusted.P.value
1          focal adhesion (GO:0005925)   5/387          0.02064
2 cell-substrate junction (GO:0030055)   5/394          0.02064
                          Genes
1 EFS;RPL12;TRPV4;PCBP2;ARHGEF2
2 EFS;RPL12;TRPV4;PCBP2;ARHGEF2
[1] "GO_Molecular_Function_2021"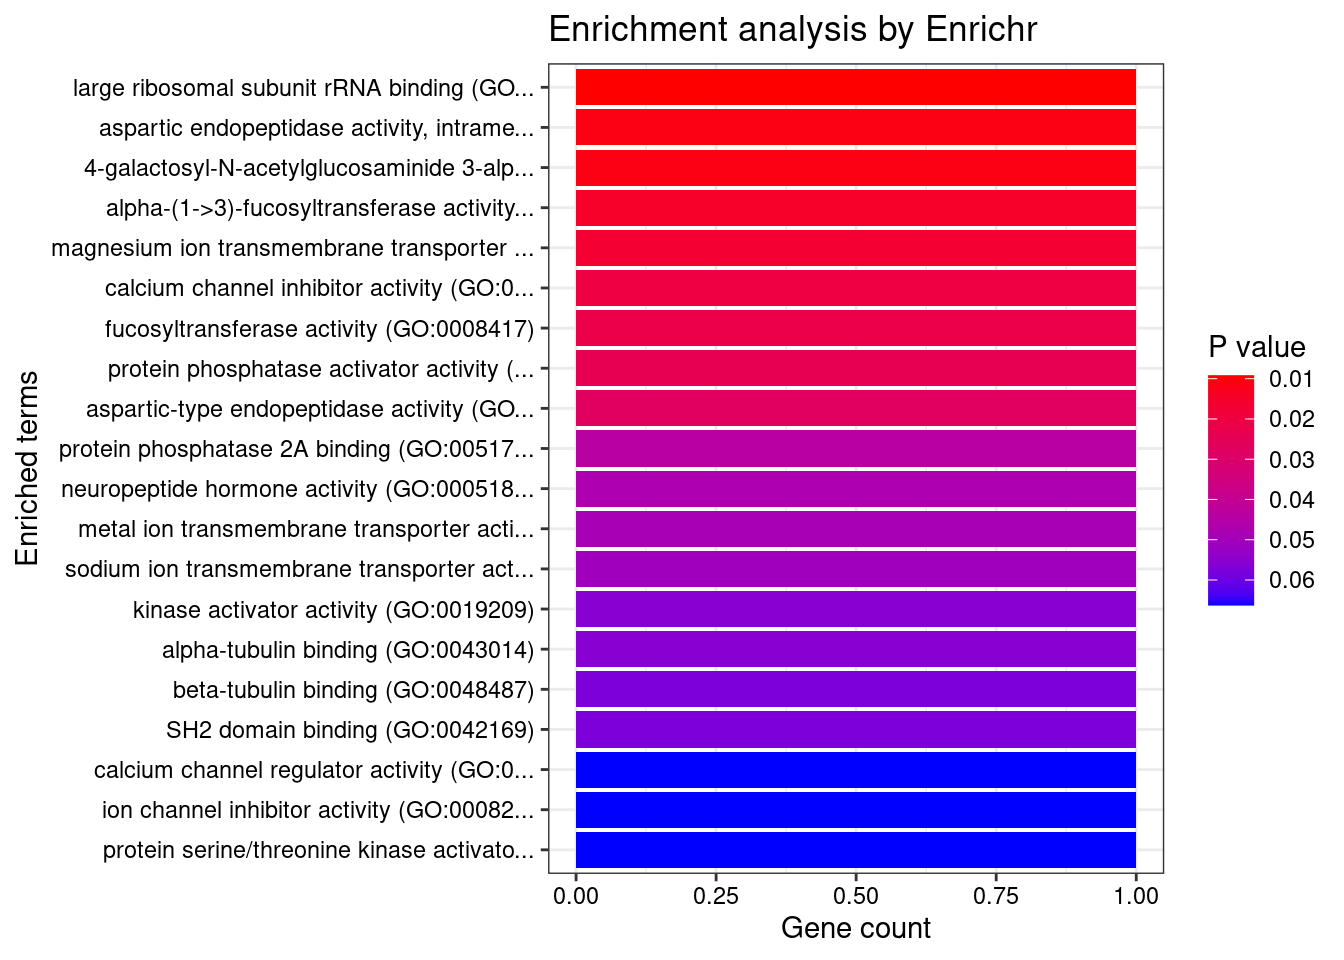
[1] Term             Overlap          Adjusted.P.value Genes
<0 rows> (or 0-length row.names)
DisGeNET enrichment analysis for genes with PIP>0.5
                                                              Description
10                                                              Confusion
47                                                      Speech impairment
48                                                          Derealization
52                          Spondylometaphyseal dysplasia, Kozlowski type
53                                                    Metatropic dwarfism
73                                                     Brachyolmia Type 3
78                                         Sexually disinhibited behavior
84                                                 Hypersomnia, Recurrent
100 SPINAL MUSCULAR ATROPHY, DISTAL, CONGENITAL NONPROGRESSIVE (disorder)
102                      HYPOTRICHOSIS-LYMPHEDEMA-TELANGIECTASIA SYNDROME
         FDR Ratio BgRatio
10  0.007273  1/14  1/9703
47  0.007273  1/14  1/9703
48  0.007273  1/14  1/9703
52  0.007273  1/14  1/9703
53  0.007273  1/14  1/9703
73  0.007273  1/14  1/9703
78  0.007273  1/14  1/9703
84  0.007273  1/14  1/9703
100 0.007273  1/14  1/9703
102 0.007273  1/14  1/9703
WebGestalt enrichment analysis for genes with PIP>0.5
Loading the functional categories...
Loading the ID list...
Loading the reference list...
Performing the enrichment analysis...
Warning in oraEnrichment(interestGeneList, referenceGeneList, geneSet, minNum =
minNum, : No significant gene set is identified based on FDR 0.05!NULLPIP Manhattan Plot
Warning: ggrepel: 4 unlabeled data points (too many overlaps). Consider
increasing max.overlaps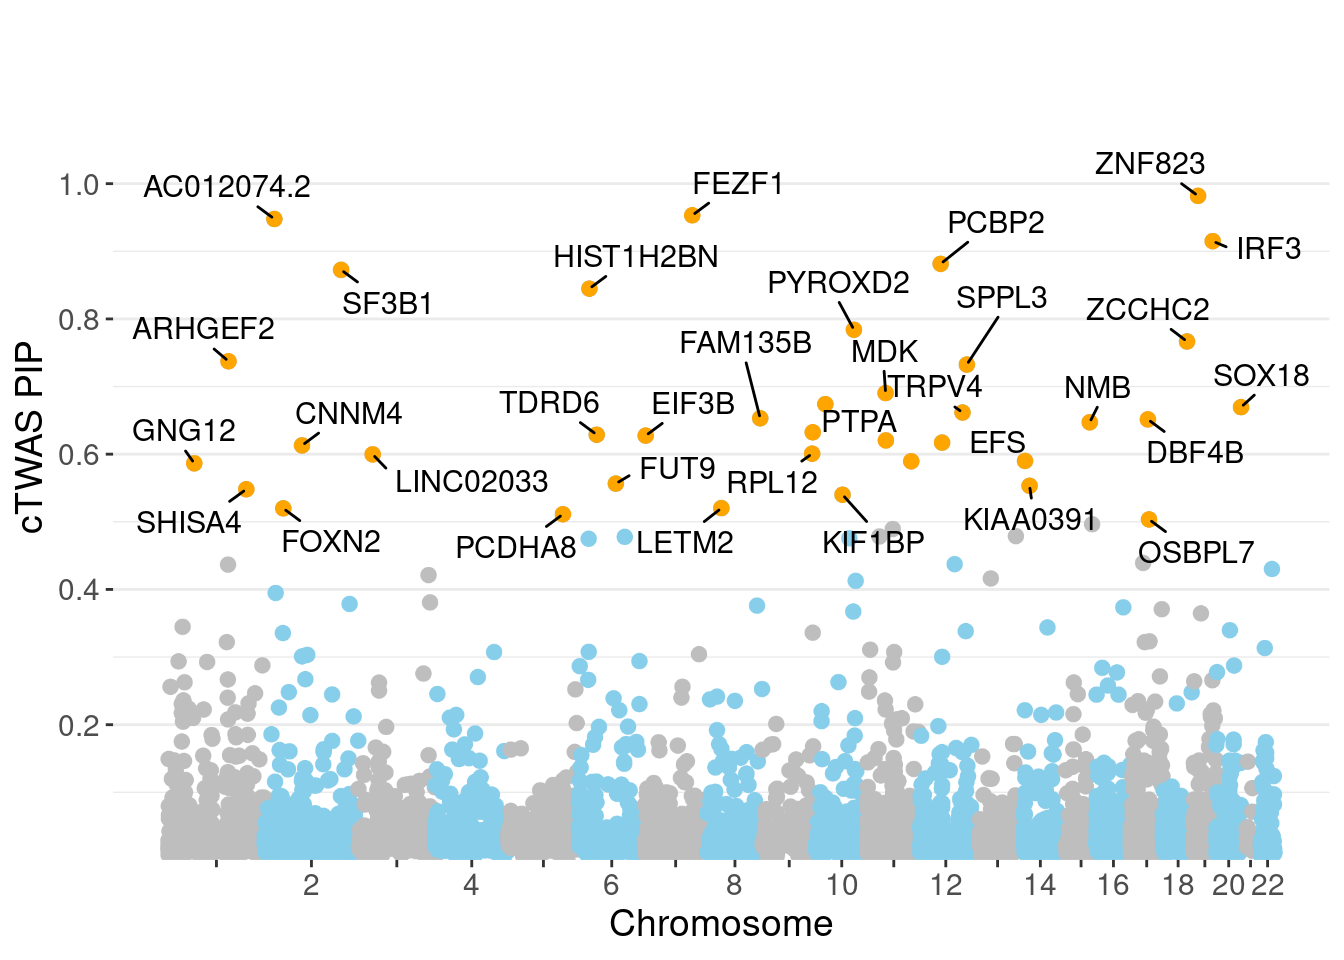
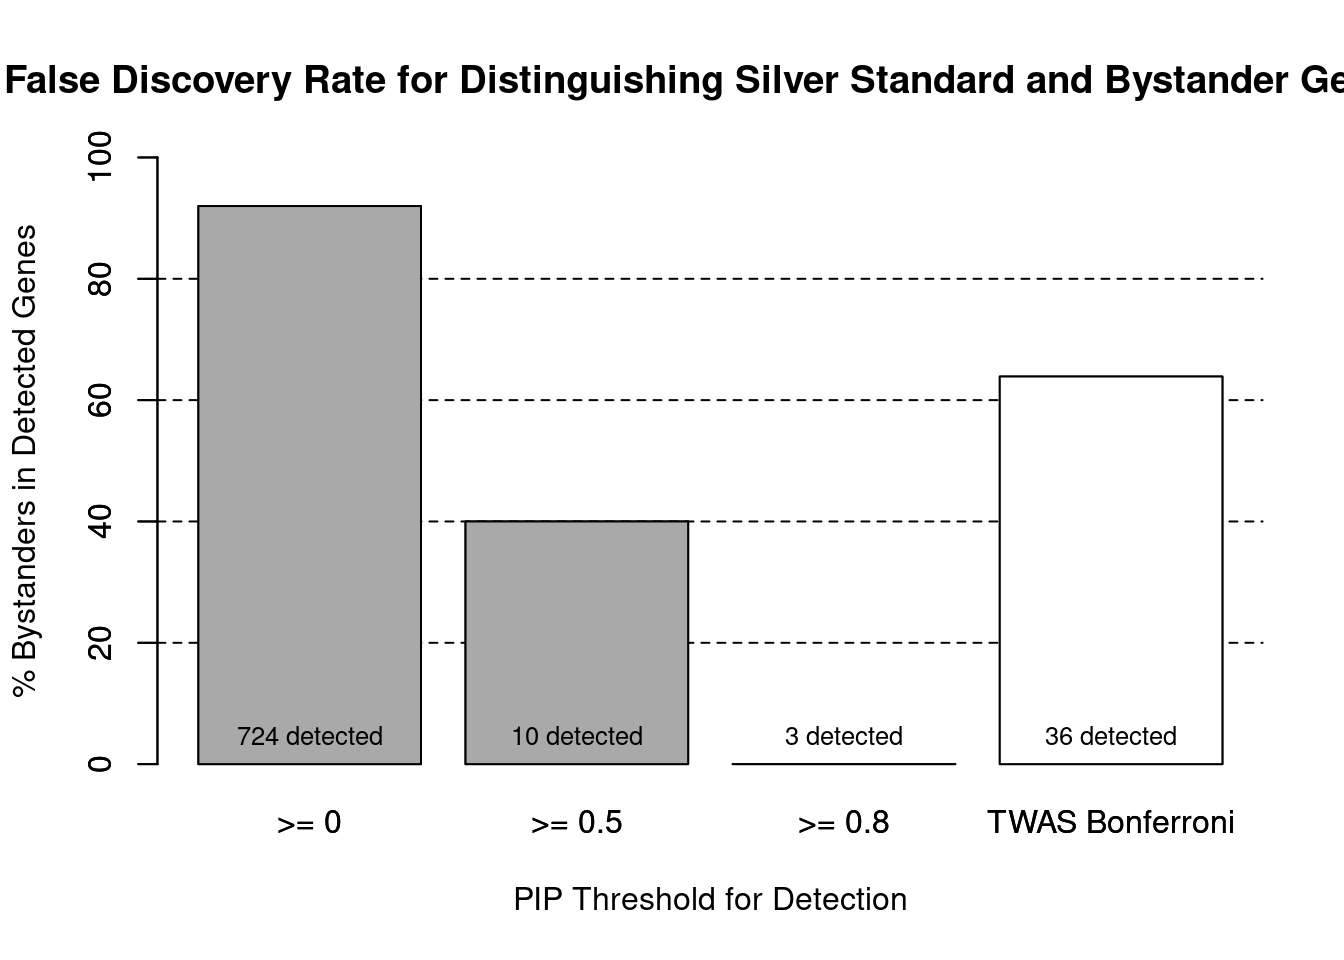
Sensitivity, specificity and precision for silver standard genes
#number of genes in known annotations
print(length(known_annotations))
[1] 130#number of genes in known annotations with imputed expression
print(sum(known_annotations %in% ctwas_gene_res$genename))[1] 58#significance threshold for TWAS
print(sig_thresh)[1] 4.561#number of ctwas genes
length(ctwas_genes)[1] 7#number of TWAS genes
length(twas_genes)[1] 122#show novel genes (ctwas genes with not in TWAS genes)
ctwas_gene_res[ctwas_gene_res$genename %in% novel_genes,report_cols][1] genename region_tag susie_pip mu2 PVE z num_eqtl
<0 rows> (or 0-length row.names)#sensitivity / recall
print(sensitivity) ctwas TWAS
0.02308 0.10000 #specificity
print(specificity) ctwas TWAS
0.9996 0.9888 #precision / PPV
print(precision) ctwas TWAS
0.4286 0.1066 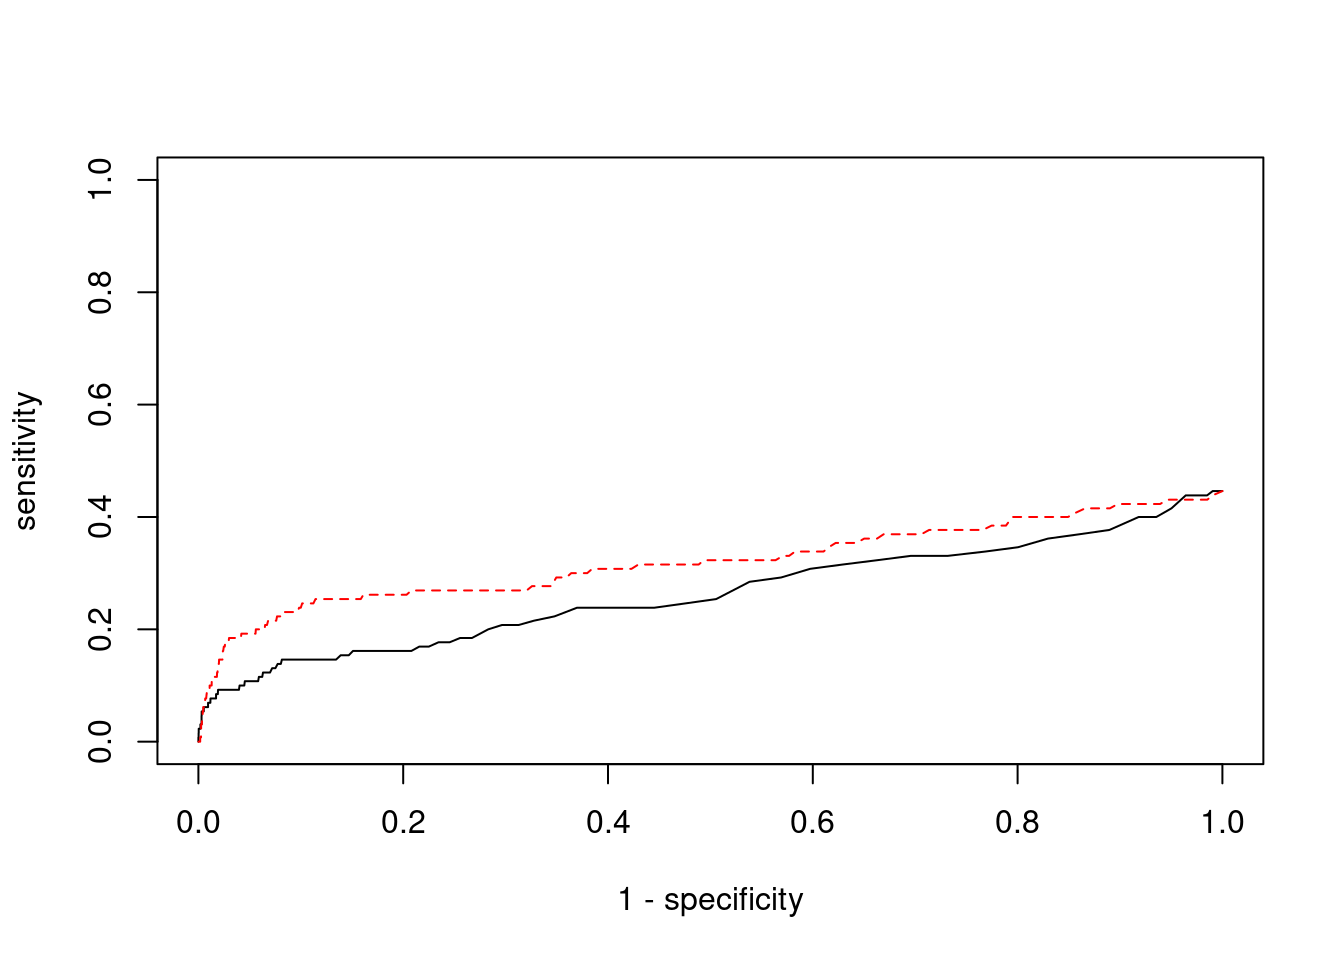
cTWAS is more precise than TWAS in distinguishing silver standard and bystander genes
#number of genes in known annotations (with imputed expression)
print(length(known_annotations))[1] 58#number of bystander genes (with imputed expression)
print(length(unrelated_genes))[1] 666#subset results to genes in known annotations or bystanders
ctwas_gene_res_subset <- ctwas_gene_res[ctwas_gene_res$genename %in% c(known_annotations, unrelated_genes),]
#assign ctwas and TWAS genes
ctwas_genes <- ctwas_gene_res_subset$genename[ctwas_gene_res_subset$susie_pip>0.8]
twas_genes <- ctwas_gene_res_subset$genename[abs(ctwas_gene_res_subset$z)>sig_thresh]
#significance threshold for TWAS
print(sig_thresh)
[1] 4.561#number of ctwas genes (in known annotations or bystanders)
length(ctwas_genes)[1] 3#number of TWAS genes (in known annotations or bystanders)
length(twas_genes)[1] 36#sensitivity / recall
sensitivity ctwas TWAS
0.05172 0.22414 #specificity / (1 - False Positive Rate)
specificity ctwas TWAS
1.0000 0.9655 #precision / PPV / (1 - False Discovery Rate)
precision ctwas TWAS
1.0000 0.3611 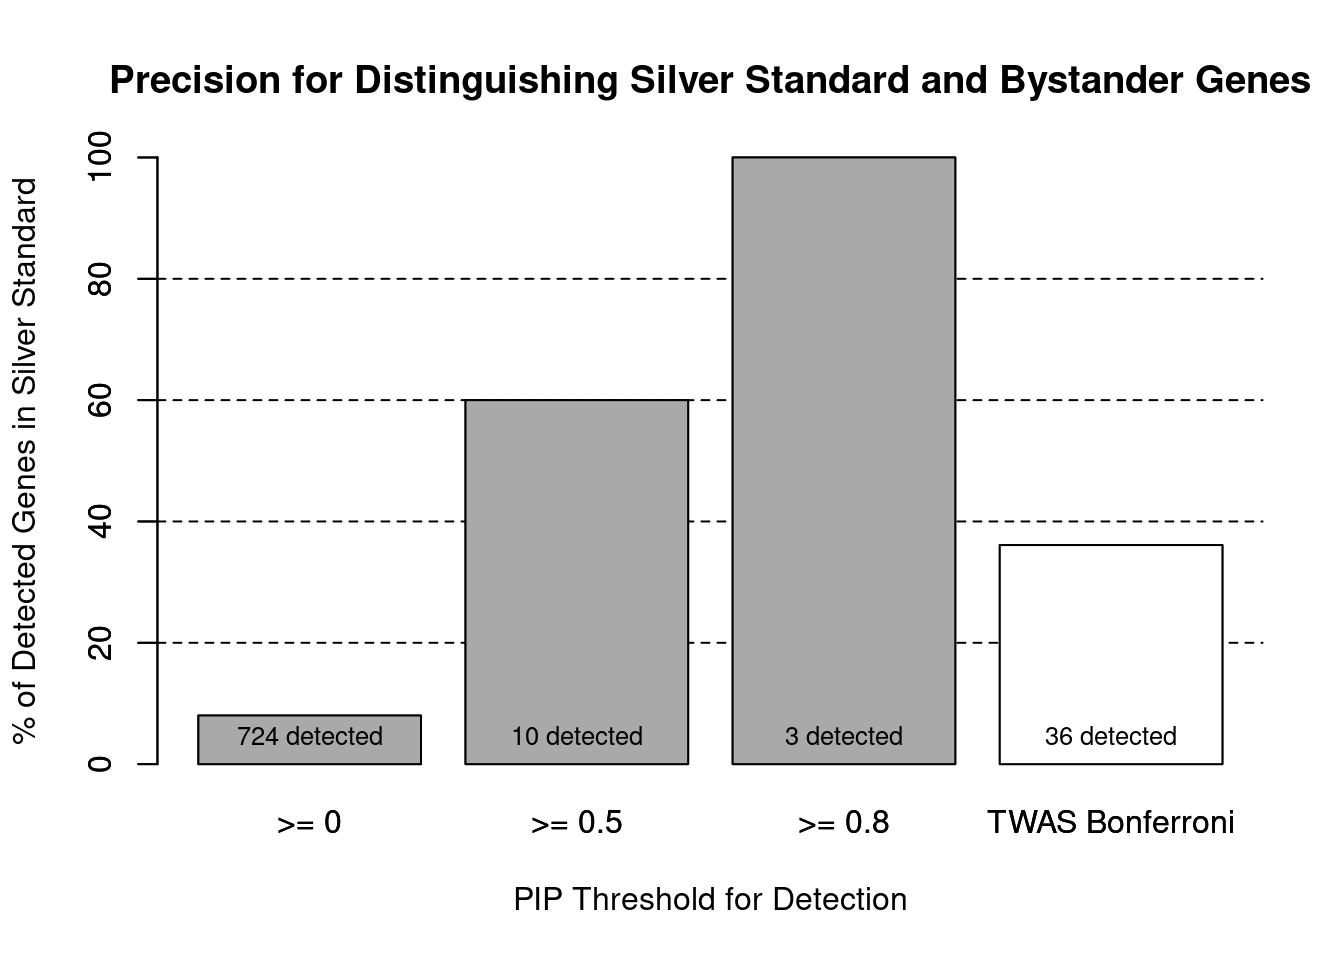
pip_range <- (0:1000)/1000
sensitivity <- rep(NA, length(pip_range))
specificity <- rep(NA, length(pip_range))

for (index in 1:length(pip_range)){
  pip <- pip_range[index]
  ctwas_genes <- ctwas_gene_res_subset$genename[ctwas_gene_res_subset$susie_pip>=pip]
  sensitivity[index] <- sum(ctwas_genes %in% known_annotations)/length(known_annotations)
  specificity[index] <- sum(!(unrelated_genes %in% ctwas_genes))/length(unrelated_genes)
}

plot(1-specificity, sensitivity, type="l", xlim=c(0,1), ylim=c(0,1), main="", xlab="1 - Specificity", ylab="Sensitivity")
title(expression("ROC Curve for cTWAS (black) and TWAS (" * phantom("red") * ")"))
title(expression(phantom("ROC Curve for cTWAS (black) and TWAS (") * "red" * phantom(")")), col.main="red")

sig_thresh_range <- seq(from=0, to=max(abs(ctwas_gene_res_subset$z)), length.out=length(pip_range))

for (index in 1:length(sig_thresh_range)){
  sig_thresh_plot <- sig_thresh_range[index]
  twas_genes <- ctwas_gene_res_subset$genename[abs(ctwas_gene_res_subset$z)>=sig_thresh_plot]
  sensitivity[index] <- sum(twas_genes %in% known_annotations)/length(known_annotations)
  specificity[index] <- sum(!(unrelated_genes %in% twas_genes))/length(unrelated_genes)
}

lines(1-specificity, sensitivity, xlim=c(0,1), ylim=c(0,1), col="red", lty=1)

abline(a=0,b=1,lty=3)

#add previously computed points from the analysis
ctwas_genes <- ctwas_gene_res_subset$genename[ctwas_gene_res_subset$susie_pip>0.8]
twas_genes <- ctwas_gene_res_subset$genename[abs(ctwas_gene_res_subset$z)>sig_thresh]

points(1-specificity_plot["ctwas"], sensitivity_plot["ctwas"], pch=21, bg="black")
points(1-specificity_plot["TWAS"], sensitivity_plot["TWAS"], pch=21, bg="red")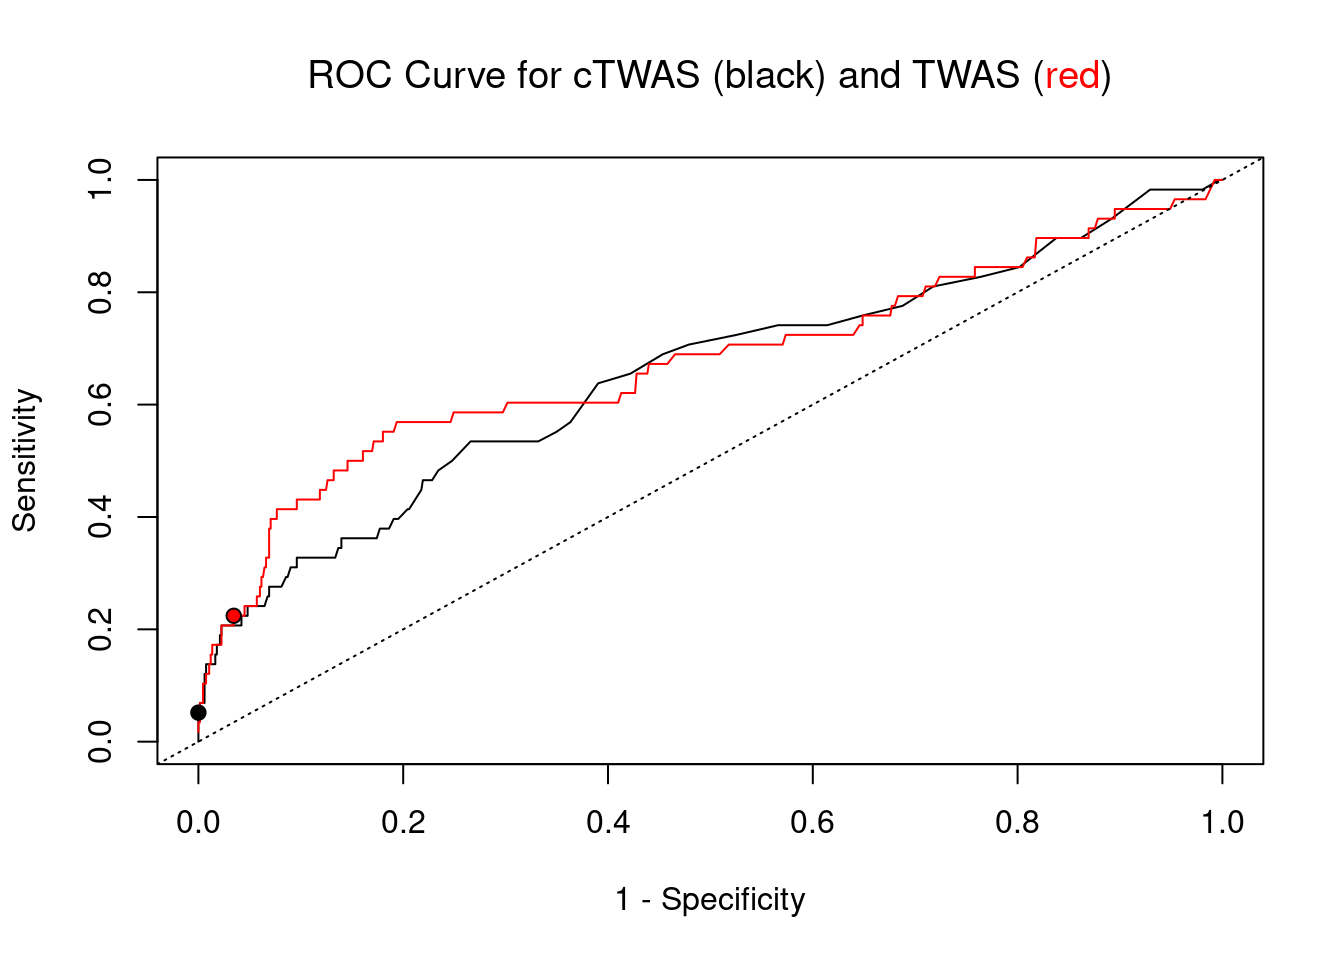
Undetected silver standard genes have low TWAS z-scores or stronger signal from nearby variants
#table of outcomes for silver standard genes
-sort(-table(silver_standard_case))
silver_standard_case
Not Imputed Insignificant z-score Nearby SNP(s)
72 45 10
Detected (PIP > 0.8)
3 #show inconclusive genes
silver_standard_case[silver_standard_case=="Inconclusive"]named character(0)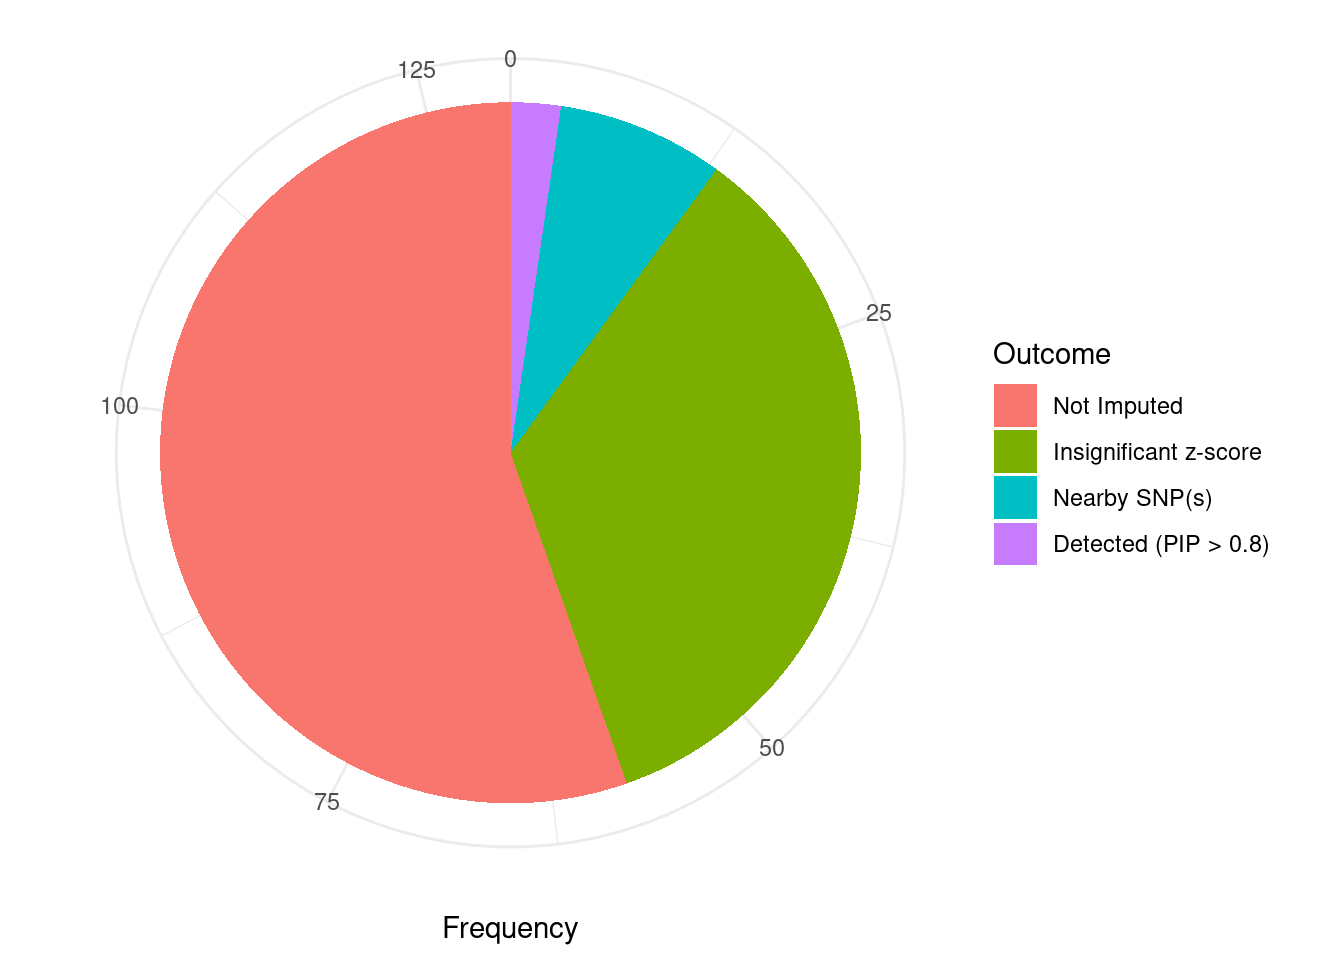
sessionInfo()R version 3.6.1 (2019-07-05)
Platform: x86_64-pc-linux-gnu (64-bit)
Running under: Scientific Linux 7.4 (Nitrogen)
Matrix products: default
BLAS/LAPACK: /software/openblas-0.2.19-el7-x86_64/lib/libopenblas_haswellp-r0.2.19.so
locale:
[1] LC_CTYPE=en_US.UTF-8 LC_NUMERIC=C
[3] LC_TIME=en_US.UTF-8 LC_COLLATE=en_US.UTF-8
[5] LC_MONETARY=en_US.UTF-8 LC_MESSAGES=en_US.UTF-8
[7] LC_PAPER=en_US.UTF-8 LC_NAME=C
[9] LC_ADDRESS=C LC_TELEPHONE=C
[11] LC_MEASUREMENT=en_US.UTF-8 LC_IDENTIFICATION=C
attached base packages:
[1] parallel stats4 stats graphics grDevices utils datasets
[8] methods base
other attached packages:
[1] GenomicRanges_1.36.1 GenomeInfoDb_1.20.0 IRanges_2.18.1
[4] S4Vectors_0.22.1 BiocGenerics_0.30.0 biomaRt_2.40.1
[7] readxl_1.3.1 forcats_0.5.1 stringr_1.4.0
[10] dplyr_1.0.7 purrr_0.3.4 readr_2.1.1
[13] tidyr_1.1.4 tidyverse_1.3.1 tibble_3.1.6
[16] WebGestaltR_0.4.4 disgenet2r_0.99.2 enrichR_3.0
[19] cowplot_1.1.1 ggplot2_3.3.5 workflowr_1.7.0
loaded via a namespace (and not attached):
[1] ggbeeswarm_0.6.0 colorspace_2.0-2 rjson_0.2.20
[4] ellipsis_0.3.2 rprojroot_2.0.2 XVector_0.24.0
[7] fs_1.5.2 rstudioapi_0.13 farver_2.1.0
[10] ggrepel_0.9.1 bit64_4.0.5 AnnotationDbi_1.46.0
[13] fansi_1.0.2 lubridate_1.8.0 xml2_1.3.3
[16] codetools_0.2-16 doParallel_1.0.17 cachem_1.0.6
[19] knitr_1.36 jsonlite_1.7.2 apcluster_1.4.8
[22] Cairo_1.5-12.2 broom_0.7.10 dbplyr_2.1.1
[25] compiler_3.6.1 httr_1.4.2 backports_1.4.1
[28] assertthat_0.2.1 Matrix_1.2-18 fastmap_1.1.0
[31] cli_3.1.0 later_0.8.0 prettyunits_1.1.1
[34] htmltools_0.5.2 tools_3.6.1 igraph_1.2.10
[37] GenomeInfoDbData_1.2.1 gtable_0.3.0 glue_1.6.2
[40] reshape2_1.4.4 doRNG_1.8.2 Rcpp_1.0.8
[43] Biobase_2.44.0 cellranger_1.1.0 jquerylib_0.1.4
[46] vctrs_0.3.8 svglite_1.2.2 iterators_1.0.14
[49] xfun_0.29 ps_1.6.0 rvest_1.0.2
[52] lifecycle_1.0.1 rngtools_1.5.2 XML_3.99-0.3
[55] zlibbioc_1.30.0 getPass_0.2-2 scales_1.1.1
[58] vroom_1.5.7 hms_1.1.1 promises_1.0.1
[61] yaml_2.2.1 curl_4.3.2 memoise_2.0.1
[64] ggrastr_1.0.1 gdtools_0.1.9 stringi_1.7.6
[67] RSQLite_2.2.8 highr_0.9 foreach_1.5.2
[70] rlang_1.0.1 pkgconfig_2.0.3 bitops_1.0-7
[73] evaluate_0.14 lattice_0.20-38 labeling_0.4.2
[76] bit_4.0.4 processx_3.5.2 tidyselect_1.1.1
[79] plyr_1.8.6 magrittr_2.0.2 R6_2.5.1
[82] generics_0.1.1 DBI_1.1.2 pillar_1.6.4
[85] haven_2.4.3 whisker_0.3-2 withr_2.4.3
[88] RCurl_1.98-1.5 modelr_0.1.8 crayon_1.5.0
[91] utf8_1.2.2 tzdb_0.2.0 rmarkdown_2.11
[94] progress_1.2.2 grid_3.6.1 data.table_1.14.2
[97] blob_1.2.2 callr_3.7.0 git2r_0.26.1
[100] reprex_2.0.1 digest_0.6.29 httpuv_1.5.1
[103] munsell_0.5.0 beeswarm_0.2.3 vipor_0.4.5