SCZ - Brain Hippocampus
sheng Qian
2021-2-6
Last updated: 2022-03-16
Checks: 5 2
Knit directory: cTWAS_analysis/
This reproducible R Markdown analysis was created with workflowr (version 1.7.0). The Checks tab describes the reproducibility checks that were applied when the results were created. The Past versions tab lists the development history.
The R Markdown is untracked by Git. To know which version of the R Markdown file created these results, you’ll want to first commit it to the Git repo. If you’re still working on the analysis, you can ignore this warning. When you’re finished, you can run wflow_publish to commit the R Markdown file and build the HTML.
Great job! The global environment was empty. Objects defined in the global environment can affect the analysis in your R Markdown file in unknown ways. For reproduciblity it’s best to always run the code in an empty environment.
The command set.seed(20211220) was run prior to running the code in the R Markdown file. Setting a seed ensures that any results that rely on randomness, e.g. subsampling or permutations, are reproducible.
Great job! Recording the operating system, R version, and package versions is critical for reproducibility.
Nice! There were no cached chunks for this analysis, so you can be confident that you successfully produced the results during this run.
Using absolute paths to the files within your workflowr project makes it difficult for you and others to run your code on a different machine. Change the absolute path(s) below to the suggested relative path(s) to make your code more reproducible.
| absolute | relative |
|---|---|
| /project2/xinhe/shengqian/cTWAS/cTWAS_analysis/data/ | data |
| /project2/xinhe/shengqian/cTWAS/cTWAS_analysis/code/ctwas_config.R | code/ctwas_config.R |
Great! You are using Git for version control. Tracking code development and connecting the code version to the results is critical for reproducibility.
The results in this page were generated with repository version d57314b. See the Past versions tab to see a history of the changes made to the R Markdown and HTML files.
Note that you need to be careful to ensure that all relevant files for the analysis have been committed to Git prior to generating the results (you can use wflow_publish or wflow_git_commit). workflowr only checks the R Markdown file, but you know if there are other scripts or data files that it depends on. Below is the status of the Git repository when the results were generated:
Ignored files:
    Ignored:    .ipynb_checkpoints/
    Ignored:    data/AF/

Untracked files:
    Untracked:  Rplot.png
    Untracked:  analysis/.ipynb_checkpoints/
    Untracked:  analysis/SCZ_2020_Brain_Amygdala.Rmd
    Untracked:  analysis/SCZ_2020_Brain_Anterior_cingulate_cortex_BA24.Rmd
    Untracked:  analysis/SCZ_2020_Brain_Caudate_basal_ganglia.Rmd
    Untracked:  analysis/SCZ_2020_Brain_Cerebellar_Hemisphere.Rmd
    Untracked:  analysis/SCZ_2020_Brain_Cerebellum.Rmd
    Untracked:  analysis/SCZ_2020_Brain_Hippocampus.Rmd
    Untracked:  analysis/SCZ_2020_Brain_Nucleus_accumbens_basal_ganglia.Rmd
    Untracked:  analysis/SCZ_2020_Brain_Spinal_cord_cervical_c-1.Rmd
    Untracked:  analysis/SCZ_2020_Brain_Substantia_nigra.Rmd
    Untracked:  code/.ipynb_checkpoints/
    Untracked:  code/AF_out/
    Untracked:  code/Autism_out/
    Untracked:  code/BMI_S_out/
    Untracked:  code/BMI_out/
    Untracked:  code/Glucose_out/
    Untracked:  code/LDL_S_out/
    Untracked:  code/SCZ_2014_EUR_out/
    Untracked:  code/SCZ_2020_out/
    Untracked:  code/SCZ_S_out/
    Untracked:  code/SCZ_out/
    Untracked:  code/T2D_out/
    Untracked:  code/ctwas_config.R
    Untracked:  code/mapping.R
    Untracked:  code/out/
    Untracked:  code/run_AF_analysis.sbatch
    Untracked:  code/run_AF_analysis.sh
    Untracked:  code/run_AF_ctwas_rss_LDR.R
    Untracked:  code/run_Autism_analysis.sbatch
    Untracked:  code/run_Autism_analysis.sh
    Untracked:  code/run_Autism_ctwas_rss_LDR.R
    Untracked:  code/run_BMI_analysis.sbatch
    Untracked:  code/run_BMI_analysis.sh
    Untracked:  code/run_BMI_analysis_S.sbatch
    Untracked:  code/run_BMI_analysis_S.sh
    Untracked:  code/run_BMI_ctwas_rss_LDR.R
    Untracked:  code/run_BMI_ctwas_rss_LDR_S.R
    Untracked:  code/run_Glucose_analysis.sbatch
    Untracked:  code/run_Glucose_analysis.sh
    Untracked:  code/run_Glucose_ctwas_rss_LDR.R
    Untracked:  code/run_LDL_analysis_S.sbatch
    Untracked:  code/run_LDL_analysis_S.sh
    Untracked:  code/run_LDL_ctwas_rss_LDR_S.R
    Untracked:  code/run_SCZ_2014_EUR_analysis.sbatch
    Untracked:  code/run_SCZ_2014_EUR_analysis.sh
    Untracked:  code/run_SCZ_2014_EUR_ctwas_rss_LDR.R
    Untracked:  code/run_SCZ_2020_analysis.sbatch
    Untracked:  code/run_SCZ_2020_analysis.sh
    Untracked:  code/run_SCZ_2020_ctwas_rss_LDR.R
    Untracked:  code/run_SCZ_analysis.sbatch
    Untracked:  code/run_SCZ_analysis.sh
    Untracked:  code/run_SCZ_analysis_S.sbatch
    Untracked:  code/run_SCZ_analysis_S.sh
    Untracked:  code/run_SCZ_ctwas_rss_LDR.R
    Untracked:  code/run_SCZ_ctwas_rss_LDR_S.R
    Untracked:  code/run_T2D_analysis.sbatch
    Untracked:  code/run_T2D_analysis.sh
    Untracked:  code/run_T2D_ctwas_rss_LDR.R
    Untracked:  code/wflow_build.R
    Untracked:  code/wflow_build.sbatch
    Untracked:  data/.ipynb_checkpoints/
    Untracked:  data/BMI/
    Untracked:  data/PGC3_SCZ_wave3_public.v2.tsv
    Untracked:  data/SCZ/
    Untracked:  data/SCZ_2014_EUR/
    Untracked:  data/SCZ_2020/
    Untracked:  data/SCZ_S/
    Untracked:  data/T2D/
    Untracked:  data/UKBB/
    Untracked:  data/UKBB_SNPs_Info.text
    Untracked:  data/gene_OMIM.txt
    Untracked:  data/gene_pip_0.8.txt
    Untracked:  data/mashr_Heart_Atrial_Appendage.db
    Untracked:  data/mashr_sqtl/
    Untracked:  data/summary_known_genes_annotations.xlsx
    Untracked:  data/untitled.txt

Unstaged changes:
    Modified:   analysis/SCZ_2020_Brain_Cortex.Rmd
    Modified:   analysis/SCZ_2020_Brain_Frontal_Cortex_BA9.Rmd
    Modified:   analysis/SCZ_2020_Brain_Hypothalamus.Rmd
    Modified:   analysis/SCZ_2020_Brain_Putamen_basal_ganglia.Rmd
Note that any generated files, e.g. HTML, png, CSS, etc., are not included in this status report because it is ok for generated content to have uncommitted changes.
There are no past versions. Publish this analysis with wflow_publish() to start tracking its development.
Weight QC
#number of imputed weights
nrow(qclist_all)
[1] 10982#number of imputed weights by chromosome
table(qclist_all$chr)
   1    2    3    4    5    6    7    8    9   10   11   12   13   14   15   16
1073  766  643  425  536  614  506  404  414  437  662  613  219  376  368  514
  17   18   19   20   21   22
 661  165  859  332  117  278
#number of imputed weights without missing variants
sum(qclist_all$nmiss==0)[1] 8766#proportion of imputed weights without missing variants
mean(qclist_all$nmiss==0)[1] 0.7982Check convergence of parameters
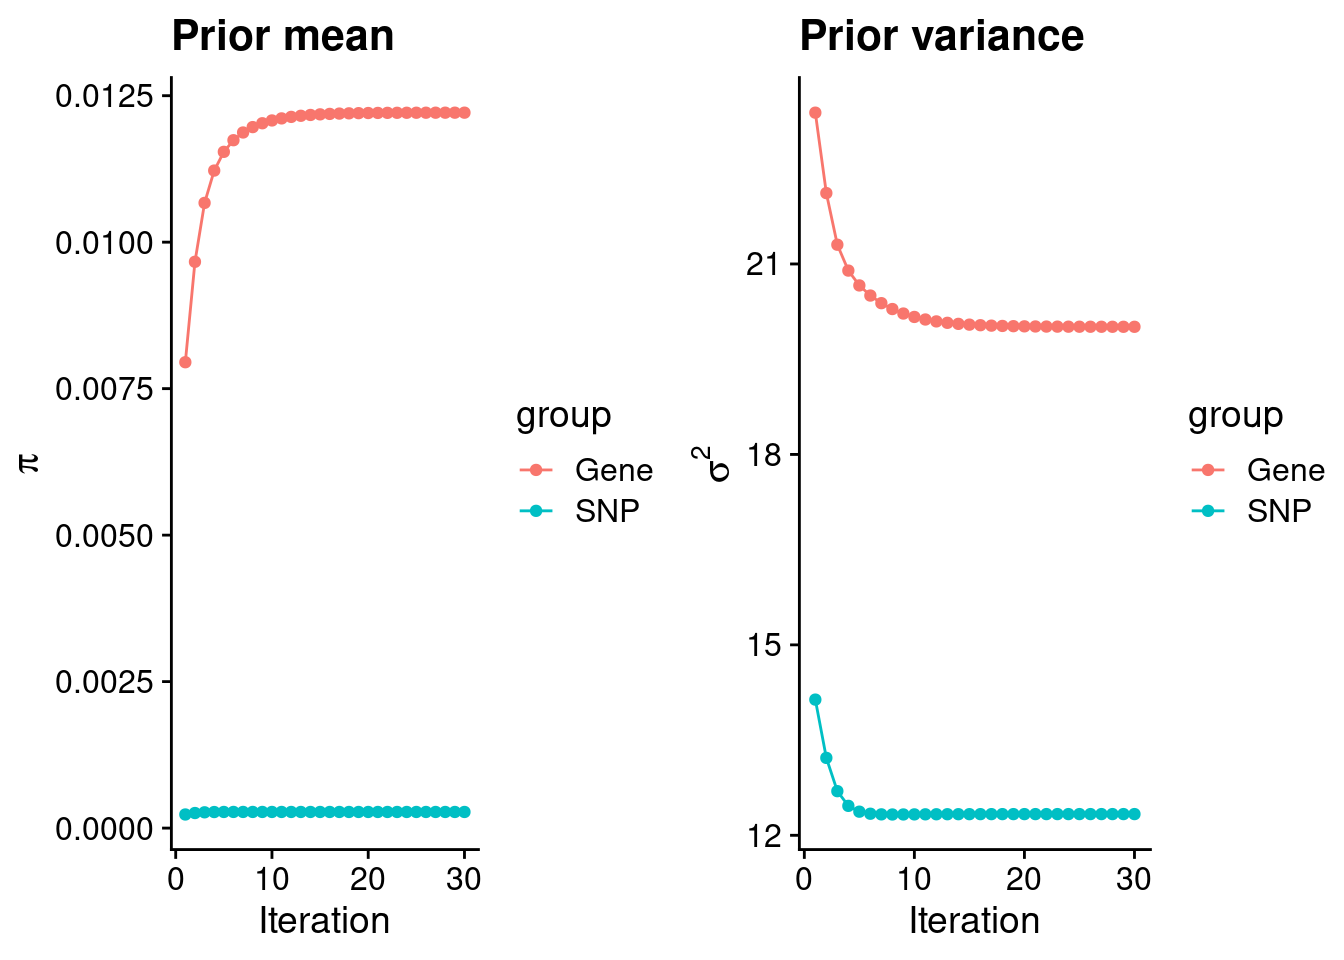
#estimated group prior
estimated_group_prior <- group_prior_rec[,ncol(group_prior_rec)]
names(estimated_group_prior) <- c("gene", "snp")
estimated_group_prior["snp"] <- estimated_group_prior["snp"]*thin #adjust parameter to account for thin argument
print(estimated_group_prior)
gene snp
0.0122103 0.0002749 #estimated group prior variance
estimated_group_prior_var <- group_prior_var_rec[,ncol(group_prior_var_rec)]
names(estimated_group_prior_var) <- c("gene", "snp")
print(estimated_group_prior_var) gene snp
20.01 12.33 #report sample size
print(sample_size)[1] 161405#report group size
group_size <- c(nrow(ctwas_gene_res), n_snps)
print(group_size)[1] 10982 7394310#estimated group PVE
estimated_group_pve <- estimated_group_prior_var*estimated_group_prior*group_size/sample_size #check PVE calculation
names(estimated_group_pve) <- c("gene", "snp")
print(estimated_group_pve) gene snp
0.01662 0.15536 #compare sum(PIP*mu2/sample_size) with above PVE calculation
c(sum(ctwas_gene_res$PVE),sum(ctwas_snp_res$PVE))[1] 0.05229 0.79965Genes with highest PIPs
       genename region_tag susie_pip     mu2       PVE      z num_eqtl
9365     LSMEM2       3_35    0.9999 1155.66 0.0071596  4.271        1
10687    ZNF823      19_10    0.9838   41.72 0.0002543  6.311        1
2925     ACTR1B       2_57    0.9648   32.65 0.0001952 -5.640        2
11759 HIST1H2BN       6_21    0.9439  194.49 0.0011373 13.182        1
2583      TRPV4      12_66    0.9313   26.68 0.0001539  4.456        2
10694     RPL12       9_66    0.8931   24.30 0.0001345  4.671        2
901      KLHL20       1_85    0.8889   39.92 0.0002199  5.800        1
9488    METTL23      17_43    0.8866   23.19 0.0001274  4.235        1
8759    MAP3K11      11_36    0.8600   34.41 0.0001833 -5.570        1
357       NSUN2        5_6    0.8535   22.20 0.0001174 -4.105        3
5229   C12orf10      12_33    0.8528   24.93 0.0001317 -4.963        1
5977    FAM135B       8_91    0.8516   23.00 0.0001213 -3.461        1
2373      NUP88       17_5    0.8482   28.00 0.0001471  4.765        1
7971     CACNB3      12_32    0.8257   23.40 0.0001197 -3.941        2
6860        ACE      17_37    0.8194   34.16 0.0001734 -5.802        1
3272      ABCG2       4_59    0.8050   21.38 0.0001066 -3.954        1
4606      DAGLA      11_35    0.7909   24.00 0.0001176 -4.263        1
8540      CXXC5       5_82    0.7734   32.98 0.0001580 -5.620        1
11534 LINC00606        3_8    0.7586   23.20 0.0001090 -4.150        1
9119       LY6H       8_94    0.7577   29.41 0.0001380  5.143        1
Genes with largest effect sizes
         genename region_tag susie_pip     mu2       PVE        z num_eqtl
9365       LSMEM2       3_35 9.999e-01 1155.66 7.160e-03   4.2709        1
201        SEMA3B       3_35 1.528e-05 1136.66 1.076e-07   1.0870        1
10261     SLC38A3       3_35 2.154e-07  273.81 3.653e-10  -2.7756        1
123      CACNA2D2       3_35 1.241e-06  258.74 1.989e-09  -0.1392        1
10         SEMA3F       3_35 1.595e-07  249.41 2.465e-10  -1.4379        1
40           RBM6       3_35 6.623e-01  209.39 8.592e-04   4.4688        1
10101       HYAL3       3_35 6.148e-08  198.84 7.574e-11  -1.8436        2
11759   HIST1H2BN       6_21 9.439e-01  194.49 1.137e-03  13.1822        1
12024        NAT6       3_35 2.290e-07  180.42 2.560e-10   0.8292        1
6779      ZSCAN12       6_22 6.233e-01  170.52 6.585e-04  12.8250        1
7425        MST1R       3_35 1.250e-04  155.83 1.207e-07  -4.0250        1
13065 RP1-86C11.7       6_21 1.130e-01  133.35 9.340e-05 -10.5382        1
1182        DOCK3       3_35 2.161e-06  128.31 1.718e-09  -0.3011        1
2889         CISH       3_35 7.474e-07  124.47 5.764e-10  -0.1383        1
12628  CTA-14H9.5       6_20 1.210e-02  120.91 9.061e-06   9.8443        1
4941        FLOT1       6_24 3.037e-02  118.32 2.226e-05 -10.5577        1
10071      BTN3A2       6_20 1.452e-02  110.88 9.972e-06   9.0193        2
7420       RNF123       3_35 5.818e-08  102.19 3.684e-11  -2.3622        1
9448    HIST1H2BC       6_20 1.208e-02   86.81 6.496e-06  -7.9928        1
10999        VWA7       6_26 4.905e-01   86.62 2.632e-04  10.5945        1
Genes with highest PVE
       genename region_tag susie_pip     mu2       PVE      z num_eqtl
9365     LSMEM2       3_35    0.9999 1155.66 0.0071596  4.271        1
11759 HIST1H2BN       6_21    0.9439  194.49 0.0011373 13.182        1
40         RBM6       3_35    0.6623  209.39 0.0008592  4.469        1
6779    ZSCAN12       6_22    0.6233  170.52 0.0006585 12.825        1
12006   HLA-DMB       6_27    0.5544   80.44 0.0002763 -9.474        1
10999      VWA7       6_26    0.4905   86.62 0.0002632 10.594        1
7966    GATAD2A      19_15    0.7512   55.30 0.0002574 -7.430        2
10687    ZNF823      19_10    0.9838   41.72 0.0002543  6.311        1
7391       GNL3       3_36    0.6233   62.90 0.0002429  9.102        2
901      KLHL20       1_85    0.8889   39.92 0.0002199  5.800        1
2925     ACTR1B       2_57    0.9648   32.65 0.0001952 -5.640        2
8759    MAP3K11      11_36    0.8600   34.41 0.0001833 -5.570        1
1736   PPP1R16B      20_23    0.5822   50.79 0.0001832  7.550        1
6860        ACE      17_37    0.8194   34.16 0.0001734 -5.802        1
7908      PDIA3      15_16    0.6620   39.22 0.0001608  6.314        1
8540      CXXC5       5_82    0.7734   32.98 0.0001580 -5.620        1
10969   HLA-DMA       6_27    0.3201   79.05 0.0001568 -9.408        1
910       NT5C2      10_66    0.4488   56.09 0.0001560 -9.584        2
4482      TMTC1      12_20    0.6119   40.87 0.0001549  6.192        1
2583      TRPV4      12_66    0.9313   26.68 0.0001539  4.456        2
Genes with largest z scores
         genename region_tag susie_pip    mu2       PVE       z num_eqtl
11759   HIST1H2BN       6_21 0.9438741 194.49 1.137e-03  13.182        1
6779      ZSCAN12       6_22 0.6232611 170.52 6.585e-04  12.825        1
10999        VWA7       6_26 0.4905408  86.62 2.632e-04  10.594        1
4941        FLOT1       6_24 0.0303682 118.32 2.226e-05 -10.558        1
13065 RP1-86C11.7       6_21 0.1130468 133.35 9.340e-05 -10.538        1
12063         C4A       6_26 0.1575984  85.02 8.302e-05  10.504        2
12628  CTA-14H9.5       6_20 0.0120960 120.91 9.061e-06   9.844        1
6064        CNNM2      10_66 0.1001205  53.83 3.339e-05  -9.686        1
910         NT5C2      10_66 0.4487794  56.09 1.560e-04  -9.584        2
11006        APOM       6_26 0.0054508  73.07 2.468e-06   9.579        2
12006     HLA-DMB       6_27 0.5544120  80.44 2.763e-04  -9.474        1
10969     HLA-DMA       6_27 0.3200844  79.05 1.568e-04  -9.408        1
10981       PRRT1       6_26 0.0109939  59.83 4.075e-06   9.276        1
10979        RNF5       6_26 0.0108010  59.55 3.985e-06   9.267        1
7391         GNL3       3_36 0.6233135  62.90 2.429e-04   9.102        2
10071      BTN3A2       6_20 0.0145171 110.88 9.972e-06   9.019        2
6186        ABCB9      12_75 0.0008569  66.15 3.512e-07   8.638        1
8097       GLYCTK       3_36 0.1279415  74.32 5.891e-05   8.577        1
9772        KMT5A      12_75 0.0008842  55.06 3.016e-07  -8.551        2
10546     ZSCAN26       6_22 0.0153736  65.33 6.222e-06   8.138        2
Comparing z scores and PIPs
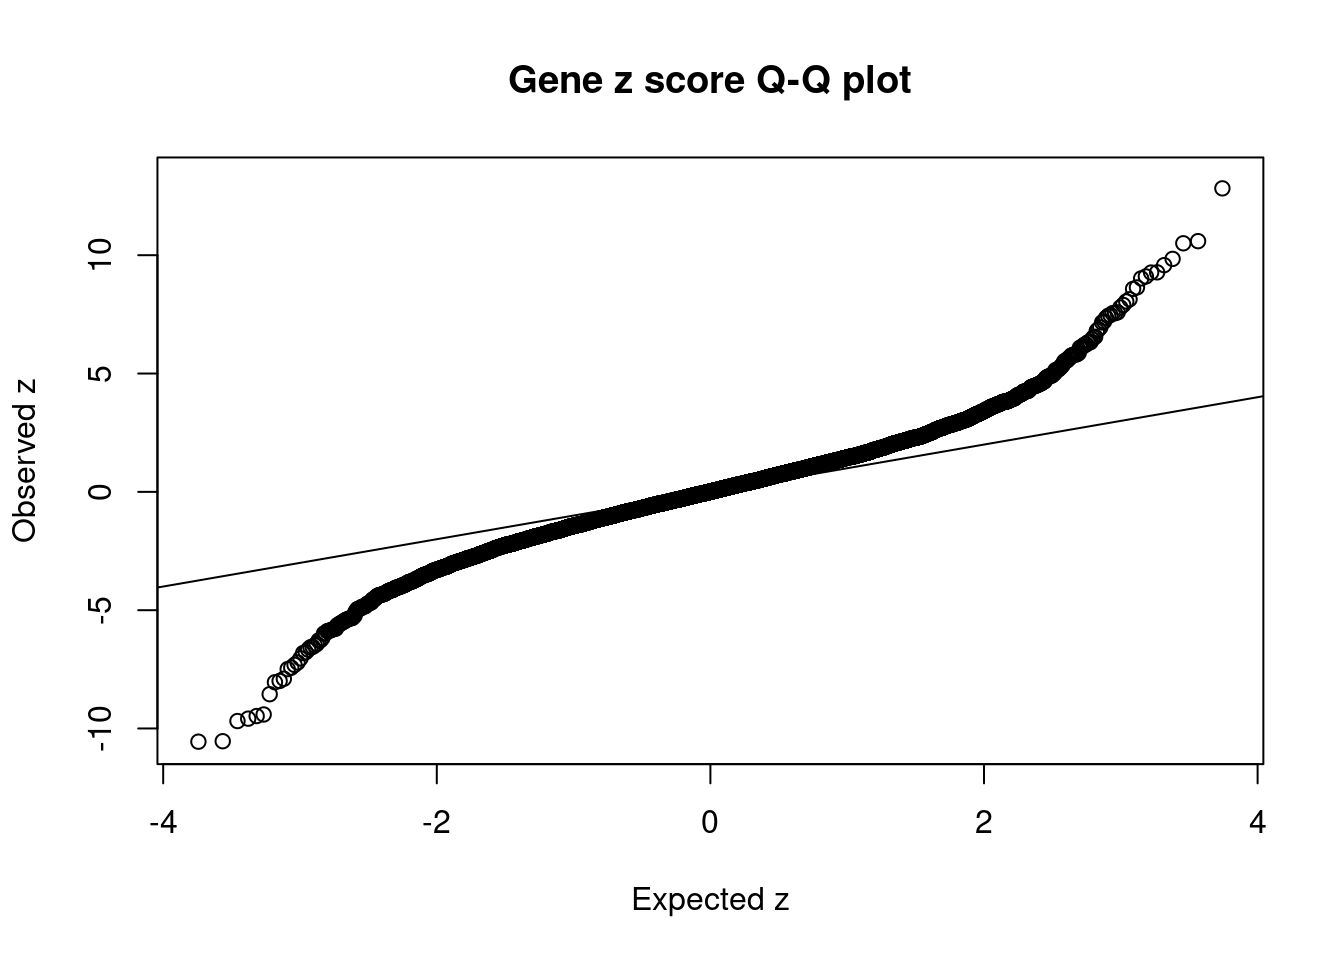
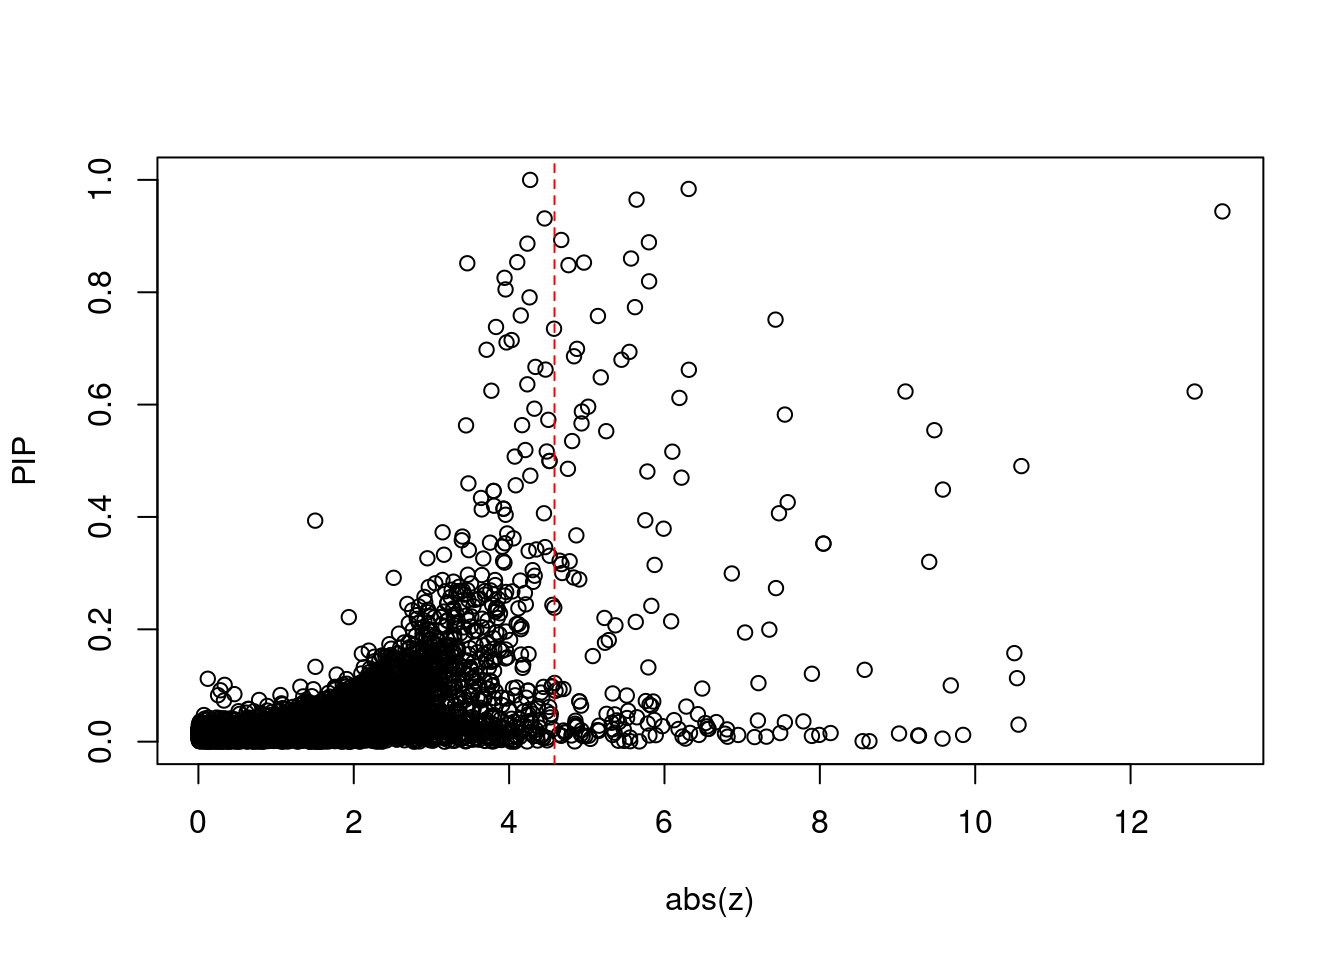
[1] 0.01457GO enrichment analysis for genes with PIP>0.5
#number of genes for gene set enrichment
length(genes)
[1] 54Uploading data to Enrichr... Done.
Querying GO_Biological_Process_2021... Done.
Querying GO_Cellular_Component_2021... Done.
Querying GO_Molecular_Function_2021... Done.
Parsing results... Done.
[1] "GO_Biological_Process_2021"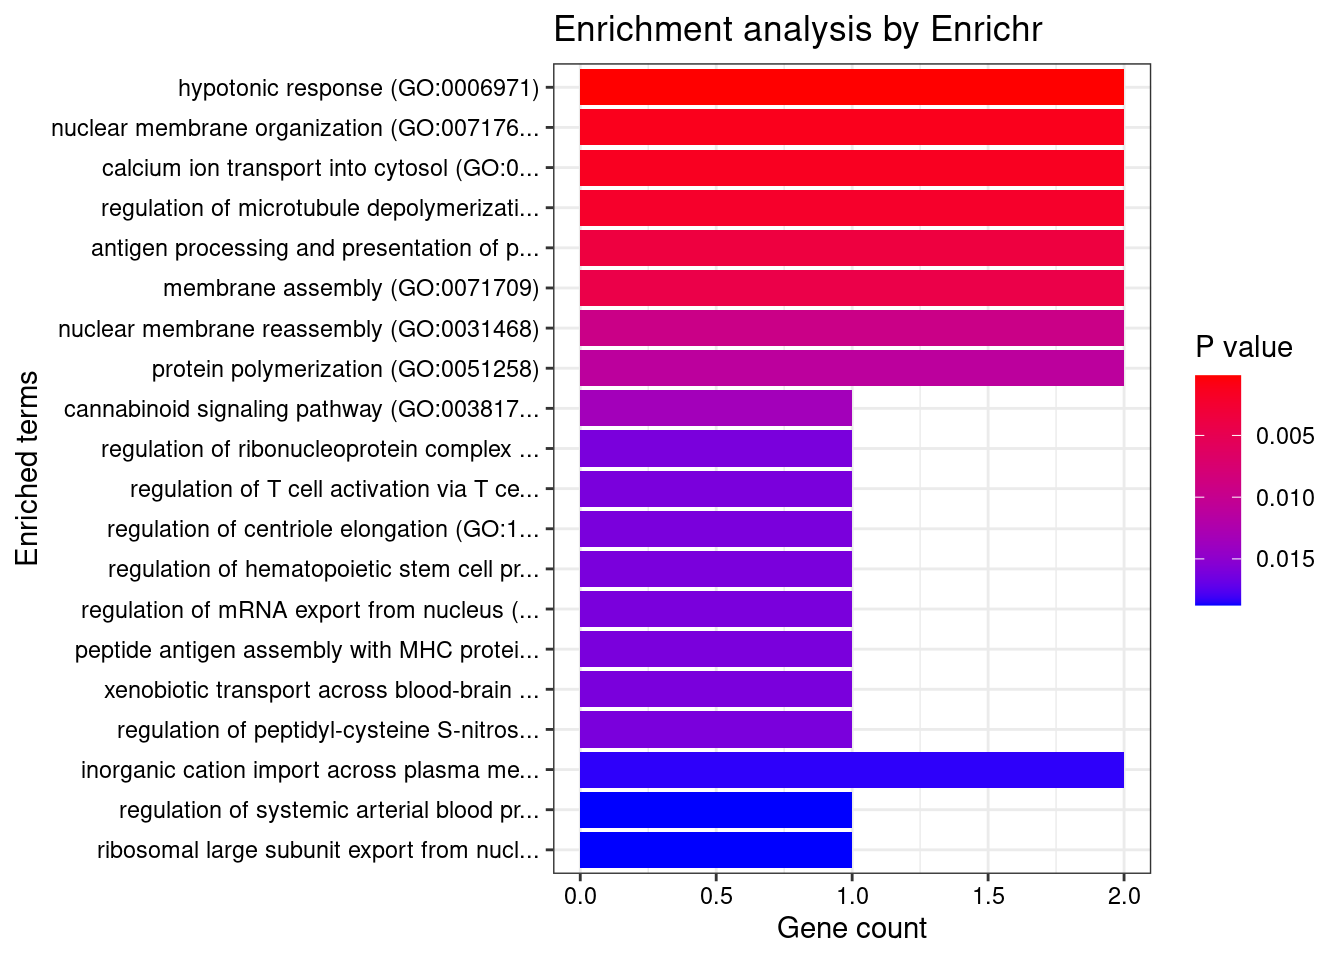
[1] Term             Overlap          Adjusted.P.value Genes
<0 rows> (or 0-length row.names)
[1] "GO_Cellular_Component_2021"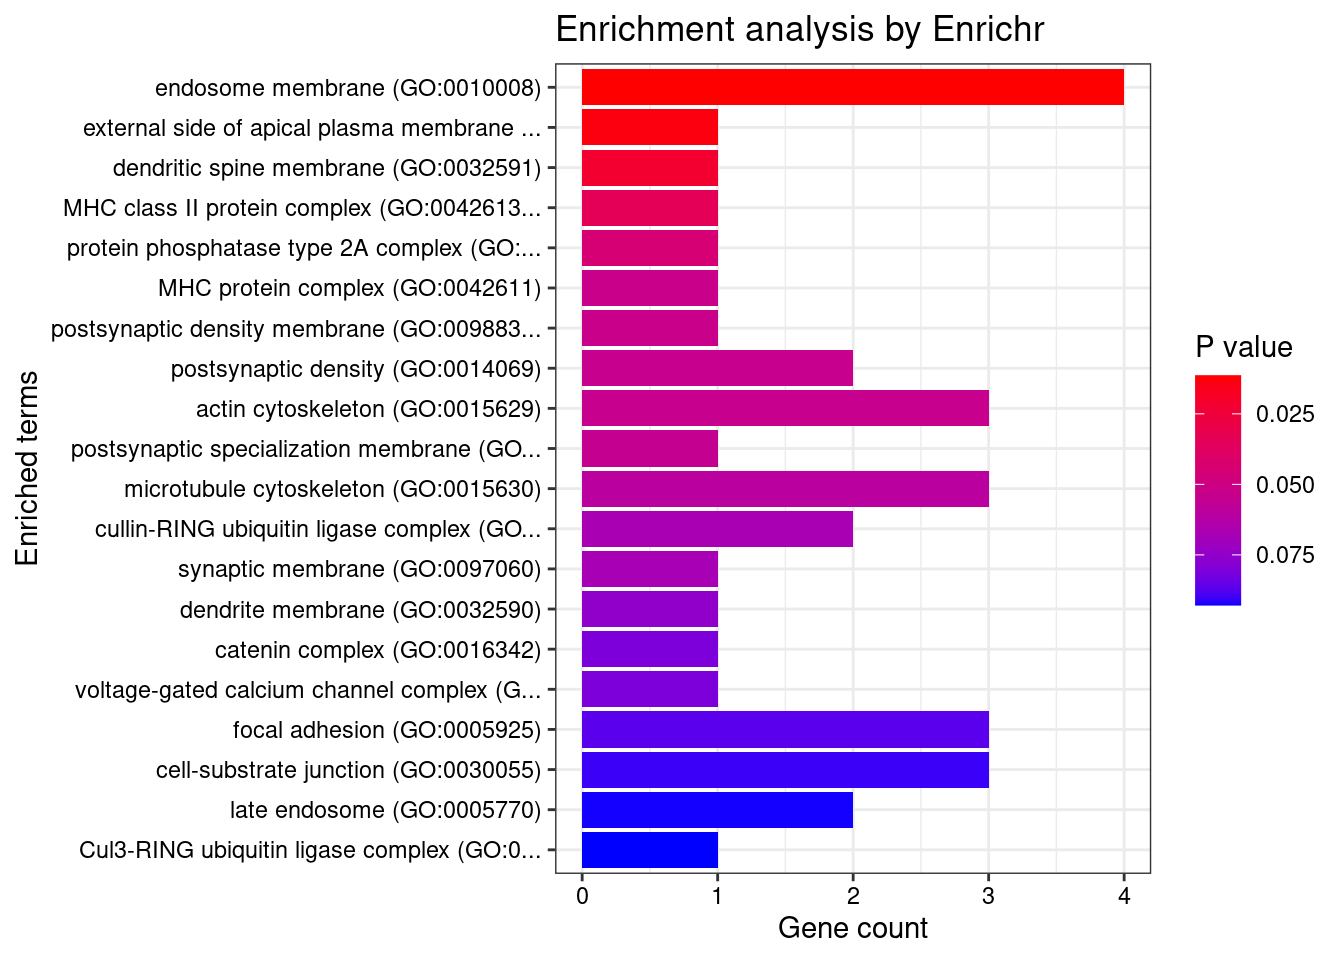
[1] Term             Overlap          Adjusted.P.value Genes
<0 rows> (or 0-length row.names)
[1] "GO_Molecular_Function_2021"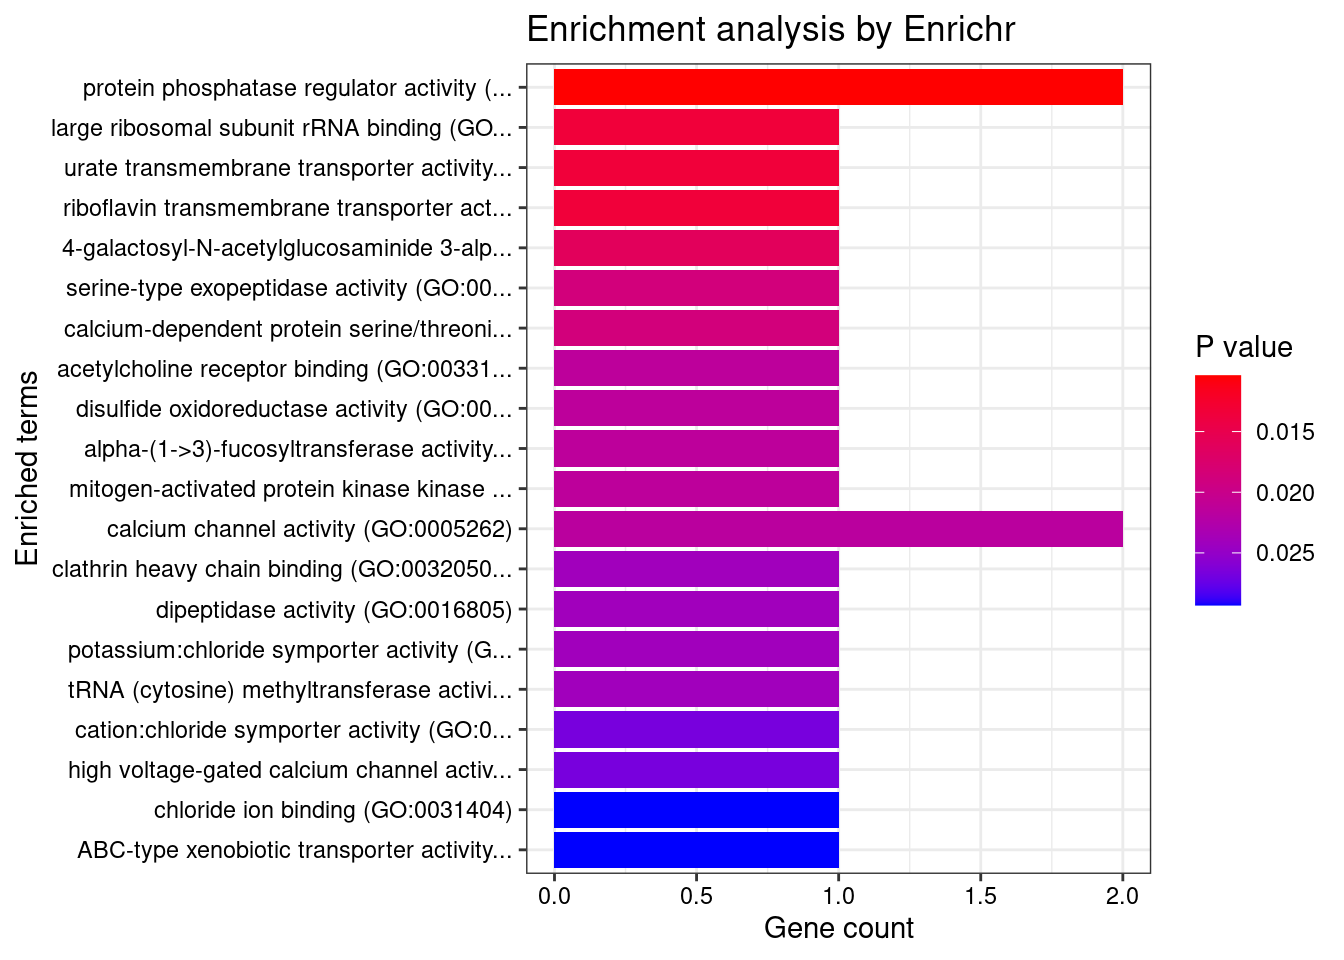
[1] Term             Overlap          Adjusted.P.value Genes
<0 rows> (or 0-length row.names)
DisGeNET enrichment analysis for genes with PIP>0.5
                                      Description     FDR Ratio BgRatio
25                                      Confusion 0.01728  1/18  1/9703
50                           Gingival Hypertrophy 0.01728  1/18  1/9703
64                    Infant, Premature, Diseases 0.01728  1/18  1/9703
74             Chronic Obstructive Airway Disease 0.01728  2/18 33/9703
94                               Pneumonia, Viral 0.01728  1/18  1/9703
123                  Left Ventricular Hypertrophy 0.01728  2/18 25/9703
143                             Speech impairment 0.01728  1/18  1/9703
144                                 Derealization 0.01728  1/18  1/9703
155 Spondylometaphyseal dysplasia, Kozlowski type 0.01728  1/18  1/9703
156                           Metatropic dwarfism 0.01728  1/18  1/9703
WebGestalt enrichment analysis for genes with PIP>0.5
Loading the functional categories...
Loading the ID list...
Loading the reference list...
Performing the enrichment analysis...
Warning in oraEnrichment(interestGeneList, referenceGeneList, geneSet, minNum =
minNum, : No significant gene set is identified based on FDR 0.05!NULLPIP Manhattan Plot
Warning: 'timedatectl' indicates the non-existent timezone name 'n/a'Warning: Your system is mis-configured: '/etc/localtime' is not a symlinkWarning: It is strongly recommended to set envionment variable TZ to 'America/
Chicago' (or equivalent)Warning: ggrepel: 3 unlabeled data points (too many overlaps). Consider
increasing max.overlaps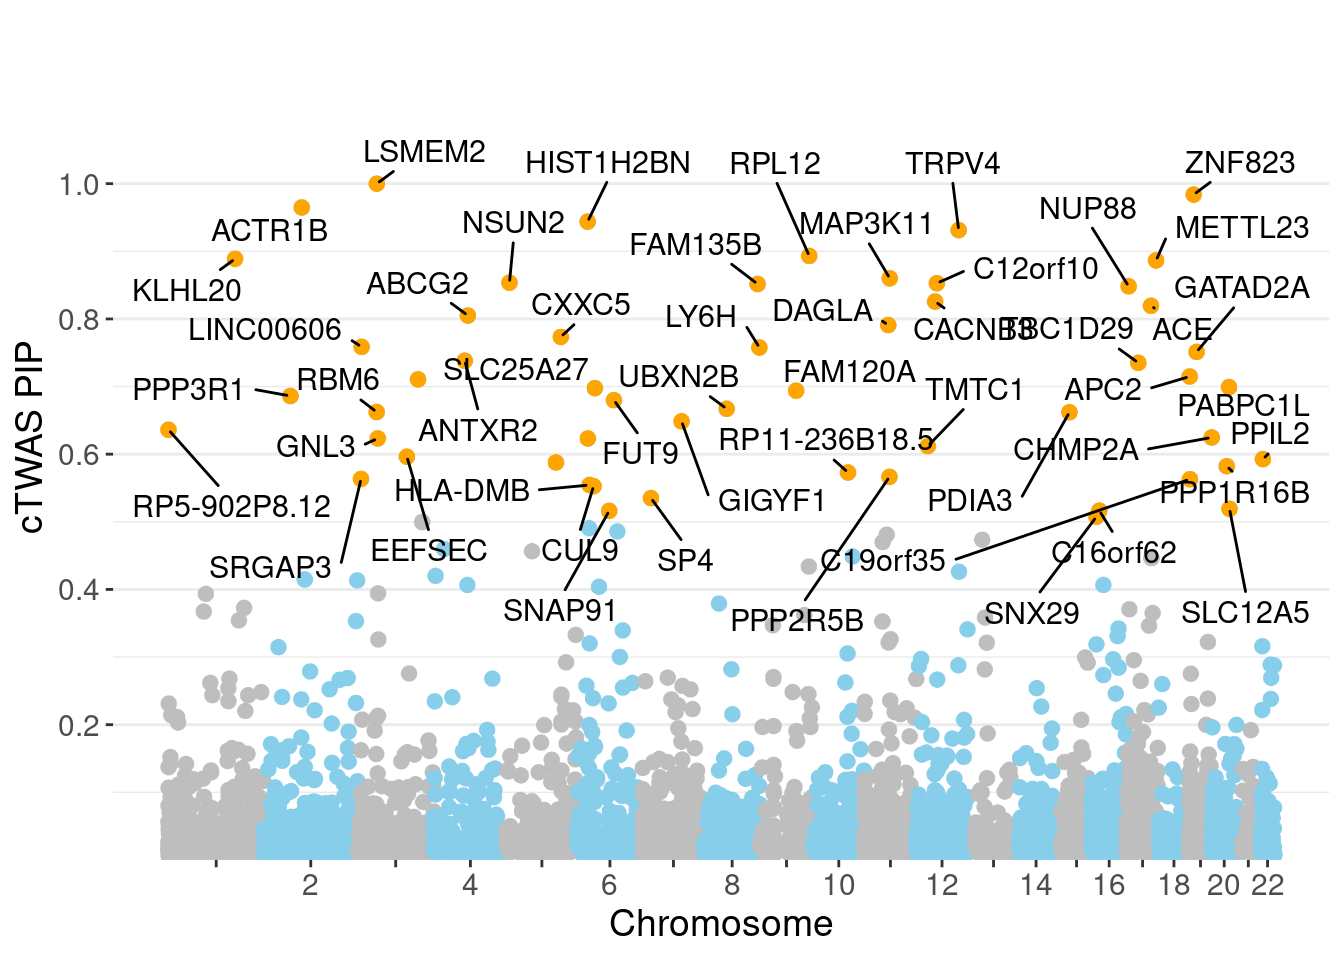
Sensitivity, specificity and precision for silver standard genes
#number of genes in known annotations
print(length(known_annotations))
[1] 130#number of genes in known annotations with imputed expression
print(sum(known_annotations %in% ctwas_gene_res$genename))[1] 62#significance threshold for TWAS
print(sig_thresh)[1] 4.584#number of ctwas genes
length(ctwas_genes)[1] 16#number of TWAS genes
length(twas_genes)[1] 160#show novel genes (ctwas genes with not in TWAS genes)
ctwas_gene_res[ctwas_gene_res$genename %in% novel_genes,report_cols] genename region_tag susie_pip mu2 PVE z num_eqtl
9365 LSMEM2 3_35 0.9999 1155.66 0.0071596 4.271 1
3272 ABCG2 4_59 0.8050 21.38 0.0001066 -3.954 1
357 NSUN2 5_6 0.8535 22.20 0.0001174 -4.105 3
5977 FAM135B 8_91 0.8516 23.00 0.0001213 -3.461 1
7971 CACNB3 12_32 0.8257 23.40 0.0001197 -3.941 2
2583 TRPV4 12_66 0.9313 26.68 0.0001539 4.456 2
9488 METTL23 17_43 0.8866 23.19 0.0001274 4.235 1#sensitivity / recall
print(sensitivity) ctwas TWAS
0.02308 0.20000 #specificity
print(specificity) ctwas TWAS
0.9988 0.9877 #precision / PPV
print(precision) ctwas TWAS
0.1875 0.1625 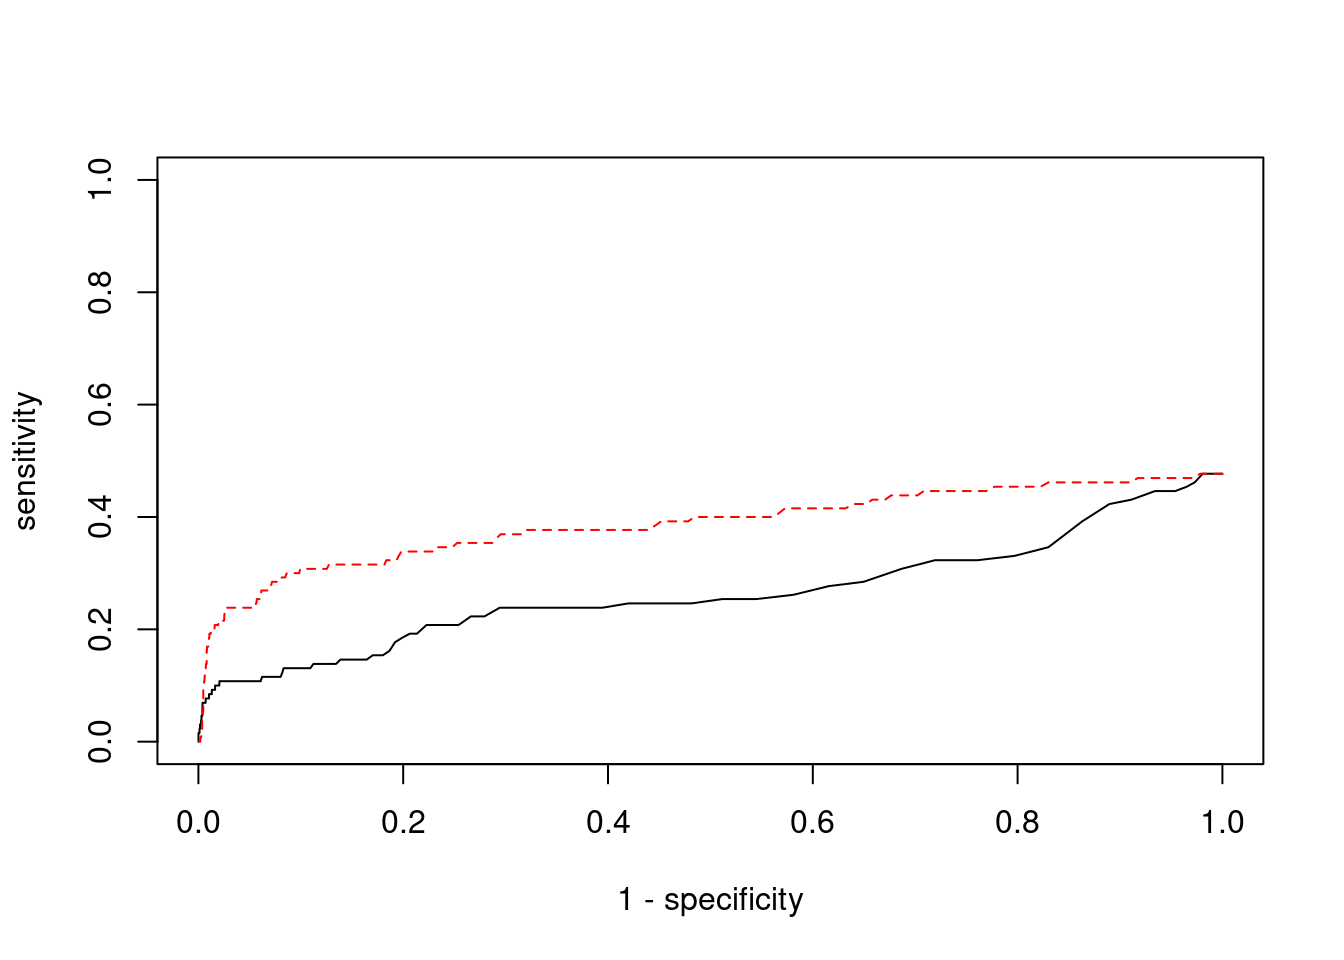
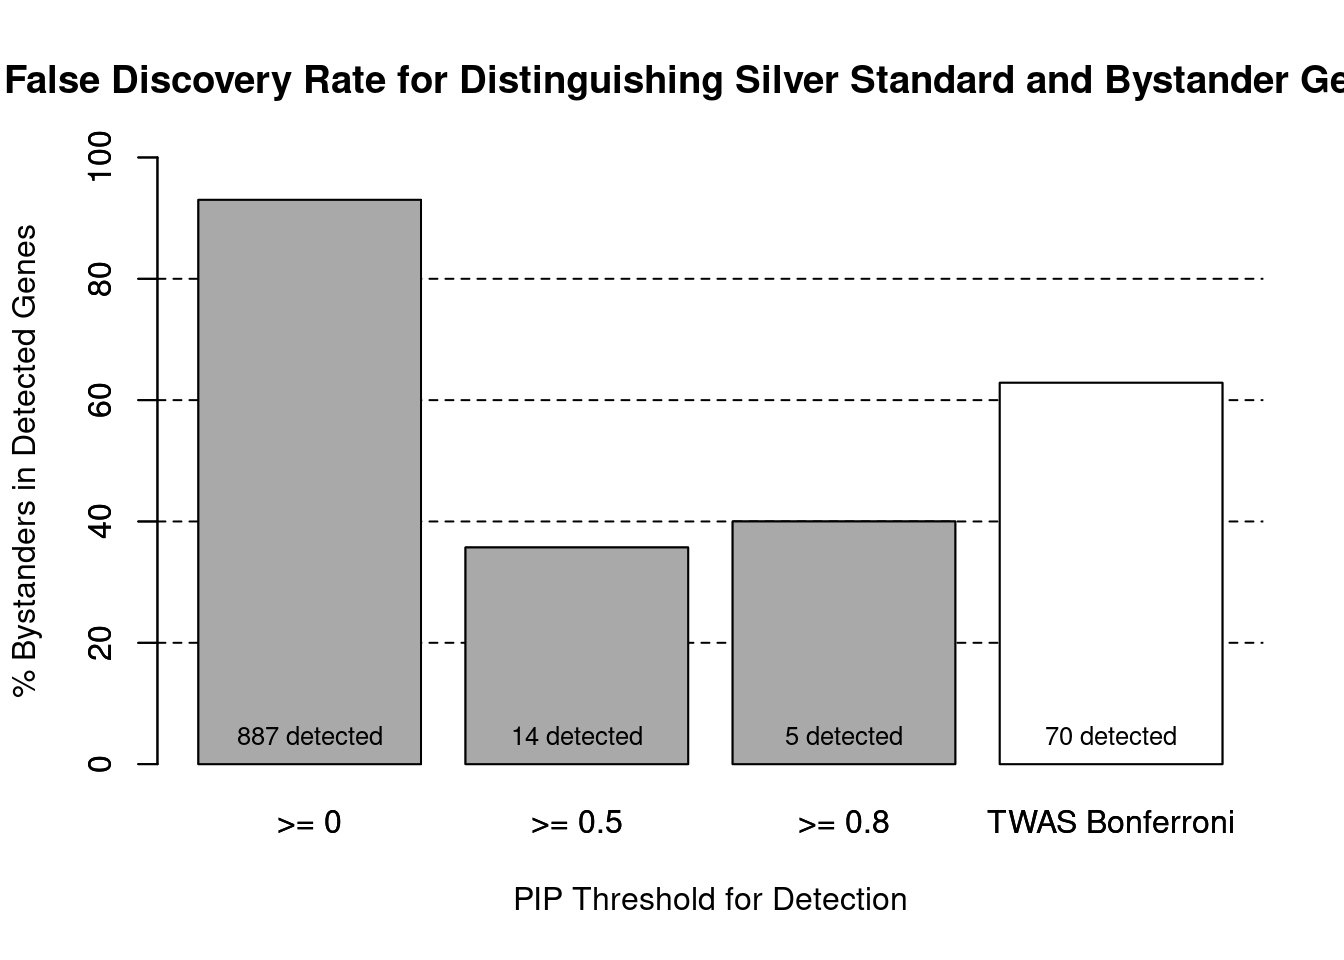
cTWAS is more precise than TWAS in distinguishing silver standard and bystander genes
#number of genes in known annotations (with imputed expression)
print(length(known_annotations))[1] 62#number of bystander genes (with imputed expression)
print(length(unrelated_genes))[1] 824#subset results to genes in known annotations or bystanders
ctwas_gene_res_subset <- ctwas_gene_res[ctwas_gene_res$genename %in% c(known_annotations, unrelated_genes),]
#assign ctwas and TWAS genes
ctwas_genes <- ctwas_gene_res_subset$genename[ctwas_gene_res_subset$susie_pip>0.8]
twas_genes <- ctwas_gene_res_subset$genename[abs(ctwas_gene_res_subset$z)>sig_thresh]
#significance threshold for TWAS
print(sig_thresh)
[1] 4.584#number of ctwas genes (in known annotations or bystanders)
length(ctwas_genes)[1] 5#number of TWAS genes (in known annotations or bystanders)
length(twas_genes)[1] 70#sensitivity / recall
sensitivity ctwas TWAS
0.04839 0.41935 #specificity / (1 - False Positive Rate)
specificity ctwas TWAS
0.9976 0.9466 #precision / PPV / (1 - False Discovery Rate)
precision ctwas TWAS
0.6000 0.3714 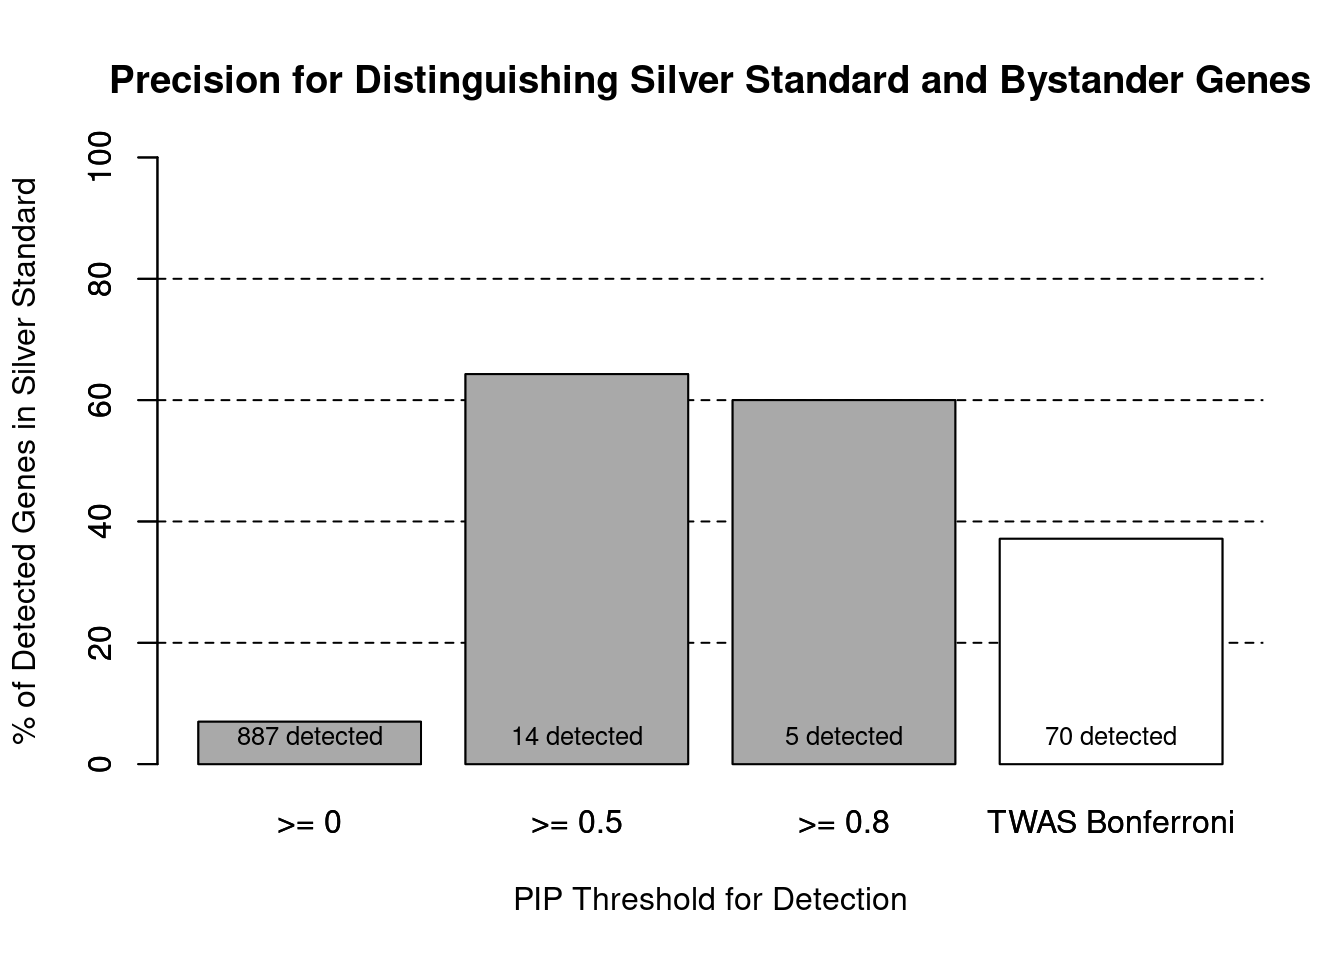
pip_range <- (0:1000)/1000
sensitivity <- rep(NA, length(pip_range))
specificity <- rep(NA, length(pip_range))

for (index in 1:length(pip_range)){
  pip <- pip_range[index]
  ctwas_genes <- ctwas_gene_res_subset$genename[ctwas_gene_res_subset$susie_pip>=pip]
  sensitivity[index] <- sum(ctwas_genes %in% known_annotations)/length(known_annotations)
  specificity[index] <- sum(!(unrelated_genes %in% ctwas_genes))/length(unrelated_genes)
}

plot(1-specificity, sensitivity, type="l", xlim=c(0,1), ylim=c(0,1), main="", xlab="1 - Specificity", ylab="Sensitivity")
title(expression("ROC Curve for cTWAS (black) and TWAS (" * phantom("red") * ")"))
title(expression(phantom("ROC Curve for cTWAS (black) and TWAS (") * "red" * phantom(")")), col.main="red")

sig_thresh_range <- seq(from=0, to=max(abs(ctwas_gene_res_subset$z)), length.out=length(pip_range))

for (index in 1:length(sig_thresh_range)){
  sig_thresh_plot <- sig_thresh_range[index]
  twas_genes <- ctwas_gene_res_subset$genename[abs(ctwas_gene_res_subset$z)>=sig_thresh_plot]
  sensitivity[index] <- sum(twas_genes %in% known_annotations)/length(known_annotations)
  specificity[index] <- sum(!(unrelated_genes %in% twas_genes))/length(unrelated_genes)
}

lines(1-specificity, sensitivity, xlim=c(0,1), ylim=c(0,1), col="red", lty=1)

abline(a=0,b=1,lty=3)

#add previously computed points from the analysis
ctwas_genes <- ctwas_gene_res_subset$genename[ctwas_gene_res_subset$susie_pip>0.8]
twas_genes <- ctwas_gene_res_subset$genename[abs(ctwas_gene_res_subset$z)>sig_thresh]

points(1-specificity_plot["ctwas"], sensitivity_plot["ctwas"], pch=21, bg="black")
points(1-specificity_plot["TWAS"], sensitivity_plot["TWAS"], pch=21, bg="red")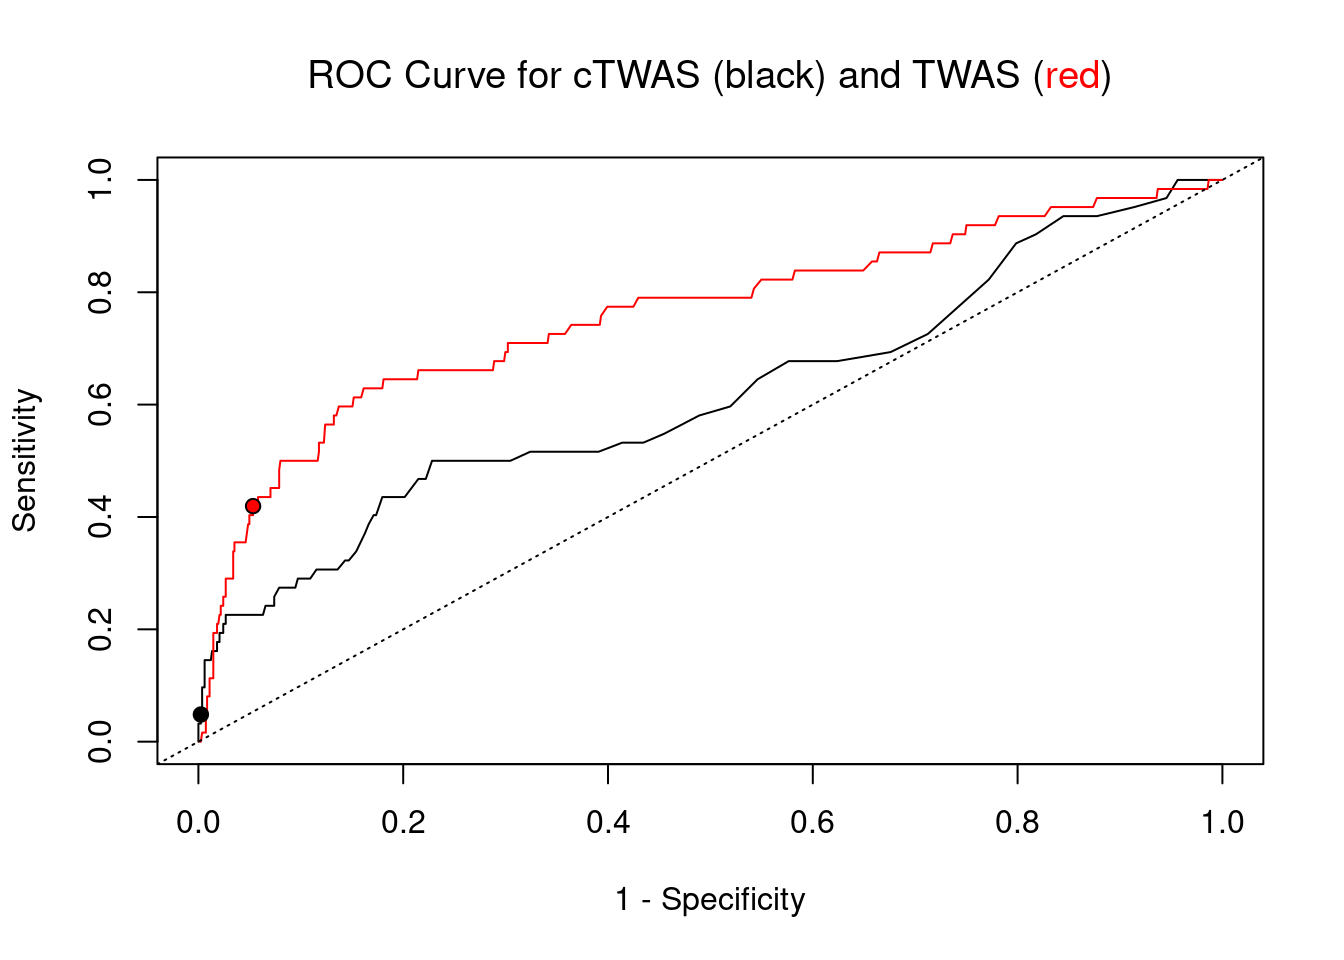
Undetected silver standard genes have low TWAS z-scores or stronger signal from nearby variants
#table of outcomes for silver standard genes
-sort(-table(silver_standard_case))
silver_standard_case
Not Imputed Insignificant z-score Nearby SNP(s)
68 36 22
Detected (PIP > 0.8) Nearby Bystander Gene
3 1 #show inconclusive genes
silver_standard_case[silver_standard_case=="Inconclusive"]named character(0)
sessionInfo()R version 3.6.1 (2019-07-05)
Platform: x86_64-pc-linux-gnu (64-bit)
Running under: Scientific Linux 7.4 (Nitrogen)
Matrix products: default
BLAS/LAPACK: /software/openblas-0.2.19-el7-x86_64/lib/libopenblas_haswellp-r0.2.19.so
locale:
[1] LC_CTYPE=en_US.UTF-8 LC_NUMERIC=C
[3] LC_TIME=en_US.UTF-8 LC_COLLATE=en_US.UTF-8
[5] LC_MONETARY=en_US.UTF-8 LC_MESSAGES=en_US.UTF-8
[7] LC_PAPER=en_US.UTF-8 LC_NAME=C
[9] LC_ADDRESS=C LC_TELEPHONE=C
[11] LC_MEASUREMENT=en_US.UTF-8 LC_IDENTIFICATION=C
attached base packages:
[1] parallel stats4 stats graphics grDevices utils datasets
[8] methods base
other attached packages:
[1] GenomicRanges_1.36.1 GenomeInfoDb_1.20.0 IRanges_2.18.1
[4] S4Vectors_0.22.1 BiocGenerics_0.30.0 biomaRt_2.40.1
[7] readxl_1.3.1 forcats_0.5.1 stringr_1.4.0
[10] dplyr_1.0.7 purrr_0.3.4 readr_2.1.1
[13] tidyr_1.1.4 tidyverse_1.3.1 tibble_3.1.6
[16] WebGestaltR_0.4.4 disgenet2r_0.99.2 enrichR_3.0
[19] cowplot_1.1.1 ggplot2_3.3.5 workflowr_1.7.0
loaded via a namespace (and not attached):
[1] ggbeeswarm_0.6.0 colorspace_2.0-2 rjson_0.2.20
[4] ellipsis_0.3.2 rprojroot_2.0.2 XVector_0.24.0
[7] fs_1.5.2 rstudioapi_0.13 farver_2.1.0
[10] ggrepel_0.9.1 bit64_4.0.5 AnnotationDbi_1.46.0
[13] fansi_1.0.2 lubridate_1.8.0 xml2_1.3.3
[16] codetools_0.2-16 doParallel_1.0.17 cachem_1.0.6
[19] knitr_1.36 jsonlite_1.7.2 apcluster_1.4.8
[22] Cairo_1.5-12.2 broom_0.7.10 dbplyr_2.1.1
[25] compiler_3.6.1 httr_1.4.2 backports_1.4.1
[28] assertthat_0.2.1 Matrix_1.2-18 fastmap_1.1.0
[31] cli_3.1.0 later_0.8.0 prettyunits_1.1.1
[34] htmltools_0.5.2 tools_3.6.1 igraph_1.2.10
[37] GenomeInfoDbData_1.2.1 gtable_0.3.0 glue_1.6.2
[40] reshape2_1.4.4 doRNG_1.8.2 Rcpp_1.0.8
[43] Biobase_2.44.0 cellranger_1.1.0 jquerylib_0.1.4
[46] vctrs_0.3.8 svglite_1.2.2 iterators_1.0.14
[49] xfun_0.29 ps_1.6.0 rvest_1.0.2
[52] lifecycle_1.0.1 rngtools_1.5.2 XML_3.99-0.3
[55] zlibbioc_1.30.0 getPass_0.2-2 scales_1.1.1
[58] vroom_1.5.7 hms_1.1.1 promises_1.0.1
[61] yaml_2.2.1 curl_4.3.2 memoise_2.0.1
[64] ggrastr_1.0.1 gdtools_0.1.9 stringi_1.7.6
[67] RSQLite_2.2.8 highr_0.9 foreach_1.5.2
[70] rlang_1.0.1 pkgconfig_2.0.3 bitops_1.0-7
[73] evaluate_0.14 lattice_0.20-38 labeling_0.4.2
[76] bit_4.0.4 processx_3.5.2 tidyselect_1.1.1
[79] plyr_1.8.6 magrittr_2.0.2 R6_2.5.1
[82] generics_0.1.1 DBI_1.1.2 pillar_1.6.4
[85] haven_2.4.3 whisker_0.3-2 withr_2.4.3
[88] RCurl_1.98-1.5 modelr_0.1.8 crayon_1.5.0
[91] utf8_1.2.2 tzdb_0.2.0 rmarkdown_2.11
[94] progress_1.2.2 grid_3.6.1 data.table_1.14.2
[97] blob_1.2.2 callr_3.7.0 git2r_0.26.1
[100] reprex_2.0.1 digest_0.6.29 httpuv_1.5.1
[103] munsell_0.5.0 beeswarm_0.2.3 vipor_0.4.5